
 Submit a Paper
 Propose a Special lssue
 Open Access
ARTICLE
Unweighted Voting Method to Detect Sinkhole Attack in RPL-Based Internet of Things Networks
1 National Advanced IPv6 Centre (NAv6), University Sains Malaysia, Gelugor, Penang, 11800, Malaysia
2 Applied College, Najran University, King Abdulaziz Street, P.O. Box 1988, Najran, Saudi Arabia
3 Cybersecurity Department, School of Information Technology, American University of Madaba (AUM), Amman, 11821, Jordan
* Corresponding Author: Mohammed Anbar. Email:
Computers, Materials & Continua 2023, 77(1), 491-515. https://doi.org/10.32604/cmc.2023.041108
Received 11 April 2023; Accepted 09 August 2023; Issue published 31 October 2023
 View Full Text
 Download PDF
Abstract
The Internet of Things (IoT) consists of interconnected smart devices communicating and collecting data. The Routing Protocol for Low-Power and Lossy Networks (RPL) is the standard protocol for Internet Protocol Version 6 (IPv6) in the IoT. However, RPL is vulnerable to various attacks, including the sinkhole attack, which disrupts the network by manipulating routing information. This paper proposes the Unweighted Voting Method (UVM) for sinkhole node identification, utilizing three key behavioral indicators: DODAG Information Object (DIO) Transaction Frequency, Rank Harmony, and Power Consumption. These indicators have been carefully selected based on their contribution to sinkhole attack detection and other relevant features used in previous research. The UVM method employs an unweighted voting mechanism, where each voter or rule holds equal weight in detecting the presence of a sinkhole attack based on the proposed indicators. The effectiveness of the UVM method is evaluated using the COOJA simulator and compared with existing approaches. Notably, the proposed approach fulfills power consumption requirements for constrained nodes without increasing consumption due to the deployment design. In terms of detection accuracy, simulation results demonstrate a high detection rate ranging from 90% to 100%, with a low false-positive rate of 0% to 0.2%. Consequently, the proposed approach surpasses Ensemble Learning Intrusion Detection Systems by leveraging three indicators and three supporting rules.Keywords
The sinkhole attack poses a significant threat to Wireless Sensor Networks (WSNs). It manipulates routing information, drops packets, alters data, and selectively transfers data, resulting in energy depletion in neighboring nodes and causing a network energy gap [1–3]. Consequently, numerous researchers have proposed various detection approaches for sinkhole attacks in RPL-based networks.
The Internet Engineering Task Force (IETF) has standardized the RPL protocol in documents RFC4919 and RFC6550 [4,5]. These documents focus on IP for Low-Power and Lossy Networks (LLNs) by utilizing IPv6 over 6LoWPAN, which has become the standard for IPv6 in IEEE 802.15.4 networks. RPL has emerged as the standard routing protocol for establishing IPv6 connectivity in these networks, including those in the IoT domain.
In RPL, the objective function of the protocol selects the optimal route for data transmission. Each node is assigned an ID based on its rank and IPv6 address. To exchange graph-related information, nodes utilize three RPL-specific Internet Control Message Protocol version 6 (ICMPv6) messages: DIS (DODAG Information Solicitation), DAO (DODAG Destination Advertisement Object), and DIO, as shown in Fig. 1 [6].
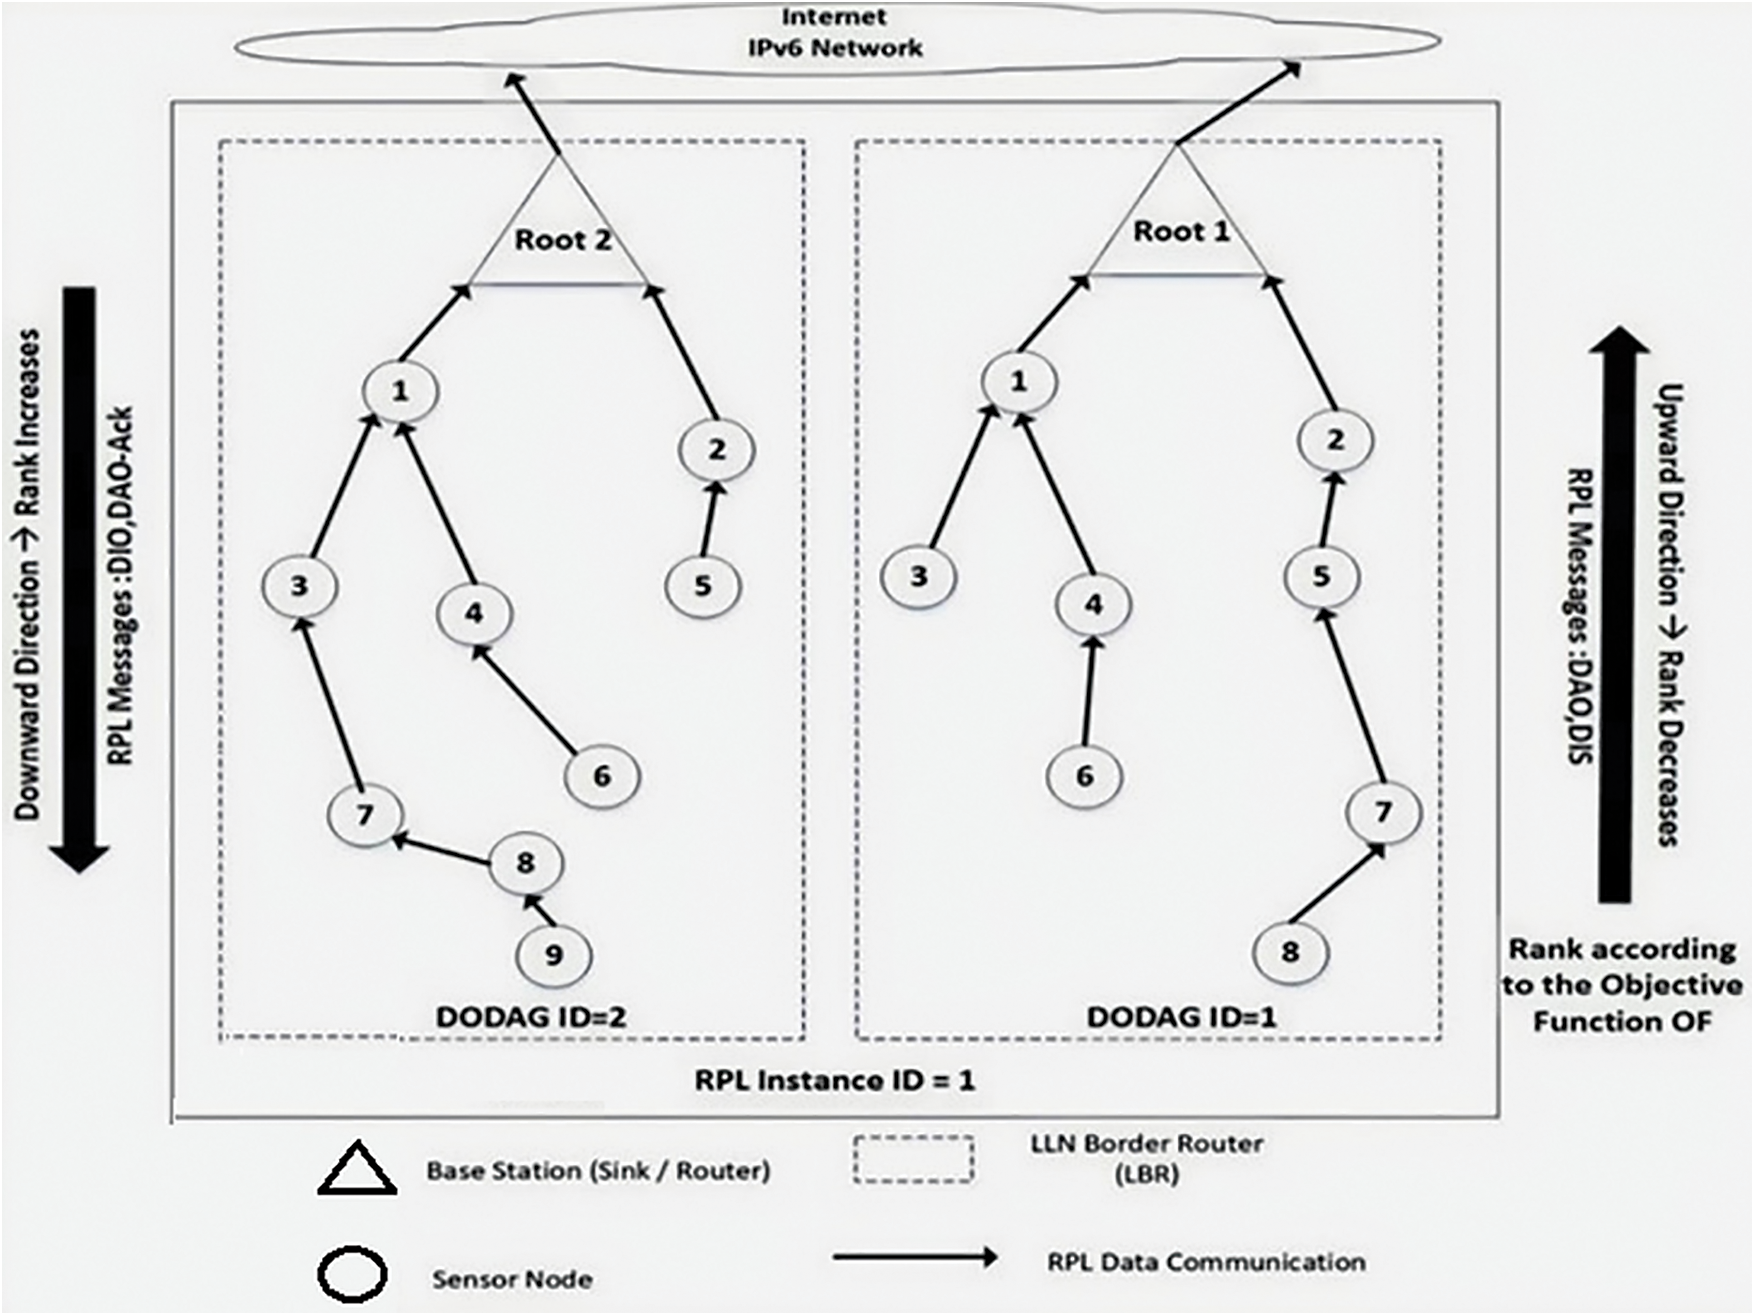
Figure 1: RPL topology
In network security, intrusion detection systems have been the subject of extensive research. Recently, researchers have also focused on detecting sinkhole attacks in IoT networks, categorized into two main approaches: Signature-Based and Anomaly-Based. Among these, Anomaly-Based approaches have demonstrated higher efficiency in detecting attacks than Signature-Based approaches. An Anomaly-Based approach establishes a baseline of normal network behavior and detects anomalies when deviations from this baseline occur, triggering alerts when traffic behavior surpasses a predefined threshold. Any behavior that deviates from the normal pattern is considered an intrusion [7].
However, existing approaches for detecting sinkhole attacks often overlook the significant behavioral characteristics contributing to accurate detection. Additionally, many of these approaches consume excessive energy due to their deployment design. Consequently, there is a need for a solution that combines low power consumption with high accuracy for detecting sinkhole attacks.
This research paper makes two contributions to the existing body of knowledge. Firstly, a behavior set that indicates a sinkhole attack in an RPL-based network. These indicators include (I) DIO Transaction Frequency, (II) Rank Harmony Behavioral, and (III) Power Consumption Behavior. Secondly, an unweighted voting method utilizes information from these abnormal behaviors to determine the presence of a sinkhole attack.
The organization of this research paper is as follows: Section 2 provides an overview of IoT, IPv6, RPL, and sinkhole attacks. Section 3 discusses related works in the field. In Section 4, we outline the proposed approach. The results of our experiments are presented and discussed in Section 5. Finally, we conclude the paper by exploring several avenues for future research in the last section.
This section aims to provide a comprehensive overview of the IoT, the IPv6 protocol, and the RPL. Furthermore, it highlights the significance of sinkhole attacks in the context of these technologies.
IoT technologies and their applications have gained worldwide attention in many fields, such as science, commerce, industry, healthcare, transportation, and crowd management, such as in [8], which have become necessary for daily life across all segments of society.
The rise of IoT and its applications in sensing led to a significant increase in multimedia data shared over insecure networks. However, IoT setups face resource constraints due to their small size, making conventional data encryption algorithms unsuitable. Therefore, it needs a lightweight cryptographic algorithm for IoT, such as the algorithm proposed in [9].
According to Kaspersky Lab’s IoT report, there were over 120,000 malware attacks targeting IoT devices in the first six months of 2018, three times the number of attacks in 2017. Additionally, there was a ten-fold increase in smart device malware in 2017 compared to 2016 [10,11]. IBM reported that between October 2019 and June 2020, the combined number of IoT attacks was 400% higher than in the previous two years, as shown in Fig. 2 [12].

Figure 2: IoT attack volume between 2018 and 2020
There are several limitations associated with IoT, including limited processing capability, storage capacity, power life, and radio communication range. As a result, the implementation of IoT leverages the existing IP infrastructure to optimize resource utilization and take advantage of the extensive address space provided by IPv6 [13,14]. A promising approach for integrating low-power networks is through IPv6 over Low Power Wireless Personal Area Networks (6LoWPAN). This approach adds an adaptation layer to the network protocol stack. The 6LoWPAN protocol stack is designed to integrate wireless sensor networks based on 802.15.4 with IPv6 networks. It comprises a PHY layer, MAC layer, 6LoWPAN adaptation layer, network layer, transport layer, and application layer with specific 6LoWPAN applications, as shown in Fig. 3 [15]. By employing 6LoWPAN with constrained devices and utilizing the existing IP architecture and infrastructure, it helps maximize resource utilization and leverage the vast IPv6 address space [16,17].

Figure 3: 6LoWPAN protocol stack
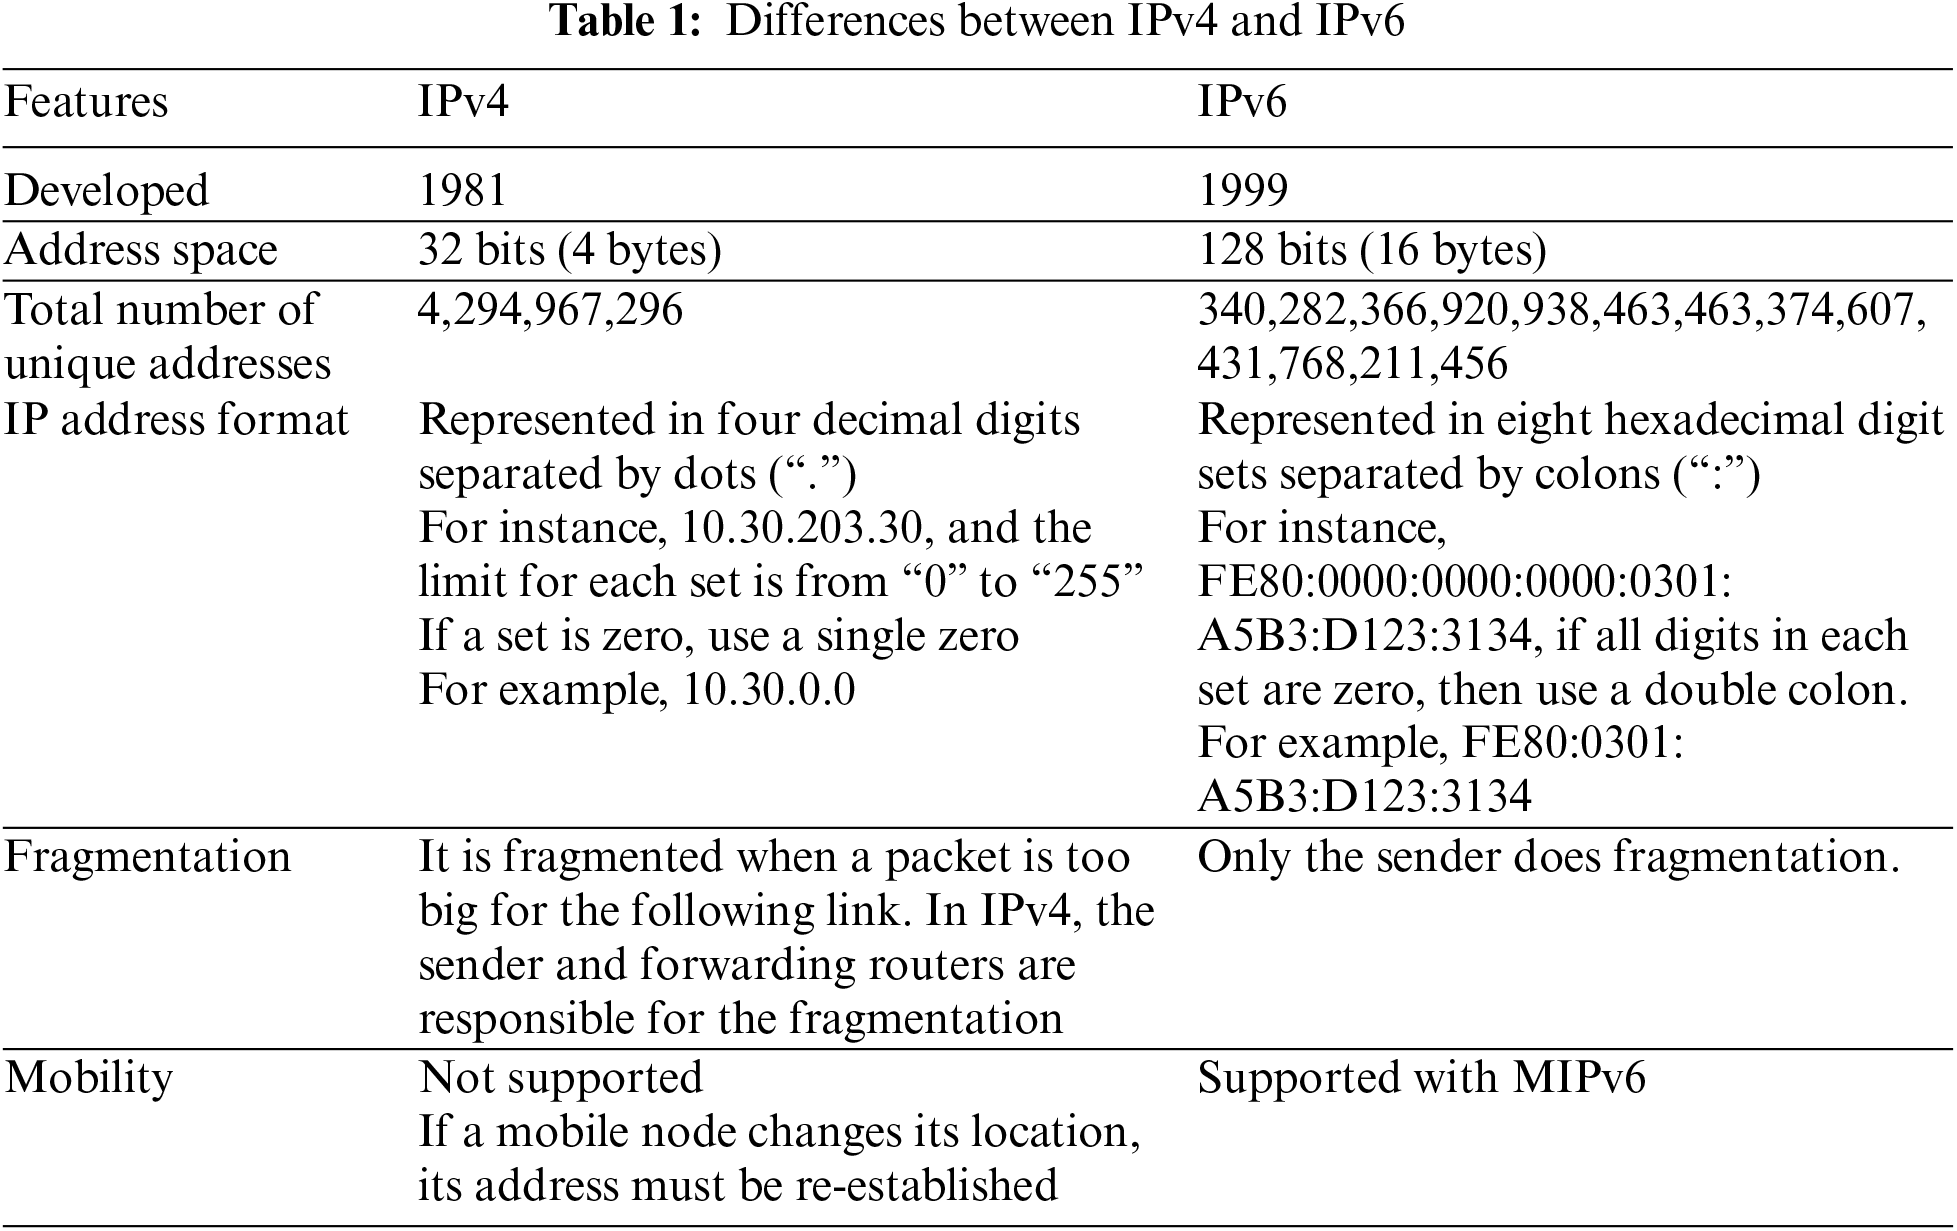
IPv6 is the successor to Internet Protocol Address Version 4 (IPv4) and is designed to replace it to support the growing number of network devices worldwide. Table 1 summarizes the six key differences between IPv6 and IPv4 [18].
RPL is a widely used routing protocol in Wireless Sensor Networks (WSNs) and finds applications in various domains such as smart grids, industrial networks, and home networks. The RPL protocol operates by initiating messages from a root or sink node, known as DIO messages, to construct a Directed Acyclic Graph (DAG) known as a DODAG. The DODAG tree consists of a single root node, and each node receiving a DIO message determines its parent based on the parent’s rank value and other parameters. The rank value is calculated considering factors such as the distance from the root node and the energy of the link. The network owner can determine the specific parameters used for rank value calculation. Nodes in the network continue to broadcast DIO messages, maintaining and updating the Routing Tree [19].
A sinkhole attack is considered one of the most devastating routing attacks due to its ability to deceive neighboring nodes by providing false routing information and selectively manipulating or blocking data transmission. This type of attack can deplete the energy resources of surrounding nodes, creating energy gaps within Wireless Sensor Networks (WSNs) [3]. Among various routing attacks, the sinkhole attack falls under the Denial of Service (DoS) category and poses a severe threat to IoT environments [20]. Its destructive impact is further amplified when combined with other attacks, potentially causing significant damage. If left undetected, the sinkhole attack can result in information loss and prevent packets from reaching the base station, effectively disconnecting nodes from the internet. Additionally, this type of attack introduces additional network overhead and accelerates energy consumption, ultimately leading to the deterioration of the network’s lifespan [21].
An anomaly-based approach is employed to detect sinkhole attacks by establishing a baseline of normal network behavior and identifying anomalies that deviate from this baseline. When the traffic behavior exceeds a predefined threshold, an alert is generated, considering any deviations from the normal behavior as potential intrusions. However, this method often causes false positives [22–26].
Tumrongwittayapak et al. proposed a sinkhole attack detection method based on Received Signal Strength Indicator (RSSI) values, incorporating an Extra Monitor (EM) component. During network deployment, EM monitors the RSSI values of all nodes and transmits relevant information to the base station. The EM calculates RSSI values and forwards them to the base station along with the source ID and next hop. The base station utilizes these RSSI values to calculate the Visual Geographical Map (VGM), which displays the positions of each node. EM continuously updates the RSSI values for the base station [27]. Any changes in packet flow exceeding a predefined threshold indicate the presence of a sinkhole attack. However, this approach is limited because it cannot detect sinkhole attacks if launched immediately after network deployment and before the RSSI values are calculated [28].
Cervantes et al. proposed an Intrusion Detection System (IDS) approach called Intrusion detection of Sinkhole attack on 6LoWPAN for IoT (INTI) to detect sinkhole attacks on the routing services of 6LoWPAN IoT networks. The INTI approach consists of four modules: the Cluster Configuration module, responsible for classifying nodes as members, leaders, and associates based on their network functions; the Monitoring module, which tracks the number of transmissions; the Attacker Detection module, responsible for identifying the sinkhole attacking node; and the Isolation of the Attacker module, which isolates malicious nodes from the cluster and alerts neighboring nodes. The network nodes are categorized as Leader (L), Member (M), Free (F), Associated (A), or Base (B) stations, with each node possessing unique IP addresses. Nodes form virtual clusters that can be repositioned and communicated wirelessly. L nodes receive information from M and A nodes and transmit it to the B station, while A nodes facilitate inter-cluster data transmission. The results demonstrate that INTI achieves a sinkhole detection rate of up to 92% in a fixed scenario and 75% in a mobile scenario. The INTI method has been evaluated and compared to SVELTE for detecting sinkhole attacks. The evaluation results demonstrate that INTI exhibits lower false-positive and false-negative rates than SVELTE. It offers advantages such as high detection accuracy and low false positives and negatives rates. However, it requires substantial computational resources, which can reduce the lifetime of the IoT ecosystem. Furthermore, INTI can only detect sinkhole attacks [24,25,29].
Grgic et al. stated that each IDS module, deployed on every node, listens to the traffic of its neighboring nodes and collects data that represents input parameters for the collective decision-making process. The maximum number of packet drops is defined as a threshold. A node is considered suspicious if the number of dropped packets exceeds this threshold. The researchers evaluated their method using a COOJA simulator on three networks with six, ten, and seventeen nodes, respectively. To assess the impact of the IDS on network performance, tests were conducted both with and without the IDS. The main advantage of this system is its high detection accuracy. However, it faces a challenge in distinguishing between malicious and misbehaving nodes [30].
Alzubaidi et al. proposed a lightweight technique called the Neighbor Passive Monitoring Technique (NPMT) for detecting sinkhole attacks in RPL-based IoT networks. Their IDS employs a Passive Intermediate Node (PN) to listen to and analyze the broadcasts of nodes. Neighboring nodes with similar ranks do not raise suspicion, while those with different ranks are flagged as suspicious nodes. The proposed technique outperforms the existing SVELTE in terms of performance. COOJA simulation results demonstrate that the NPMT achieved a 99.5% Accuracy Rate with a false-positive rate of 0.53%. However, a drawback of this technique is the overhead caused by passive intermediate nodes and passive edge nodes [31].
Verma et al. proposed a signature-based detection system called Ensemble Learning Intrusion Detection System (ELNIDS), which utilizes machine learning (ML) mechanisms. The system incorporates four ensemble-based ML classifiers: Bagged Trees, RUSBoosted Trees, Boosted Trees, and Subspace Discriminant for sinkhole attack detection. ELNIDS comprises six modules: the sniffer model, sensor events and traffic repository, feature extraction module, analysis engine, rule base database, and attack notification manager. The sniffer module listens, monitors, and records traffic data in the database, while the feature extraction module characterizes network traffic to assist the analyzer in classification using ensemble models. The evaluation of ELNIDS was conducted using the RPL-NIDDS17 dataset, which contains traffic traces of various attack types, including Blackhole, Sinkhole, Sybil, Selective Forwarding, Clone ID, Hello Flooding, and Local Repair attacks. These attacks are explained in [32,33]. The results demonstrate the effectiveness of ELNIDS, with the ensemble of Boosted Trees achieving the highest detection accuracy (94.5%), while the Subspace Discriminant method achieved the lowest detection accuracy (77.8%) [34].
In summary, the existing mechanisms for detecting sinkhole attacks suffer several issues. Firstly, they exhibit high overheads in terms of network and memory consumption. Secondly, they have a significant false-positive rate, incorrectly flagging normal network activity as sinkhole attacks. Thirdly, there is a lack of sufficient research on the behavioral characteristics of sinkhole attacks, resulting in low detection accuracy. Additionally, many mechanisms have overlapping features and struggle to select the most crucial features for detecting sinkhole attacks. This problem undermines detection accuracy and contributes to a high false-positive rate. Lastly, the deployment design leads to challenges such as high overhead and energy consumption.
To summarize, the problems with existing mechanisms for detecting sinkhole attacks include high overheads, a high false-positive rate, insufficiently studied behavioral characteristics, identification issues, and high overhead and energy consumption in deployment design.
This section explains the proposed UVM approach, which aims to detect sinkhole attacks while maintaining low power consumption and achieving high detection accuracy. Fig. 4 illustrates the general stages of UVM.

Figure 4: General stages of UVM
4.1 Data Collection and Preprocessing (Stage 1)
In this stage, power consumption data and ICMPv6 packets are collected passively from each node to gather helpful information for sinkhole attack detection. This stage describes collecting, capturing, and filtering data to construct a dataset. The data collection and preprocessing stage can be divided into two steps, as shown in Fig. 5.
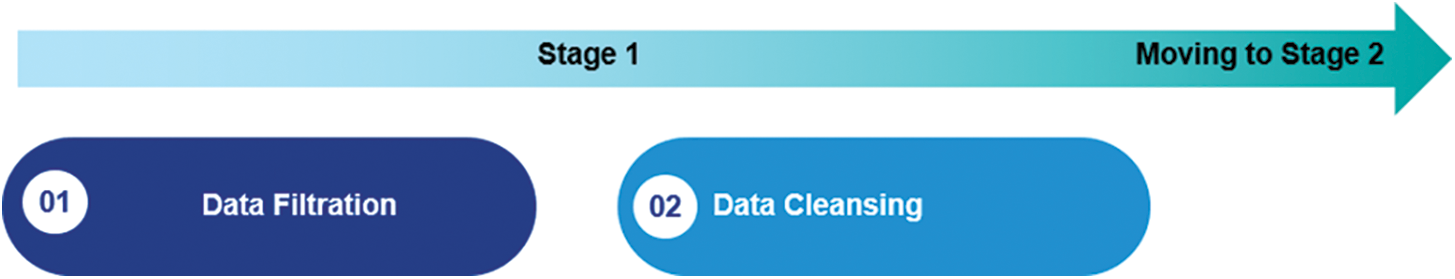
Figure 5: Data collection and preprocessing steps
The primary objective of the Data Filtration step is to refine the power consumption data (such as Central Processing Units (CPU), Low Power Mode (LPM), Transmitted Traffic (TX), and Received Traffic (RX)) and from ICMPv6 packet information (such as Source, Destination, and Rank) by selecting specific features. The “collect view” feature in the COOJA simulator provides detailed information about the energy consumption of each node, while the Wireshark tool offers insights into the network traffic of ICMPv6 transmissions.
The filtered dataset, which includes the relevant features from both the ICMPv6 packet and power consumption data, will proceed to the next stage, Features Selection. In this stage, the most significant features contributing to the detection of sinkhole attacks will be identified. Furthermore, these features will be categorized based on their contributions to sinkhole attack detection.
The Data Cleansing step reduces the traffic volume by addressing issues such as corrupted, incorrectly formatted, duplicate, or incomplete data within the dataset. This process aims to improve the detection accuracy and decrease the search time of the dataset [35]. Once the data cleansing is complete, the resulting dataset containing the relevant features from the ICMPv6 packet and power consumption data will be passed on to the next stage, Features Selection.
4.2 Feature Selection (Stage 2)
The Feature Selection stage plays a crucial role in reducing the size of the feature set by identifying the most significant features that contribute to the detection of sinkhole attacks. Feature selection is achieved using a ranking technique that assigns a weight value to each feature based on its importance.
Several algorithms are available for feature ranking, including ReliefF, Information Gain Ratio (IGR), and Principal Component Analysis (PCA). ReliefF [36] is widely used among these due to its simplicity, operational efficiency, and satisfactory results. It exhibits good convergence and efficiency, making it suitable for feature selection in various scenarios [36].
In the proposed method, the ReliefF algorithm is adapted using the Waikato Environment for Knowledge Analysis (Weka) software [36,37]. This adaptation allows for effective feature selection, and the output of this phase is the final feature list δ, which consists of the essential features that significantly contribute to the detection of sinkhole attacks.
4.3 Behavioral Indicators (Stage 3)
The Behavioral Indicators stage is a crucial component of this approach as it aims to detect suspicious nodes exhibiting abnormal behavior in RPL networks. By analyzing the selected features from the previous stage (Feature Selection), which include ICMPv6 and power consumption data, this stage identifies and flags any abnormal behavior associated with sinkhole attacks in RPL-based networks. Identifying these abnormal behavior indicators requires repeated experiments and continuous monitoring of sinkhole attack behaviors. Our analysis has revealed that these behaviors can effectively distinguish sinkhole nodes from normal nodes. Moreover, selecting an odd number of behaviors aims to achieve majority voting and prevent deadlock situations, wherein an equal number of votes could lead to indecisiveness. The Behavioral Indicators stage consists of three specific indicators:
(I) DIO Transaction Frequency: This indicator analyzes the frequency of DIO (DODAG Information Object) transactions in the network. Deviations from the expected transaction patterns can indicate the presence of a sinkhole attack.
(II) Rank Harmony Behavior: This indicator examines the consistency of rank values among neighboring nodes in the network. In a normal scenario, nodes within a network exhibit a harmonious rank structure. Any significant inconsistencies or disruptions in rank values can suggest the presence of a sinkhole attack.
(III) Power Consumption Behavior: This indicator monitors the power consumption patterns of individual nodes. Sinkhole attacks often involve abnormal energy usage, and this behavior can be captured by analyzing power consumption data.
These behavioral indicators serve as footprints or indicators that help identify the presence of sinkhole attacks in RPL networks. By analyzing and comparing the observed behaviors against expected norms, suspicious nodes exhibiting abnormal behavior can be flagged for further investigation.
4.3.1 DIO Transmission Frequency Behavior
DIO messages are crucial in RPL as they contain metrics necessary for route creation. As the reliability of the route improves, the frequency and quantity of DIO messages decrease [38]. Round Trip Time (RTT) is a control packet that helps determine the distance between neighbors and the root. When the topology is stable, the frequency of DIO messages decreases [39]. RPL creates routing topologies based on DODAGs; nodes use DIO messages to establish and maintain these topologies. An increased number of DIO messages indicates an unstable network routing topology [40]. The total quantity of DIO messages sent by each node within a specific period, time (t), can determine the impact of a sinkhole attack. The node is considered an attacker if the total quantity of delivered DIO messages falls below or exceeds a threshold. The threshold is determined by the node transmitting data every 10 s. The root adds that node to the blocklist if the received messages are below 30% of the expected quantity [35]. The values of DIO_Current and DIO_Previous are calculated using Eqs. (1) and (2).
If the value of DIO_Current exceeds the threshold, it indicates abnormal DIO Transaction messages. This behavior leads to a significant increase in DIO messages being delivered to neighboring regions. It also affects the topology surrounding the malicious node, generating more DIO messages. This, in turn, increases control overhead and packet collisions. Additionally, the power consumption around sinkhole nodes varies based on the number of sinkholes, which can impact network performance.
On the other hand, the rest of the network consumes power as it would in the absence of sinkhole attacks. The monitoring node’s role is to passively listen and log all messages passing through the network, which are then sent to the IDS. Whenever a DIO Transmission Frequency Behavior event occurs, triggering an alarm, the next stage (Sinkhole Attack Detection) is initiated.
In Rank Harmony Behavior, source nodes in the network select a set of parent nodes and choose the one with a better rank value as their preferred parent. The rank value represents the node’s proximity to the root. However, in a sinkhole attack, the malicious node falsely claims to have a better rank than other nodes, tricking them into selecting it as the preferred parent. The sinkhole node manipulates the network topology by advertising fake routing metrics through illegitimate DIO messages. This behavior becomes evident when multiple illegitimate DIO messages contain false rank information from the parent node to deceive its neighboring nodes in the DODAG. As a result, when data packets are routed through the malicious node, they either get dropped or their routing information is altered, preventing them from reaching the base station. This routing manipulation can change the topology around the malicious node, causing increased control overhead and packet collisions [41,42]. Two steps have been defined to identify abnormal ranking behavior, which indicates a sinkhole attack.
Step 1: Differences between Node’s Rank with Its Parent Node (NRP)
This step represents the difference in the node’s rank with its parent, calculated using Eq. (3).
RPL determines each node’s rank value. The sink node has Rank = 0; according to Fig. 6, each node’s rank is determined by the sink node count from that node to the sink node plus one.
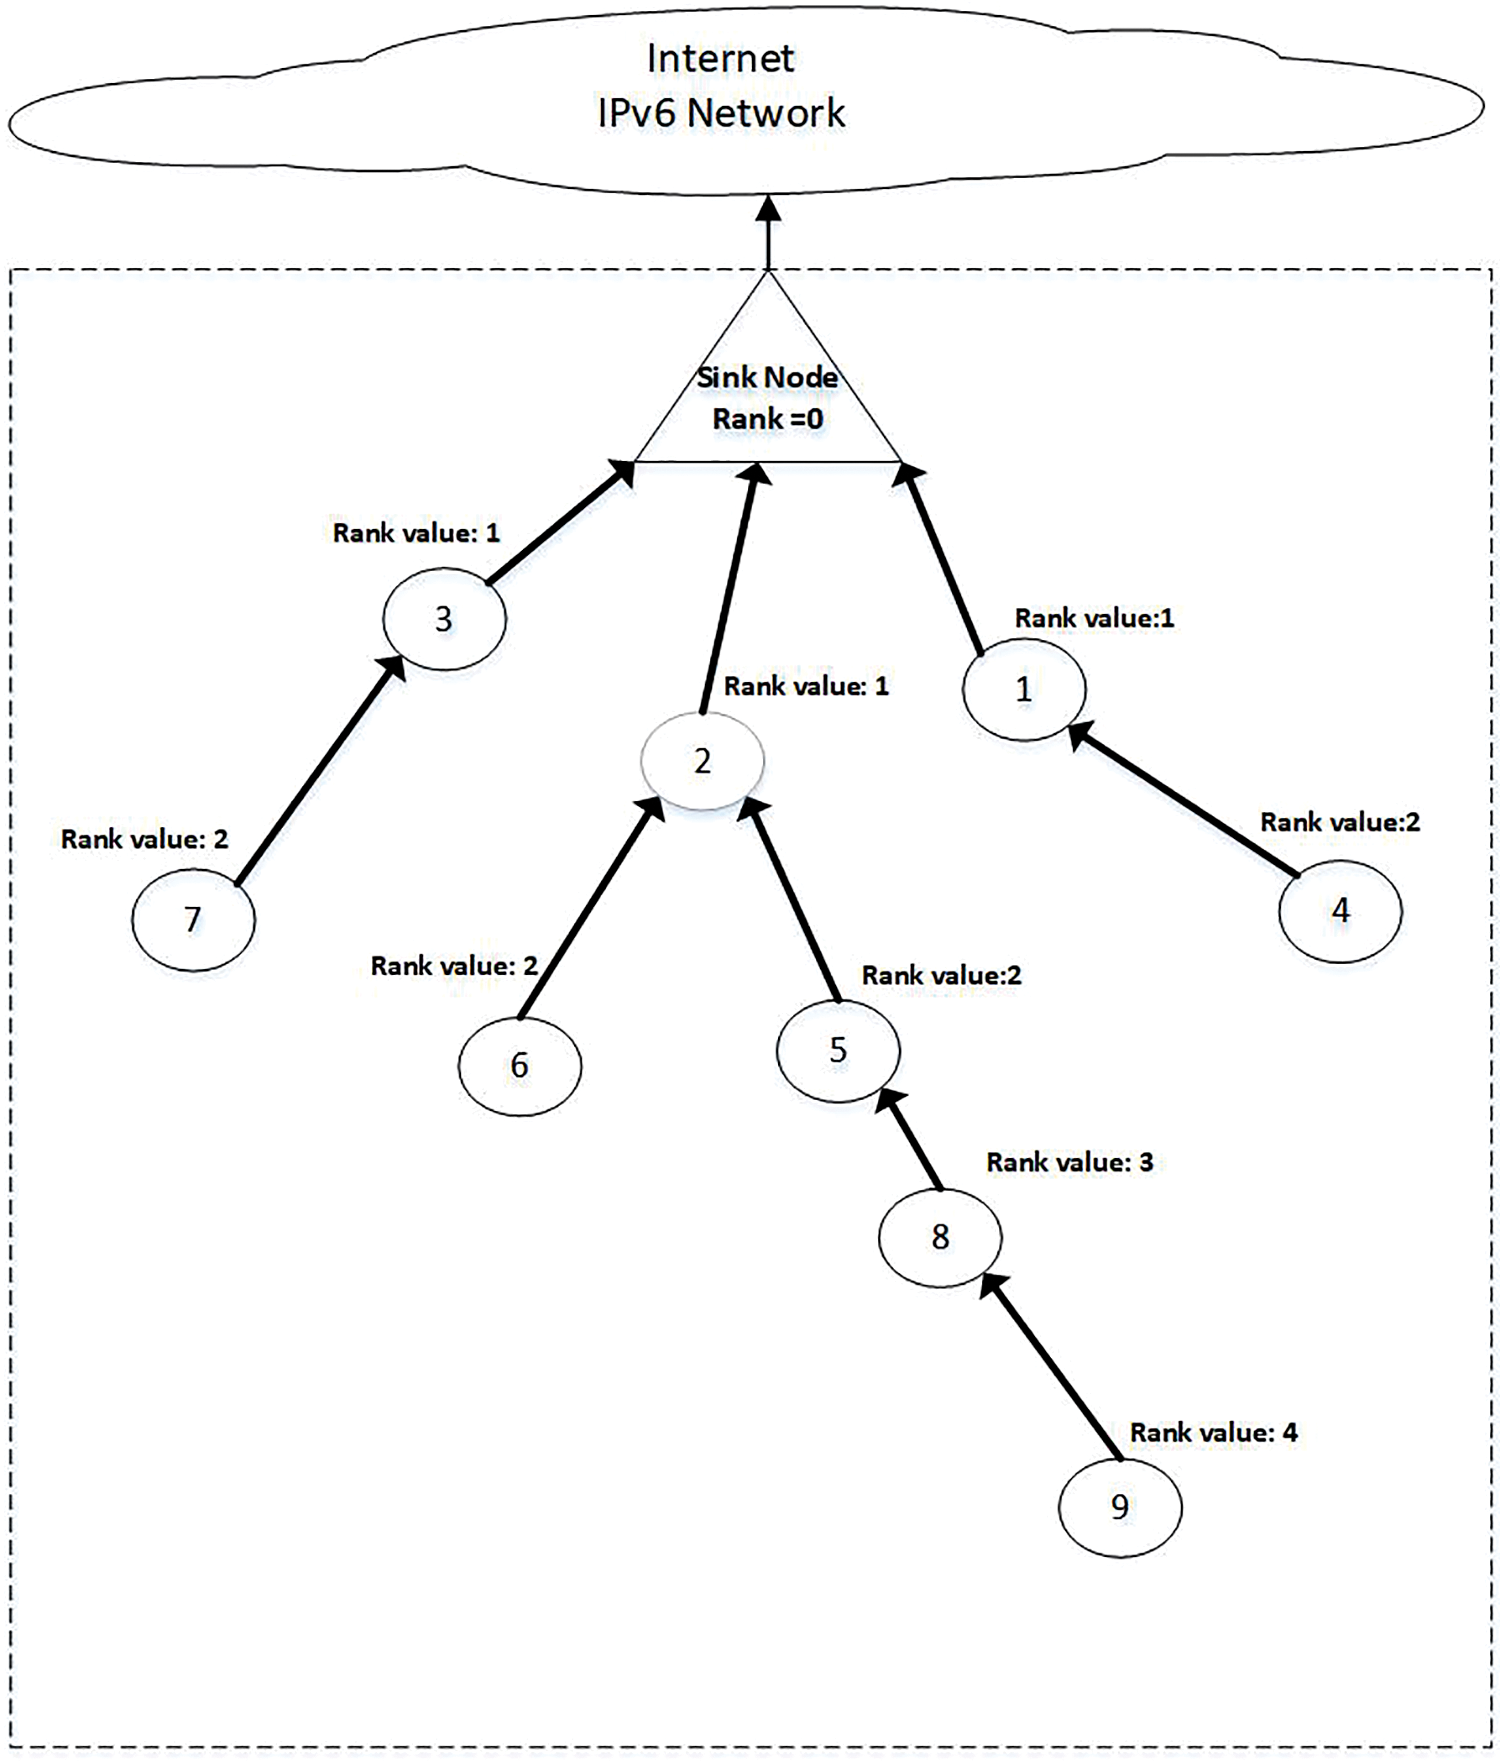
Figure 6: DODAG graph (NRP)
In the UVM approach, it is assumed that the initial IoT network is free from any malicious nodes, and the correct routing tables are broadcasted to all nodes before the occurrence of a sinkhole attack [41,42]. For instance, in Fig. 6, labeled as “DODAG graph (NRP),” the NRP (Neighbor Rank Precedence) value for node N9 is calculated based on its rank and the rank of its parent node N8. The rank of N9 is 4, and its parent node N8 has a rank of 3. By applying Eq. (3), the NRP value of node N9 is determined as |3−4|, resulting in a value of 1. This calculation helps determine the precedence or priority of neighboring nodes in the routing process.
Step 2: Differences between Source Node Rank with Node Itself (SRN)
When a malicious sinkhole node attacks the network, the M node (Malicious Node) announces its rank as zero using the DIO message to all neighboring nodes, as shown in Fig. 7, practically declaring it as the sink node. Once the sinkhole node’s DIO message is received, node N9 calculates the SRN value according to Eq. (4) [41,42].
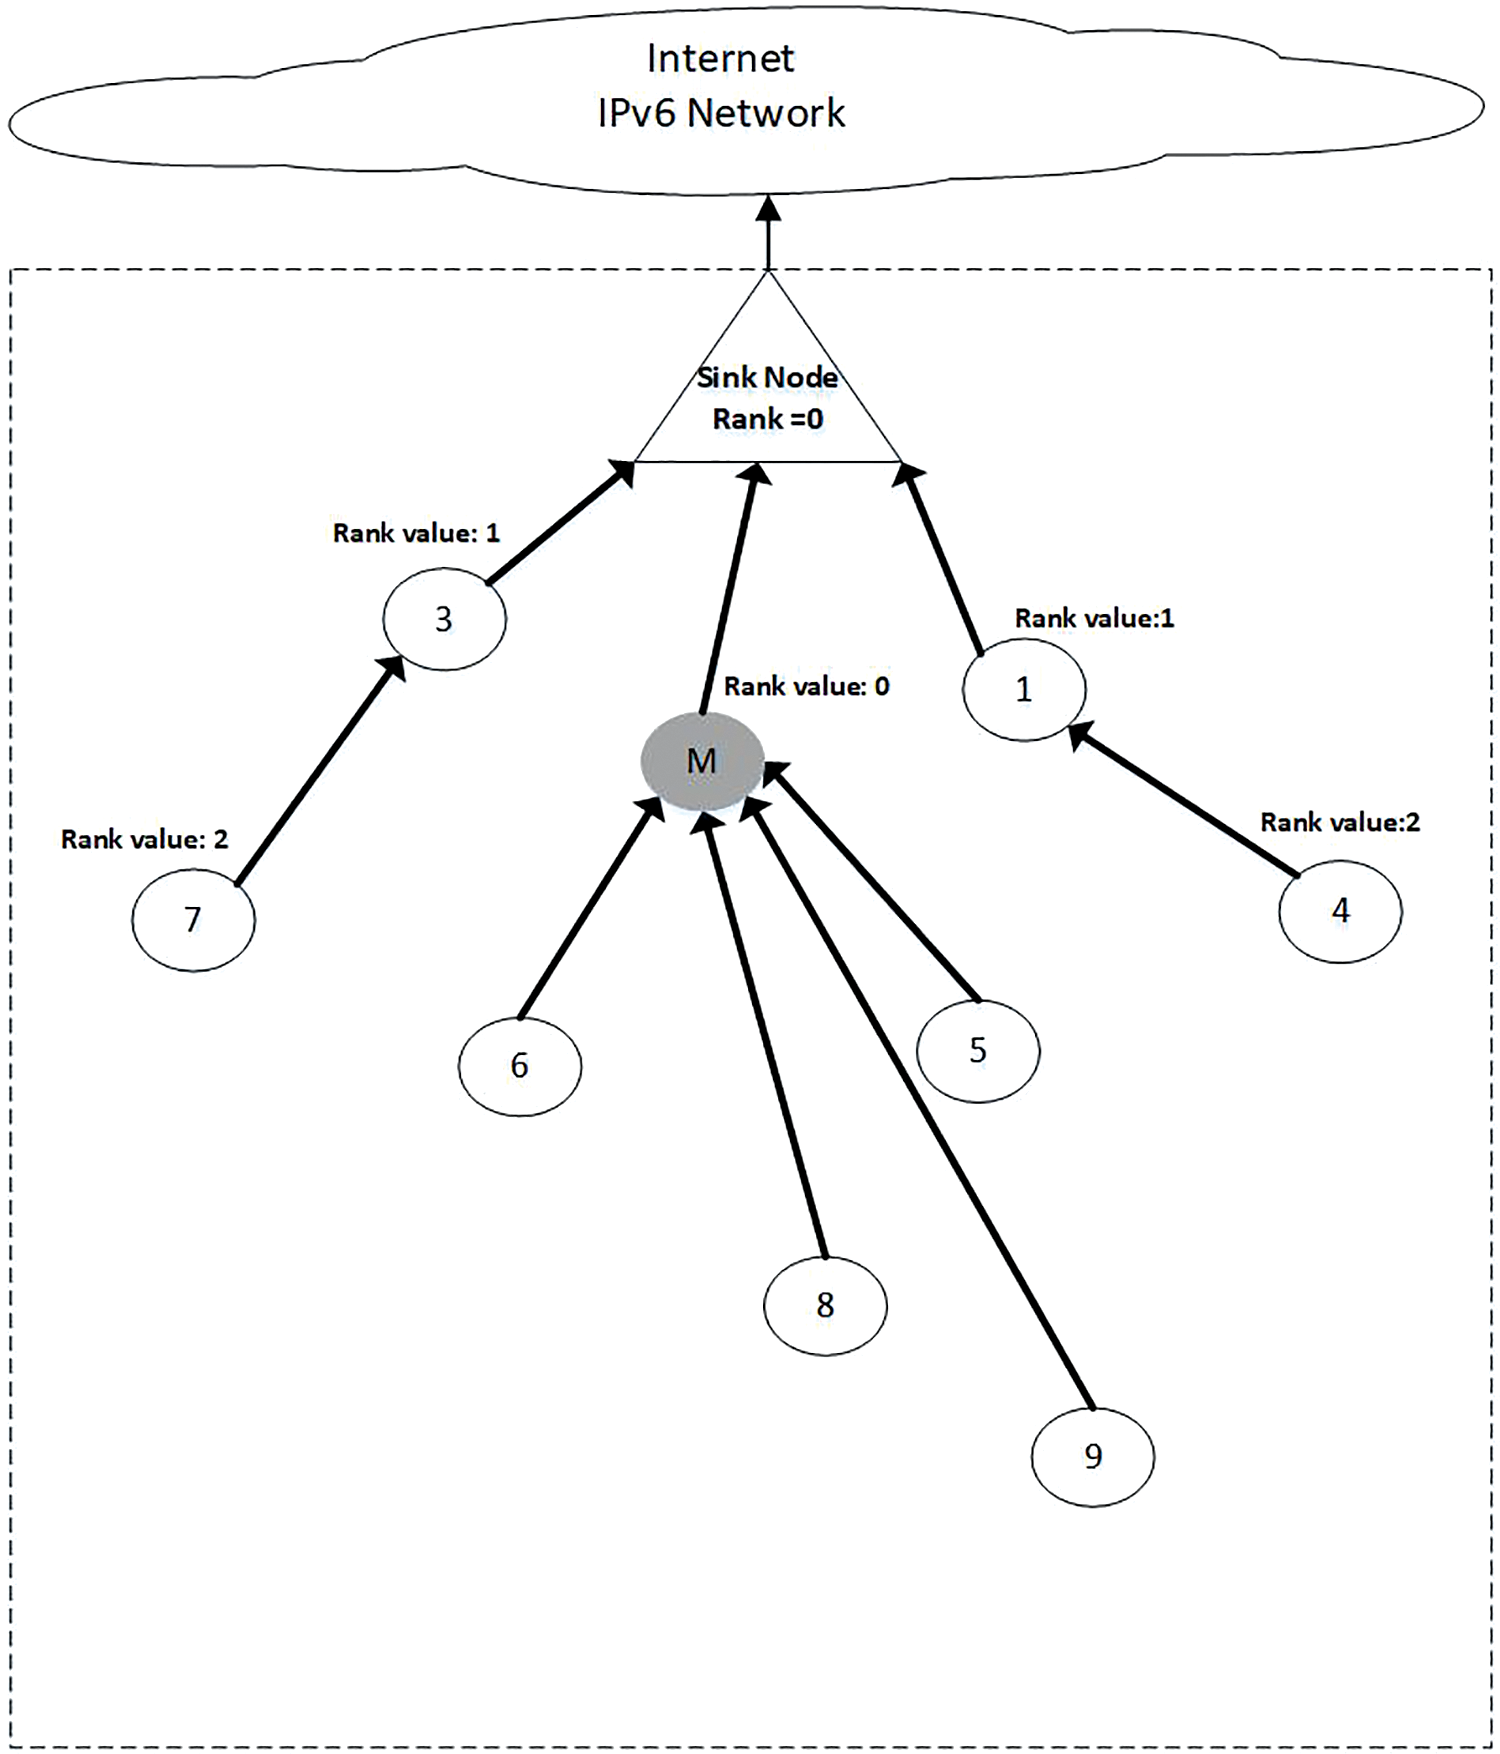
Figure 7: DODAG graph (SRN)
Since the rank value is zero for the source node that transmits the DIO message, and the rank value for node N9 = 4; therefore, the SRN value for node N9 = |0−4| = 4.
Rank harmony classifies a DIO message as malicious when SRN Rank Value > NRP Rank Value. In Fig. 7: “DODAG graph (SRN),” node M’s DIO message will be classified as malicious since the SRN Rank Value of N9 > NRP Rank Value of N9, as 4 > 1.
The Monitoring node passively listens to all messages passing through the topology. Whenever a Rank Harmony Behavior event occurs, an alarm is triggered to the next stage (Sinkhole Attack Detection).
4.3.3 Power Consumption Behavior
The sensors near the sinkhole attack experience a significant depletion of battery power, resulting in a reduced network lifetime and increased control overhead. Additionally, the energy flow around the sinkholes is altered, negatively impacting the network’s overall performance. The extent of energy drainage on neighboring nodes depends on the number of nodes affected by the attack. Conversely, the energy consumption in the remaining parts of the network behaves normally without sinkhole attacks.
The monitoring node assumes a passive role, listening to all messages transmitted within the network topology. Whenever a Power Consumption Behavior event is detected, an alarm is triggered, indicating the occurrence of abnormal power consumption. This alarm is then forwarded to the next stage, the Sinkhole Attack Detection phase.
4.4 Sinkhole Attack Detection (Stage 4)
This stage aims to decide whether there is a Sinkhole attack according to information from the previous stage (Behavioral Indicators). This stage consists of the following subsequent steps.
This step aims to identify suspicious nodes by analyzing the ICMPv6 and power consumption features using specific rules and thresholds. Determining these threshold values involves conducting experiments, observations, and analyses under normal and abnormal conditions. The threshold values obtained are then applied to the behavioral indicators. The following are the rules applied:
Rule #1: DIO Transaction Frequency Behavior
The first proposed rule aims to detect DIO Transmission Frequency Behavior using the following rule:
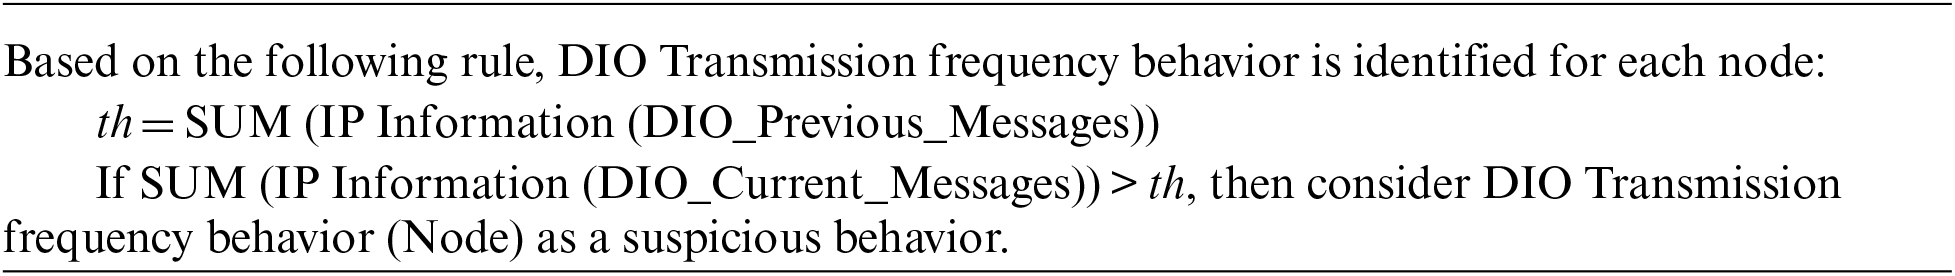
Here, th is the total number of DIO previous messages. Every minute, the total (DIO Transmission frequency behavior) will be calculated for each node. An alert will be triggered if the sum of DIO Transmission messages for each node exceeds the threshold (th).
Rule #2: Rank Harmony Behavior
The second proposed rule aims to detect Rank Harmony Behavior using the following rule:
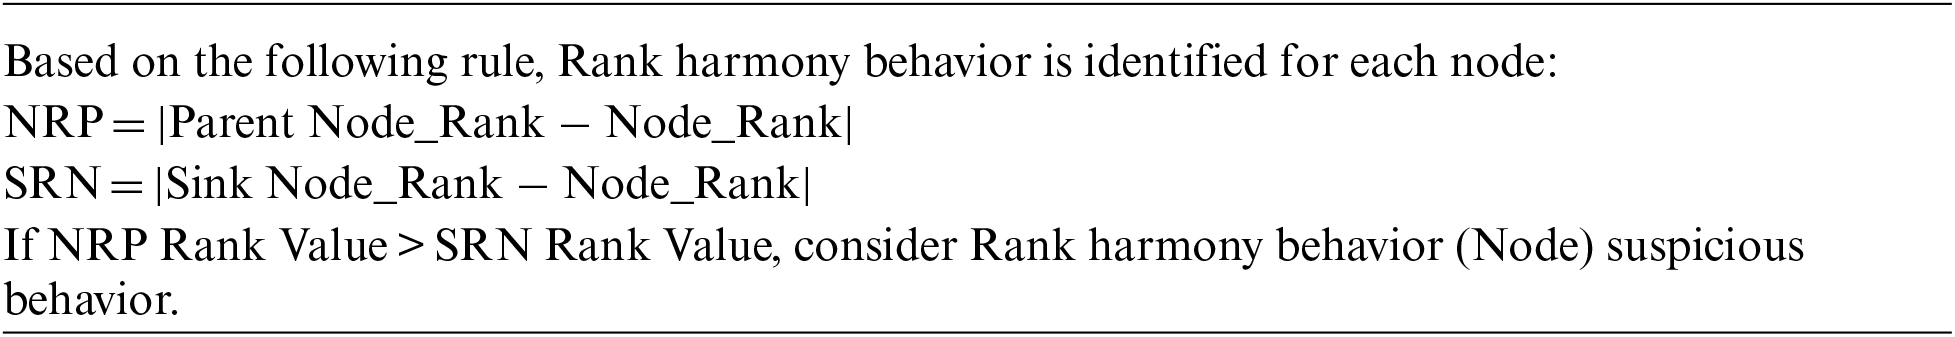
NRP and SRN will be calculated for each node every minute. Rank Harmony will flag a DIO message as malicious if SRN Rank Value > NRP Rank Value. An alert will be triggered if SRN Rank Value for each node exceeds the NRP Rank Value.
Rule #3: Power Consumption Behavior
The third proposed rule aims to detect Power Consumption Behavior using the following rule:

Here, th is the predetermined threshold, configurable and determined by experiments, observation, and analysis under normal and abnormal conditions. The Power Consumption (Node) for each node is calculated. An alert will be triggered if the sum of Power Consumption for each node exceeds the th.
4.4.2 Unweighted Voting Method for Detecting Sinkhole Attack
The proposed approach employs an unweighted voting method to correctly identify sinkhole anomalies, where each voter or rule carries equal weight. This means that voters do not express a preference for one candidate over another, making the method less complex as no intricate measures are involved [43]. The detection of a sinkhole attack is achieved by applying a majority voting rule to the outcomes of the behavioral rules. In particular, the unweighted voting method requires a majority of over 65% to determine the presence of a sinkhole attack based on the voting result [44]. Eq. (5) is utilized for the detection of sinkhole attacks.
The uniqueness of the unweighted voting method lies in the fact that each voter has equal weight in the decision-making process. Unlike other selection methods, such as Preference Ballots or Plurality, the unweighted voting method does not involve complex measures and allows voters to express their preferences for candidates equally.
The selection of DIO Transaction Frequency, Rank Harmony Behavior, and Power Consumption Behavior as the indicators for the unweighted voting method is based on their relevance and contribution to the identification of sinkhole nodes in the context of the proposed research. These indicators have been carefully chosen among other options based on their ability to capture key characteristics of sinkhole attacks and differentiate them from normal network behavior.
While the specific indicators may be tailored to the sinkhole attack detection problem in the IoT context, the unweighted voting method itself can be generalized and applied to other related applications, such as in [31]. The method can be adapted by selecting appropriate indicators relevant to the problem at hand. For instance, in a different application domain, such as anomaly detection in network traffic, the unweighted voting method can be employed by selecting indicators that capture the abnormal behavior patterns of interest.
The unweighted voting method offers simplicity and fairness by providing equal weight to each voter or rule in the decision-making process. It allows for a straightforward implementation and interpretation while ensuring that all indicators are considered equally. This generalizability and flexibility make the unweighted voting method useful in various applications where multiple indicators contribute to decision-making processes.
The proposed approach is exemplified in the following steps:
1. Collect and transform the power consumption values and the captured ICMPv6 network traffic into a meaningful format. Filter the power consumption data (e.g., CPU, LPM, TX, and RX) and from the ICMPv6 packet (e.g., Source, Destination, and Rank) to select specific features.
2. Cleanse the data to reduce traffic volume by fixing or removing corrupted, incorrectly formatted, duplicate, or incomplete data within the dataset.
3. Perform feature selection to decrease the size of the features by selecting the most significant features that contribute to detecting sinkhole attacks.
4. By analyzing the selected features, utilize behavioral indicators to identify suspicious nodes based on abnormal behavior in RPL networks. The selected features of the ICMPv6 and power consumption from the previous step are inputted into this stage to identify abnormal behavior of the sinkhole attack in RPL-based networks.
5. In the detection step, two sub-steps are involved:
a. Rule-Based: Identify suspicious nodes by analyzing the ICMPv6 and power consumptionfeatures using specific rules with thresholds.
b. Unweighted Voting Method: Utilize this method to identify sinkhole anomalies correctly. A sinkhole attack is detected when the results of the rules are received, and a majority votingrule requires a majority of greater than 50% to determine whether there is a sinkhole attackor not, according to the voting result from the UVM.
This section explains the dataset used to evaluate the proposed approach and provides insight and discussion regarding the experimental results.
The RPL-NIDDS17 dataset evaluates UVM regarding detection accuracy, false-positive rate, and power consumption. To detect sinkhole attacks, to detect sinkhole attacks, the UVM reads the data, and when any of the rules are met, an alert will be triggered to the unweighted voting method. The traffic will be considered an attack if the Sum (Triggers) exceeds 65%.
The RPL-NIDDS17 dataset contains seven types of modern routing attacks (Sinkhole, Blackhole, Selective Forwarding, Clone ID, Sybil, Hello Flooding, and Local Repair attacks). The analysis of the RPL-NIDDS17 dataset involves evaluating four machine-learning classifiers [45,46].
NetSim is a tool used to create the RPL-NIDDS17 dataset. The IoT network includes a gateway, sensor nodes, wired nodes, and a router to create the dataset, as shown in Fig. 8.
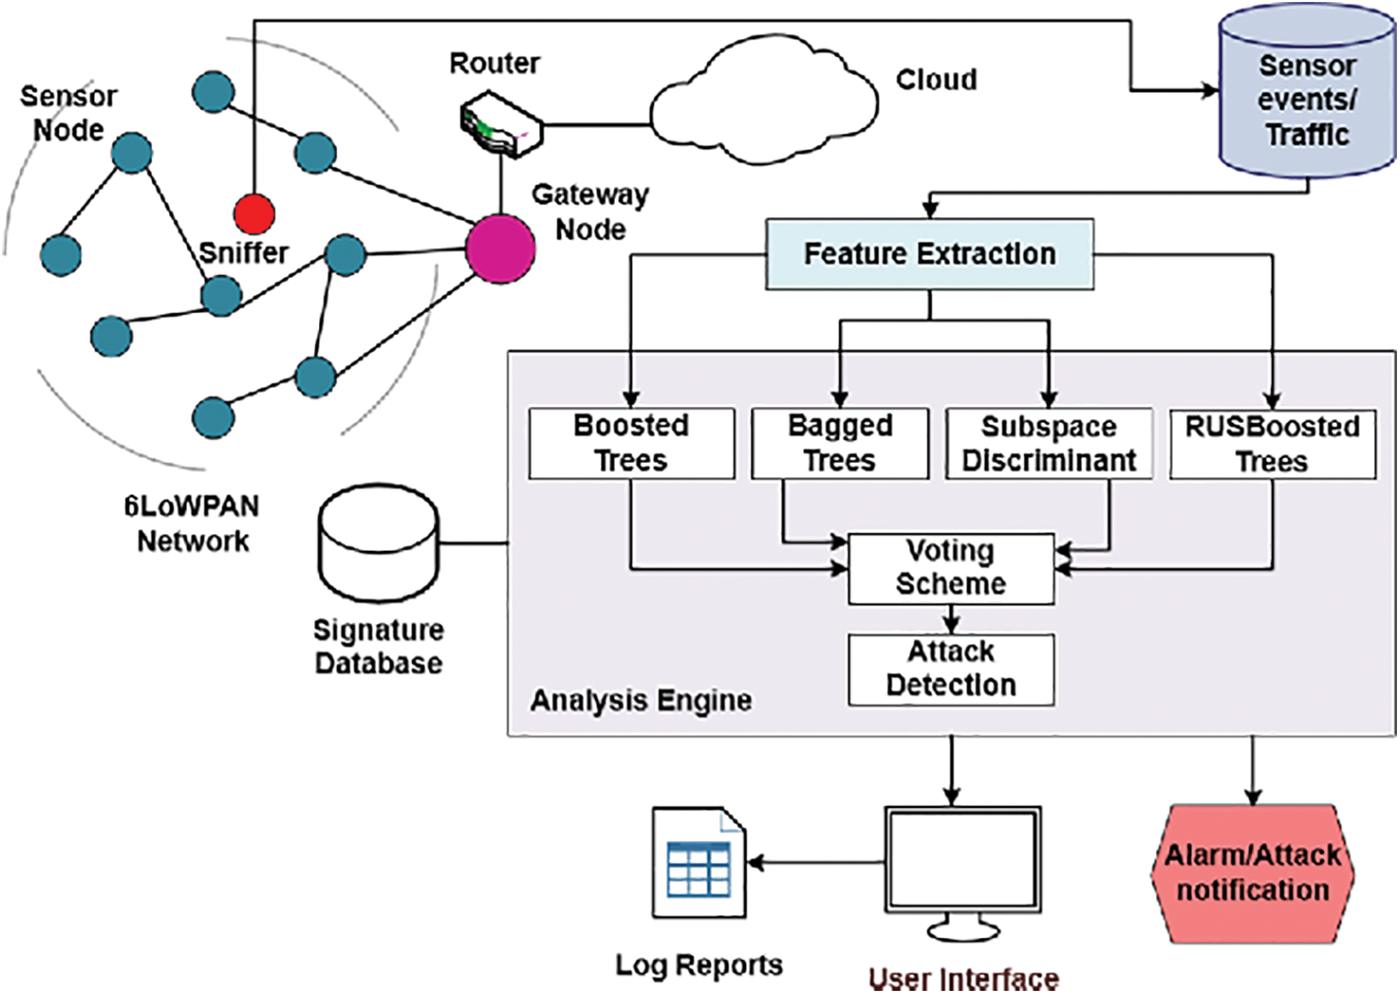
Figure 8: ELNIDS architecture
The RPL-NIDDS17 dataset consists of twenty-two attributes, such as Time, Source Destination ID, Packet Type Transmission Control Protocol (TCP), ICMPv6, User Datagram Protocol (UDP), Attack Category, and Label (Normal or Attack) [45,47,48].
5.2 Hardware and Software Requirements
The following are the specifications of the hardware used in the proposed approach:
• Processors: 64-bit Intel® Core i5, 2.4 GHz
• Hard Drive: 250 GB
• RAM: 12 GB
• Network Interface Card: Intel® dual-band Wireless AC 8260
The following are the specifications of the software used in the proposed approach:
• Operating Systems: Ubuntu 12.04, Microsoft Windows 10 Pro (64-bit)
• WSN Operating System: Contiki v2.7
• Sensor Simulator: COOJA Network Simulator
• Hypervisor: VMware Workstation Player 12
• Data Cleansing: OpenRefine v3.5.1
• Database: Structured Query Language (SQL) Server Management Studio 2017, v17.8.1
• Feature’s Selection: WEKA v3.9.5
• Network Monitoring Tools: Wireshark v3.2.3
5.3 Results of Feature Selection Stage
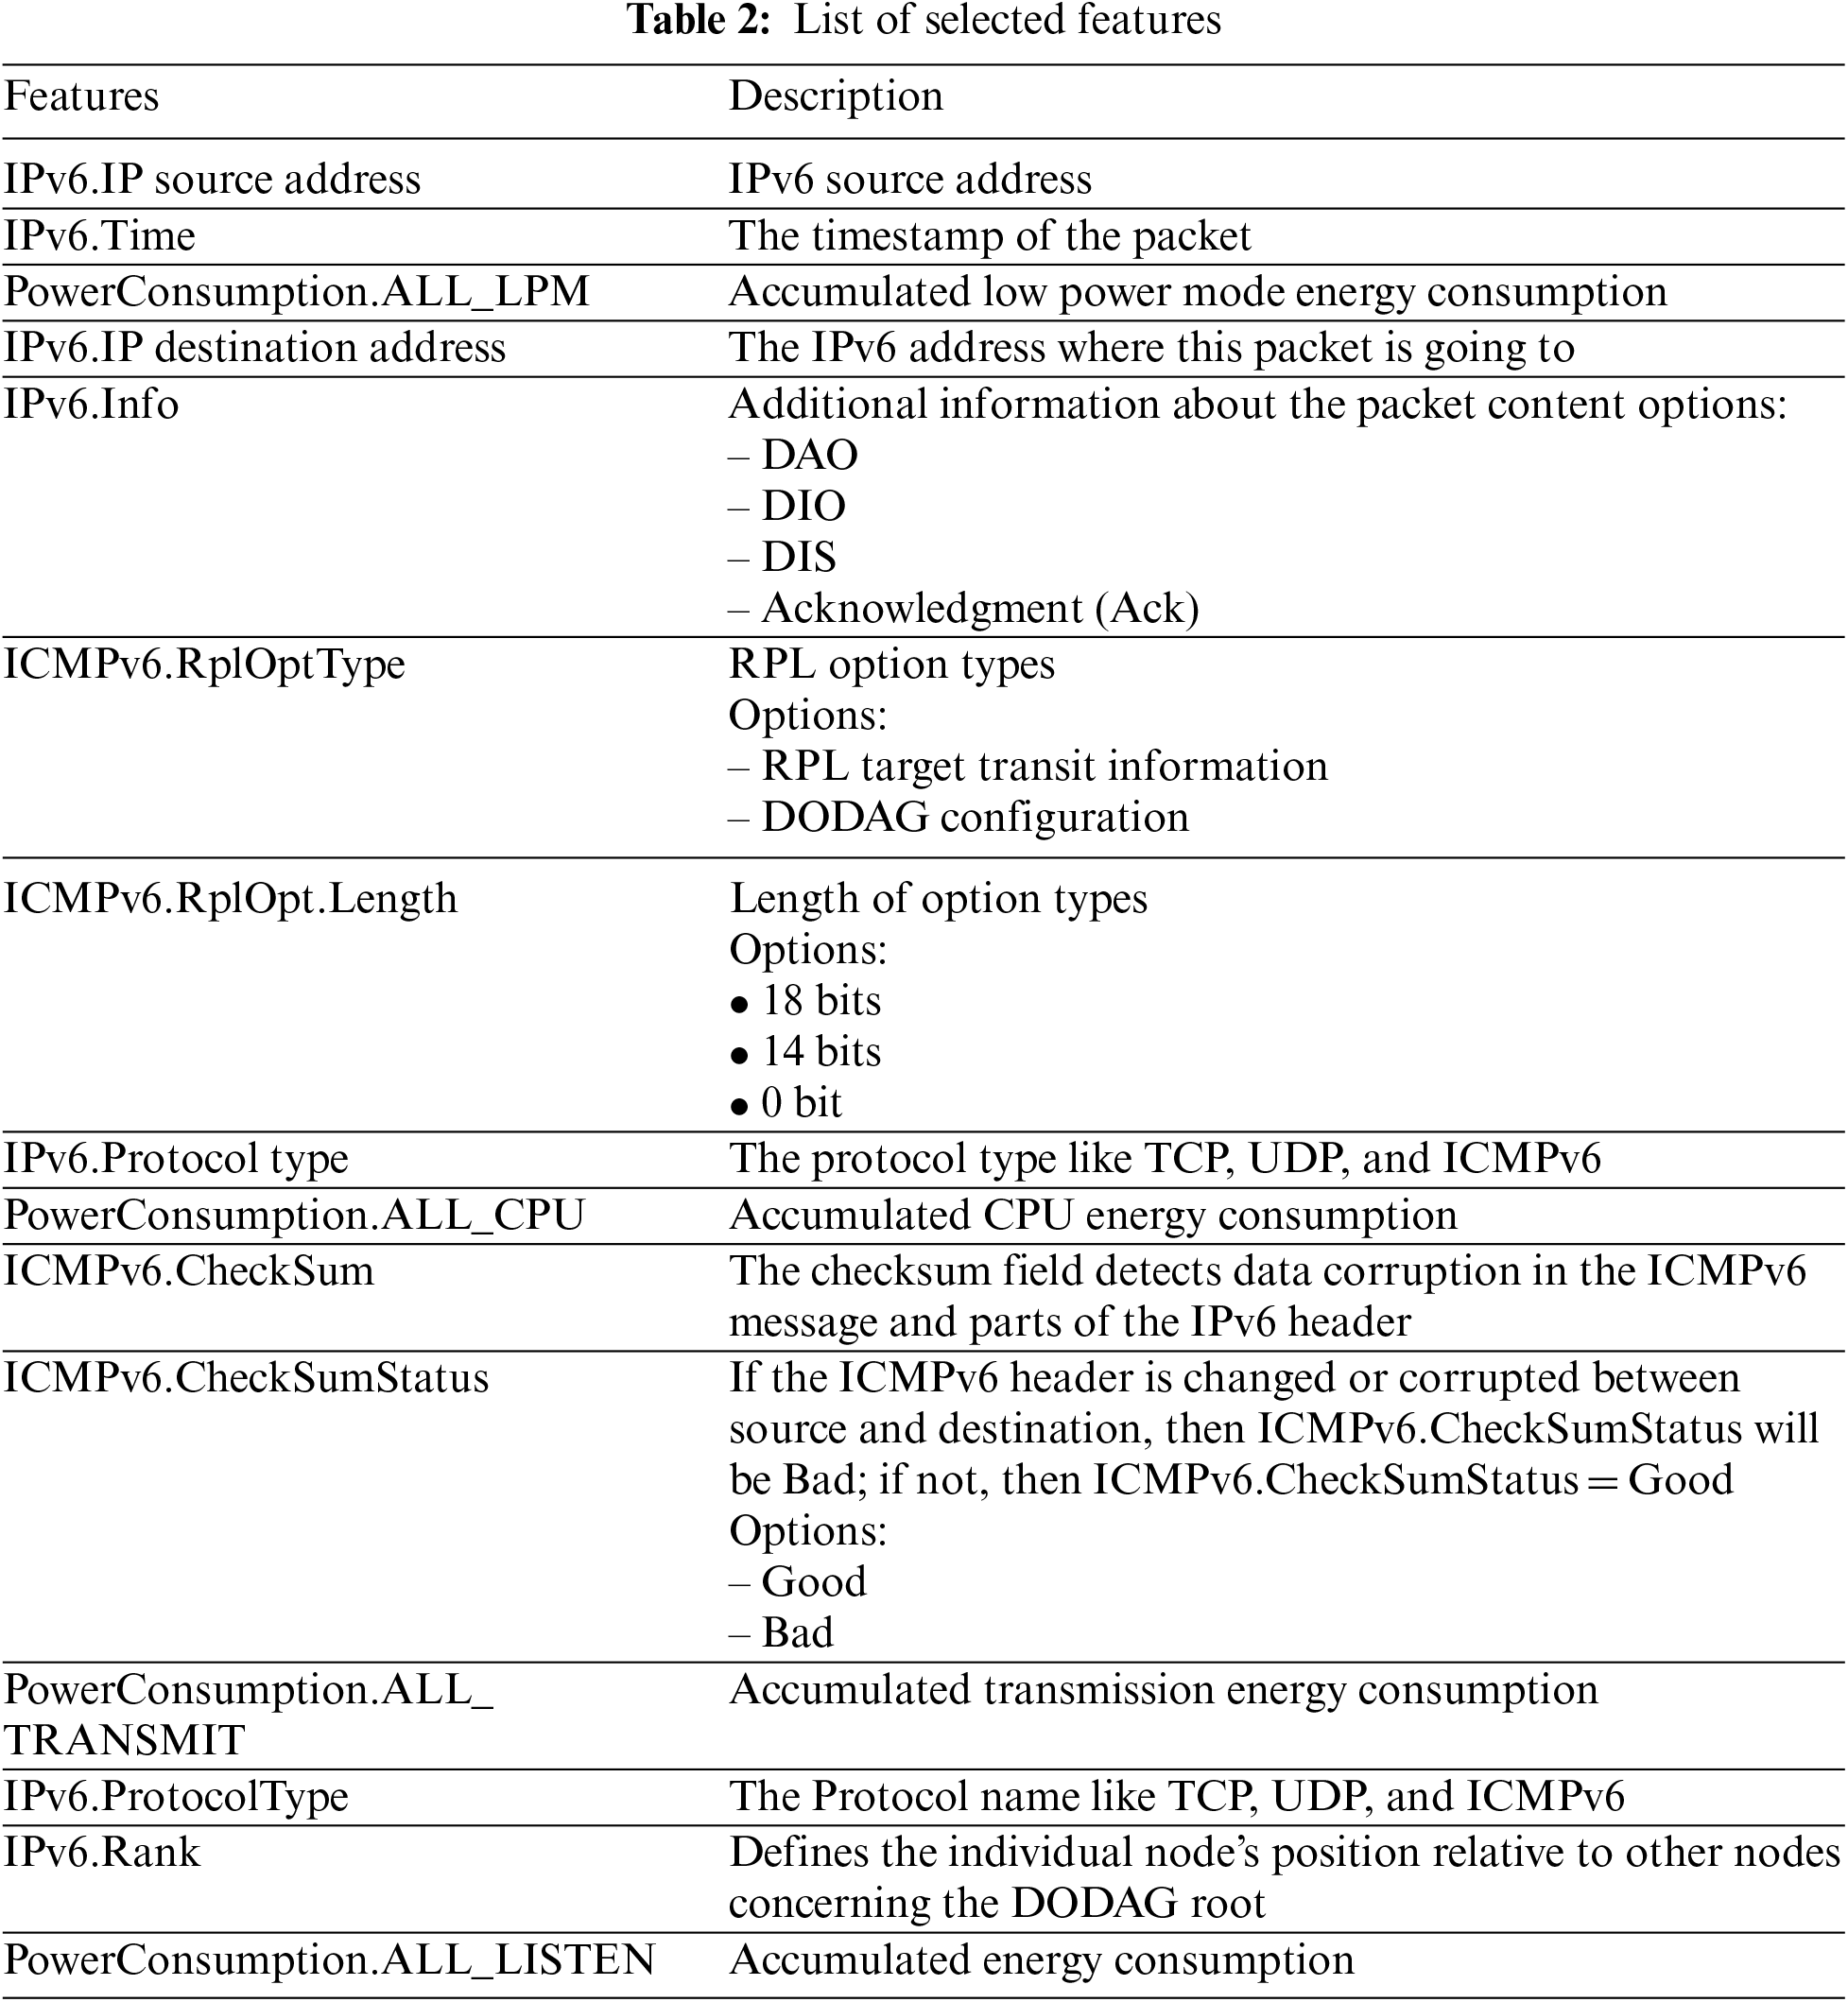
Sixteen features with the highest ReliefF algorithm value weights are eventually selected and nominated as they contribute to detecting sinkhole attacks. The result of field ranking using the ReliefF algorithm in WEKA tools is shown in Table 2.
5.4 Results of Behavioral Indicators Stage
This stage aims to identify suspicious nodes based on abnormal behavior in RPL-based networks by analyzing the features listed in Table 2. The features for abnormal behavior are illustrated in the previous step for detection purposes.
5.4.1 Detection of DIO Transaction Frequency
The DIO Transaction Frequency behavior occurs when the quantity of DIO messages reaches its highest level, allowing the determination of a packet as malicious or not [17,49]. An abnormal frequency of DIO transmission is observed when the number of released DIO messages exceeds the threshold value. Once the total DIO Transaction Frequency exceeds the threshold value, it indicates that the attack has damaged the DODAG routes. Therefore, the instability of DIO messages may indicate a potential attack. Meanwhile, an alert is triggered by the IDS to proceed to the next stage (Sinkhole Attack Detection). Table 3 displays the DIO Transaction Frequency behavior records for the RPL-NIDDS17 datasets between the parent and destination nodes, as shown in Fig. 9.
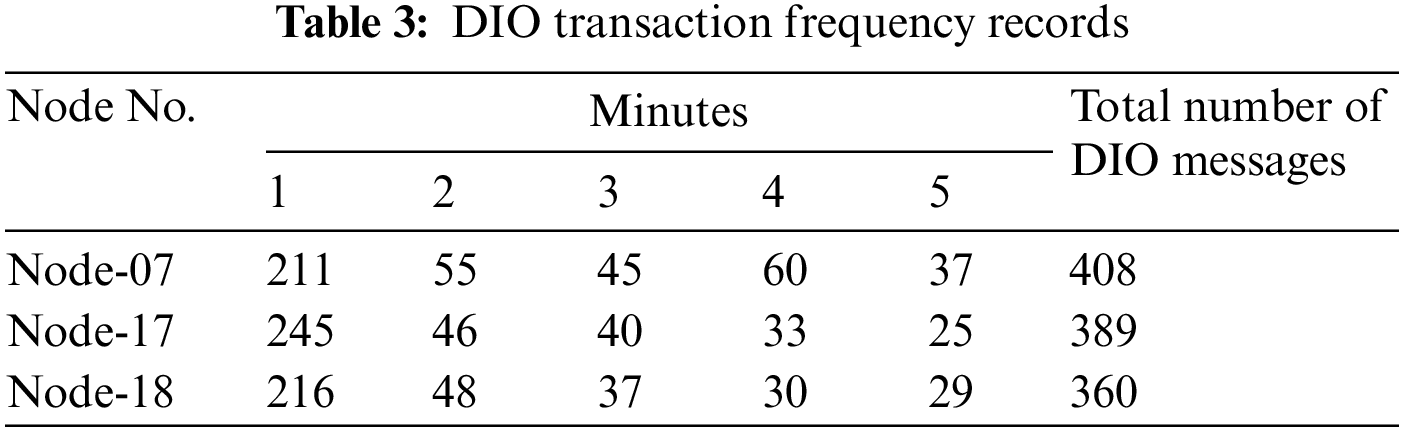
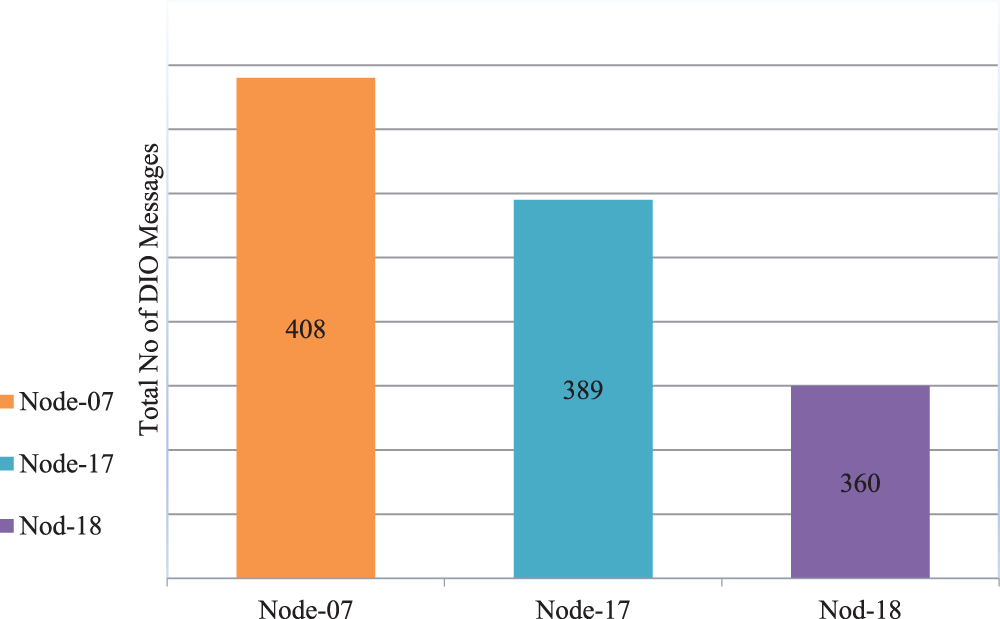
Figure 9: DIO transaction frequency result
The RPL-NIDDS17 dataset provides insights into the DIO transmission frequency behavior of Node 07, Node 17, and Node 18. By comparing the total number of DIO transaction messages at minute four (SUM (DIO_Current_Messages)) with the threshold represented by the total number of DIO transaction messages at minute three (SUM (DIO_Previous_Messages)), we can determine if there is a potential attack. If the current DIO transaction messages exceed the previous threshold, indicating abnormal behavior, Node 07 is identified as the attacker, confirming that the observed DIO transmission frequency behavior results from a sinkhole attack. Furthermore, Rule No. 1 is applied to validate the detection if the sum of DIO transmission messages exceeds the threshold value defined in Eqs. (1) and (2) are considered abnormal behavior and categorized as suspicious. The DIO frequency behavior is then input for the unweighted voting method in the Sinkhole Attack Detection process.
5.4.2 Detection of Rank Harmony Behavioral Indicators
The core concept behind Rank Harmony behavior is that nodes in an RPL network are assigned ranks based on their position relative to the root, and their ranks should always be higher than their parent nodes to maintain acyclicity. However, in a sinkhole attack, malicious nodes falsely claim to have better ranks than others, tricking neighboring nodes into selecting them as their preferred parent nodes in the RPL network. This allows the attacker, who has a lower rank, to position themselves closer to the root. By manipulating routing metrics, the malicious node deceives neighboring nodes into establishing communication.
The Rank Harmony value is calculated and monitored to detect such sinkhole attacks. If the Rank Harmony value exceeds predefined thresholds, it may indicate the presence of an attack. The instability of Rank Harmony values can serve as an indication of a potential attack. Whenever a Rank Harmony behavior event is detected, an alarm is triggered and forwarded to the Sinkhole Attack Detection stage for further analysis.
By examining the RPL-NIDDS17 dataset, it is observed that Node 07 has a higher Rank Harmony value compared to its parent Node 01. This discrepancy in ranks indicates the presence of Rank Harmony behavior in the dataset. Consequently, in Table 4, Node 07 is labeled as an attacker, affirming that the observed Rank Harmony behavior results from the sinkhole attack.
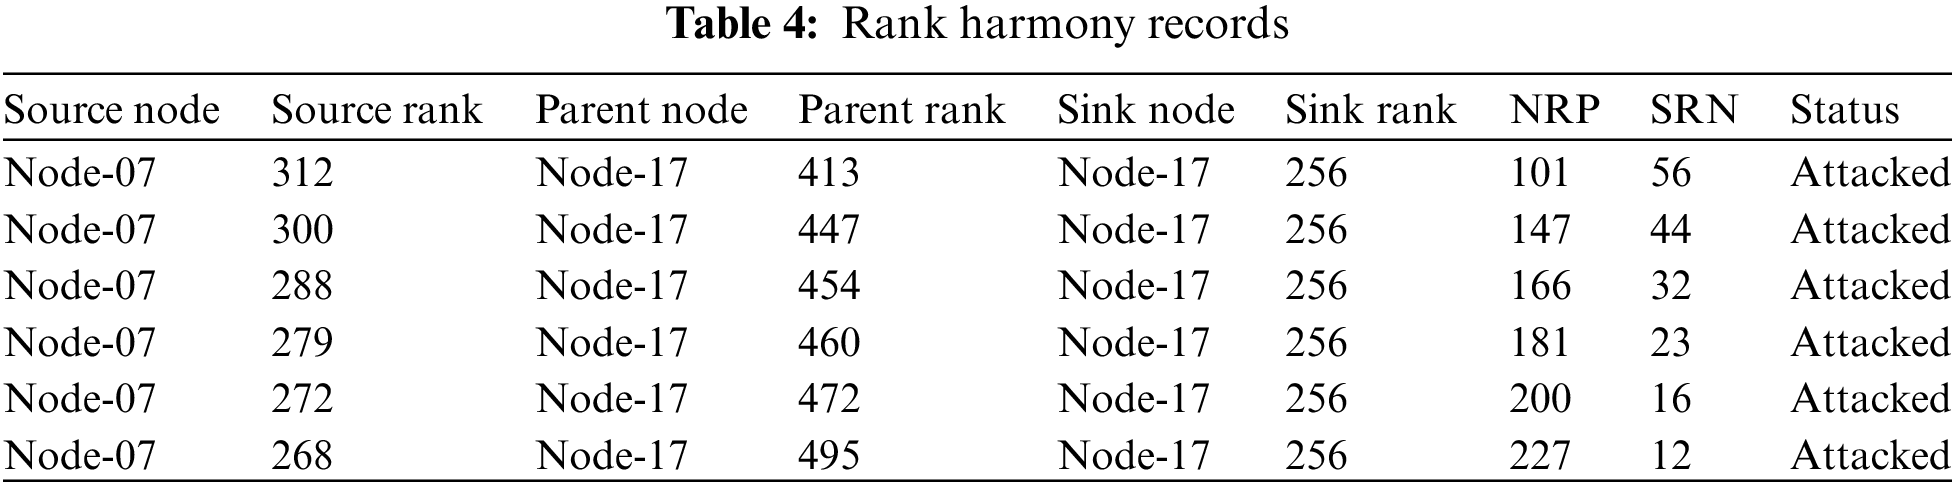
As a result of applying Rule No. 2, it has been confirmed that the NRP Rank Value exceeds the SRN Rank Value; therefore, it is considered suspicious behavior. Rank Harmony behavior results are used as input to the unweighted voting method in the Sinkhole Attack Detection.
5.4.3 Detection of Power Consumption Behavioral Indicator
Power consumption values are obtained from passive nodes, and an increase in the power consumption values for CPU, LPM, TX, and RX indicates an unstable network routing topology. Conversely, a decrease in power consumption values suggests network stability. By analyzing the power consumption of each node, the impact of the sinkhole attack can be determined. Table 5 describes the power consumption behavior for the sinkhole node in the RPL-NIDDS17 dataset.
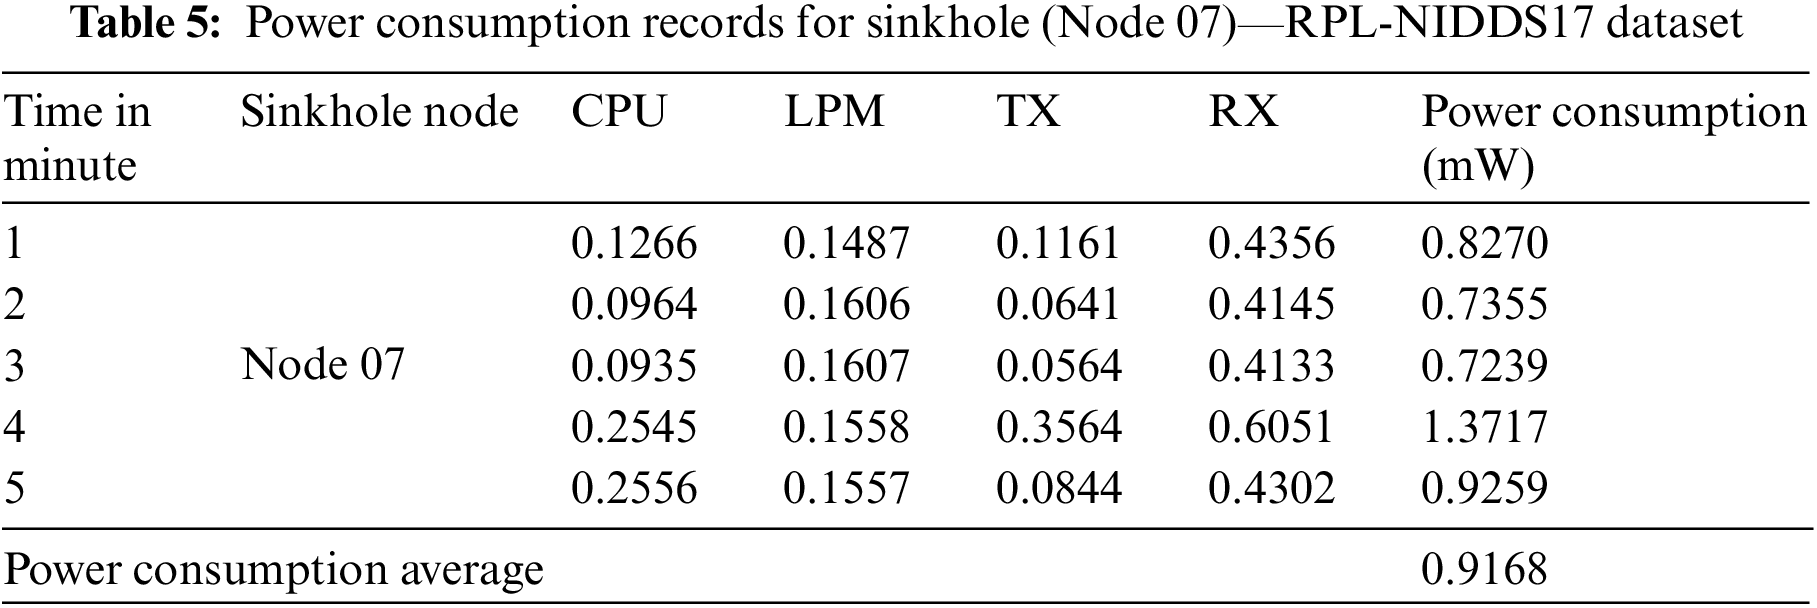
As a result of applying Rule No. 3, it has been confirmed that the power consumption exceeds the threshold value of 1 mW, indicating suspicious behavior. This increase in power consumption is caused by the sinkhole node collecting traffic from nearby nodes. The sinkhole node receives and processes TX and RX, generating higher power consumption. Table 6 shows the power consumption without the sniffer node, while Table 7 shows the power consumption with the node.
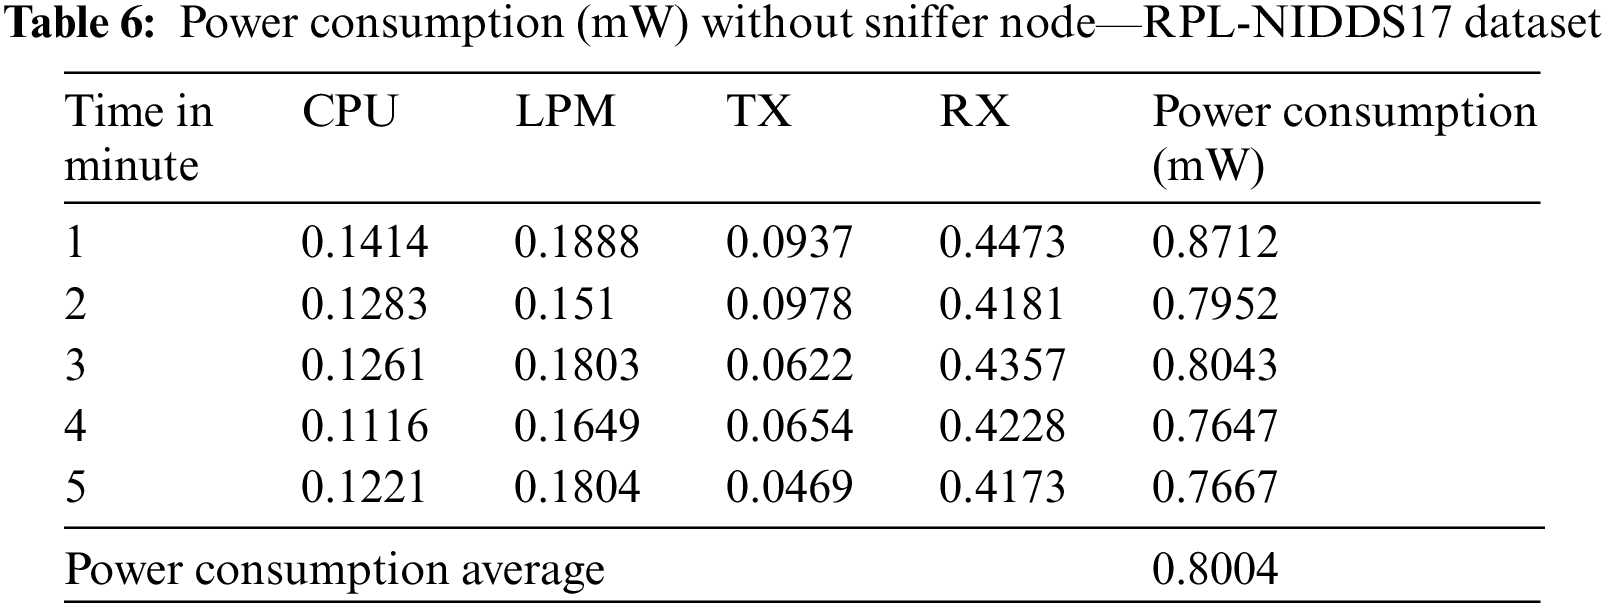
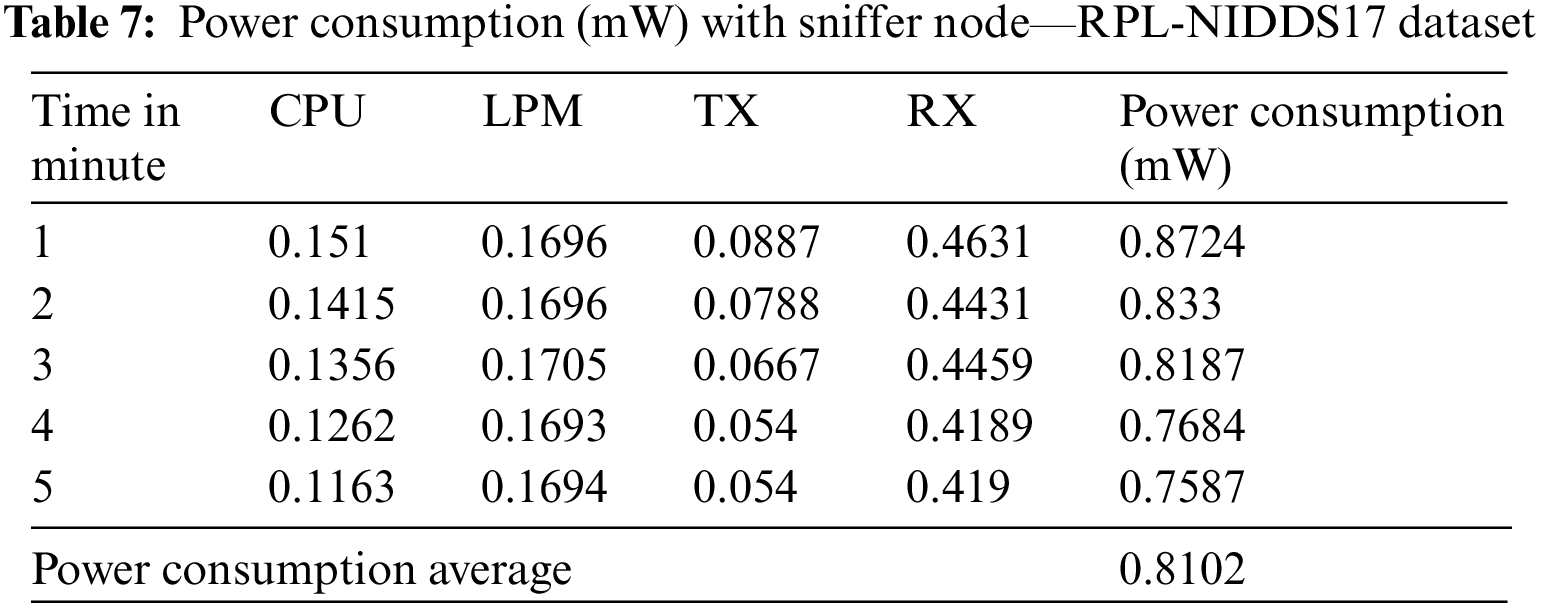
The power consumption results presented in Tables 6 and 7 provide insights into the impact of the proposed passive sniffer node on the overall network power consumption. Without the sniffer node, the average power consumption of the entire network is measured at 0.8004 mW. However, when the sniffer node is introduced, the average power consumption slightly increases to 0.8102 mW. This comparison indicates that the average power consumption of the network remains nearly unchanged with the inclusion of the sniffer node, even in the absence of an attack. These findings suggest that the proposed passive sniffer node does not impose a significant power consumption overhead on the network.
These results are significant as they demonstrate that the proposed passive sniffer node can be seamlessly integrated into the network without causing a notable increase in power consumption. This is crucial for ensuring the practicality and efficiency of the network, as it allows for continuous monitoring and detection of attacks without compromising the overall power efficiency of the system. Fig. 10 shows the power consumption results.
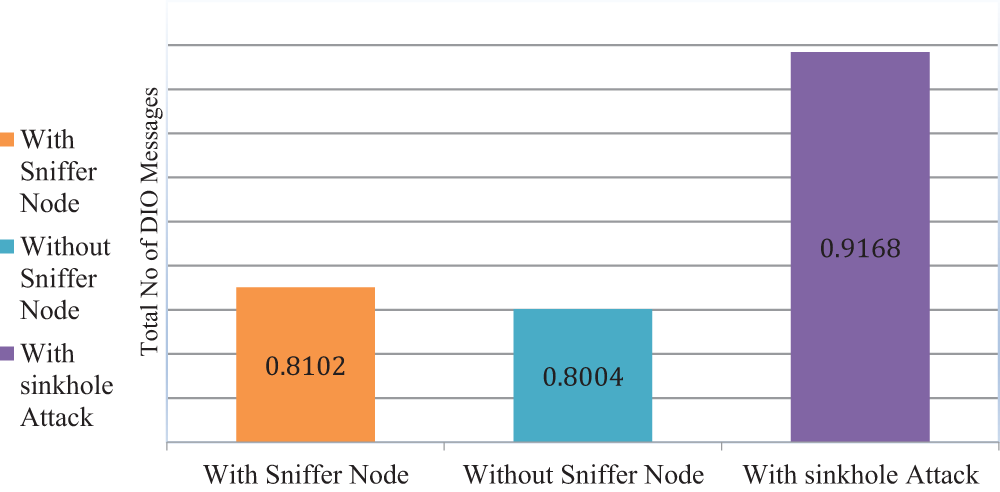
Figure 10: Power consumption result
The analysis of power consumption behavior is used as input to the unweighted voting method to detect Sinkhole attacks.
5.5 Comparison with ELNIDS Approach
This section compares the detection accuracy between the UVM and ELNIDS approaches using the RPL-NIDDS17 dataset, as illustrated in Table 8.
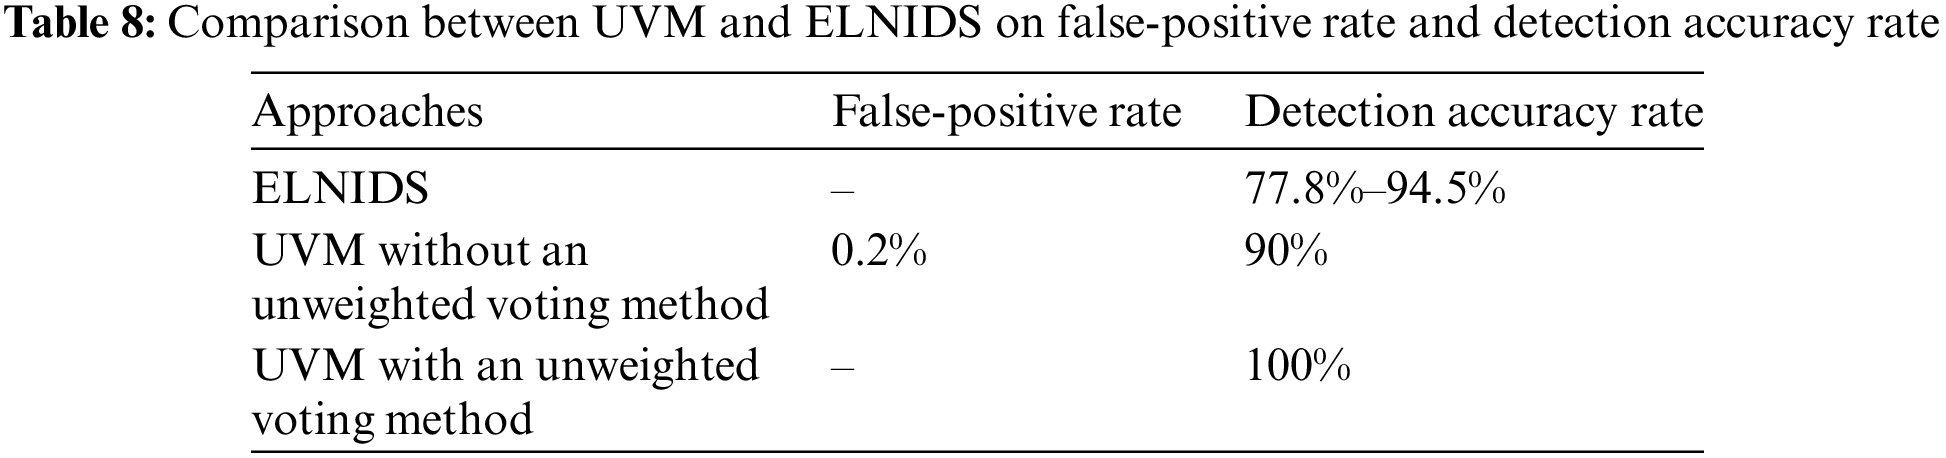
Table 8 shows that the ELNIDS approach achieves the highest detection accuracy rate of 94.5%. Conversely, the lowest detection accuracy rate observed is 77.8%. Furthermore, the simulation results presented in Table 8 illustrate that the UVM approach achieves a 100% detection accuracy rate when utilizing the unweighted voting method, whereas, without the unweighted voting method, the UVM approach achieves a detection accuracy rate of 90% with a false-positive rate of 0.2%. The superior detection accuracy of the UVM approach compared to ELNIDS can be attributed to its utilization of three indicators supported by rules and an unweighted voting method.
The results in Table 8 demonstrate that the UVM approach achieves a higher detection accuracy than ELNIDS, as the experimental findings support. This can be attributed to UVM’s utilization of five indicators backed by rules and unweighted voting methods. In contrast, although ELNIDS accurately detects known attacks through its signature-based intrusion detection technique, its reliance on only two indicators, power consumption and ranking, can lead to the failure of attack detection if either of these indicators is not triggered.
By employing unweighted voting methods, UVM leverages its three major behavioral indicators, namely Rank Harmony, DIO Transaction, and power consumption behavior, resulting in significantly improved detection accuracy. This highlights the effectiveness of UVM in detecting sinkhole attacks within RPL networks compared to ELNIDS.
Additionally, regarding power consumption, UVM demonstrates the ability to meet the requirements of constrained nodes without increasing energy usage. This contributes to conserving energy, prolonging battery life, and reducing power consumption. In contrast, ELNIDS consumes considerable power due to the necessity of maintaining an extensive attack signature database. The passive node, which collects data without impacting other constrained nodes, measures power consumption with and without its presence. Notably, the average power consumption without the passive node is nearly identical to the average power consumption with the passive node and without any attacks. The passive node, connected through a wired network, ensures it does not interfere with the power supply of normal nodes, aligning with the primary objective of proposing an approach for detecting sinkhole attacks in RPL-based IoT networks with low power consumption.
This paper introduces the UVM as a solution for identifying sinkhole nodes. UVM utilizes three key behavioral indicators, namely DIO Transaction Frequency, Rank Harmony, and Power Consumption, carefully selected for their significant role in detecting sinkhole attacks. These indicators and relevant features from previous research form the foundation of the UVM method. UVM employs an unweighted voting mechanism, enhancing its effectiveness in accurately identifying sinkhole nodes. To evaluate the effectiveness of the UVM in detecting sinkhole attacks on RPL networks for IoT, we conducted experiments using a dataset generated with actual sinkhole attack traffic. The results demonstrate that UVM achieves a high level of accuracy in detecting sinkhole attacks. Without the unweighted voting method, the detection rate is 90%, while with the unweighted voting method, it reaches 100%. The false-positive detection rate is significantly low at 0.2%, with improvement percentages ranging from 12.2% to 5.5%. For future research, there are several avenues to explore. Efforts can be made to expand the applicability of the proposed method to detect other types of attacks on RPL-based networks, such as selective-forward and blackhole attacks. Also, conducting experiments using diverse datasets from different network environments will provide valuable insights. Additionally, exploring the use of real-world testbeds or simulations that closely mimic real-world network conditions will help evaluate the performance of the proposed approach in terms of detection accuracy and power consumption. Furthermore, we intend to conduct additional experiments and observations to identify other behavioral indicators that can assist in detecting sinkhole attacks.
Acknowledgement: Authors would like to acknowledge the support of the Deanship of Scientific Research at Najran University for this research through Research Groups at Najran University, Saudi Arabia.
Funding Statement: This research was funded by the Deanship of Scientific Research at Najran University for this research through a Grant (NU/RG/SERC/12/50) under the Research Groups at Najran University, Saudi Arabia.
Author Contributions: Study conception and design: Al-Sarawi. Shadi, Alabsi. Basim; data collection: Anbar. Mohammed, Rihan. Shaza; analysis and interpretation of results: Anbar. Mohammed, Al-Sarawi. Shadi; draft manuscript preparation: Aladaileh. Mohammad, Rihan. Shaza. All authors reviewed the results and approved the final version of the manuscript.
Availability of Data and Materials: The data supporting this study’s findings are available from the corresponding author of [34] upon reasonable request.
Conflicts of Interest: The authors declare that they have no conflicts of interest to report regarding the present study.
References
1. J. Arshad, M. Azad, R. Amad, K. Salah, M. Alazab et al., “A review of performance, energy and privacy of intrusion detection systems for IoT,” Electronics, vol. 9, no. 4, pp. 629, 2020. [Google Scholar]
2. G. An and T. Cho, “Improving sinkhole attack detection rate through knowledge-based specification rule for a sinkhole attack intrusion detection technique of IoT,” International Journal of Computer Networks and Applications (IJCNA), vol. 9, no. 2, pp. 169–178, 2022. [Google Scholar]
3. A. Rehman, S. Rehman and H. Raheem, “Sinkhole attack in wireless sensor networks: A survey,” Wireless Personal Communications, vol. 106, no. 4, pp. 2291–2313, 2019. [Google Scholar]
4. N. Kushalnagar, G. Montenegro and C. Schumacher, “RFC4919: IPv6 over low-power wireless personal area networks (6LoWPANsOverview, assumptions, problem statement and goals,” Request for Comments: 4919, pp. 1–12, 2007. [Online]. Available: https://tools.ietf.org/html/rfc4919 [Google Scholar]
5. C. Thiagarajan and P. Samundiswary, “Performance comparison of routing protocols for IoT,” in 2nd Int. Conf. on Smart Technologies and Systems for Next Generation Computing (ICSTSN), Villupuram, India, pp. 1–5, 2023. [Google Scholar]
6. M. Liscio, “Design development and assessment of a multi-interface IoT platform,” 2016. [Online]. Available: https://www.politesi.polimi.it/handle/10589/123244 [Google Scholar]
7. D. Airehrour, J. Gutierrez and S. Ray, “A testbed implementation of a trust-aware RPL routing protocol,” in 27th Int. Telecommunication Networks and Applications Conf., Melbourne, Australia, pp. 1–6, 2017. https://doi.org/10.1109/ATNAC.2017.8215369 [Google Scholar] [CrossRef]
8. N. Abdel Baset and A. Fatimah, “Employing wearable technology in designing digital bags to achieve safety requirements for pilgrims,” International Design Journal, vol. 13, no. 4, pp. 43–53, 2023. [Google Scholar]
9. N. Alassaf, A. Gutub, S. A. Parah and M. Al Ghamdi, “Enhancing speed of SIMON: A light-weight-cryptographic algorithm for IoT applications,” Multimedia Tools and Applications, vol. 78, pp. 32633–32657, 2019. [Google Scholar]
10. K. Lab, “New IoT-malware grew three-fold in H1 2018,” 2018. [Online]. Available: https://www.kaspersky.com/about/press-releases/2018_new-iot-malware-grew-three-fold-in-h1-2018 [Google Scholar]
11. S. Al-Sarawi, M. Anbar, R. Abdullah and A. Al Hawari, “Internet of things market analysis forecasts, 2020–2030,” in Proc. of the World Conf. on Smart Trends in Systems, Security and Sustainability, London, UK, pp. 449–453, 2020. https://doi.org/10.1109/WorldS450073.2020.9210375 [Google Scholar] [CrossRef]
12. R. Daws, “IBM X-force discovers mozi botnet accounts for 90% of IoT traffic,” 2020. [Online]. Available: https://iottechnews.com/news/2020/sep/18/ibm-xforce-mozi-botnet-iot-traffic/ [Google Scholar]
13. S. Raza, L. Wallgren and T. Voigt, “SVELTE: Real-time intrusion detection in the internet of things,” Ad Hoc Networks, vol. 11, no. 8, pp. 2661–2674, 2013. [Google Scholar]
14. S. Al-Sarawi, M. Anbar, K. Alieyan and M. Alzubaidi, “Internet of Things (IoT) communication protocols: Review,” in ICIT 8th Int. Conf. on Information Technology, Amman, Jordan, pp. 685–690, 2017. https://doi.org/10.1109/ICITECH.2017.8079928 [Google Scholar] [CrossRef]
15. R. Garg and S. Sharma, “A study on need of adaptation layer in 6LoWPAN protocol stack,” International Journal of Wireless and Microwave Technologies (IJWMT), vol. 7, no. 3, pp. 49–57, 2017. [Google Scholar]
16. K. Krentz, H. Rafiee and C. Meinel, “6LoWPAN security: Adding compromise resilience to the 802.15.4 security sublayer,” in Proc. of the Int. Workshop on Adaptive Security, ASPI, Zurich, Switzerland, pp. 1–10, 2013. https://doi.org/10.1145/2523501.2523502 [Google Scholar] [CrossRef]
17. E. Kfoury, J. Saab, P. Younes and R. Achkar, “A self-organizing map intrusion detection system for RPL protocol attacks,” International Journal of Interdisciplinary Telecommunications and Networking (IJITN), vol. 11, no. 1, pp. 30–43, 2019. [Google Scholar]
18. D. Chandra, M. Kathing and D. Kumar, “A comparative study on IPv4 and IPv6,” in Int. Conf. on Communication Systems and Network Technologie, Gwalior, India, vol. 33, no. 33, pp. 286–289, 2013. [Google Scholar]
19. R. Patel, “Locating the Attacker of Wormhole Attack on RPL in IoT,” Parul University Digital Repository, 2016. [Online]. Available: https://ir.paruluniversity.ac.in/xmlui/handle/123456789/7075 [Google Scholar]
20. A. Gutub and N. Kheshaifaty, “Practicality analysis of utilizing text-based CAPTCHA vs. graphic-based CAPTCHA authentication,” Multimedia Tools and Application, pp. 1–33, 2023. https://doi.org/10.1007/s11042-023-15586-5 [Google Scholar] [PubMed] [CrossRef]
21. K. Alieyan, M. Kadhum, M. Anbar, S. Rehman and N. Alajmi, “An overview of DDoS attacks based on DNS,” in Int. Conf. on Information and Communication Technology Convergence (ICTC), Jeju, Korea (Southpp. 276–280, 2016. [Google Scholar]
22. D. Lund, C. Macgillivray, V. Turner and M. Morales, “Worldwide and regional Internet of Things (IoT) 2014–2020 forecast: A virtuous circle of proven value and demand,” International Data Corporation (IDC), vol. 1, pp. 9, 2014. [Google Scholar]
23. B. Zarpelão, R. Miani, C. Kawakani and S. Alvarenga, “A survey of intrusion detection in Internet of Things,” Journal of Network and Computer Applications, vol. 84, pp. 25–37, 2017. [Google Scholar]
24. T. Sherasiya, H. Upadhyay and H. Patel, “A survey: Intrusion detection system for Internet of Things,” International Journal of Computer Science and Engineering (IJCSE), vol. 5, no. 2, pp. 91–98, 2016. [Google Scholar]
25. M. Soula, B. Mbarek, A. Meddeb and T. Pitner, “A survey of intrusion detection-based trust management approaches in IoT networks,” in Int. Conf. on Advanced Information Networking and Applications, Juiz de Fora, Brazil, pp. 504–517, 2023. [Google Scholar]
26. S. Lee, Y. Lee and S. Yoo, “A specification based intrusion detection mechanism for the LEACH protocol,” The Journal of Korean Institute of Communications and Information Sciences, vol. 11, no. 1, pp. 138–147, 2012. [Google Scholar]
27. C. Tumrongwittayapak and R. Varakulsiripunth, “Detecting sinkhole attacks in wireless sensor networks,” in 2009 ICCAS-SICE, Fukuoka, Japan, pp. 1966–1971, 2009. [Google Scholar]
28. J. Chaudhry, U. Tariq, M. Amin and R. Rittenhouse, “Sinkhole vulnerabilities in wireless sensor networks,” International Journal of Security and Its Applications, vol. 8, no. 1, pp. 401–410, 2014. [Google Scholar]
29. A. Santos, C. Cervantes, M. Nogueira and B. Kantarci, “Clustering and reliability-driven mitigation of routing attacks in massive IoT systems,” Journal of Internet Services and Applications, vol. 10, no. 1, pp. 1–17, 2019. [Google Scholar]
30. S. Hajiheidari, K. Wakil, M. Badri and N. Navimipour, “Intrusion detection systems in the Internet of Things: A comprehensive investigation,” Computer Networks, vol. 160, pp. 165–191, 2019. [Google Scholar]
31. A. Singh, S. Satapathy, A. Roy and A. Gutub, “AI-based mobile edge computing for IoT: Applications, challenges and future scope,” Arabian Journal for Science and Engineering, vol. 47, no. 8, pp. 9801–9831, 2022. [Google Scholar]
32. G. Simoglou, G. Violettas, S. Petridou and L. Mamatas, “Intrusion detection systems for RPL security: A comparative analysis,” Computer Security, vol. 104, pp. 102219, 2021. [Google Scholar]
33. A. Raoof, A. Matrawy and C. Lung, “Routing attacks and mitigation methods for RPL-based internet of things,” IEEE Communications Surveys & Tutorials, vol. 21, no. 2, pp. 1582–1606, 2018. [Google Scholar]
34. A. Verma and V. Ranga, “ELNIDS: Ensemble learning based network intrusion detection system for RPL based Internet of Things,” in Proc. of 4th Int. Conf. on Internet of Things: Smart Innovation and Usages, Ghaziabad, India, pp. 1–6, 2019. https://doi.org/10.1109/IoT-SIU.2019.8777504 [Google Scholar] [CrossRef]
35. F. Dina, M. Moussa and L. Badr, “The spatiotemporal data reduction (STDRAn adaptive IoT-based data reduction approach,” in IEEE Tenth Int. Conf. on Intelligent Computing and Information Systems (ICICIS), Cairo, Egypt, pp. 355–360, 2021. https://doi.org/10.1109/ICICIS52592.2021.9694199 [Google Scholar] [CrossRef]
36. M. Zhao, A. Kumar, P. Chong and R. Lu, “A comprehensive study of RPL and P2P-RPL routing protocols: Implementation, challenges and opportunities,” Peer-to-Peer Networking and Applications, vol. 10, no. 5, pp. 1232–1256, 2017. [Google Scholar]
37. C. Zhang, M. Ye, L. Lei and Y. Qian, “Feature selection for cross-scene hyperspectral image classification using cross-domain I-ReliefF,” IEEE Journal of Selected Topics in Applied Earth Observations and Remote Sensing, vol. 14, pp. 5932–5949, 2021. [Google Scholar]
38. F. Hachemi, M. Mana and B. Bensaber, “Study of the impact of sinkhole attack in IoT using shewhart control charts,” in GLOBECOM IEEE Global Communications Conf., Taipei, Taiwan, pp. 1–5, 2020. https://doi.org/10.1109/GLOBECOM42002.2020.9322603 [Google Scholar] [CrossRef]
39. S. Kalantar, J. Mehdi and H. Malihe, “Energy and load balancing routing protocol for IoT,” International Journal of Communication Systems, vol. 36, no. 2, pp. e5371, 2023. [Google Scholar]
40. K. Chugh, A. Lasebae and J. Loo, “Case study of a black hole attack on 6LoWPAN-RPL,” in Securware 6th Int. Conf. on Emerging Security Information, Systems and Technologies, Rome, Italy, pp. 157–162, 2012. [Google Scholar]
41. M. Zaminkar, F. Sarkohaki and R. Fotohi, “A method based on encryption and node rating for securing the RPL protocol communications in the IoT ecosystem,” International Journal of Communication Systems, vol. 34, no. 3, pp. e4693, 2021. [Google Scholar]
42. M. Zaminkar and R. Fotohi, “SoS-RPL: Securing internet of things against sinkhole attack using RPL protocol-based node rating and ranking mechanism,” Wireless Personal Communications, vol. 114, no. 2, pp. 1287–1312, 2020. [Google Scholar]
43. M. Erp, L. Vuurpijl and L. Schomaker, “An overview and comparison of voting methods for pattern recognition,” in Proc. of Int. Workshop on Frontiers in Handwriting Recognition (IWFHR), Niagra, Canada, pp. 195–200, 2002. https://doi.org/10.1109/IWFHR.2002.1030908 [Google Scholar] [CrossRef]
44. Z. Zubi, A. Elrowayati and I. Abu Fanas, “A movie recommendation system design using association rules mining and classification techniques,” WSEAS Transactions on Computers, vol. 21, no. 3, pp. 189–199, 2022. [Google Scholar]
45. A. Verma and V. Ranga, “Evaluation of network intrusion detection systems for RPL based 6LoWPAN networks in IoT,” Wireless Personal Communications, vol. 108, no. 3, pp. 1571–1594, 2019. [Google Scholar]
46. J. Pokala and B. Lalitha, “A novel intrusion detection system for RPL based IoT networks with bio-inspired feature selection and ensemble classifier,” Research Square, 2021. [Online]. Available: https://www.researchsquare.com/article/rs-442429/latest.pdf [Google Scholar]
47. A. Bahaa, A. Abdelaziz, A. Sayed, L. Elfangary and H. Fahmy, “Monitoring real time security attacks for IoT systems using devsecops: A systematic literature review,” Information, vol. 12, no. 4, pp. 154, 2021. [Google Scholar]
48. N. Singh and D. Virmani, “Computational method to prove efficacy of datasets,” Journal of Information and Optimization Sciences, vol. 42, no. 1, pp. 211–233, 2021. [Google Scholar]
49. T. Parkavi and L. Arockiam, “A survey on sinkhole attack in RPL,” Annals of the Romanian Society for Cell Biology, vol. 25, pp. 511–515, 2021. [Online]. Available: http://annalsofrscb.ro/index.php/journal/article/view/4322 [Google Scholar]
Cite This Article
 Copyright © 2023 The Author(s). Published by Tech Science Press.
This work is licensed under a Creative Commons Attribution 4.0 International License , which permits unrestricted use, distribution, and reproduction in any medium, provided the original work is properly cited.
 Downloads
 Citation Tools