
 Submit a Paper
 Propose a Special lssue
 Open Access
ARTICLE

Application of the Deep Convolutional Neural Network for the Classification of Auto Immune Diseases
1 Department of Computer Science and Information Technology, Sarhad University of Science and Information
Technology, Peshawar, 25000, Pakistan
2 Department of Computer Science, University of Engineering and Technology, Mardan, 23200, Pakistan
3 EIAS Data Science and Blockchain Lab, College of Computer and Information Sciences, Prince Sultan University,
Riyadh, 11586, Saudi Arabia
* Corresponding Author: Gauhar Ali. Email:
Computers, Materials & Continua 2023, 77(1), 647-664. https://doi.org/10.32604/cmc.2023.038748
Received 27 December 2022; Accepted 30 May 2023; Issue published 31 October 2023
 View Full Text
 Download PDF
Abstract
IIF (Indirect Immune Florescence) has gained much attention recently due to its importance in medical sciences. The primary purpose of this work is to highlight a step-by-step methodology for detecting autoimmune diseases. The use of IIF for detecting autoimmune diseases is widespread in different medical areas. Nearly 80 different types of autoimmune diseases have existed in various body parts. The IIF has been used for image classification in both ways, manually and by using the Computer-Aided Detection (CAD) system. The data scientists conducted various research works using an automatic CAD system with low accuracy. The diseases in the human body can be detected with the help of Transfer Learning (TL), an advanced Convolutional Neural Network (CNN) approach. The baseline paper applied the manual classification to the MIVIA dataset of Human Epithelial cells (HEP) type II cells and the Sub Class Discriminant (SDA) analysis technique used to detect autoimmune diseases. The technique yielded an accuracy of up to 90.03%, which was not reliable for detecting autoimmune disease in the mitotic cells of the body. In the current research, the work has been performed on the MIVIA data set of HEP type II cells by using four well-known models of TL. Data augmentation and normalization have been applied to the dataset to overcome the problem of overfitting and are also used to improve the performance of TL models. These models are named Inception V3, Dens Net 121, VGG-16, and Mobile Net, and their performance can be calculated through parameters of the confusion matrix (accuracy, precision, recall, and F1 measures). The results show that the accuracy value of VGG- 16 is 78.00%, Inception V3 is 92.00%, Dense Net 121 is 95.00%, and Mobile Net shows 88.00% accuracy, respectively. Therefore, DenseNet-121 shows the highest performance with suitable analysis of autoimmune diseases. The overall performance highlighted that TL is a suitable and enhanced technique compared to its counterparts. Also, the proposed technique is used to detect autoimmune diseases with a minimal margin of errors and flaws.Keywords
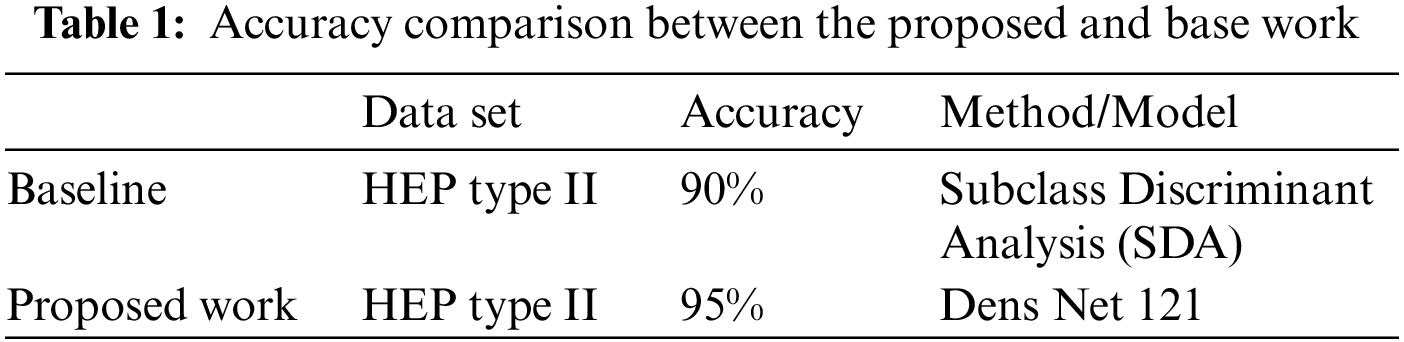
The Anti-Nuclear Antibody (ANA) test has been used to identify specific types of antibodies in humans. There is a wide range of antibodies that causes harm to normal body cells [1]. When the defence system of humans is compromised, it produces a specific type of antibody known as an autoantibody. These antibodies cause skin, muscle, and joint damage and various autoimmune diseases such as Scleroderma and Arthritis [2,3]. The ANA test has been performed for symptom detection of autoimmune diseases such as fever, headache, weakness, nausea, hair loss, and so on. The ANA test is carried out by using Indirect Immune Fluorescence (IIF) detection technology. The ANA test is the most reliable and well-suited test for detecting autoimmune diseases [4]. The IIF test not only detects diseases in the human body but also reveals vital information about the presence or absence of antinuclear antibodies in human cells. The IIF test is performed in three steps. In the first step, fluorescence light passes through the body’s mitotic cells. In the second step, light intensity is classified into positive, negative, and intermediate cells, and finally, further positive and intermediate cells are classified into six different types of staining patterns [5]. IIF technology has been performed manually and automatically, but the manual method could be more efficient and provide better results. In an Automatic method, the IIF test has been performed with the assistance of transfer learning or machine learning. Convolutional Neural Network (CNN) is used for feature extraction automatically by tuning the convolutional layers. It involves the number of max pooling and flattering layers, providing full access to the hiding layers [6]. Transfer learning is a further subdivision of deep learning in which different models are used to train those neural networks already being solved. One or more trained layer of one model is being used in another trained model. It is generally a supervised learning context in which the initials are identical but have different outputs [7]. Transfer learning results in fewer generalization errors and less process time required [8]. A variety of models of transfer learning, including VGG-16, Inception V3, Dense Net 121, and Mobile Net, are used to train data sets of medical images. These models are used to pre-train datasets containing medical images to detect autoimmune diseases in the human body. Some datasets of medical images are very short and have a minimal number of images. To solve the problem, data augmentation and fine-tuning are the best ways to artificially increase the size of medical images through wrapping and a sampling of data. It improves the features of images while keeping the label images in their original position [9]. Colour transformation, transfer neural, and erasing type are examples of data augmentation parameters. More data augmentation is taken artificially from the source and added to a trained dataset. To address the overfitting issue, a dataset of medical images was first pre-trained using transfer learning, followed by data augmentation and fine-tuning. Finally, the results are evaluated using confusion matrix parameters. Model performance must be classified using specific parameters such as precision, recall, F1 measures, and accuracy. Every model shows their distinct value of accuracy, precision, recall, and F1 measures. Regarding performance, the VGG16 model shows 78.000% accuracy, Inception V3 92.000%, Dense Net 121 95.000%, and Mobile Net 88.000%. Dense Net 121 has the highest accuracy among all due to optical optimization; in this feature, extra layers are removed from the training data to reduce the overfitting of images. These are used to determine which models are most effective for analyzing autoimmune diseases. The comparison in Table 1 identifies that the current research is more reliable than the existing ones. The baseline paper followed the Computer Aided Diagnostic (CAD) approach for autoimmune detection. The author proposed an automated solution for detecting autoimmune diseases in Human Epithelial cells (HEP) type II cells and image classification based on Subclass Discriminant Analysis (SDA) and achieved 90% accuracy in their results. The performance has been improved in the current research, showed 95% accuracy in results, and defeated the current work.
The remainder of the paper is constructed as follows: Section 2 depicts Related Work, while Section 3 explains the Proposed Work of using CNN models or classification of immune diseases. Section 4 contains the results of the experimental analysis, while Section 5 contains the conclusion.
Bar et al. [10] described their work using a nearest-neighbour classifier, which was used to modify partial components of images. Foggia et al. investigated several different types of hand-crafted features that did not work automatically, and those features were used to test their ability to hold certain applicable elements required for cell identification. Catalano et al. presented their work on the Grey-Level Co-Occurrence Matrix (GLCM), which had been used for image classification. William et al. created code books to study various feature descriptors. Shin et al. [11] described Local Binary Patterns (LBP) for feature analysis and as input data for classifiers. Kather et al. [12] described textural and statistical features for image detection and classification. The essential feature in the analysis was the grey zone matrix, a type of statistical feature used for image classification. Zuo et al. [13] investigated Light Emitting Diode (LED) coding for feature analysis and used it as initial data for the Support Vector Machine (SVM) classifier. Several handcrafted features were mentioned in the quasi-exhaustive literature review. Poostchi et al. [14] investigated several different features such as morphological, global, rotation invariant, and so on for feature extraction, as well as several different types of linear binary patterns for cancer disease identification in different hybrid types of cells. Chelghoum et al. [15] described several techniques in which various multi-algorithms were formed to divide object classes, minimize intra-variance, and maximize inter-variance of classes based on features. It had been done for automated detection of lesion areas for classified diseases such as malaria. Most of the presented classification algorithms followed the same steps: image preprocessing, segmentation, extraction, and classification [16]. Farooqi et al. [17] discussed big data in the healthcare field and the hurdles like ICT and security challenges through which big data must be adopted successfully. Deniz et al. [18] described the images of mining and the detection of the performance of transfer learning models. The images were investigated using image-based software artefacts, and the paper did not discuss big data [19,20]. COVID-19 detection using X-ray analysis of the chest was discussed by Swati et al. [21]. Khan et al. [22] explained the new technology of Wireless Sensor Networks (WSN), which collects information from sources and delivers it to their destination wirelessly. Transfer learning was used in their study, and four different models were trained on a dataset of chest X-Ray images, and their performance measures were examined.
Badawi et al. [23,24] explained rice diseases on plant using advanced deep learning techniques and well-known models of transfer learning were also used to compare these models without using fine-tuning or data augmentation, and the results of their work showed that the efficiency of models was nearly 92.3% . The conventional Machine Learning-based method has been improved over the past few decades, but it still needs to improve its accuracy. Al-Kahtani et al. [25] studied the Internet of Things (IoT) in health care to collect data ideally for the necessary analysis, especially during COVID-19.
The existing research on deep learning is based on artificial neural networks with several hidden layers that function as a classifier. These are used to introduce advanced image classification technology [26]. Generally, various mathematical phenomena work behind all of these classifications, providing them with a proper framework. Finally, all previous related work based on applying deep learning for the detection of autoimmune diseases was discussed, as well as limitations of their works have also been mentioned. These limitations serve as a starting point for future research [27]. The technology of indirect autoimmune fluorescence detection is critical for detecting and analysing autoimmune diseases [28]. Scientists provide a three-step analysis for it; in the first step, fluorescence light passes through the body’s cells, and then in the second step, their intensity can be calculated and finally classify them as negative, positive, or intermediate. These favourable and intermediate are further classified into six types of staining patterns. These processes are managed with a Computer Aided Diagnostic system (CAD) [29].
i) Indirect Autoimmune Fluorescence (IIF): IIF is the most commonly used method for detecting and testing Anti-Nuclear Antibodies. It is best suited to display high-quality images for ANA testing. IIF is an image-based test used to analyze autoimmune diseases in the human body, such as skin and joint diseases [30,31]. There are nearly 80 different types of autoimmune diseases that exist and produce severe an impact on the human body. IIF acts as a substrate for HEP Type II cells (shown in Fig. 1) and is used in humans to detect autoantibodies. These antibodies cause autoimmune diseases by damaging normal body cells [32]. IIF is used as a reference for analyzing autoimmune immune system diseases in normal body cells. The IIF test detects the presence or absence of antibodies and provides a wealth of additional information [33]. The European Association for Social Innovation (EASI) has also recognized these antibodies. It also mentioned several clinically relevant IIF data [34].
ii) IIF Analysis Procedure: The IIF test has been performed in three stages. Light passes through the body’s normal cells in the first stage. Secondly, light intensity is classified as positive, negative, and intermediate signals. Finally, positive and intermediate signals are further classified into six staining patterns: cytoplasmic, centromere, nucleolar, refined speckled, homogeneous, or coarse speckled, as shown in Fig. 1.
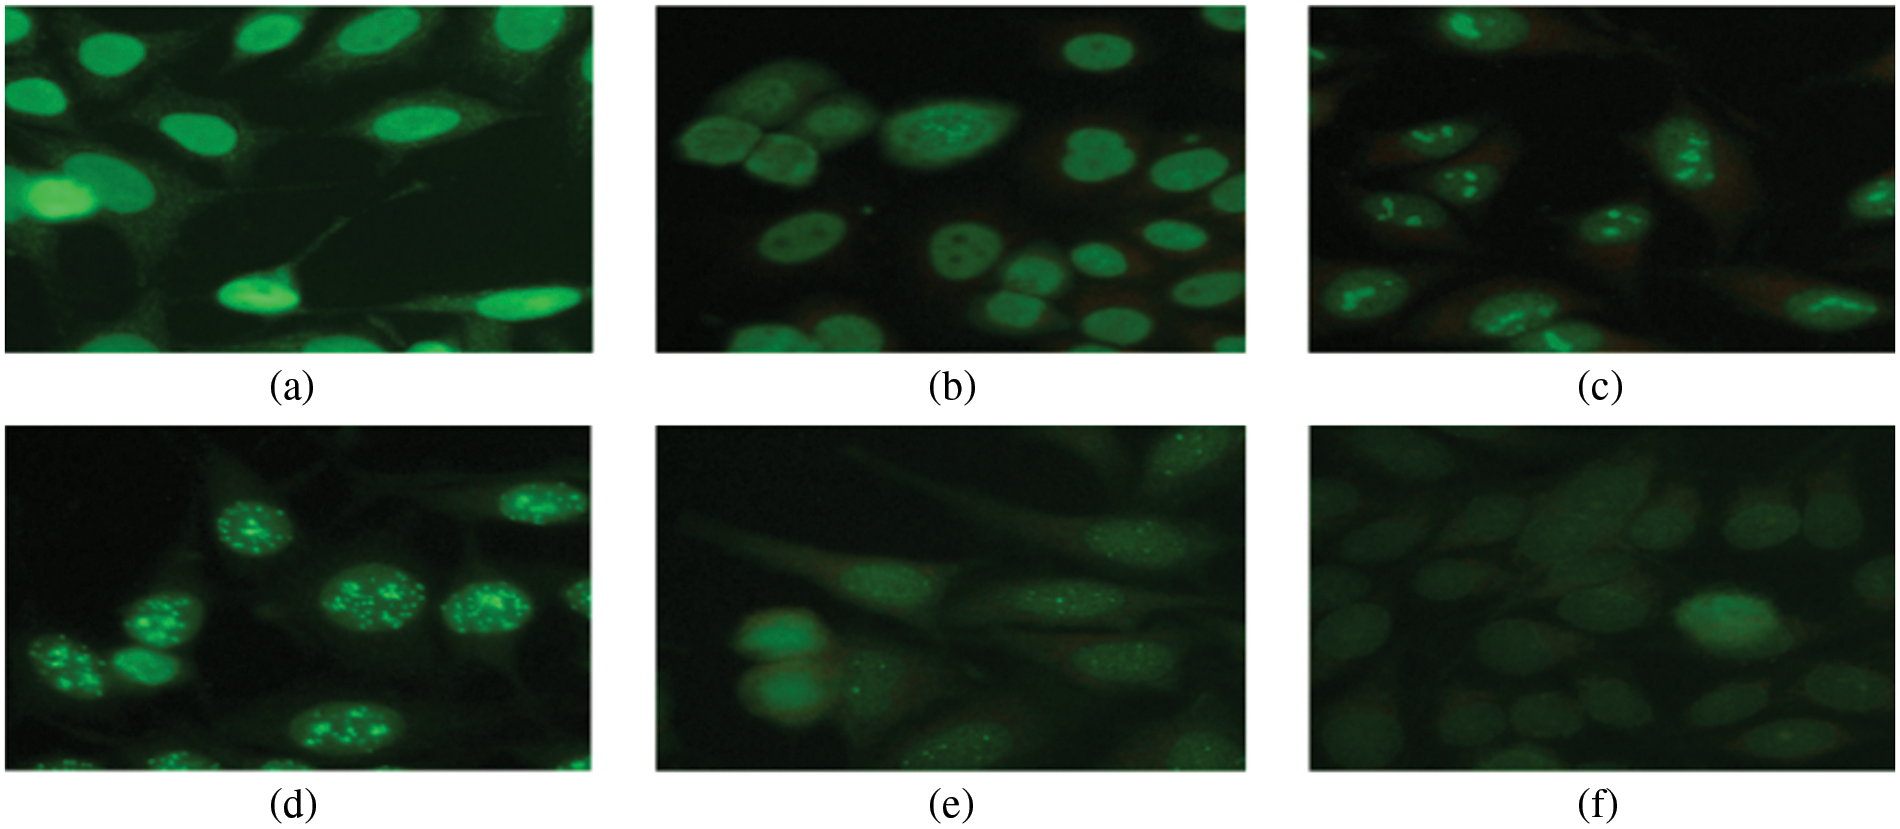
Figure 1: Six staining patterns of Hep-2 type II cells
The IIF can perform manually and automatically; however, manual IIF takes significant time and effort. IIF has been automatically performed by using a CAD. IIF is primarily performed in the medical field using CAD to reduce time and flaws in results. Fig. 2 shows the whole process of IIF analysis.
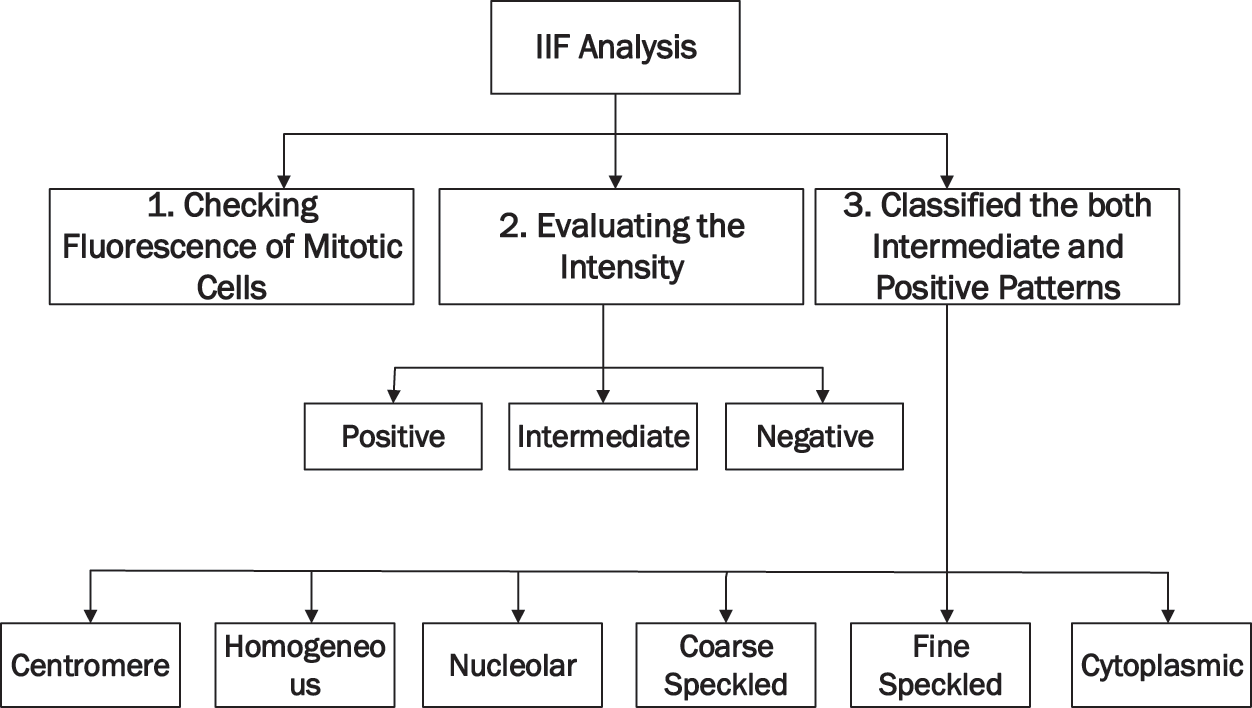
Figure 2: IIF process of analysis
The research has been carried out on a MIVIA data set using Python language for their experimental analysis, and Co-lab is used as a stimulator of Python. The MIVIA dataset has been used to train on the most popular transfer learning models, including Inception V3, VGG-16, Dense Net 121, and Mobile Net. Data augmentation and fine-tuning are later used to improve model performance and solve the problem of overfitting in medical image data. Fig. 3 depicts the proposed work’s framework.
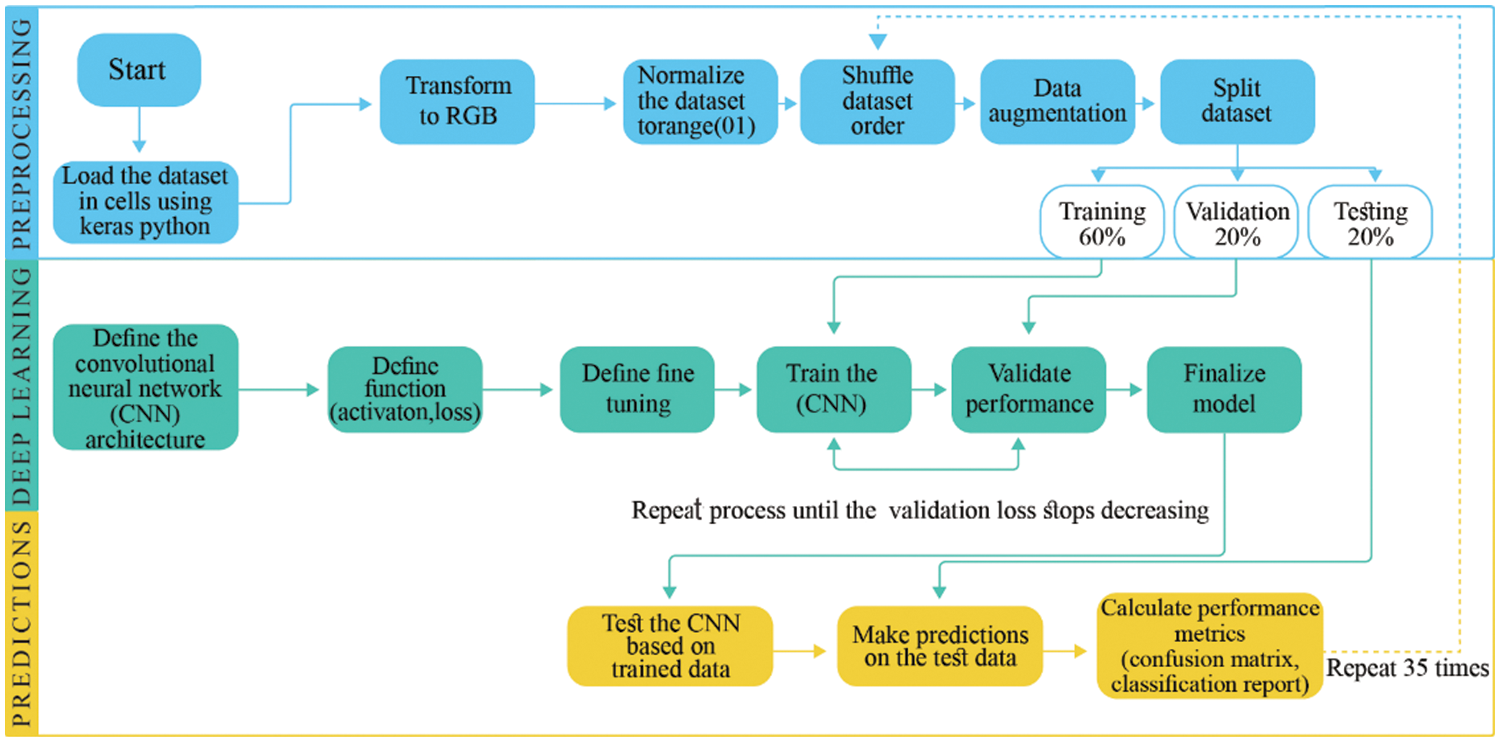
Figure 3: Framework of proposed solution
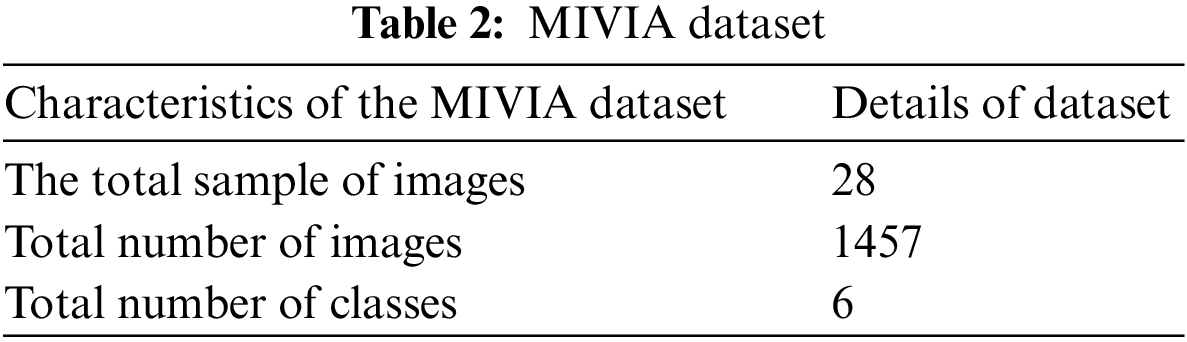
The MIVIA data set of HEP type II contains 1457 images. Table 2 shows how these images are classified into six different classes. The MIVIA data set is easily accessible via online resources.
Python is a programming language used in research, and it runs on a web-based application called Colab. Colab and Python use a single interface and require little human effort to solve a complex problem. Python has its own set of libraries, each performing its function. For example, Numpy is used for image visualization, Pandas for data framework, SK learns for model selection, and Keras for deep learning modelling. All of these libraries are used to stimulate research work.
3.2.1 Transform to RGB (Red Green Blue)
RGB’s function is to convert image data into a greyscale. It aids in data training with minimal time investment and requires less memory for model execution. RGB is a colour-coding system for black and white colours.
3.2.2 Data Augmentation and Normalization
It has been required to use the standard type of features to minimize overfitting in data and converts them into digits of 0 and 1, and this method is commonly known as a label of coding. In the preceding step, data augmentation addresses the issue of dataset oversizing during model training. Data augmentation is a deep learning-based method for creating new data from existing data.
3.2.3 Model Convolutional Neural Network (CNN)
CNN works on machine learning principles, taking initial images and assigning multiple tasks to different image components to differentiate them. CNN requires very little preprocessing when compared to other methods. In the traditional method, image filters were created by humans after much effort, and Fig. 4 depicts the entire structure of CNN [35].
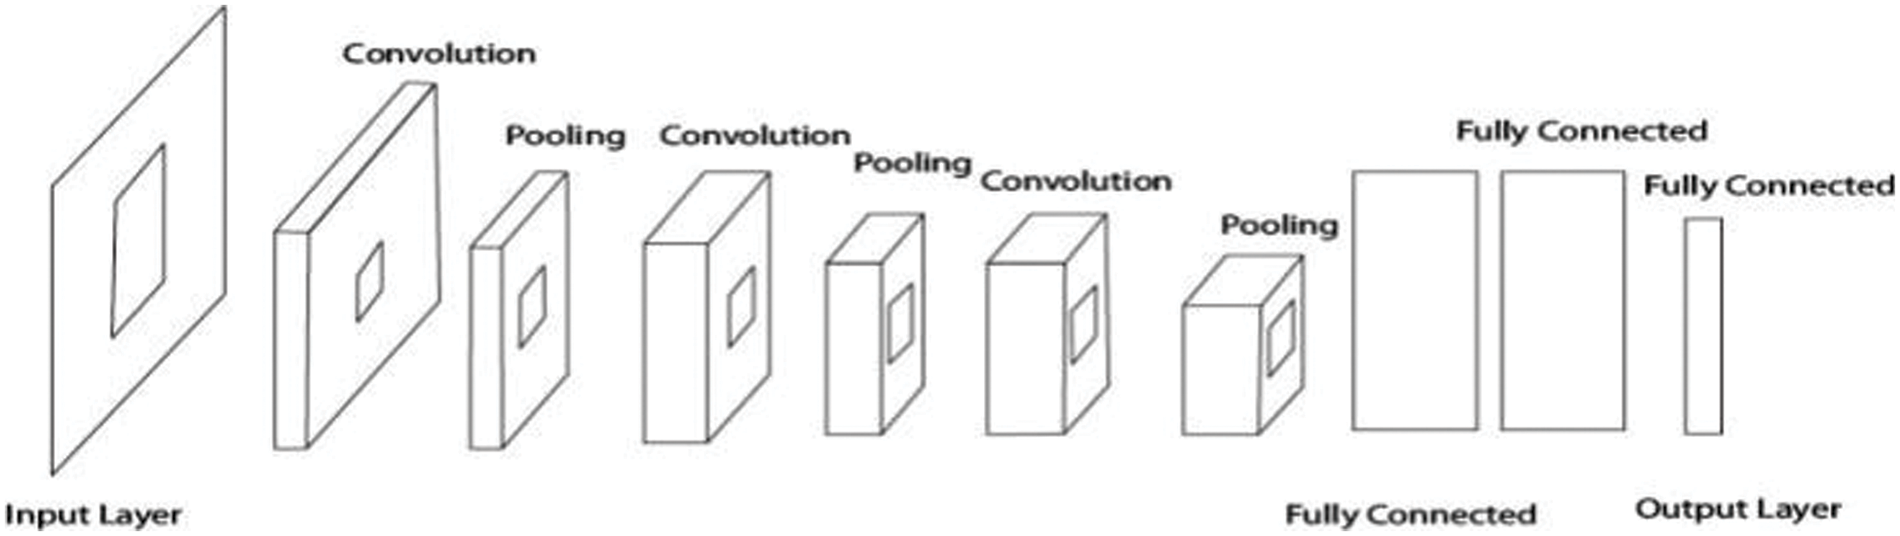
Figure 4: Convolutional neural networks (CNN)
Four different transfer learning models have been run to train the dataset in the proposed research work. Such as
i) Mobile Net
ii) Inception V3
iii) Dense Net-121
iv) VGG-16
All of these models are advanced transfer learning models that are used for image processing. These models also use deep learning algorithms and different versions of CNN models.
It is necessary to assess the efficiency of all transfer learning models and draw conclusions using a confusion matrix. These matrices indicate the accuracy of the proposed research. The efficiency of models is evaluated using all four parameters of the confusion matrix, as shown in Fig. 5.
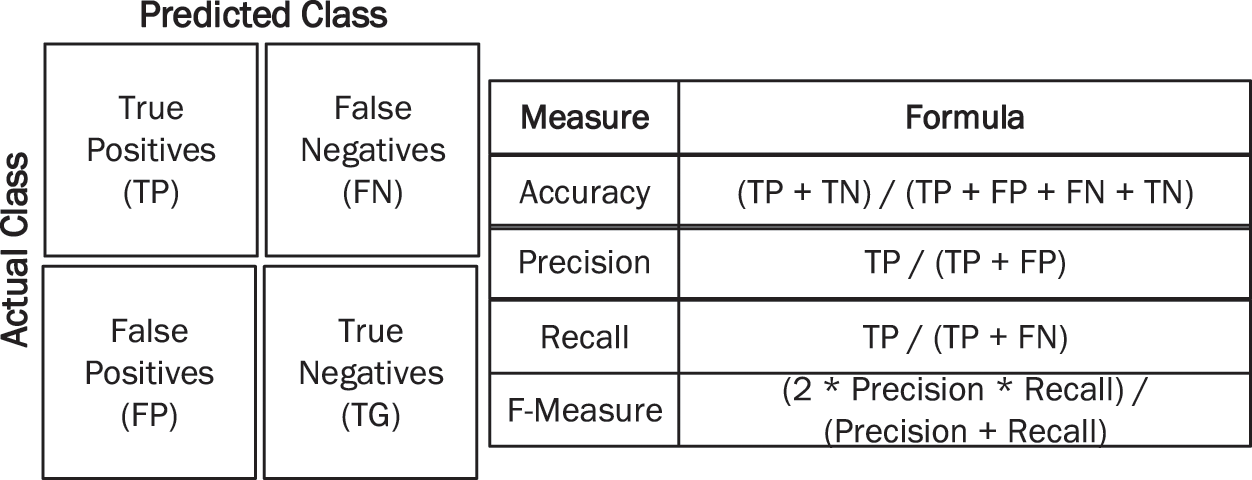
Figure 5: Performance measures
3.2.5 Classification and Comparison
Finally, the results of all these models are compared using confusion matrix parameters (precision, accuracy, F1 measures, and recall). It is a comparative analysis to compare the performance of all models and determine which model is best for disease analysis in the human defence system.
All results and practical implementation of transfer learning models for detecting and analysing autoimmune disease are explained in work mentioned. For prediction and classification, a deep learning approach and CNN is used. Finally, the results of all transfer learning models have been compared in terms of accuracy, precision-recall, and F1 measures. The following steps are used to perform research work.
The scaling feature is used to normalize independent features of the data. Scaling, standardization, and normalization of image features are accomplished in two ways.
• Standardization: As expressed in Eq. (1), the process excludes the observed observation using complete observations. Columns are divided using the standard deviation method, and then observation will occur [36].
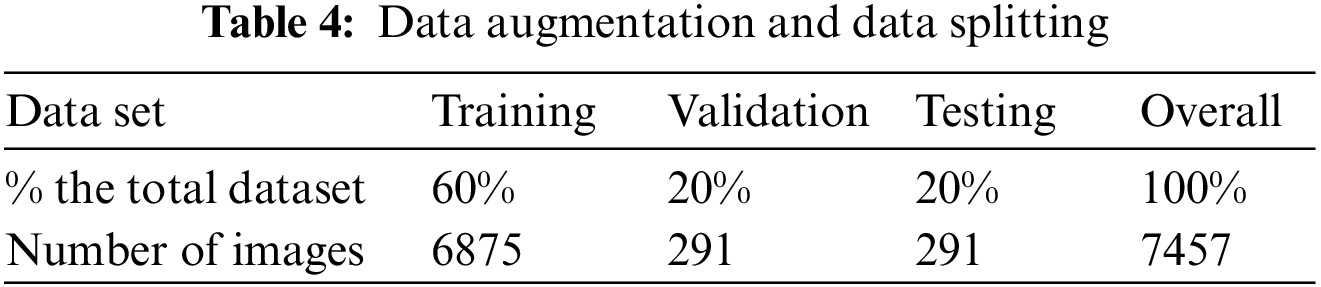
4.2 Data Augmentation and Data Splitting
The augmentation and splitting improve already trained data using an advanced data set. There are 1457 images in the data, and it generates 6875 training sets. Table 3 describes data splitting and data augmentation.
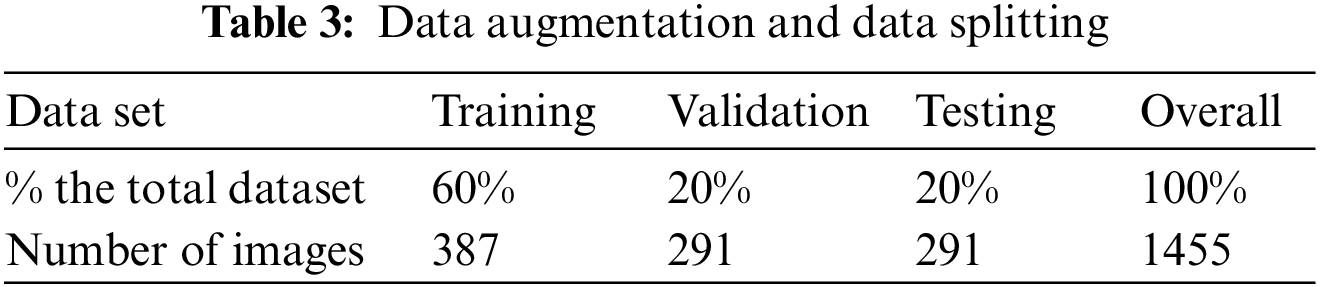
Table 4 shows the values for training at 60%, validation at 20%, testing at 20%, and the complete dataset at 100%. The same method is used for data augmentation, yielding 6875 training sets.
4.3 Models of Transfer Learning
Four different transfer learning models have been trained for research below.
The VGG-16 model is well-known for transfer learning and is used to train CNN on image Net datasets. VGG-16 has 14 million images and 22,000 different categories. VGG-16 achieved the highest possible accuracy in image training, but millions of images were trained. The VGG-16 confusion matrix is depicted in Fig. 6.
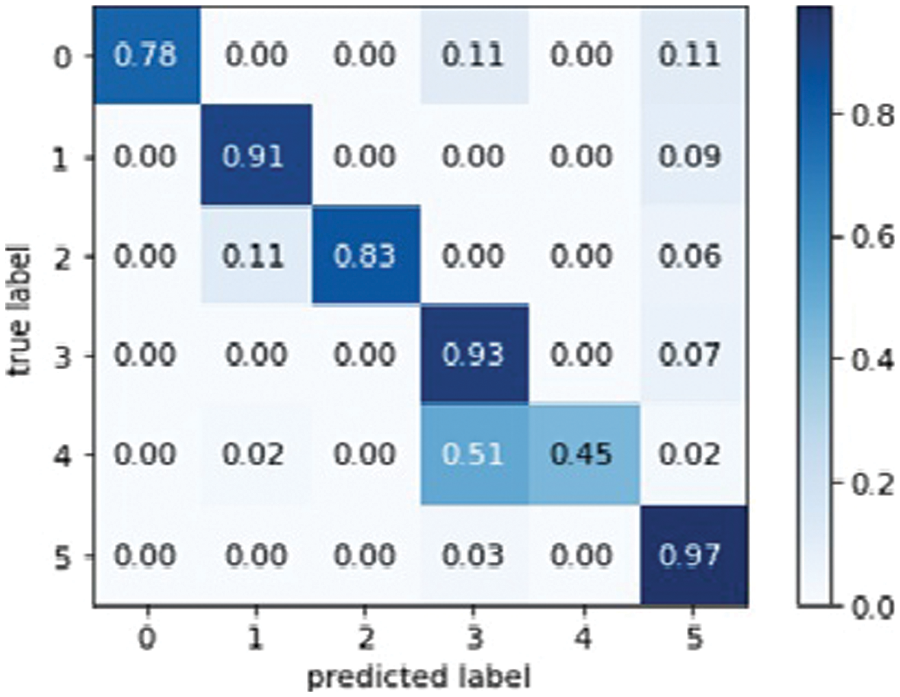
Figure 6: VGG16 model confusion matrix
The confusion matrix of VGG-16 explains the total actual and predicted label. Fig. 7 below represents the VGG-16 model training accuracy and validation accuracy.
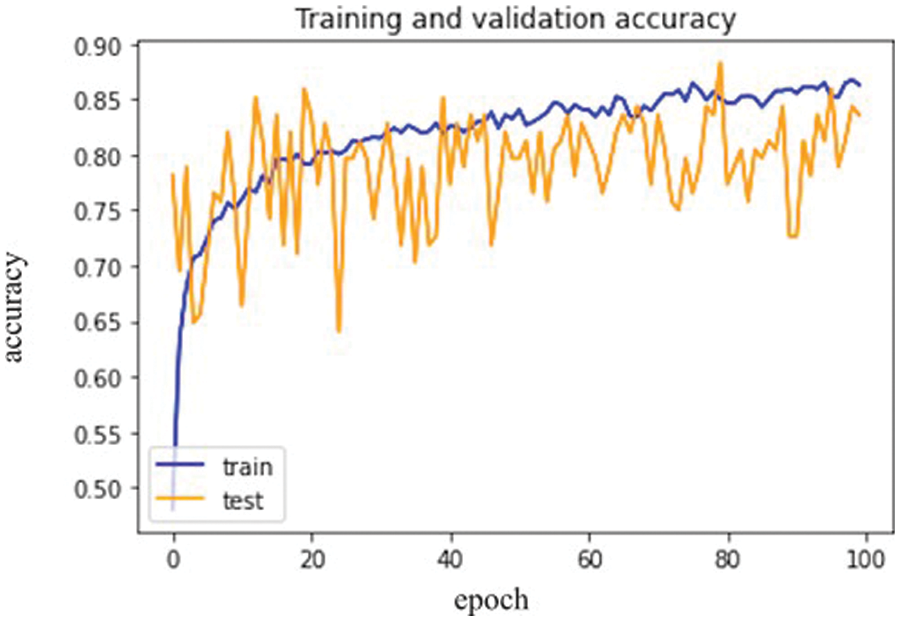
Figure 7: VGG-16 model epochs (x-axis) and accuracy (y-axis)
Fig. 8 below represents training loss as well as validation loss.
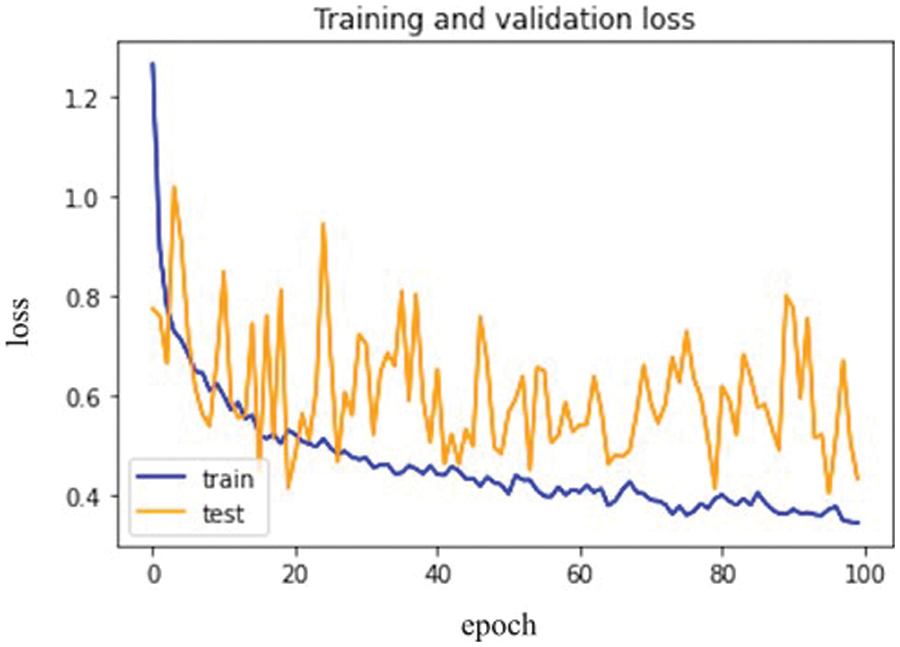
Figure 8: VGG-16 model epochs (x-axis) and Loss (y-axis)
As a result, the loss validation percentage is meagre compared to the training results. Table 5 summarizes the precision, recall, F1 measures, and accuracy results. In terms of performance, the results show that model’s accuracy is 78.000%, F1 measures are 79.500%, recall is 81.333%, and the obtained precision score is 85.000%.

Except for the last fully connected layer, the Inception V3 model is used. This final layer makes all the layers untrainable and only trains the lower layer with the help of transfer learning. The lower layer is trained to improve the model’s efficiency and get the best possible results. Fig. 9 represents the Inception V3 confusion matrix.
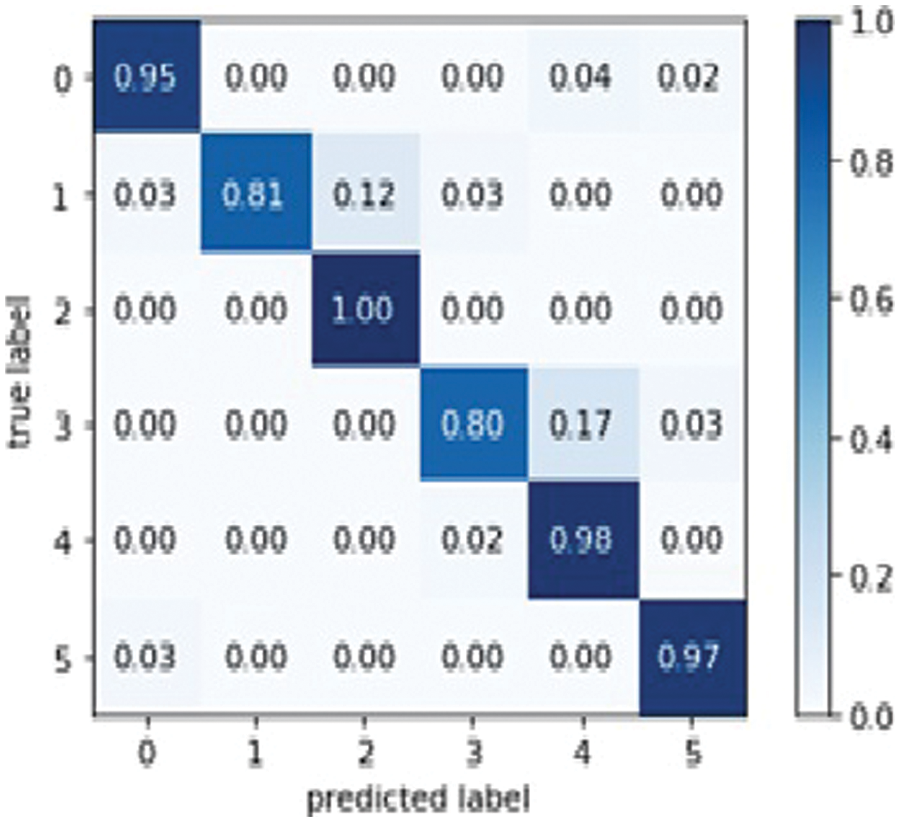
Figure 9: Inception V3 model confusion matrix
The results in Fig. 10 below show the Inception V3 model training accuracy and validation accuracy.
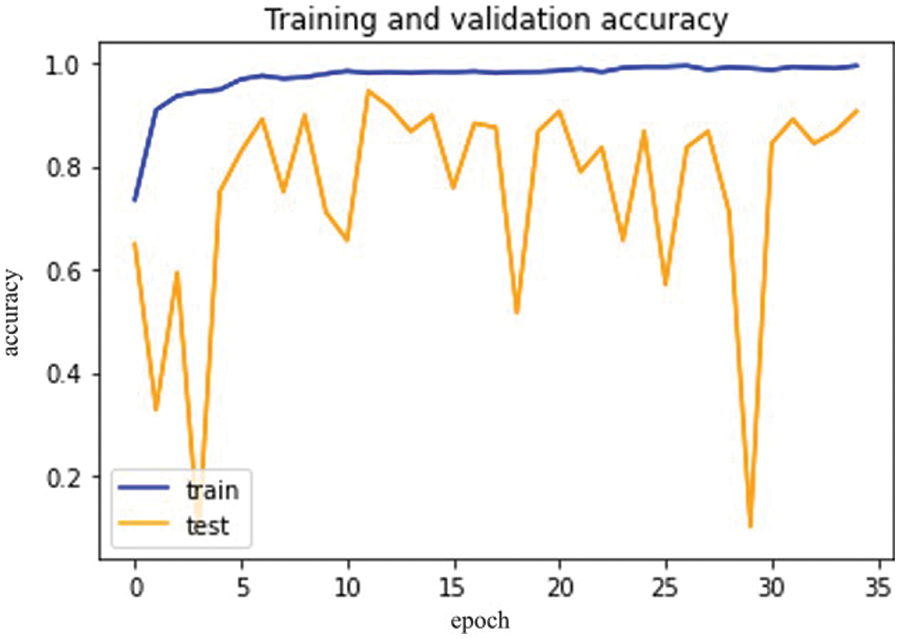
Figure 10: Inception V3 model epochs (x-axis) and accuracy (y-axis)
Fig. 11, mentioned below, shows the differentiation between training and validation loss.
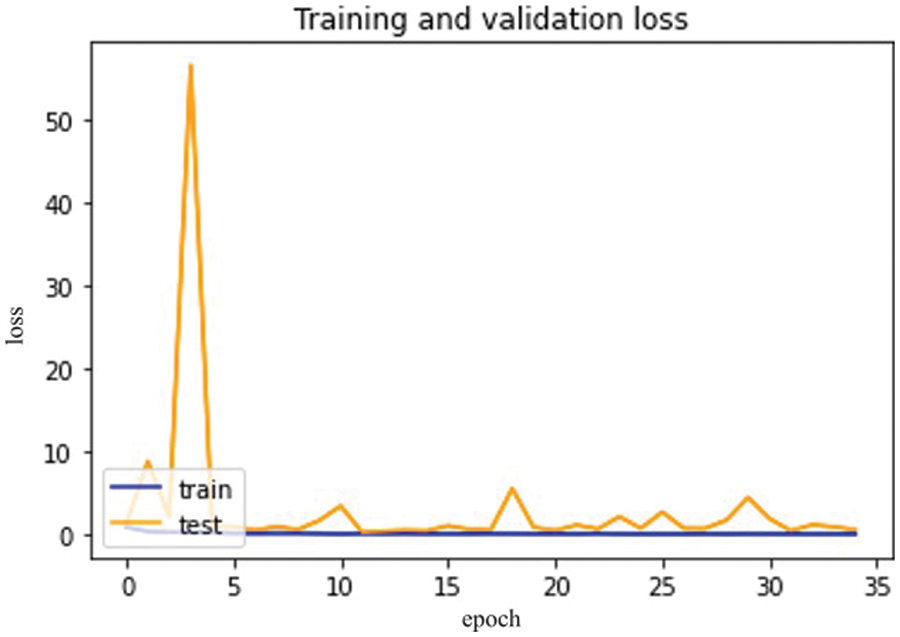
Figure 11: Inception V3 model epochs (x-axis) and loss (y-axis)
So, in results, loss validation shows a very minimal percentage as compared to training results. Table 6, mentioned below, explains the results regarding precision, recall, F1 measures, and accuracy.

In terms of their performance, the results show that the model’s accuracy is 92.000%, F1 measures are 91.666%, recall is 91.833%, and the obtained precision score is 92.166%.
Dens Net 121 is explicitly created to modify vanishing gradients. A high-level neural network is to blame for the decrease in accuracy. Model optical optimization is used in Dens Net 121 rather than other models. Model optical optimization is used to assess the impact on model construction and performance [37]. Fig. 12 depicts the Dense Net 121 confusion matrix.
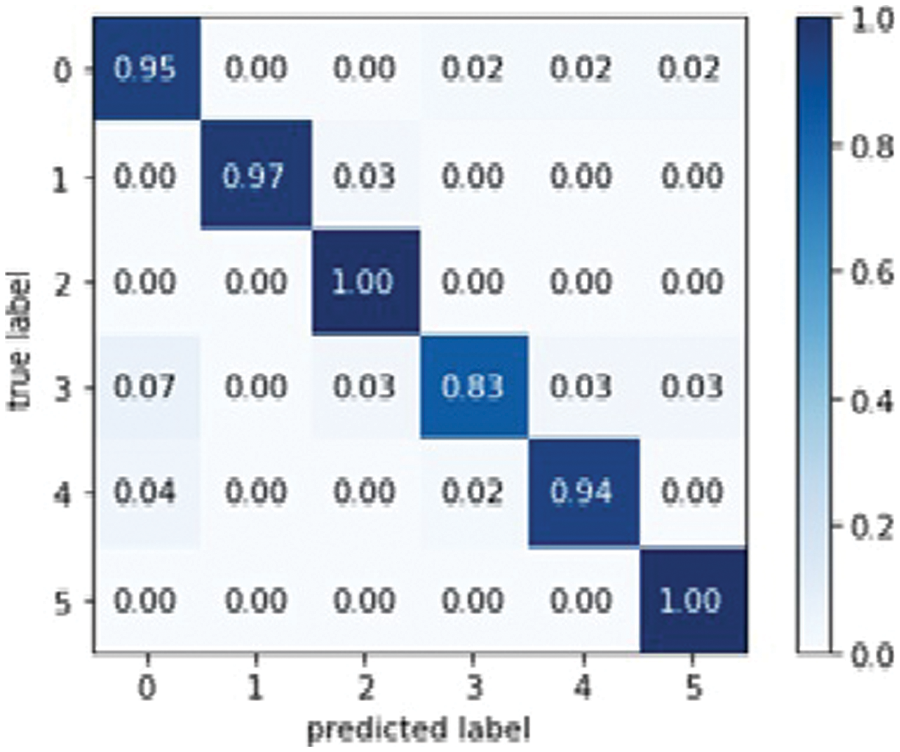
Figure 12: Dens Net 121 model confusion matrix
The below Fig. 12 shows proposed model training and validation accuracy.
The difference between validation and training scores is depicted in Fig. 13. The validation and training accuracy are represented by the x and y-axis, respectively. Fig. 14 depicts the distinction between training and validation loss.
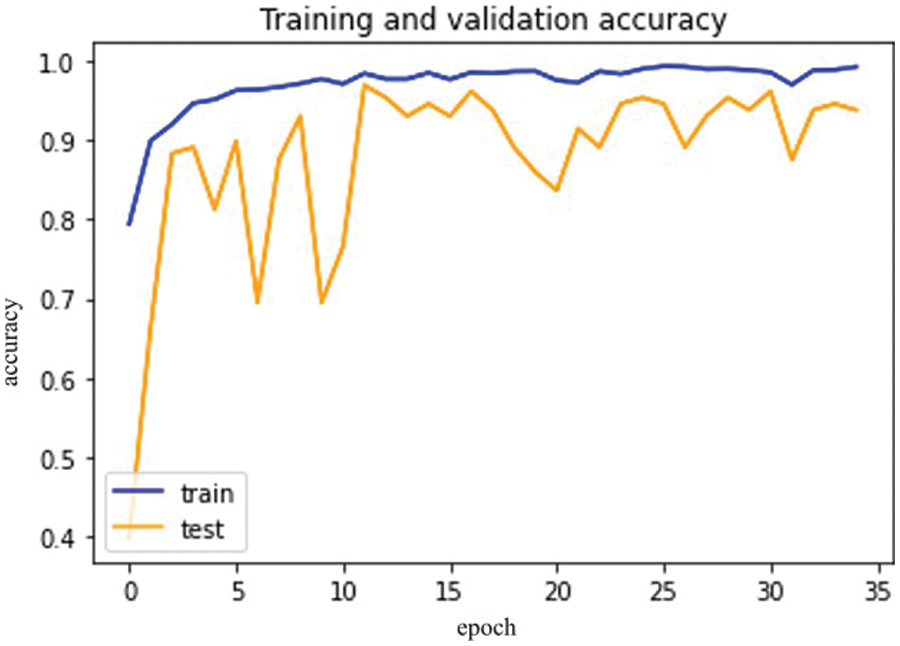
Figure 13: Dense Net-121 model epochs (x-axis) and accuracy (y-axis)
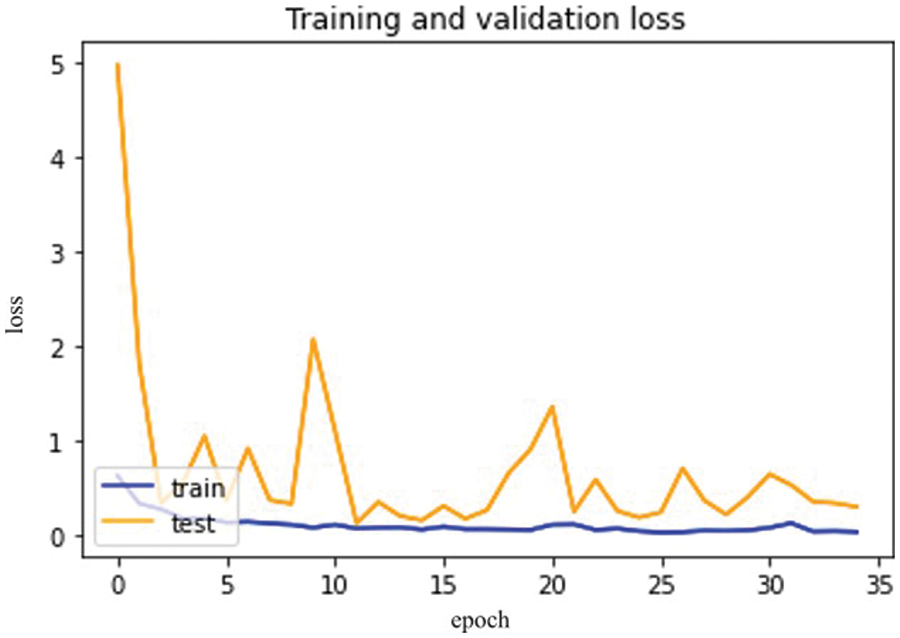
Figure 14: Dense Net-121 model epochs (x-axis) and losses (y-axis)
So, in the results, validation loss shows a very minimal percentage compared to training results. Table 7, mentioned below, explains the results regarding precision, recall, F1 measures, and accuracy.
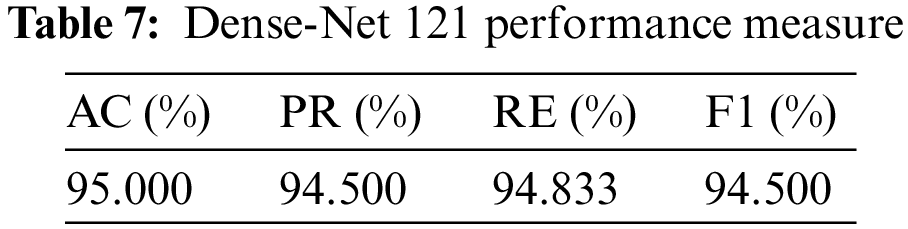
In terms of performance, results show that the model’s accuracy is 95.000%, F1 measures are 94.500%, recall is 94.833%, and the obtained precision score is 94.500%.
It is one of the first computer vision models based on mobile devices. The Mobile Net model is used to improve accuracy and minimize flaws. This model type aggregates deep learning classification performance [38]. Fig. 15 represents the Mobile Net Confusion Matrix.
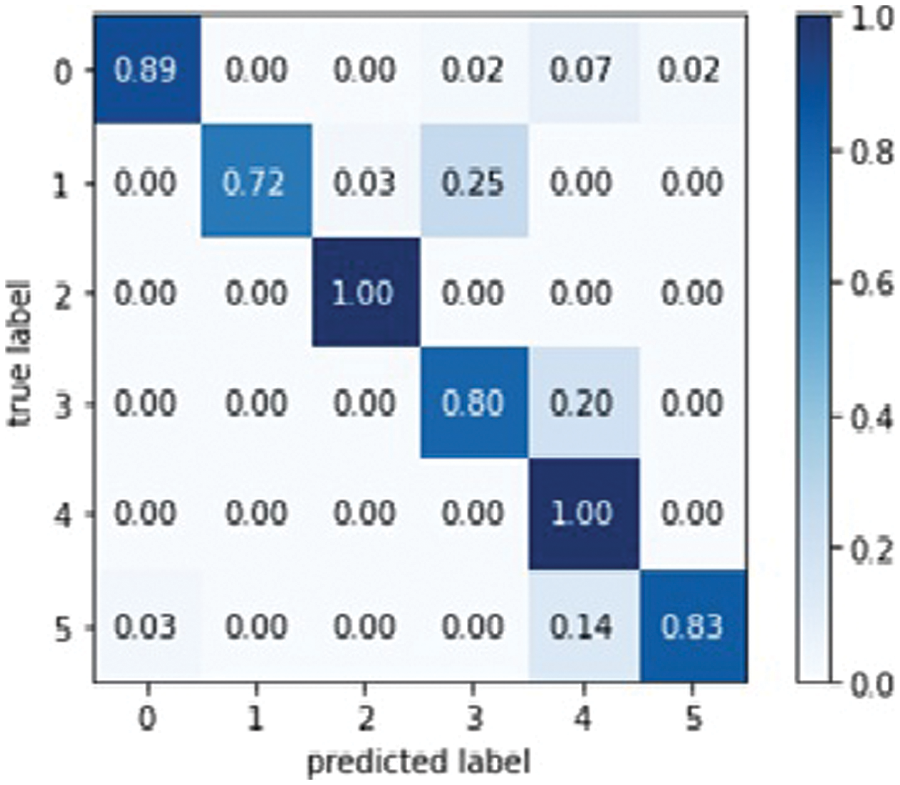
Figure 15: Mobile Net model confusion matrix
Based on Mobile Net Model, Fig. 16 for training and validation accuracy is below.
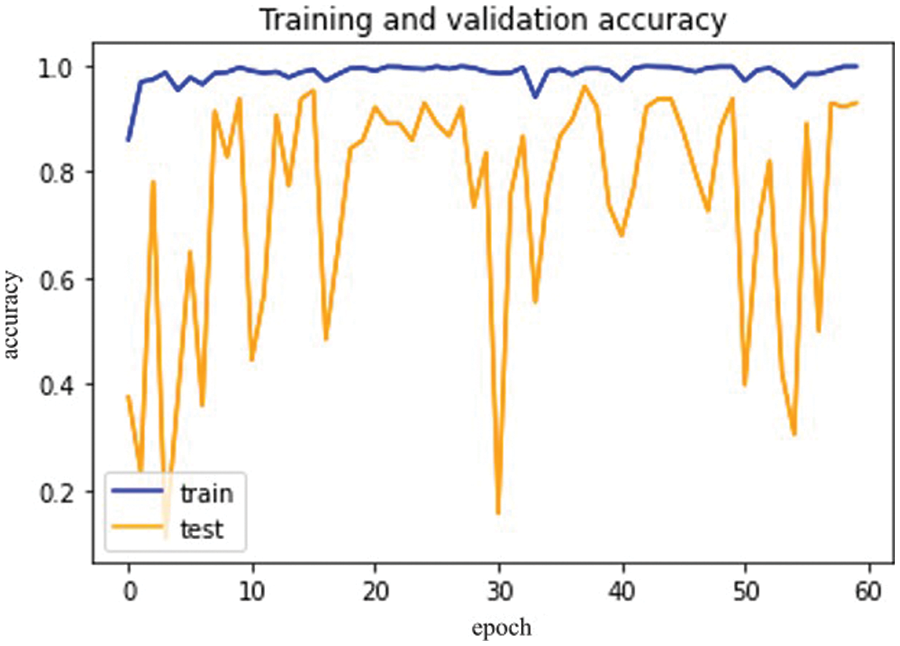
Figure 16: Mobile Net model epochs (x-axis) and accuracy (y-axis)
The difference between training and validation loss is shown in Fig. 17 below.
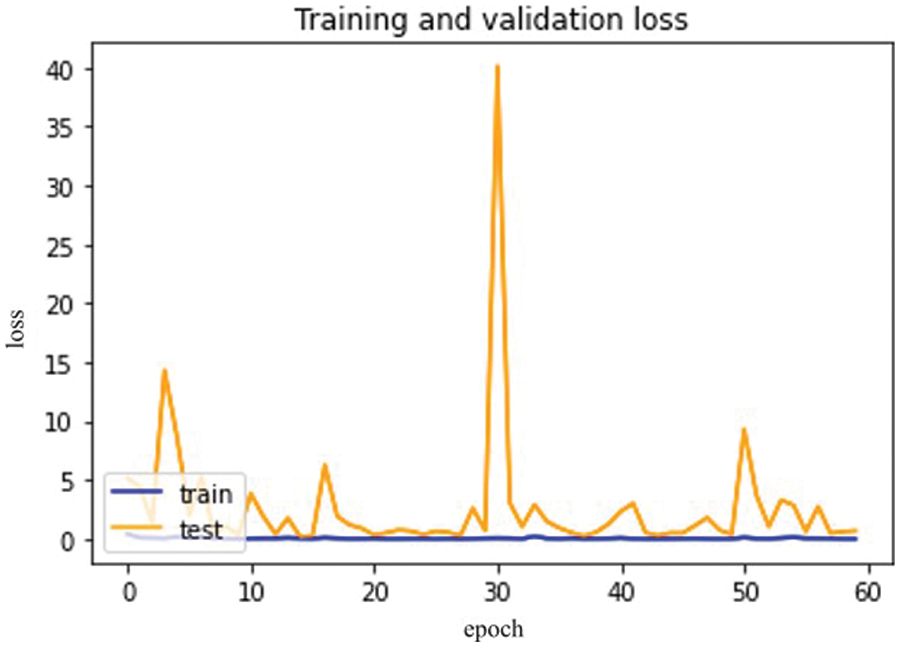
Figure 17: Mobile Net model epochs (x-axis) and loss (y-axis)
So, in the results, validation loss shows a very minimal percentage compared to the training results. Table 8, mentioned below, explains the results regarding precision, recall, F1 measures, and accuracy.
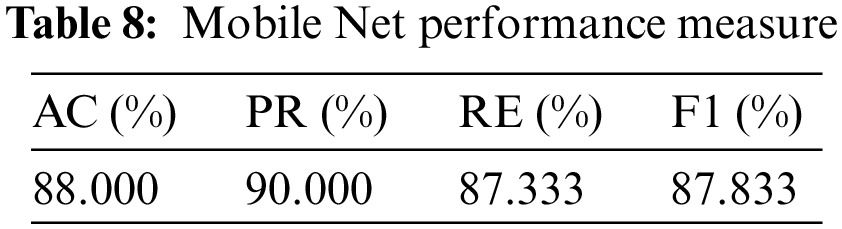
In terms of their performance, the results show that the model’s accuracy is 88.000%, F1 measures are 87.833%, recall is 87.333%, and the obtained precision score is 90.500%.
Table 9, given below, shows the comparison between the accuracy of all these four models.
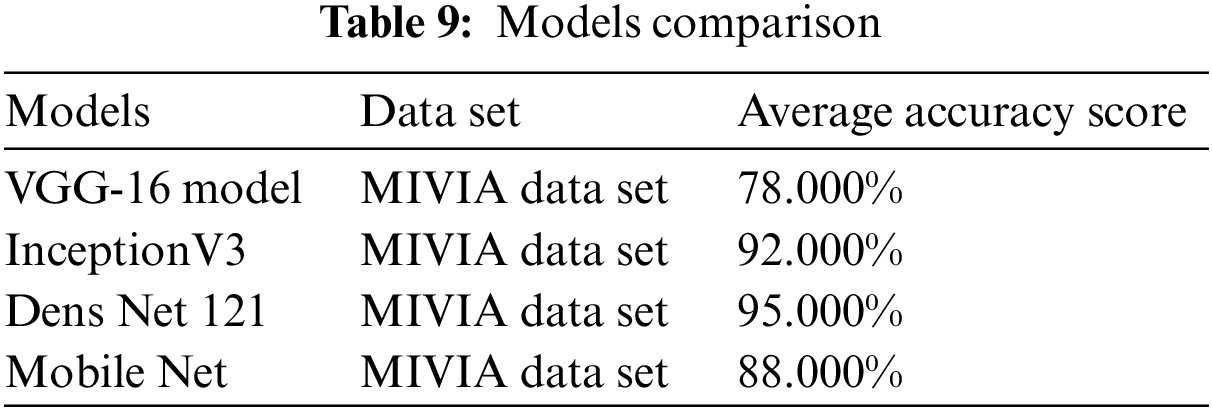
VGG-16 has an accuracy of 78.000%, Inception V3 has an accuracy of 92%, Mobile Net has an accuracy of 88%, and Dense Net 121 is 95.000% for detecting and analyzing autoimmune diseases. Due to the model optimization feature, Dens Net 121 has the highest accuracy of all models. In Dens Net 121 model optimization, extra layers are removed from the training data to avoid overfitting and complexity. The Dens Net model has achieved the highest accuracy among all proposed models.
The proposed research aims to explain the step-by-step methodology for detecting autoimmune diseases using an advanced Convolutional Neural Network (CNN) based deep learning approach instead of a manual one. It is the most efficient technique used to analyze images related to medical health. The MIVIA dataset of HEP type II cells has been used as a reference for detecting autoimmune diseases. These medical images have been inserted using specialized libraries to read and write the data. The data augmentation technique is used for sizing and dividing data into dependent and independent classes. After data augmentation, the images are trained on four well-known models of transfer learning VGG-16, Inception V3, Dens Net 121, and Mobile Net. Transfer learning is a subdivision of deep learning in which different models are used to train those neural networks already being solved. The parameters of the confusion matrix have measured the performance of all these four models in terms of precision, accuracy, recall, and F1 measures. Mobile Net achieved 88.000% accuracy, Dens Net 121 achieved 95.00%, Inception V3 achieved 92.00%, and VGG-16 achieved 78.000% accuracy. Among all of these models, Dens Net 121 has the highest accuracy for detecting and analyzing autoimmune diseases due to the feature of model optimization. Transfer learning is a highly effective deep-learning technique for detecting autoimmune diseases with the highest possible accuracy.
The major contribution of the proposed work is to detect autoimmune disease by using Convolutional Neural Network (CNN) based transfer learning approach. By using transfer learning best possible accuracy has been achieved by up to 95% which easily helps to detect autoimmune diseases in the human body efficiently.
It is necessary to perform more practical work and generate new algorithms of deep learning in the future. It will show reliable results with minimum time and effort.
Tunning optimization of models has been required to achieve more accurate results for the detection of autoimmune diseases. Secondly, it is necessary to use the dropout method instead of augmentation and normalization to resolve the problem of overfitting which randomly dropout the hiding layers of images.
Acknowledgement: The authors would like to acknowledge Prince Sultan University and EIAS Lab for their valuable support. Further, the authors would like to acknowledge Prince Sultan University for paying the Article Processing Charges (APC) of this publication.
Funding Statement: This work was supported by the EIAS Data Science and Blockchain Lab, College of Computer and Information Sciences, Prince Sultan University, Riyadh Saudi Arabia.
Author Contributions: The authors confirm contribution to the paper as follows: study conception and design: F. Muhammad, J. Khan, F. Ullah; data collection: A. Ullah; analysis and interpretation of results: F. Muhammad, F. Ullah, G. Ali, I. Khan; draft manuscript preparation: F. Muhammad, R. Khan, G. Ali; Validation: M. E. Affendi, I. Khan; Supervision: J. Khan, A. Ullah. All authors reviewed the results and approved the final version of the manuscript.
Availability of Data and Materials: The data is on google drive :https://drive.google.com/drive/folders/1Vr4w3jQ2diY3_eR59kBtVbkyxNazyI_8?usp=sharing.
Conflicts of Interest: The authors declare that they have no conflicts of interest to report regarding the present study.
References
1. B. Grygiel-Górniak, N. Rogacka and M. Puszczewicz, “Anti-nuclear antibodies in healthy people and non-rheumatic diseases-diagnostic and clinical implications,” Reumatologia, vol. 56, no. 4, pp. 243–248, 2018. [Google Scholar]
2. N. Agmon-Levin, J. Damoiseaux, C. Kallenberg, U. Sack, T. Witte et al., “International recommendations for the assessment of autoantibodies to cellular antigens referred to as anti-nuclear antibodies,” Annals of the Rheumatic Diseases, vol. 73, no. 1, pp. 17–23, 2014. [Google Scholar] [PubMed]
3. N. Bizzaro, A. Antico, S. Platzgummer, E. Tonutti, D. Bassetti et al., “Automated antinuclear immune of fluorescence antibody screening: A comparative study of six computer-aided diagnostic systems,” Autoimmunity Reviews, vol. 13, no. 3, pp. 292–298, 2014. [Google Scholar] [PubMed]
4. R. Hiemann, T. Büttner, T. Krieger, D. Roggenbuck, U. Sack et al., “Challenges of automated screening and differentiation of non-organ specific autoantibodies on HEp-2 cells,” Autoimmunity Reviews, vol. 9, no. 1, pp. 17–22, 2009. [Google Scholar] [PubMed]
5. A. Rigon, F. Buzzulini, P. Soda, L. Onofri, L. Arcarese et al., “Novel opportunities in automated classification of antinuclear antibodies on HEp-2 cells,” Autoimmunity Reviews, vol. 10, no. 10, pp. 647–652, 2011. [Google Scholar] [PubMed]
6. W. Khan, K. Raj, T. Kumar, A. M. Roy and B. Luo, “Introducing Urdu digits dataset with demonstration of an efficient and robust noisy decoder-based pseudo example generator,” Symmetry, vol. 14, no. 10, pp. 1976, 2022. [Google Scholar]
7. L. Vivona, D. Cascio, V. Taormina and G. Raso, “Automated approach for indirect immunofluorescence images classification based on unsupervised clustering method,” IET Computer Vision, vol. 12, no. 7, pp. 989–995, 2018. [Google Scholar]
8. C. Cascio, T. Vincenzo, C. Marco, F. Francesco, V. S. Maria et al., “HEp-2 cell classification with heterogeneous classes-processes based on k-nearest neighbours,” in 1st Workshop on Pattern Recognition Techniques for Indirect Immunofluorescence Images, Palermo, Italy, pp. 10–15, 2014. [Google Scholar]
9. A. B. Elgaaied, D. Cascio, S. Bruno, M. C. Ciaccio, M. Cipolla et al., “Computer-assisted classification patterns in autoimmune diagnostics: The AIDA Project,” BioMed Research International, vol. 9, no. 3, pp. 1–9, 2016. [Google Scholar]
10. Y. Bar, I. Diamant, L. Wolf, S. Lieberman, E. Konen et al., “Chest pathology detection using deep learning with non-medical training,” in IEEE 12th Int. Symp. on Biomedical Imaging (ISBI), Tel Aviv, Israel, pp. 294–297, 2015. [Google Scholar]
11. H. C. Shin, H. R. Roth, M. Gao, L. Lu, Z. Xu et al., “Deep convolutional neural networks for computer-aided detection: CNN architectures, dataset characteristics and transfer learning,” IEEE Transactions on Medical Imaging, vol. 35, no. 5, pp. 1285–1298, 2016. [Google Scholar] [PubMed]
12. J. N. Kather, C. Weis, F. Bianconi, S. Melchers, L. R. Schad et al., “Multi-class texture analysis in colorectal cancer histology,” Scientific Reports, vol. 6, no. 1, pp. 27988, 2016. [Google Scholar] [PubMed]
13. H. Zuo, H. Fan, E. Blasch and H. Ling, “Combining convolutional and recurrent neural networks for human skin detection,” IEEE Signal Processing Letters, vol. 24, no. 3, pp. 289–293, 2017. [Google Scholar]
14. M. Poostchi, K. Silamut, R. J. Maude, S. Jaeger, G. Thoma et al., “Image analysis and machine learning for detecting malaria,” Translational Research, vol. 194, no. 6_Suppl, pp. 36–55, 2018. [Google Scholar] [PubMed]
15. R. Chelghoum, A. Ikhlef, A. Hameurlaine and S. Jacquir, “Transfer learning using convolutional neural network architectures for brain tumor classification from MRI images,” in IFIP Advances in Information and Communication Technology, Cham: Springer International Publishing, pp. 189–200, 2020. [Google Scholar]
16. N. Best, J. Ott and E. J. Linstead, “Exploring the efficacy of transfer learning in mining image-based software artifacts,” Journal of Big Data, vol. 7, no. 1, pp. 1–10, 2020. [Google Scholar]
17. M. M. Farooqi, M. A. Shah, A. Wahid, A. Akhunzada et al., “Big data in healthcare: A survey,” in Applications of Intelligent Technologies in Healthcare, 1st ed., vol. 14. Switzerland: Springer Cham, pp. 143–152, 2018. [Google Scholar]
18. E. Deniz, A. Şengür, Z. Kadiroğlu, Y. Guo, V. Bajaj et al., “Transfer learning based histopathologic image classification for breast cancer detection,” Health Information Science and Systems, vol. 6, no. 1, pp. 18, 2018. [Google Scholar] [PubMed]
19. S. Di Cataldo, A. Bottino, I. U. Islam, T. F. Vieira and E. Ficarra, “Subclass discriminant analysis of morphological and textural features for HEp-2 staining pattern classification,” Pattern Recognition, vol. 47, no. 7, pp. 2389–2399, 2014. [Google Scholar]
20. S. Deepak and P. M. Ameer, “Brain tumor classification using deep CNN features via transfer learning,” Computers in Biology and Medicine, vol. 111, no. 3, pp. 103345, 2019. [Google Scholar] [PubMed]
21. Z. N. K. Swati, Q. Zhao, M. Kabir, F. Ali, Z. Ali et al., “Brain tumor classification for MR images using transfer learning and fine-tuning,” Computerized Medical Imaging and Graphics, vol. 75, pp. 34–46, 2019. [Google Scholar] [PubMed]
22. F. Khan, S. Ahmad, H. Gürüler, G. Cetin, T. Whangbo et al., “An efficient and reliable algorithm for wireless sensor network,” Sensors, vol. 21, no. 24, pp. 8355, 2021. [Google Scholar] [PubMed]
23. A. Badawi and K. Elgazzar, “Detecting coronavirus from chest X-rays using transfer learning,” COVID, vol. 1, no. 1, pp. 403–415, 2021. [Google Scholar]
24. K. He, X. Zhang, S. Ren and J. Sun, “Deep residual learning for image recognition,” in 2016 IEEE Conf. on Computer Vision and Pattern Recognition (CVPR), Las Vegas, USA, pp. 770–778, 2016. [Google Scholar]
25. M. S. Al-Kahtani, F. Khan and W. Taekeun, “Application of internet of things and sensors in healthcare,” Sensors, vol. 22, no. 15, pp. 5738, 2022. [Google Scholar] [PubMed]
26. A. Krizhevsky, I. Sutskever and G. E. Hinton, “ImageNet classification with deep convolutional neural networks,” Communications of the ACM, vol. 60, no. 6, pp. 84–90, 2017. [Google Scholar]
27. C. Szegedy, W. Liu, Y. Jia, P. Sermanet, S. Reed et al., “Going deeper with convolutions,” in 2015 IEEE Conf. on Computer Vision and Pattern Recognition, California, US, pp. 1–9, 2015. [Google Scholar]
28. K. He, X. Zhang, S. Ren and J. Sun, “Deep residual learning for image recognition,” in Proc. of the IEEE Conf. on Computer Vision and Pattern Recognition, Piscataway, NJ, USA, IEEE, pp. 770–778, 2016. [Google Scholar]
29. C. Krause, K. Ens, K. Fechner, J. Voigt, J. Fraune et al., “EURO pattern suite technology for computer-aided immunofluorescence microscopy in autoantibody diagnostics,” Lupus, vol. 24, no. 4–5, pp. 516–529, 2015. [Google Scholar] [PubMed]
30. D. Cascio, V. Taormina and G. Raso, “Deep CNN for IIF images classification in autoimmune diagnostics,” Applied Sciences, vol. 9, no. 8, pp. 1618, 2019. [Google Scholar]
31. P. Hobson, B. C. Lovell, G. Percannella, A. Saggese, M. Vento et al., “Computer aided diagnosis for anti-nuclear antibodies HEp-2 images: Progress and challenges,” Pattern Recognition Letters, vol. 82, no. 3, pp. 3–11, 2016. [Google Scholar]
32. D. Cascio, V. Taormina and G. Raso, “An automatic HEp-2 specimen analysis system based on an active contours model and an SVM classification,” Applied Sciences, vol. 9, no. 2, pp. 307, 2019. [Google Scholar]
33. S. Manivannan, W. Li, S. Akbar, R. Wang, J. Zhang et al., “An automated pattern recognition system for classifying indirect immunofluorescence images of HEp-2 cells and specimens,” Pattern Recognition, vol. 51, no. 8, pp. 12–26, 2016. [Google Scholar]
34. A. B. L. Larsen, J. S. Vestergaard and R. Larsen, “HEp-2 cell classification using shape index histograms with donut-shaped spatial pooling,” IEEE Transactions on Medical Imaging, vol. 33, no. 7, pp. 1573–1580, 2014. [Google Scholar] [PubMed]
35. S. Ensafi, S. Lu, A. A. Kassim and C. L. Tan, “Accurate HEp-2 cell classification based on sparse coding of superpixels,” Pattern Recognition Letters, vol. 82, no. 1, pp. 64–71, 2016. [Google Scholar]
36. J. C. González and O. D. C. Salazar, Image Enhancement with Matlab Algorithms, Karlskrona Sweden: Department of Applied Signal Processing SE-371, pp. 79, 2016. [Google Scholar]
37. D. Bala, “Childhood pneumonia recognition using convolutional neural network from chest X-ray images,” Journal of Electrical Engineering, Electronics, Control and Computer Science, vol. 7, no. 4, pp. 33–40, 2021. [Google Scholar]
38. W. J. Liu, X. J. Liang and H. C. Qu, “Learning performance of convolutional neural networks with different pooling models,” Journal of Image and Graphics, vol. 21, no. 9, pp. 1178–1190, 2016. [Google Scholar]
Cite This Article
 Copyright © 2023 The Author(s). Published by Tech Science Press.
This work is licensed under a Creative Commons Attribution 4.0 International License , which permits unrestricted use, distribution, and reproduction in any medium, provided the original work is properly cited.
 Downloads
 Citation Tools