
 Submit a Paper
 Propose a Special lssue
 Open Access
ARTICLE

Machine Learning Design of Aluminum-Lithium Alloys with High Strength
1
College of Semiconductors and Physics, North University of China, Taiyuan, 030051, China
2
School of Materials Science and Engineering, Collaborative Innovation Center of Ministry of Education and Shanxi Province for
High-Performance Al/Mg Alloy Materials, North University of China, Taiyuan, 030051, China
3
Beijing Advanced Innovation Center for Materials Genome Engineering, University of Science and Technology Beijing, Beijing,
100083, China
4
Institute of Materials Intelligent Technology, Liaoning Academy of Materials, Shenyang, 110004, China
* Corresponding Authors: Yongmei Zhang. Email: ; Yuhong Zhao. Email:
Computers, Materials & Continua 2023, 77(2), 1393-1409. https://doi.org/10.32604/cmc.2023.045871
Received 10 September 2023; Accepted 19 October 2023; Issue published 29 November 2023
 View Full Text
 Download PDF
Abstract
Due to the large unexplored compositional space, long development cycle, and high cost of traditional trial-anderror experiments, designing high strength aluminum-lithium alloys is a great challenge. This work establishes a performance-oriented machine learning design strategy for aluminum-lithium alloys to simplify and shorten the development cycle. The calculation results indicate that radial basis function (RBF) neural networks exhibit better predictive ability than back propagation (BP) neural networks. The RBF neural network predicted tensile and yield strengths with determination coefficients of 0.90 and 0.96, root mean square errors of 30.68 and 25.30, and mean absolute errors of 28.15 and 19.08, respectively. In the validation experiment, the comparison between experimental data and predicted data demonstrated the robustness of the two neural network models. The tensile and yield strengths of Al-2Li-1Cu-3Mg-0.2Zr (wt.%) alloy are 17.8 and 3.5 MPa higher than those of the Al-1Li- 4.5Cu-0.2Zr (wt.%) alloy, which has the best overall performance, respectively. It demonstrates the reliability of the neural network model in designing high strength aluminum-lithium alloys, which provides a way to improve research and development efficiency.Keywords
The severe situation of rapid reductions in fuel resources has made the demand for lightweight materials increasingly urgent, especially in the aerospace field [1–5]. The aluminum-lithium alloy’s excellent properties of low density and high strength make it an ideal material for aircraft and new weapons [6–11]. Research has found that every 1 wt.% of lithium added reduces aluminum alloy density by 3% and increases modulus by 6% [12–17]. By replacing conventional aluminum alloy components with aluminum-lithium alloys, component mass can be reduced by 10% to 20%, and stiffness can be improved by 10% to 20% [16,18,19]. Hence, in aerospace and defense fields, aluminum-lithium alloys are widely used [20–23]. Due to the wide range of unexplored components, traditional trial-and-error methods consume time, manpower, and cost, and cannot meet the design requirements of high-end metal materials. Thus, designing high strength aluminum-lithium alloys remains a huge challenge.
With the increasing computational power of computers, ML can explore the non-linear relationship between material composition, process, and performance by learning and training algorithms on complex datasets [24,25]. On materials, ML is seen as a “semi-empirical” method that can be combined with other simulation calculation methods (first-principles calculation [26,27], phase field method [28,29], molecular dynamic [30–32], and high-throughput calculation [33,34]) to explore the physical quantitative relationships between material data and optimize material performance [35–38]. Compared with traditional trial-and-error experiments, the ML method can more efficiently and quickly generate new models from material data. Currently, ML has been successfully used for the performance prediction of high-performance aluminum alloys, including tensile strength [39–43], yield strength [39,43,44], elongation [39,41], and hardness [45]. Li et al. [39] investigated the relationship between the composition processes of the 7-series aluminum alloys using a genetic algorithm. The ultimate tensile strength (UTS) of the Al-7.5Zn-2Mg-1.8Cu-0.12Zr (wt.%) alloy was 664 MPa, the yield strength (YS) was 609 MPa, and the elongation was 13.5%. Jiang et al. [41] proposed a performance-oriented ML design system that can quickly obtain aluminum alloy composition designs that meet target strength and toughness requirements. The tensile strength of three typical alloys measured through experimental verification is 707–736 MPa. Although the ML method is widely used in the aluminum alloy field, its application in the aluminum-lithium alloy field is limited. Juan et al. [43] quickly designed a high strength aviation aluminum alloy (UTS = 812 MPa, YS = 792 MPa) using an ML knowledge design perception system. The database used for this study is not exclusively for aluminum-lithium alloys, and the proportion of aluminum-lithium alloy data is very small. Li et al. [46] established an AdaBoost regression prediction model to achieve the design of high-performance aluminum-lithium alloys. However, the non-linear relationship between strength, composition, and process remains unclear because no predictive regression model has been developed in this study. With the in-depth research of Al-Li alloys, some experimental data on the composition, processing, and performance of aluminum-lithium alloys have been accumulated. Therefore, there is hope to achieve accelerated design of high-performance aluminum-lithium alloys through machine learning.
This study proposes a performance-oriented machine learning strategy for the “composition-process-performance” of Al-Li alloys. We have established two neural network models with composition and heat treatment process as input features, UTS and YS as output, and conducted experimental verification. The reliability of the neural network model for designing high strength aluminum-lithium alloys has been confirmed, and this strategy effectively shortens the research and development cycle, reduces costs, and accelerates the discovery and design of new materials.
This study proposes a performance-oriented design strategy of “composition-heat treatment-mechanical properties” of Al-Li alloys. Fig. 1 shows the specific research methodology, which includes data collection, data preprocessing, feature analysis, model construction, model evaluation, and performance prediction.
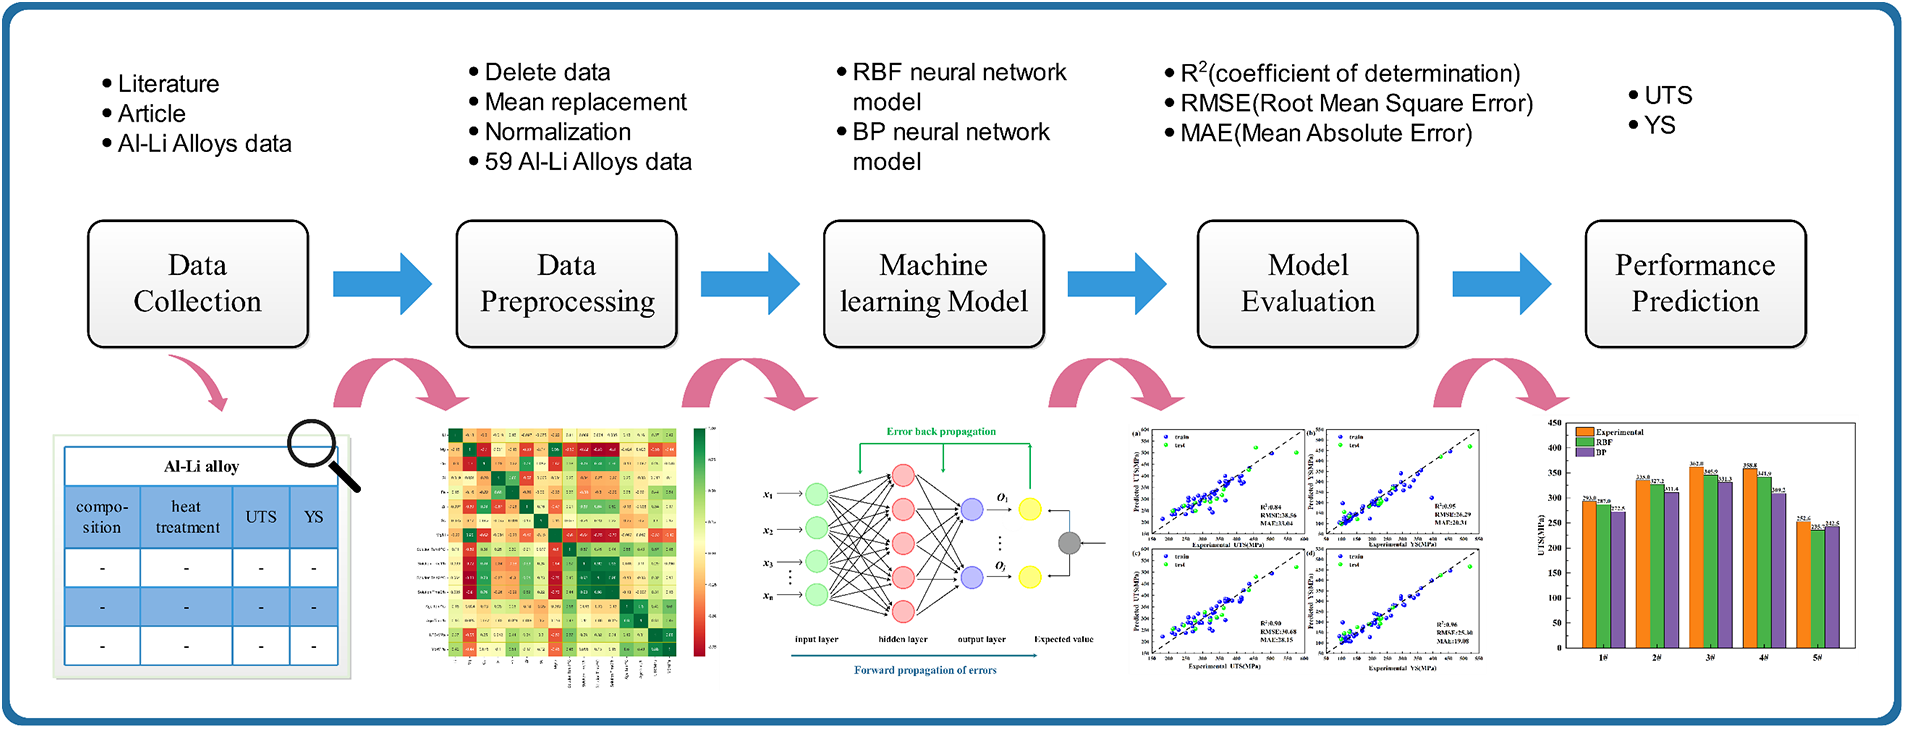
Figure 1: Schematic diagram of machine learning design of high-strength Al-Li alloy
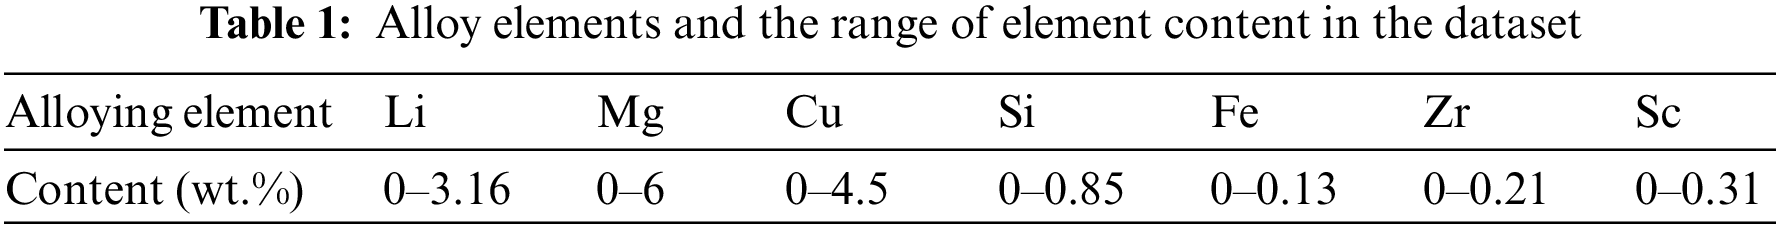
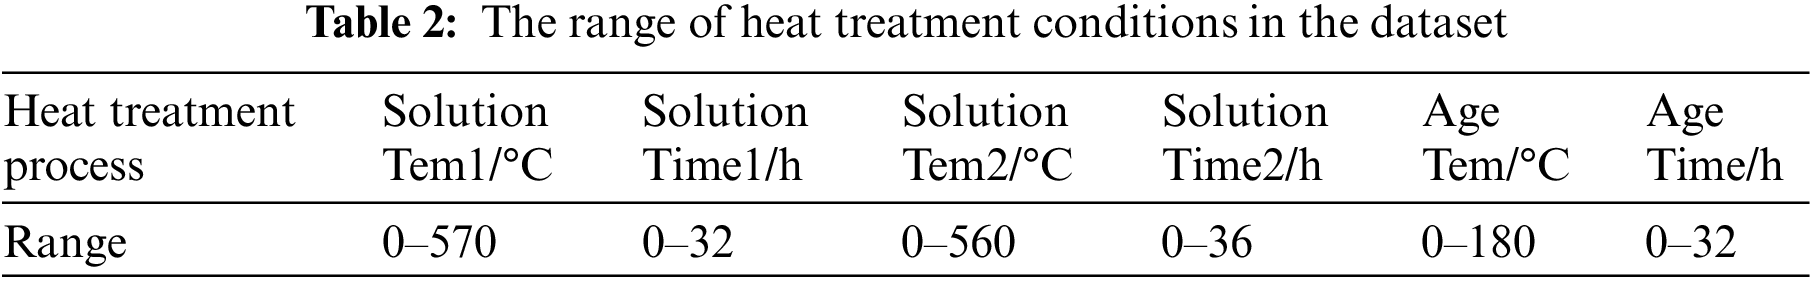
This study collected the composition, heat treatment process, and performance data of aluminum-lithium alloys published in the literature over the past decade for data set construction. Among them, the alloy compositions include the elements Li, Mg, Cu, Si, Fe, Zr, and Sc, the heat treatment processes include solid solution temperature, time, aging temperature, time, and the performance parameters mainly include tensile strength and yield strength. It should be noted that to avoid excessive features caused by complex machining steps and ensure prediction accuracy, only aluminum alloys processed by traditional forming methods are considered, excluding severe plastic deformation techniques [47,48].
Data preprocessing is one of the important steps in developing efficient and accurate ML models. The processing of outliers and missing values, data normalization, and partitioning of training and testing sets are important data preprocessing techniques [49]. For data samples with significant missing feature values, we choose to delete them directly. When collecting data, we select data with more complete performance values so there are fewer missing performance values. We use the mean to replace the missing values. In the end, 59 sample data were obtained. Table 1 shows the content range of alloy elements. Table 2 shows the range of heat treatment conditions. The target values for UTS and YS are 340 and 200 MPa, respectively.
Afterward, the processed dataset will be normalized. Normalization is a commonly used method for standard data preprocessing of numerical features. The right kind of normalization can not only speed up the training speed but can also improve the predictive ability of the model [50–52]. This study used min-max standardization to scale the numerical values to intervals of [0, 1], represented by Eq. (1):
Among them, x represents the original data,
The correlation coefficient matrix graph can intuitively represent the correlation relationship between input data [43,46]. The Pearson correlation coefficient between any two features is calculated by Eq. (2):
Among them,
2.4.1 Back Propagation Neural Network
The BP neural network can quickly learn and establish relationships between data without the need to input mathematical equations between data relationships in advance. It is a commonly used error back propagation structure. The BP neural network continuously optimizes the network parameters until the error reaches the set target value [39,53,54]. Fig. 2 shows the structure of the BP neural network. Each layer of neurons in the BP neural network is connected to each other without feedback links, and there is no connection between neurons within the layer. The layers are connected to form a feed-forward neural network system [55,56]. The calculation formula for hidden layer nodes is shown in Eq. (3):
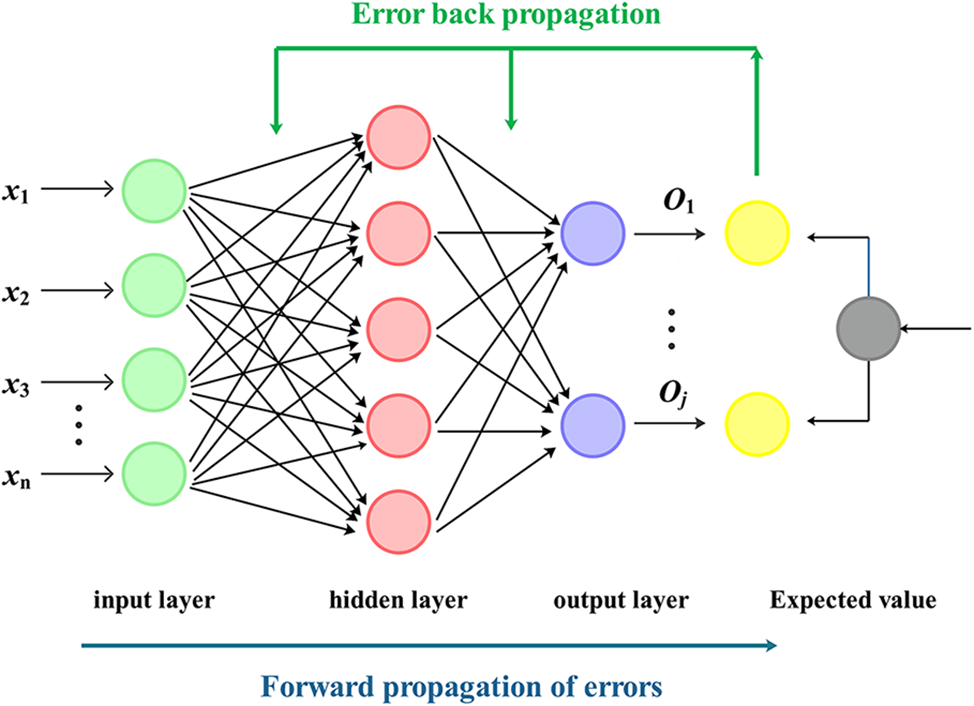
Figure 2: Topological structure of BP neural network
Among them, n, h, and j are the number of nodes in the input, hidden, and output layers, respectively, and a is a constant between 1 and 10.
Numerical overflow can lead to insufficient computational accuracy in the BP neural network. Therefore, we normalize the characteristic values and target values of the samples using the same method. Fig. 3a shows the algorithm steps of the BP neural network.
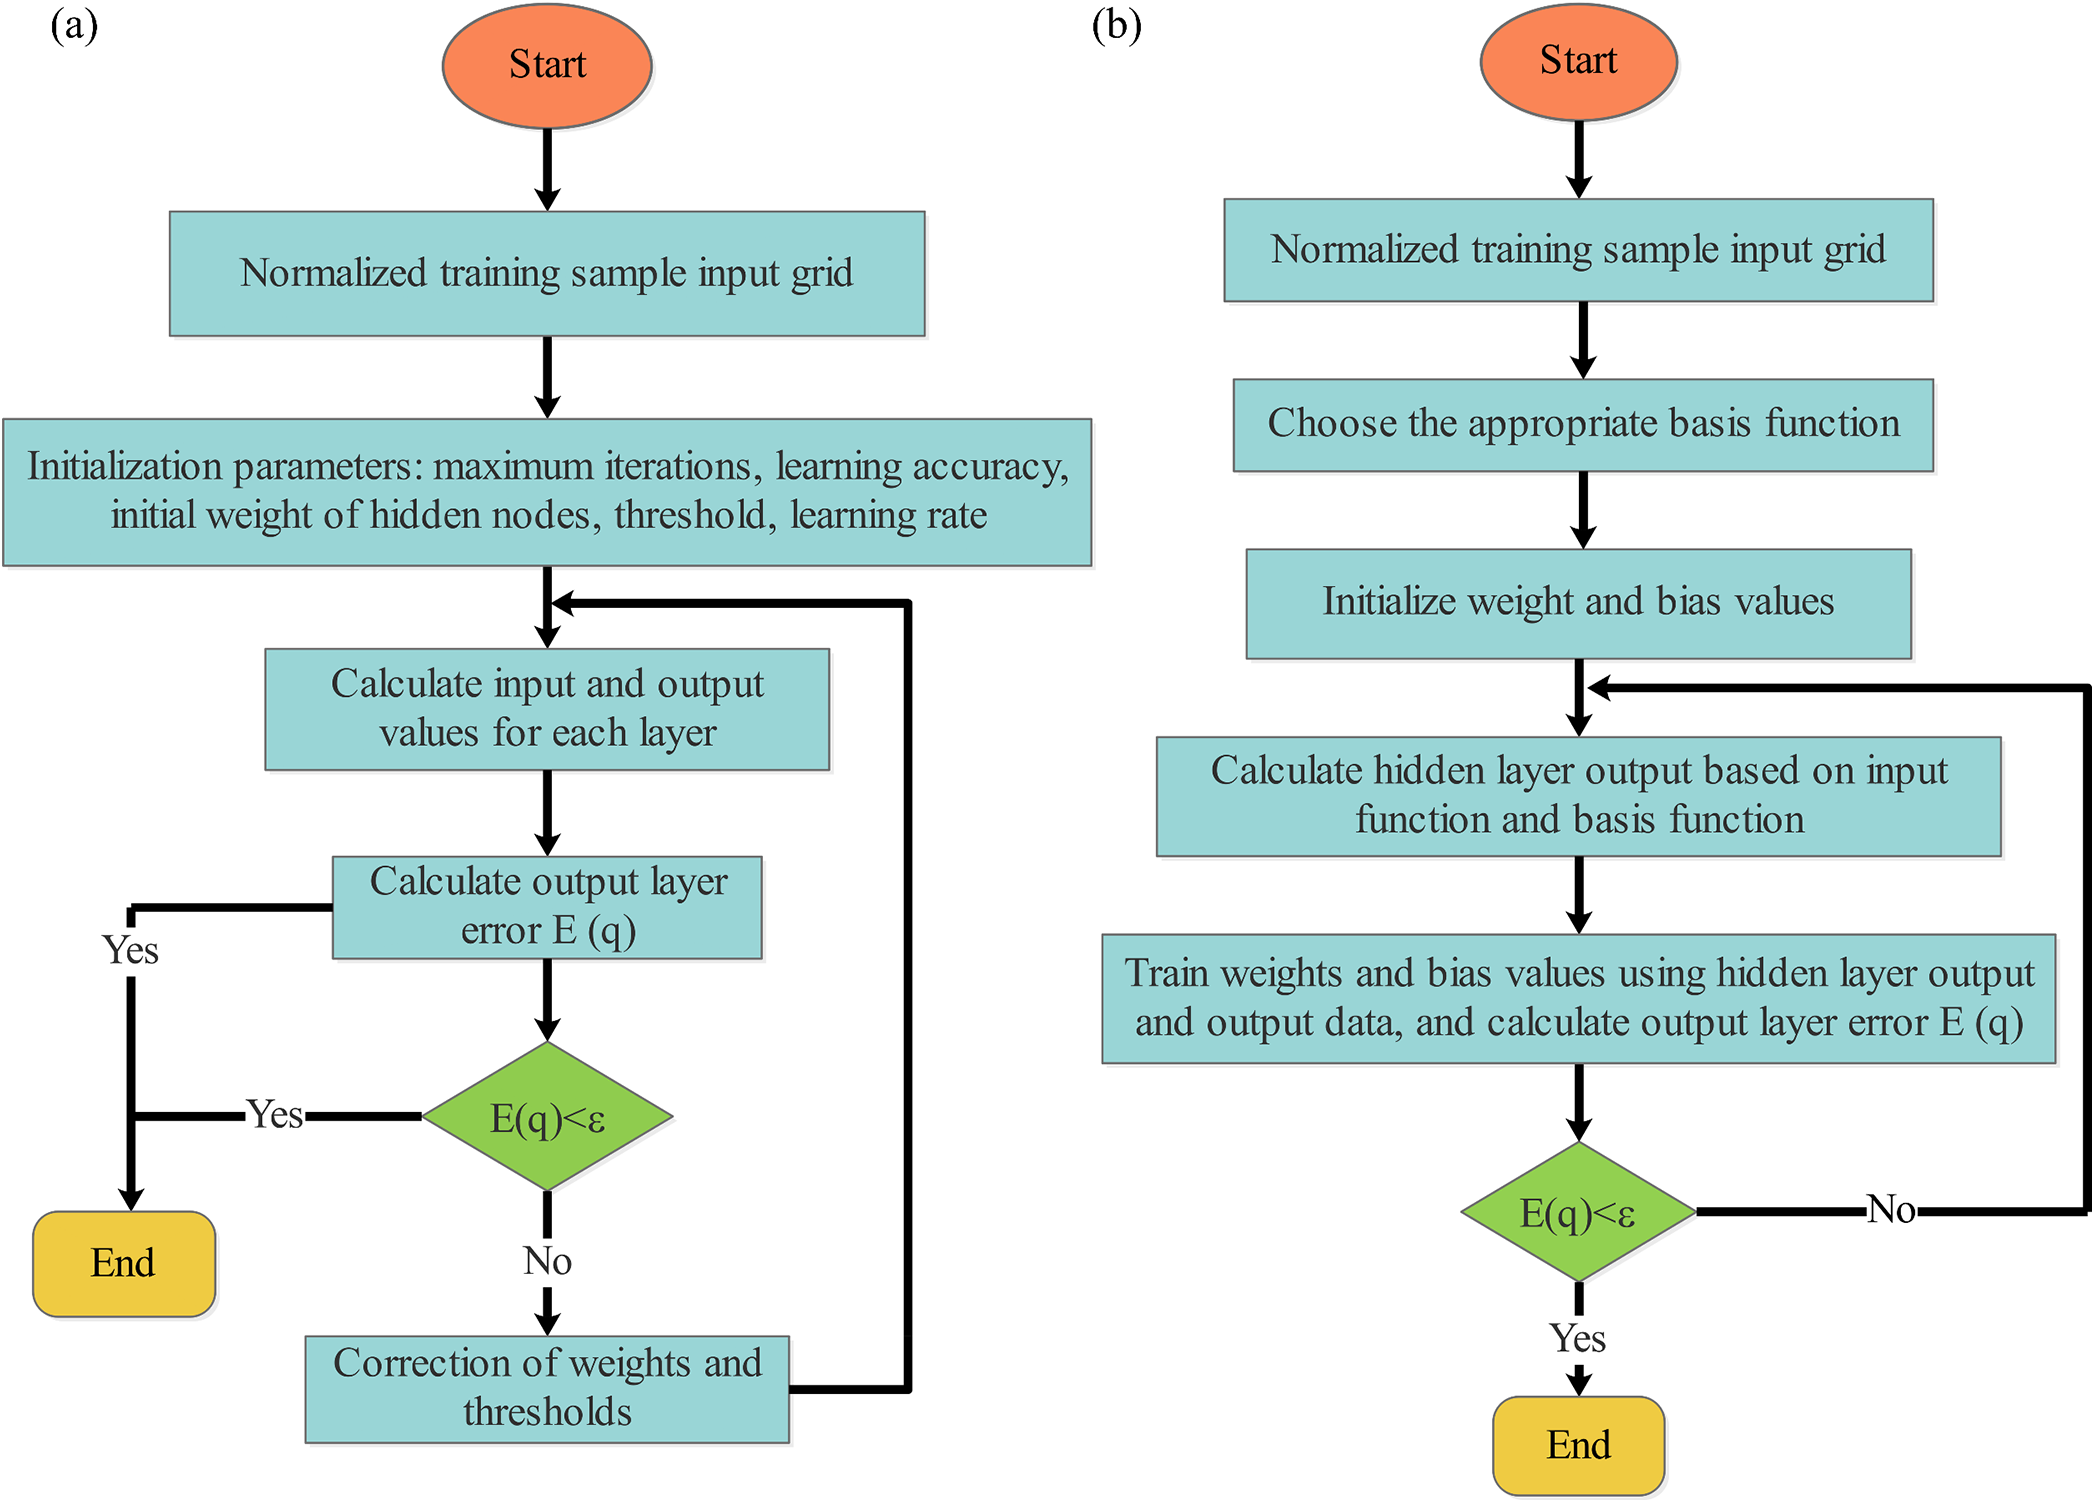
Figure 3: Algorithm steps of two neural networks (a) BP neural network; (b) RBF neural network
2.4.2 Radial Basis Function Neural Network
The RBF neural network typically has three layers. The hidden layer of the RBF neural network uses RBF as the activation function. The output layer is a linear combination that is combined with the output layer and the hidden layer to form a feed-forward neural network. Fig. 3b shows the algorithm steps of the RBF neural networks. The output formula is shown in Eq. (4):
Among them, N is the number of neurons in the hidden layer,
RBF neural network has similar structures to the BP neural network, but its training speed is faster than the BP neural network. RBF neural networks have characteristics that other forward neural networks do not possess, such as global optimization and the ability to approximate any nonlinear function.
We selected three evaluation indicators to evaluate the performance of the two neural network models: determination coefficient R2, root mean square error (RMSE), and mean absolute error (MAE). The calculation formula is shown in Eqs. (5)–(7):
Among them,
R2 is used to characterize the interpretability between the data in ML regression models. Generally speaking, R2 ranges between 0 and 1, with values nearer to 1 indicating input features and output results with better interpretability. However, we cannot measure the performance of the model solely by this standard. Therefore, RMSE and MAE are used together to assess predictive errors. RMSE and MAE can more directly reflect the size of the model’s prediction error, and the closer they are to zero, the more accurate the model’s prediction results will be.
3.1 Feature Correlation Analysis
Fig. 4 shows the Pearson correlation coefficient r value. Based on the r values between −1 and +1, it can be determined whether the two variables are linearly correlated (r = +1 represents positive correlation, r = −1 represents negative correlation) or uncorrelated (r→0). In addition to the r value, color change corresponds to the correlation between data, with green and red indicating strong positive and negative correlations, respectively. |r| > 0.95 indicates a strong linear correlation between these two features, indicating that they have similar effects on alloy properties [43,57,58]. There is a certain ratio relationship between the features Mg and Mg/Li, with an r value of 0.95. There is a strong positive correlation between the feature heat treatment conditions (solid solution temperature, time, aging temperature, time), with r values between 0.8 and 0.98. The weakest correlation was observed between feature Si and the target value UTS, as well as between feature Cu, solid solution time 1, and target value YS, with an r value of less than 0.1. The r value between UTS and YS is 0.88, indicating a strong correlation.
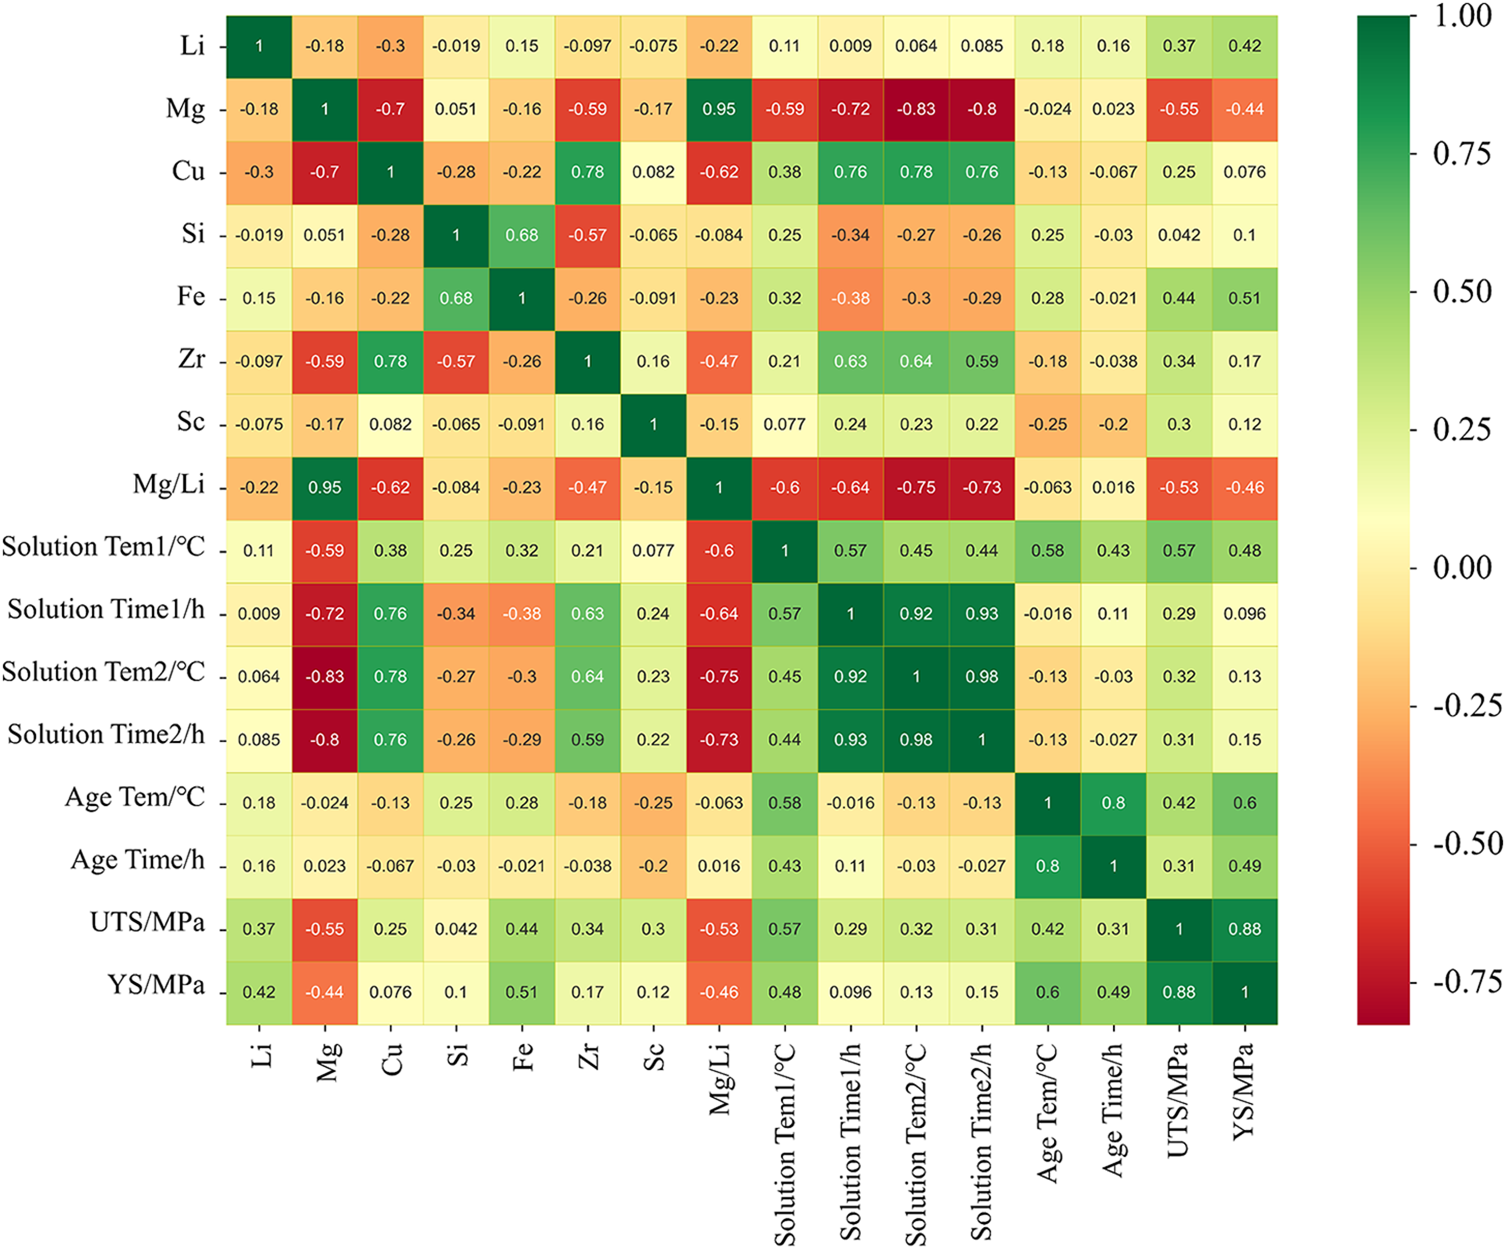
Figure 4: Heat map of Pearson correlation coefficient matrix
The pre-processed dataset is randomly divided into training and test datasets in a 4:1 ratio. To better evaluate the robustness of the ML model, the training model uses a training dataset, and the trained model is tested using a testing dataset. The neural network model was established between alloy composition, process, and performance, with alloy composition, process as inputs and UTS, YS as outputs. By repeatedly training two models, the prediction results of the training and prediction sets are obtained. Figs. 5 and 6 show the predicted results of the BP neural network. Figs. 7 and 8 show the predicted results of the RBF neural network. The fitting curves of the true and predicted values show that the predicted values of the two models are very close to the true values, indicating that the training results of the two neural network models are accurate.
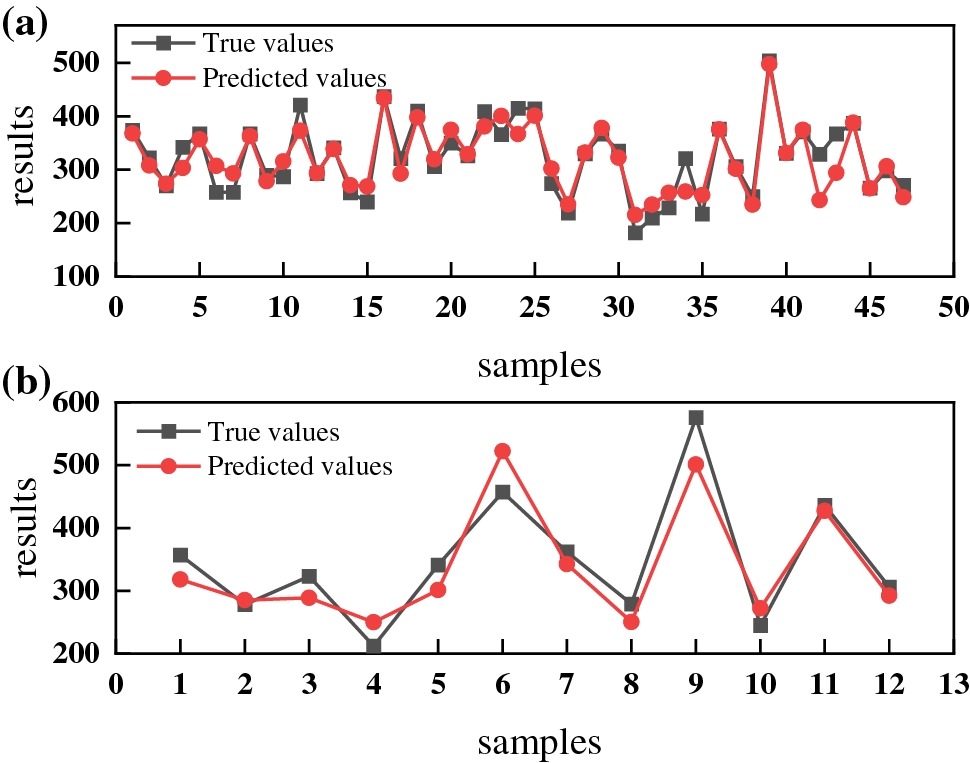
Figure 5: Comparison of true and predicted values of UTS predicted by BP neural network (a) training set; (b) test set
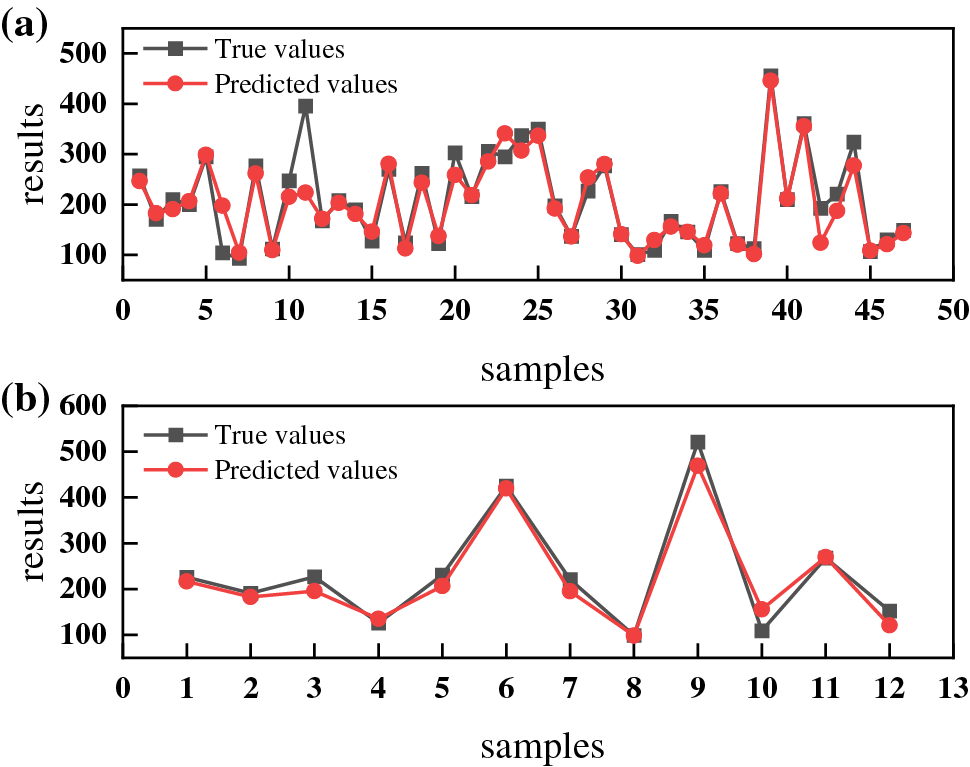
Figure 6: Comparison of true and predicted values of YS predicted by BP neural network (a) training set; (b) test set
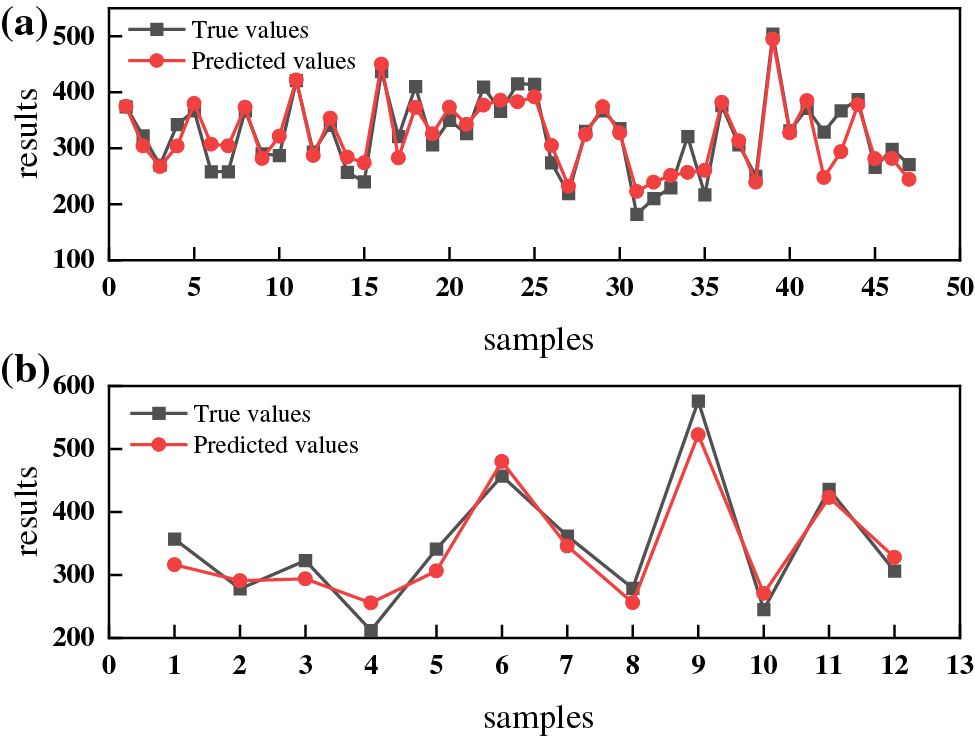
Figure 7: Comparison of true and predicted values of UTS predicted by RBF neural network (a) training set; (b) test set
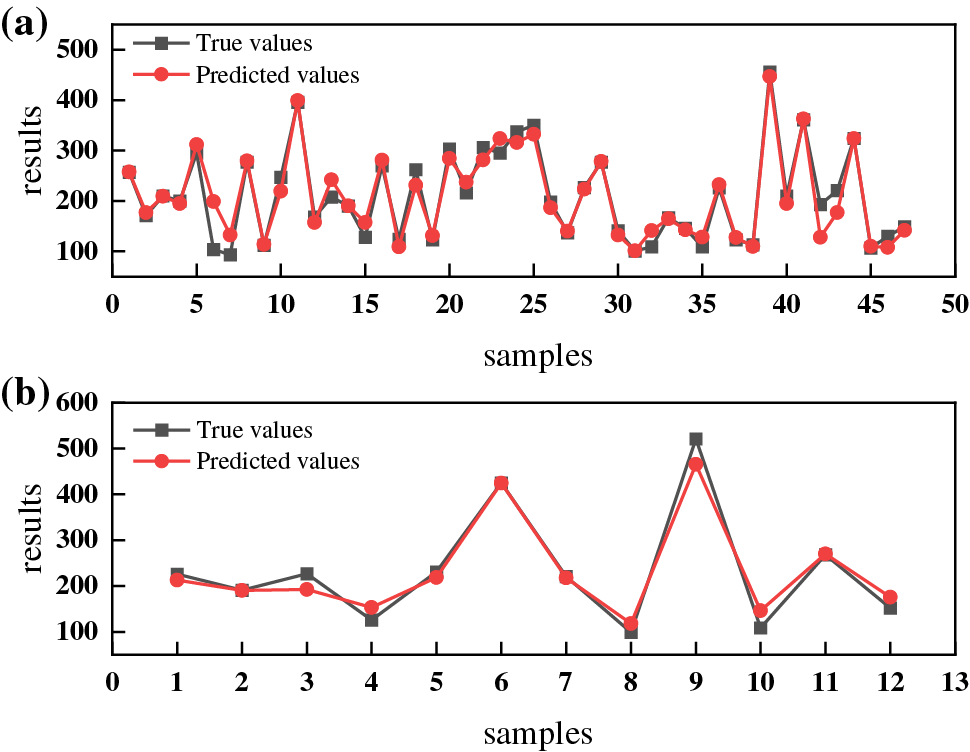
Figure 8: Comparison of true and predicted values of YS predicted by RBF neural network (a) training set; (b) test set
Fig. 9 shows the results of two neural networks predicting UTS and YS, respectively. The results indicate that the R2 of UTS and YS predicted using the BP neural network is 0.84, 0.95, RMSE is 38.56, 26.29, and MAE is 33.04, 20.31, respectively. The R2 of UTS and YS predicted using the RBF neural network is 0.90 and 0.96, RMSE is 30.68 and 25.30, and MAE is 28.15 and 19.08, respectively. By comparing the calculation results and fitting graphs of the two models, we can see that the fitting degree of the RBF neural network is closer to the diagonal than the BP neural network, indicating that the RBF neural network model exhibits a better ability to predict.
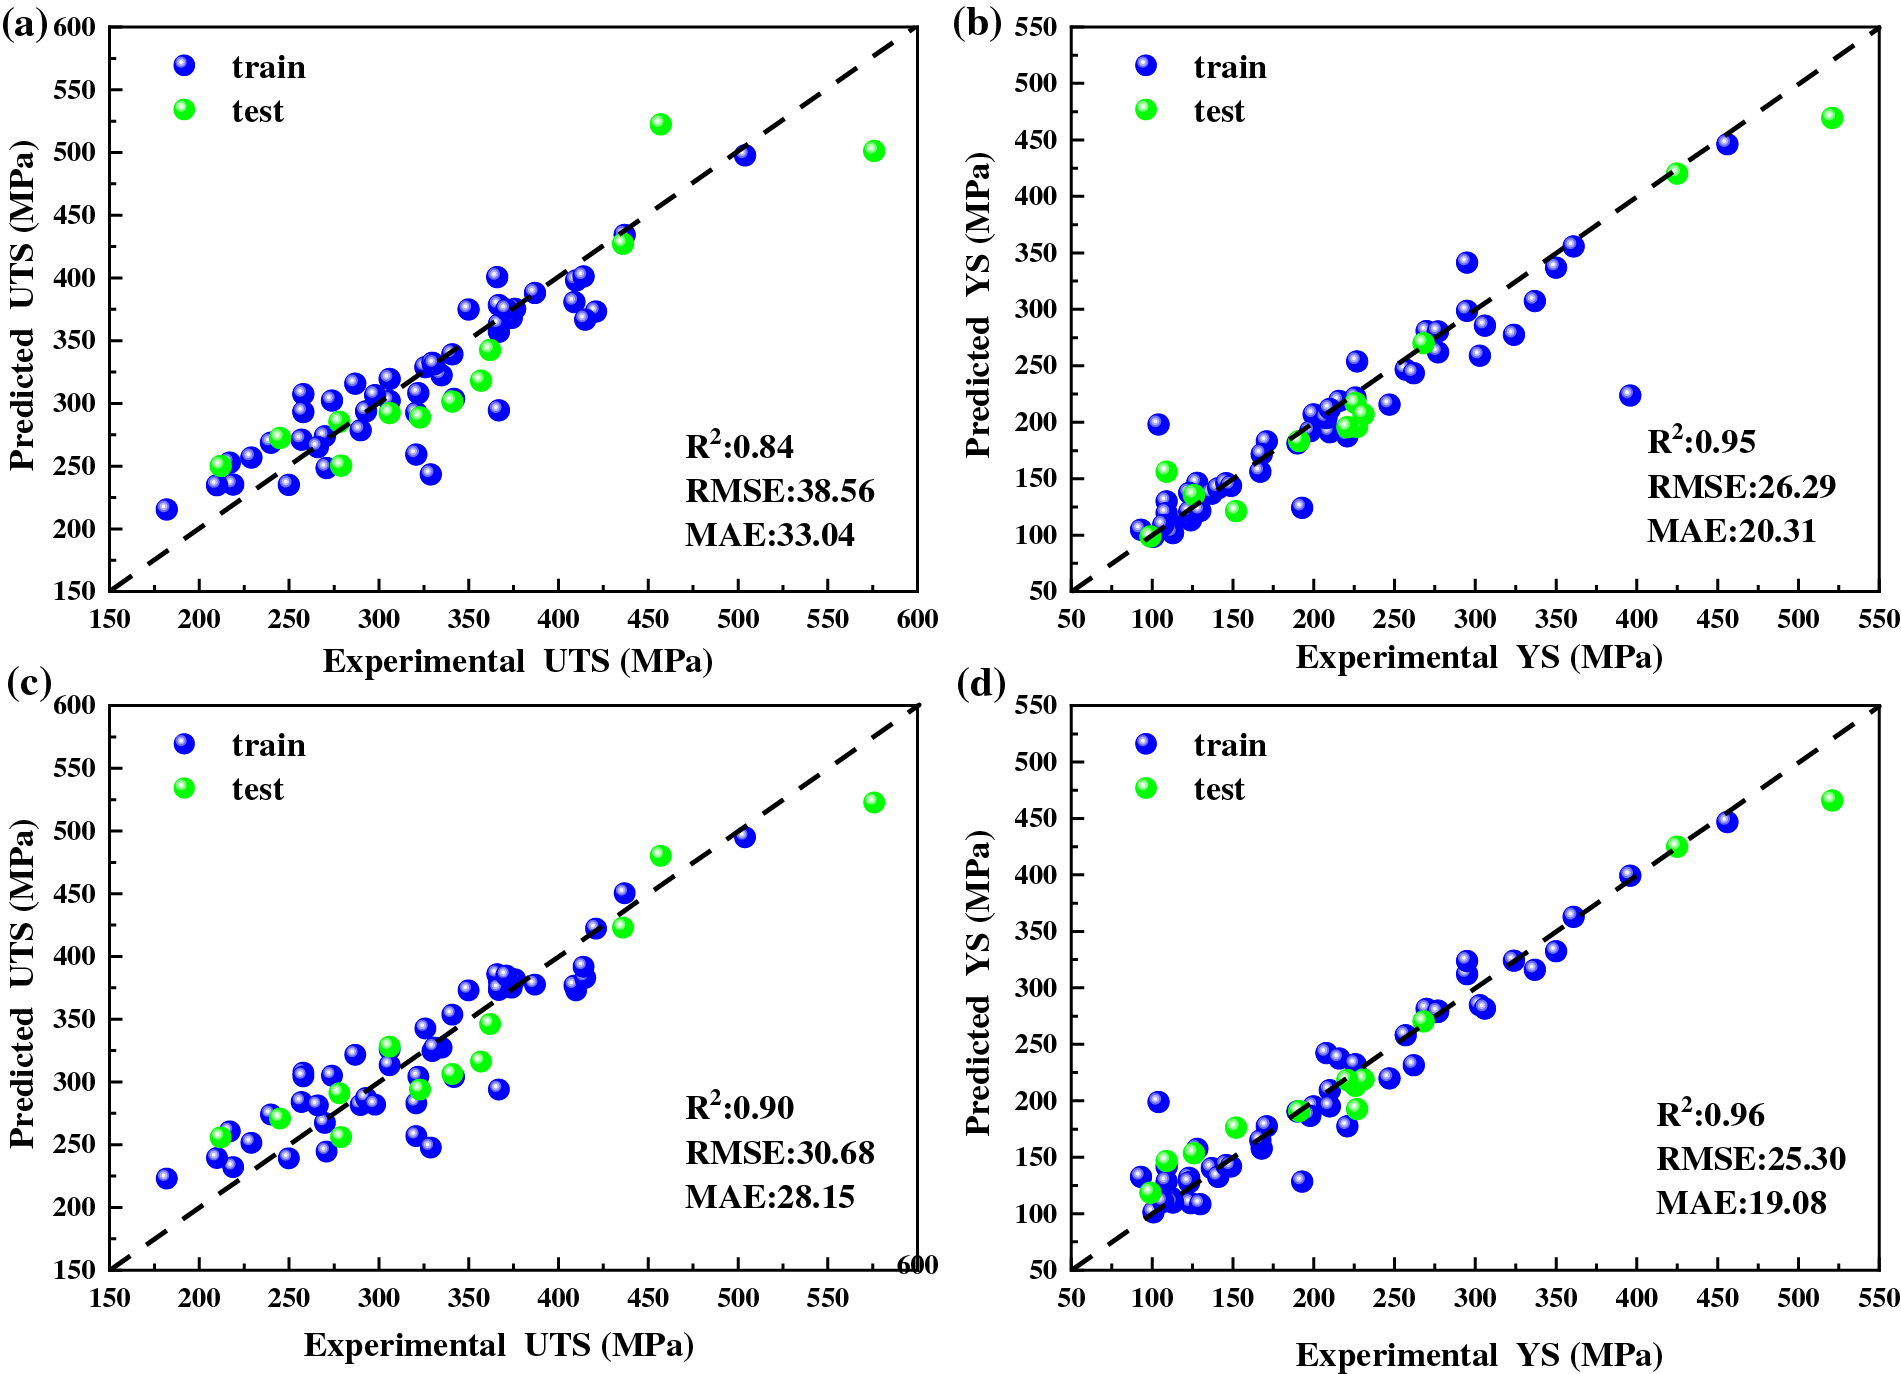
Figure 9: The results of training (a) and (b) BP neural network; (c) and (d) RBF neural network
4.1 Feature Importance Analysis Based on Shapley Values
The Shapley value is used to describe the contribution of each feature to the predicted target [59–61]. This study analyzed the degree of influence of different features on the performance indicators of UTS and YS, as shown in Fig. 10. Figs. 10a and 10c represent the Shapley values of UTS and YS for a single feature, respectively. The vertical axis sorts features based on the size of the Shapley value on the horizontal axis. Each point on the graph represents a sample, with red and blue corresponding to high and low values, respectively. The sample color maps to the feature values. Figs. 10b and 10d represent the absolute values of a single feature for UTS and YS calculations, respectively, with the vertical axis corresponding to the feature term and the horizontal axis representing the mean absolute values of Shapley values, reflecting the importance of each feature in prediction.
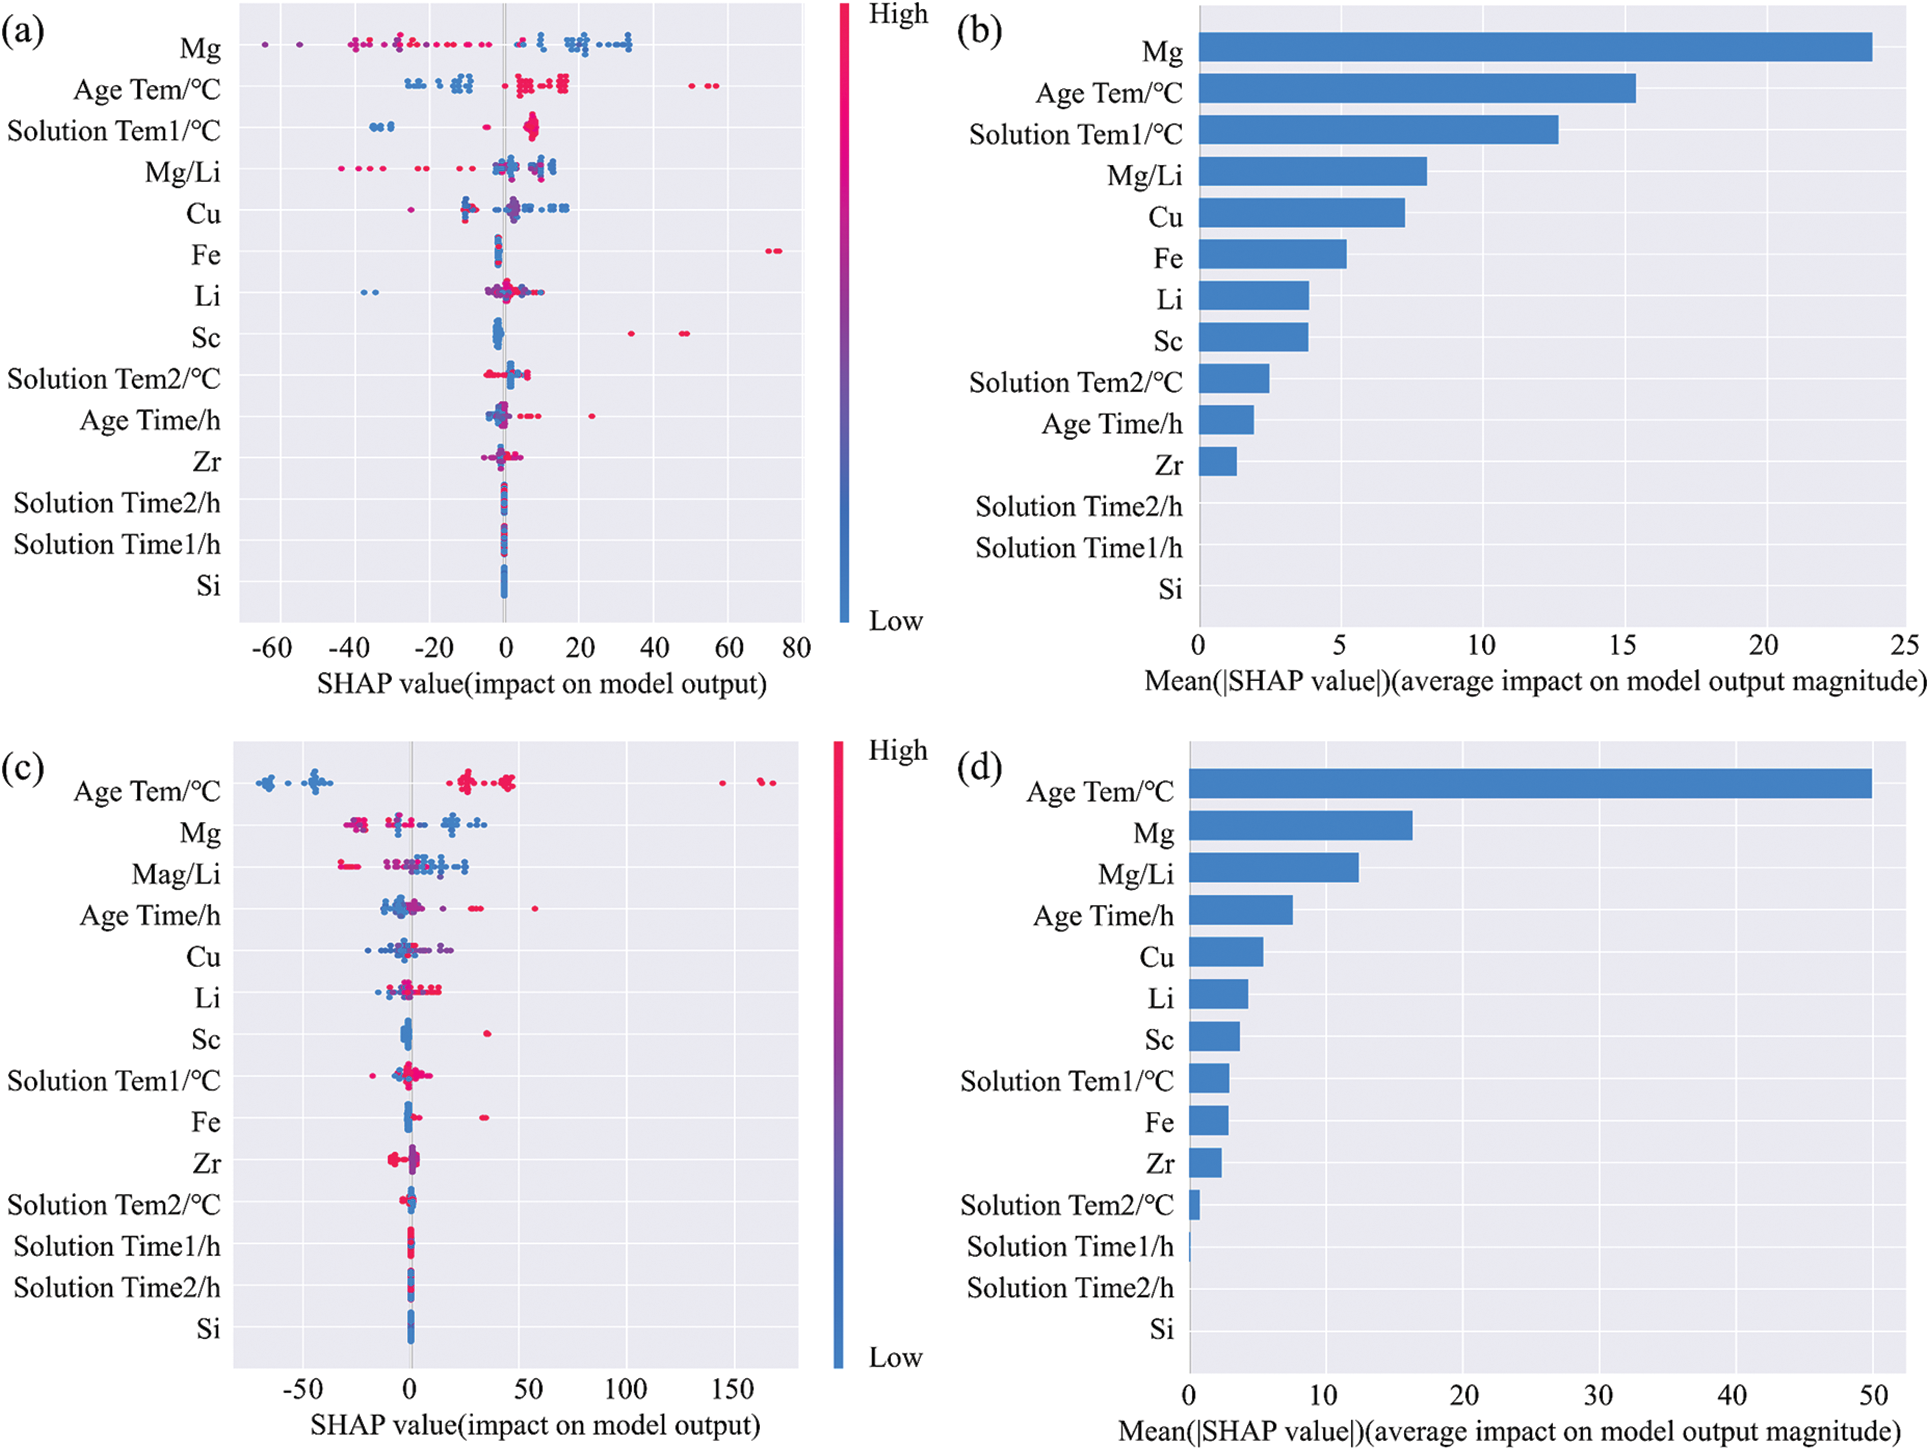
Figure 10: Shapley value analysis of UTS and YS with different features (a) The Shapley value of a single feature on UTS; (b) The absolute value of a single feature after UTS calculation; (c) The Shapley value of a single feature on YS; (d) The absolute value of a single feature after YS calculation
The blue sample is on the negative x-axis, and the red sample is on the positive x-axis, indicating that the feature is positively correlated with the predicted target. Conversely, the feature is negatively correlated with the prediction target. Samples with positive Shapley values and large values indicate that it has a positive impact on the prediction results and will increase the predicted value of UTS or YS. On the contrary, samples with negative Shapley values and small values indicate that it has a negative impact on the prediction results and will decrease the prediction value of UTS or YS. As shown in Fig. 10a, the features that are significantly positively correlated with UTS include aging temperature, solid solution temperature 1, Li element content, and aging time, while the features that are significantly negatively correlated with UTS include Mg element content, Mg/Li, and Cu element content. As shown in Fig. 10b, the top 5 features that contribute most to the prediction of UTS are Mg element content, aging temperature, solid solution temperature 1, Mg/Li, and Cu element content. As shown in Fig. 10c, the features that are significantly positively correlated with YS include aging temperature, aging time, Li element content, and solid solution temperature 1, while the features that are significantly negatively correlated with YS include Mg element content and Mg/Li. As shown in Fig. 10d, the top 5 features that contribute the most to the prediction of YS are aging temperature, Mg element content, Mg/Li, aging time, and Cu element content.
Mg and Cu elements are the main strengthening elements of aluminum-lithium alloys, and their addition can play a certain role in solid solution strengthening, while also reducing the solid solubility of Li in the matrix and promoting the precipitation of δ′ (Al3Li) phase and T1 (Al2CuLi) phase, thereby improving the strength of the alloy. Therefore, the content of Mg and Cu is an essential feature for predicting UTS and YS. Aluminum-lithium alloys belong to the heat-treatable strengthening alloy. The precipitation sequence and distribution in aluminum-lithium alloys are affected by different solution temperatures, solution times, aging temperatures, and aging times, which in turn affects alloy performance. Fig. 10 shows that aging temperature and solution temperature 1 are important features for predicting the UTS of aluminum-lithium alloys, while aging temperature and time are important features for predicting the YS of aluminum-lithium alloys.
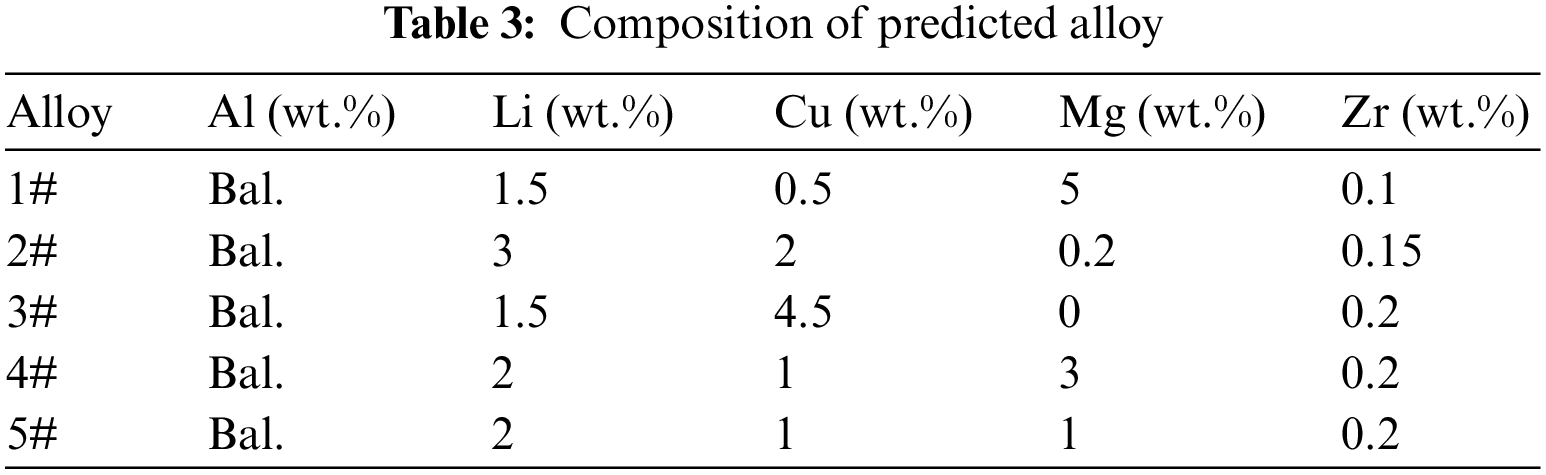
Three types of alloys (1#, 2#, and 3#) and two sets of experimental data of experimental alloys (4# and 5#) (not included in the model training) were selected from the recently published literature [62,63] to ensure the accuracy of the prediction model obtained in this work. The prediction was performed by the trained neural network model. Table 3 lists the composition of the predicted alloy.
Figs. 11a and 11b show the UTS and YS of the alloys predicted using the two models compared with the experimental values, respectively. Through observation, it was found that the RBF neural network model exhibits a higher accuracy in prediction than the BP neural networks, which is consistent with the results obtained from the model training, further verifying the reliability of the two neural network prediction models. Tables 4 and 5 calculate the prediction errors of the two neural network models. The maximum prediction error of the BP neural network model in predicting UTS is −13.8% for alloy 4#, in predicting YS is −12.6% for alloy 1# and 13.5% for alloy 4#; the maximum prediction error of the RBF neural network in predicting YS is 14% of the alloy 5#; all other errors are within 8.5%. This indicates that the neural network model can effectively predict the UTS and YS of new alloys, and the RBF neural network model has better performance than the BP neural network model.
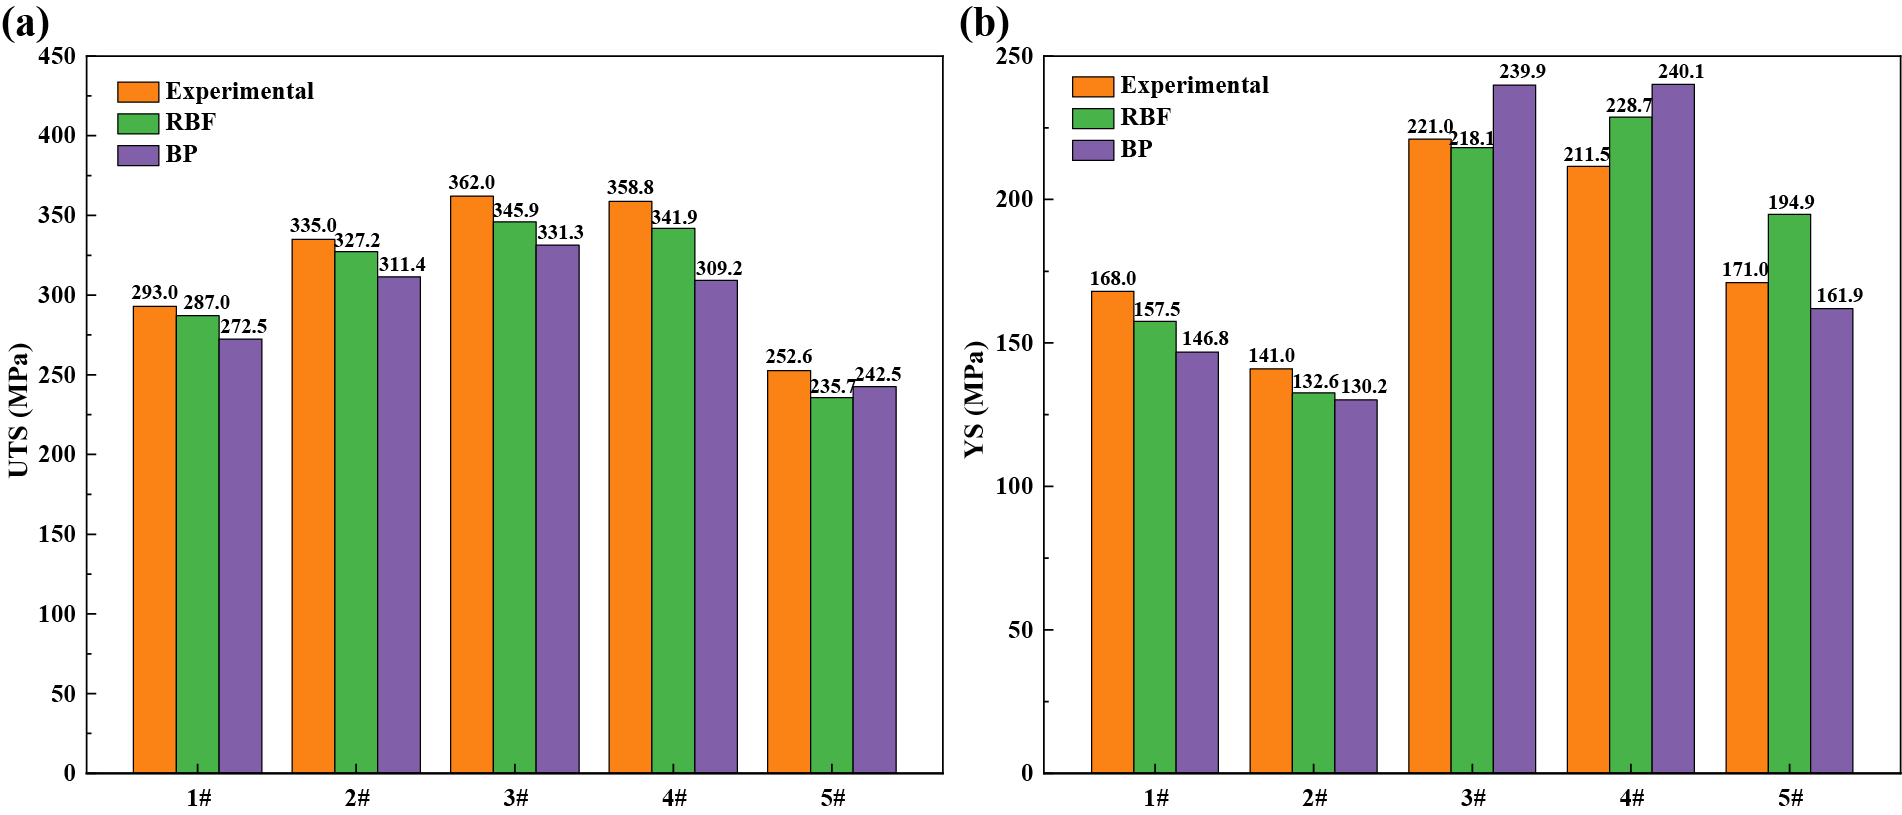
Figure 11: Validation of two model predictions
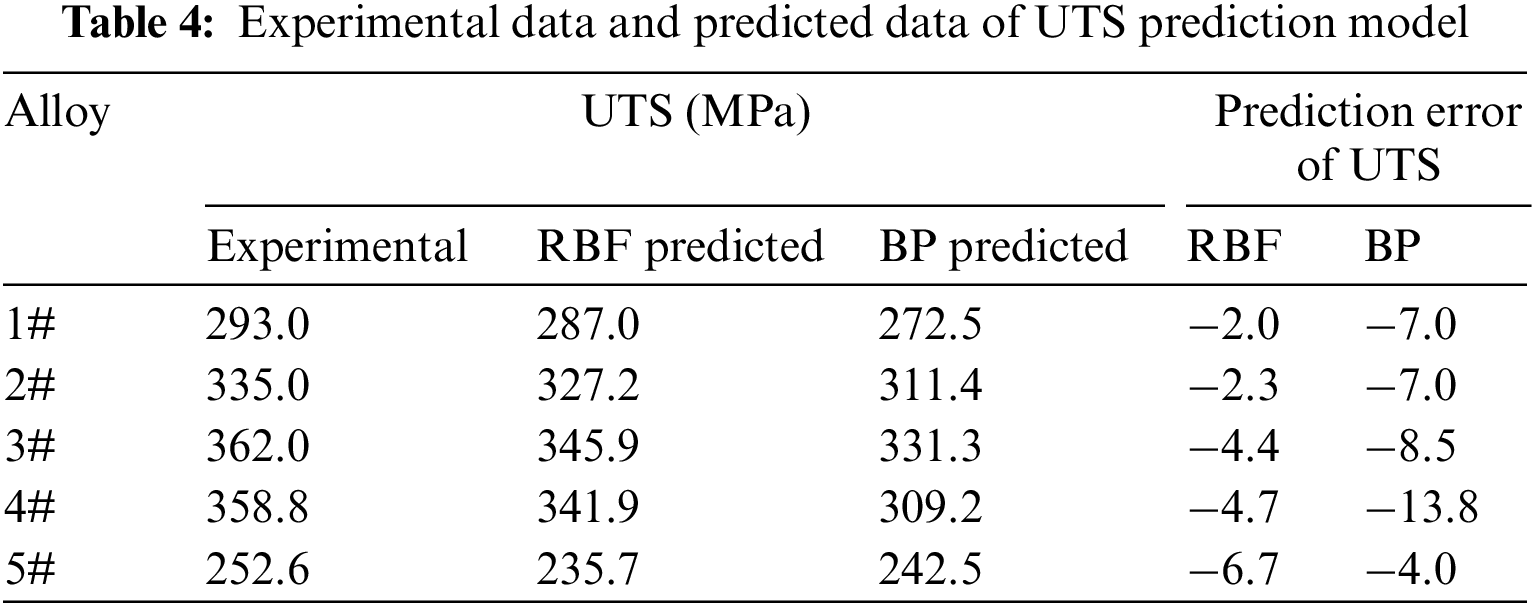
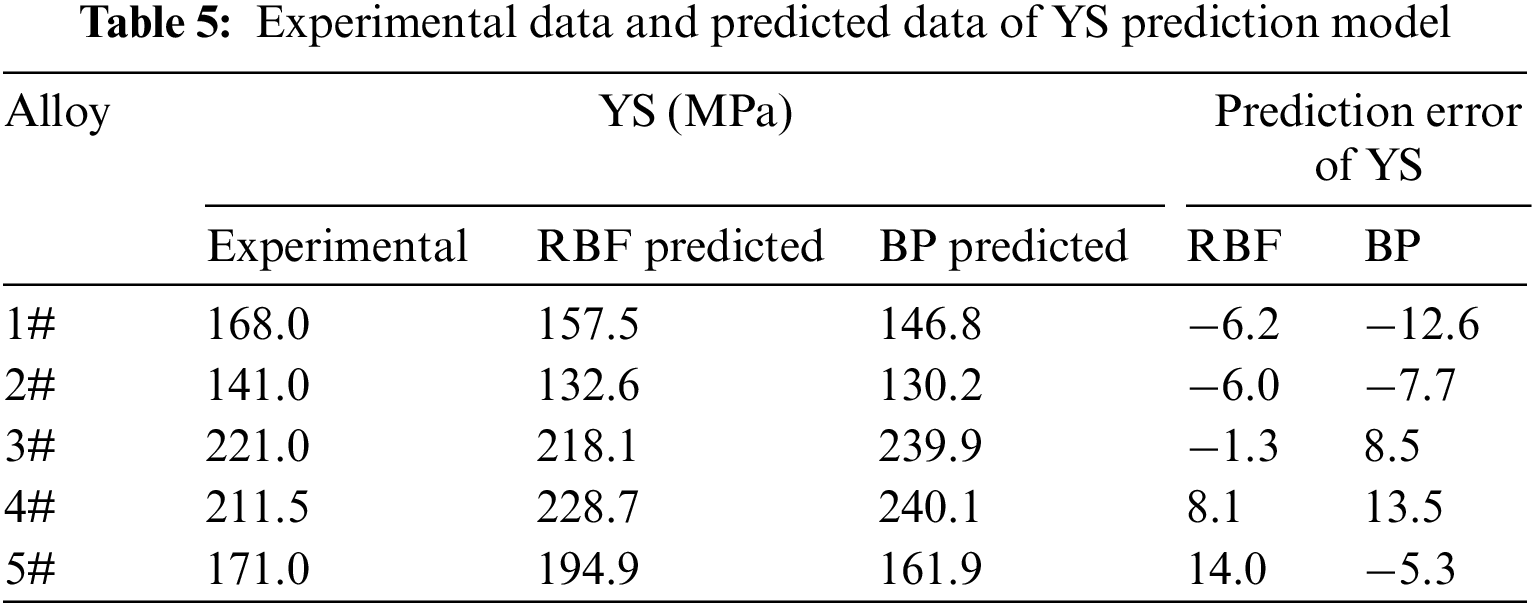
Fig. 12 shows the results of this study and the reported UTS and YS of the same type of aluminum-lithium alloys. The comparison shows that the UTS of experimental alloy 4# is 358.8 MPa, which is 17.8 MPa higher than the UTS of Al-1Li-4.5Cu-0.2Zr (wt.%) alloy with the best overall performance. The YS of experimental alloy 4# is 211.5 MPa, which is 3.5 MPa higher than the YS of Al-1Li-4.5Cu-0.2Zr (wt.%) alloy with the best overall performance.
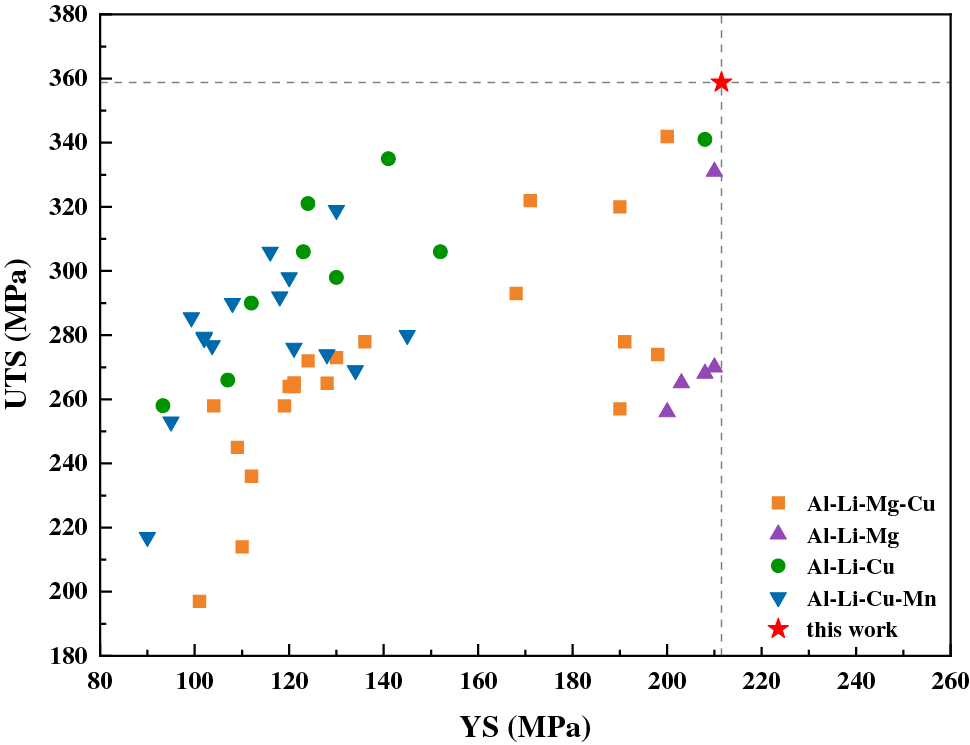
Figure 12: Comparison of UTS and YS of high-strength Al-Li alloy
In this study, we collected data on Al-Li alloys from literature, including composition, process, and mechanical properties, and established predictive models for the strength of Al-Li alloys using the BP neural network and RBF neural network. The final results indicate that RBF neural networks exhibit better predictive ability than BP neural networks, with R2 of 0.90 and 0.96 for UTS and YS, RMSE of 30.68 and 25.30, and MAE of 28.15 and 19.08, respectively. Finally, the accuracy of the two models was verified through experiments, indicating that the models can effectively predict the UTS and YS of new alloys. Compared with the reported properties of Al-Li alloys, the UTS and YS of Al-2Li-1Cu-3Mg-0.2Zr (wt.%) alloy are 17.8 and 3.5 MPa higher than the UTS and YS of the Al-1Li-4.5Cu-0.2Zr (wt.%) alloy with the best overall performance, respectively. The RBF neural network model can provide a reference for the accelerated design of high strength aluminum-lithium alloys.
Acknowledgement: The authors would like to thank the editors and reviewers for their valuable work, as well as the supervisor and family for their valuable support during the research process.
Funding Statement: The current work was supported by the National Natural Science Foundation of China (Nos. 52074246, 52275390, 52205429, 52201146); National Defense Basic Scientific Research Program of China (JCKY2020408B002); Key Research and Development Program of Shanxi Province (202102050201011, 202202050201014).
Author Contributions: The authors confirm contribution to the paper as follows: Y.H. Zhao: Methodology, Investigation, Software, Writing, Funding. H.X. Wang: Investigation, Writing-Original Draft, Writing-Review and Editing. Z.Q. Duan, Q.W. Guo and Y.M. Zhang: Resources, Validation, Writing-Review and Editing. All authors reviewed the results and approved the final version of the manuscript.
Availability of Data and Materials: Required all data are presented in the “supplementary material for online publication only section” in the submission process.
Conflicts of Interest: The authors declare that they have no conflicts of interest to report regarding the present study.
References
1. W. B. Chen, D. H. Xiao, M. D. Wu, J. Huang, L. P. Huang et al., “Effect of cold rolling pre-deformation on microstructure and properties of V-1469 Al-Li alloy,” Journal of Materials Research and Technology, vol. 9, no. 5, pp. 9675–9683, 2020. [Google Scholar]
2. X. Zhang, L. Zhang, G. Wu, J. Sun, M. Rong et al., “Influence of Sc content on the microstructure and mechanical properties of cast Al-2Li-2Cu-0.5Mg-0.2Zr alloy,” Materials Characterization, vol. 142, pp. 223–236, 2018. [Google Scholar]
3. L. Radan, V. Songmene, Y. Zedan and F. H. Samuel, “Investigating the effect of heat treatment on the microstructure and hardness of aluminum-lithium alloys,” Materials, vol. 16, no. 19, pp. 6502, 2023. [Google Scholar] [PubMed]
4. L. Zhu, N. Li and P. R. N. Childs, “Light-weighting in aerospace component and system design,” Propulsion and Power Research, vol. 7, no. 2, pp. 103–119, 2018. [Google Scholar]
5. S. Cui, C. Zhang, M. Liu, L. Chen and G. Zhao, “Precipitation behavior of an Al-Cu-Li-X alloy and competing relationships among precipitates at different aging temperatures,” Materials Science and Engineering: A, vol. 814, pp. 141125, 2021. [Google Scholar]
6. S. F. Zhang, W. D. Zeng, W. H. Yang, C. L. Shi and H. J. Wang, “Ageing response of a Al-Cu-Li 2198 alloy,” Materials & Design, vol. 63, pp. 368–374, 2014. [Google Scholar]
7. M. X. Chen, Y. B. Li, L. Y. Xia, M. H. Huang, Z. Y. Wu et al., “Effects of pre-rolling on mechanical properties and fatigue crack growth rate of 2195 Al-Li alloy,” Journal of Central South University, vol. 29, no. 3, pp. 836–847, 2022. [Google Scholar]
8. A. Abd El-Aty, Y. Xu, X. Guo, S. H. Zhang, Y. Ma et al., “Strengthening mechanisms, deformation behavior, and anisotropic mechanical properties of Al-Li alloys: A review,” Journal of Advanced Research, vol. 10, pp. 49–67, 2018. [Google Scholar] [PubMed]
9. X. Wang, J. Jiang, G. Li, W. Shao and L. Zhen, “Precipitation during quenching in 2A97 aluminum alloy and the influences from grain structure,” Materials, vol. 14, no. 11, pp. 2802, 2021. [Google Scholar] [PubMed]
10. J. Zhang, G. Wu, L. Zhang, X. Zhang, C. Shi et al., “Effect of Zn on precipitation evolution and mechanical properties of a high strength cast Al-Li-Cu alloy,” Materials Characterization, vol. 160, pp. 110089, 2020. [Google Scholar]
11. C. Shi, L. Zhang, G. Wu, X. Zhang, A. Chen et al., “Effects of Sc addition on the microstructure and mechanical properties of cast Al-3Li-1.5Cu-0.15Zr alloy,” Materials Science and Engineering: A, vol. 680, pp. 232–238, 2017. [Google Scholar]
12. C. Xue, Y. Zhang, S. Wang, G. Tian, X. Yang et al., “Achieving highest young’s modulus in Al-Li by tracing the size and bonding evolution of Li-rich precipitates,” Journal of Materials Science & Technology, vol. 145, pp. 125–135, 2023. [Google Scholar]
13. A. Chen, L. Zhang, G. Wu, Y. Peng and Y. Li, “Effect of Mn addition on microstructure and mechanical properties of cast Al-2Li-2Cu-0.8Mg-0.4Zn-0.2Zr alloy,” Journal of Materials Research, vol. 31, no. 2, pp. 250–258, 2016. [Google Scholar]
14. J. H. Kim, J. H. Jeun, H. J. Chun, Y. R. Lee, J. T. Yoo et al., “Effect of precipitates on mechanical properties of AA2195,” Journal of Alloys and Compounds, vol. 669, pp. 187–198, 2016. [Google Scholar]
15. J. Zhou, J. Miao, B. Wang and J. Wang, “Effect of solution treatment and aging treatment on mechanical properties of 2060 Al-Li alloy and process multi-objective optimization,” Metals, vol. 12, no. 6, pp. 897, 2022. [Google Scholar]
16. A. Chen, Y. Peng, L. Zhang, G. Wu and Y. Li, “Microstructural evolution and mechanical properties of cast Al-3Li-1.5Cu-0.2Zr alloy during heat treatment,” Materials Characterization, vol. 114, pp. 234–242, 2016. [Google Scholar]
17. E. A. Hajjioui, K. Bouchaâla, M. Faqir and E. Essadiqi, “A review of manufacturing processes, mechanical properties and precipitations for aluminum lithium alloys used in aeronautic applications,” Heliyon, vol. 9, no. 3, pp. e12565, 2023. [Google Scholar] [PubMed]
18. R. J. Rioja and J. Liu, “The evolution of Al-Li base products for aerospace and space applications,” Metallurgical and Materials Transactions A, vol. 43, no. 9, pp. 3325–3337, 2012. [Google Scholar]
19. M. P. Alam and A. N. Sinha, “Fabrication of third generation Al-Li alloy by friction stir welding: A review,” Sādhanā, vol. 44, no. 6, pp. 153, 2019. [Google Scholar]
20. D. Y. Rasposienko, L. I. Kaigorodova, V. G. Pushin and Y. M. Ustugov, “Multicomponent aging Al-Li-based alloys of the latest generation: Structural and phase transformations, treatments, properties, and future prospects,” Materials, vol. 15, no. 12, pp. 4190, 2022. [Google Scholar] [PubMed]
21. T. Z. Zhao, Z. X. Fan, H. Y. Peng, H. R. Chen and S. H. Zhang, “Mechanical properties and microstructure of extruded 2198 Al-Li alloy bars,” Journal of Materials Engineering and Performance, vol. 32, 2023. https://doi.org/10.1007/s11665-023-08319-0 [Google Scholar] [CrossRef]
22. Y. Wang and G. Zhao, “Hot extrusion processing of Al-Li alloy profiles and related issues: A review,” Chinese Journal of Mechanical Engineering, vol. 33, no. 1, pp. 64, 2020. [Google Scholar]
23. V. I. Elagin and V. V. Zakharov, “Modern Al-Li alloys and prospects of their development,” Metal Science and Heat Treatment, vol. 55, no. 3–4, pp. 184–190, 2013. [Google Scholar]
24. Y. Zhao, “Understanding and design of metallic alloys guided by phase-field simulations,” npj Computational Materials, vol. 9, no. 1, pp. 94, 2023. [Google Scholar]
25. Y. Liu, T. Zhao, W. Ju and S. Shi, “Materials discovery and design using machine learning,” Journal of Materiomics, vol. 3, no. 3, pp. 159–177, 2017. [Google Scholar]
26. S. Xi, J. Yu, L. Bao, L. Chen, Z. Li et al., “Machine learning-accelerated first-principles predictions of the stability and mechanical properties of L12-strengthened cobalt-based superalloys,” Journal of Materials Informatics, vol. 2, no. 3, pp. 15, 2022. [Google Scholar]
27. Y. Gao, S. Bai, K. Chong, C. Liu, Y. Cao et al., “Machine learning accelerated design of non-equiatomic refractory high entropy alloys based on first principles calculation,” Vacuum, vol. 207, pp. 111608, 2023. [Google Scholar]
28. Y. Zhao, K. Liu, H. Hou and L. Q. Chen, “Role of interfacial energy anisotropy in dendrite orientation in Al-Zn alloys: A phase field study,” Materials & Design, vol. 216, pp. 110555, 2022. [Google Scholar]
29. Y. Feng, Q. Wang, D. Wu, Z. Luo, X. Chen et al., “Machine learning aided phase field method for fracture mechanics,” International Journal of Engineering Science, vol. 169, pp. 103587, 2021. [Google Scholar]
30. J. Yu, F. Yu, Q. Fu, G. Zhao, C. Gong et al., “Combining machine learning and molecular dynamics to predict mechanical properties and microstructural evolution of FeNiCrCoCu high-entropy alloys,” Nanomaterials, vol. 13, no. 6, pp. 968, 2023. [Google Scholar] [PubMed]
31. O. Elgack, B. Almomani, J. Syarif, M. Elazab, M. Irshaid et al., “Molecular dynamics simulation and machine learning-based analysis for predicting tensile properties of high-entropy FeNiCrCoCu alloys,” Journal of Materials Research and Technology, vol. 25, pp. 5575–5585, 2023. [Google Scholar]
32. L. Chen, A. Jarlöv, H. L. Seet, M. L. S. Nai, Y. Li et al., “Exploration of V-Cr-Fe-Co-Ni high-entropy alloys with high yield strength: A combination of machine learning and molecular dynamics simulation,” Computational Materials Science, vol. 217, pp. 111888, 2023. [Google Scholar]
33. C. Zou, J. Li, W. Y. Wang, Y. Zhang, D. Lin et al., “Integrating data mining and machine learning to discover high-strength ductile titanium alloys,” Acta Materialia, vol. 202, pp. 211–221, 2021. [Google Scholar]
34. H. Sun, Z. Ding, H. Sun, J. Zhou, J. C. Ren et al., “An efficient scheme for accelerating the calculation of stacking fault energy in multi-principal element alloys,” Journal of Materials Science & Technology, vol. 175, pp. 204–211, 2024. [Google Scholar]
35. L. Jiang, Z. Zhang, H. Hu, X. He, H. Fu et al., “A rapid and effective method for alloy materials design via sample data transfer machine learning,” npj Computational Materials, vol. 9, no. 1, pp. 26, 2023. [Google Scholar]
36. Y. Zhao, H. Xing, L. Zhang, H. Huang, D. Sun et al., “Development of phase-field modeling in materials science in China: A review,” Acta Metallurgica Sinica (English Letters), vol. 36, pp. 1749–1775, 2023. https://doi.org/10.1007/s40195-023-01593-w [Google Scholar] [CrossRef]
37. Y. H. Zhao, “Editorial: Phase field method and integrated computing materials engineering,” Frontiers in Materials, vol. 10, pp. 1145833, 2023. [Google Scholar]
38. S. P. Ong, “Accelerating materials science with high-throughput computations and machine learning,” Computational Materials Science, vol. 161, pp. 143–150, 2019. [Google Scholar]
39. B. Li, Y. Du, Z. S. Zheng, X. C. Ye, D. Fang et al., “Manipulation of mechanical properties of 7xxx aluminum alloy via a hybrid approach of machine learning and key experiments,” Journal of Materials Research and Technology, vol. 19, pp. 2483–2496, 2022. [Google Scholar]
40. T. Liang, J. Wang, C. Xue, C. Zhang and M. Zhang, “Design of high strength and electrically conductive aluminium alloys by machine learning,” Materials Science and Technology, vol. 38, no. 2, pp. 116–129, 2022. [Google Scholar]
41. L. Jiang, C. Wang, H. Fu, J. Shen, Z. Zhang et al., “Discovery of aluminum alloys with ultra-strength and high-toughness via a property-oriented design strategy,” Journal of Materials Science & Technology, vol. 98, pp. 33–43, 2022. [Google Scholar]
42. Y. Zhang, P. Zhang, J. Li, Q. Zeng, M. Li et al., “Machine-learning assisted compositional optimization of 2xxx series aluminum alloys towards tensile strength,” Materials Research Express, vol. 10, no. 1, pp. 016518, 2023. [Google Scholar]
43. Y. F. Juan, G. S. Niu, Y. Yang, Y. B. Dai, J. Zhang et al., “Knowledge-aware design of high-strength aviation aluminum alloys via machine learning,” Journal of Materials Research and Technology, vol. 24, pp. 346–361, 2023. [Google Scholar]
44. X. Feng, Z. Wang, L. Jiang, F. Zhao and Z. Zhang, “Simultaneous enhancement in mechanical and corrosion properties of Al-Mg-Si alloys using machine learning,” Journal of Materials Science & Technology, vol. 167, pp. 1–13, 2023. [Google Scholar]
45. U. Masood Chaudry, K. Hamad and T. Abuhmed, “Machine learning-aided design of aluminum alloys with high performance,” Materials Today Communications, vol. 26, pp. 101897, 2021. [Google Scholar]
46. H. Li, X. Li, Y. Li, W. Xiao, K. Wen et al., “Machine learning assisted design of aluminum-lithium alloy with high specific modulus and specific strength,” Materials & Design, vol. 225, pp. 111483, 2023. [Google Scholar]
47. L. I. Kaigorodova, D. Y. Rasposienko, V. G. Pushin, V. P. Pilyugin and S. V. Smirnov, “Influence of severe plastic deformation on the structure and properties of Al-Li-Cu-Mg-Zr-Sc-Zn alloy,” Physics of Metals and Metallography, vol. 119, no. 2, pp. 161–168, 2018. [Google Scholar]
48. J. H. Hong, H. Park, J. Kim, M. Y. Seok, H. Choi et al., “Effect of the residual stress induced by surface severe plastic deformation on the tensile behavior of an aluminum alloy,” Journal of Materials Research and Technology, vol. 24, pp. 7076–7090, 2023. [Google Scholar]
49. M. S. Hasan, A. Kordijazi, P. K. Rohatgi and M. Nosonovsky, “Triboinformatic modeling of dry friction and wear of aluminum base alloys using machine learning algorithms,” Tribology International, vol. 161, pp. 107065, 2021. [Google Scholar]
50. M. Hu, Q. Tan, R. Knibbe, S. Wang, X. Li et al., “Prediction of mechanical properties of wrought aluminium alloys using feature engineering assisted machine learning approach,” Metallurgical and Materials Transactions A, vol. 52, no. 7, pp. 2873–2884, 2021. [Google Scholar]
51. X. Pei, Y. H. Zhao, L. Chen, Q. Guo, Z. Duan et al., “Robustness of machine learning to color, size change, normalization, and image enhancement on micrograph datasets with large sample differences,” Materials & Design, vol. 232, pp. 112086, 2023. [Google Scholar]
52. Q. Tao, P. Xu, M. Li and W. Lu, “Machine learning for perovskite materials design and discovery,” npj Computational Materials, vol. 7, no. 1, pp. 23, 2021. [Google Scholar]
53. M. Kannaiyan, G. karthikeyan and J. G. Thankachi Raghuvaran, “Prediction of specific wear rate for LM25/ZrO2 composites using Levenberg-Marquardt backpropagation algorithm,” Journal of Materials Research and Technology, vol. 9, no. 1, pp. 530–538, 2020. [Google Scholar]
54. X. W. Yang, J. C. Zhu, Z. S. Nong, D. He, Z. H. Lai et al., “Prediction of mechanical properties of A357 alloy using artificial neural network,” Transactions of Nonferrous Metals Society of China, vol. 23, no. 3, pp. 788–795, 2013. [Google Scholar]
55. D. Merayo, A. Rodríguez-Prieto and A. M. Camacho, “Topological optimization of artificial neural networks to estimate mechanical properties in metal forming using machine learning,” Metals, vol. 11, no. 8, pp. 1289, 2021. [Google Scholar]
56. W. Yi, G. Liu, Z. Lu, J. Gao and L. Zhang, “Efficient alloy design of Sr-modified A356 alloys driven by computational thermodynamics and machine learning,” Journal of Materials Science & Technology, vol. 112, pp. 277–290, 2022. [Google Scholar]
57. Q. Guo, X. Xu, X. Pei, Z. Duan, P. K. Liaw et al., “Predict the phase formation of high-entropy alloys by compositions,” Journal of Materials Research and Technology, vol. 22, pp. 3331–3339, 2023. [Google Scholar]
58. H. Zhang, H. Fu, X. He, C. Wang, L. Jiang et al., “Dramatically enhanced combination of ultimate tensile strength and electric conductivity of alloys via machine learning screening,” Acta Materialia, vol. 200, pp. 803–810, 2020. [Google Scholar]
59. X. Liu, Z. Long and L. Peng, “Prediction of Vickers hardness of amorphous alloys based on interpretable machine learning,” Journal of Non-Crystalline Solids, vol. 602, pp. 122095, 2023. [Google Scholar]
60. J. Xiong, S. Q. Shi and T. Y. Zhang, “Machine learning of phases and mechanical properties in complex concentrated alloys,” Journal of Materials Science & Technology, vol. 87, pp. 133–142, 2021. [Google Scholar]
61. M. Ye, L. Li, D. Y. Yoo, H. Li, C. Zhou et al., “Prediction of shear strength in UHPC beams using machine learning-based models and SHAP interpretation,” Construction and Building Materials, vol. 408, pp. 133752, 2023. [Google Scholar]
62. L. Wu, X. Li and H. Wang, “Significant roles of minor Mg addition in microstructural evolution and mechanical properties of cast Al-3Li-2Cu-0.15Zr alloy,” Journal of Alloys and Compounds, vol. 857, pp. 157600, 2021. [Google Scholar]
63. L. Wu, X. Li and H. Wang, “The effect of major constituents on microstructure and mechanical properties of cast Al-Li-Cu-Zr alloy,” Materials Characterization, vol. 171, pp. 110800, 2021. [Google Scholar]
Cite This Article
 Copyright © 2023 The Author(s). Published by Tech Science Press.
This work is licensed under a Creative Commons Attribution 4.0 International License , which permits unrestricted use, distribution, and reproduction in any medium, provided the original work is properly cited.
 Downloads
 Citation Tools