
 Submit a Paper
 Propose a Special lssue
 Open Access
ARTICLE

DM Code Key Point Detection Algorithm Based on CenterNet
1 School of Information Engineering, Chang’an University, Xi’an, 710018, China
2 Algorithm Research and Development Department, GRGBanking Equipment Co., Ltd., Guangzhou, 510663, China
3 Research and Development Department, Xi’an Soar Electromechanical Technology, Ltd., Xi’an, 710043, China
* Corresponding Author: Xinyao Tang. Email:
(This article belongs to the Special Issue: Advanced Artificial Intelligence and Machine Learning Frameworks for Signal and Image Processing Applications)
Computers, Materials & Continua 2023, 77(2), 1911-1928. https://doi.org/10.32604/cmc.2023.043233
Received 26 June 2023; Accepted 27 September 2023; Issue published 29 November 2023
 View Full Text
 Download PDF
Abstract
Data Matrix (DM) codes have been widely used in industrial production. The reading of DM code usually includes positioning and decoding. Accurate positioning is a prerequisite for successful decoding. Traditional image processing methods have poor adaptability to pollution and complex backgrounds. Although deep learning-based methods can automatically extract features, the bounding boxes cannot entirely fit the contour of the code. Further image processing methods are required for precise positioning, which will reduce efficiency. Because of the above problems, a CenterNet-based DM code key point detection network is proposed, which can directly obtain the four key points of the DM code. Compared with the existing methods, the degree of fitness is higher, which is conducive to direct decoding. To further improve the positioning accuracy, an enhanced loss function is designed, including DM code key point heatmap loss, standard DM code projection loss, and polygon Intersection-over-Union (IoU) loss, which is beneficial for the network to learn the spatial geometric characteristics of DM code. The experiment is carried out on the self-made DM code key point detection dataset, including pollution, complex background, small objects, etc., which uses the Average Precision (AP) of the common object detection metric as the evaluation metric. AP reaches 95.80%, and Frames Per Second (FPS) gets 88.12 on the test set of the proposed dataset, which can achieve real-time performance in practical applications.Keywords
DM code appears as a square or rectangular symbol comprising many small squares, and its data is stored in a combination of white and black square arrangements. It is widely used in industrial and logistics fields due to its high density, small size, and much-stored information. In practical applications, the critical steps of DM code reading are positioning and decoding, and an efficient and accurate positioning algorithm is essential for accurate DM code reading.
Currently, the methods of DM code positioning can be divided into two categories: (1) Traditional image processing methods. (2) Deep learning methods.
(1) Traditional image processing methods. To detect the edges and corner points of DM code, domain transform, threshold segmentation, and feature point operator-based methods are used in these approaches. Leong et al. [1] proposed a method in which feature points were extracted using the Speeded Up Robust Features (SURF) operator. The DM code is coarsely localized by feature point matching, then the DM code is locally segmented using the Otsu thresholding and diffuse filling algorithms to obtain connected regions, and finally, the DM code is precisely positioned using the Hough transform. However, this method has a lengthy processing time and high requirements for the quality of the DM code edge. Hu et al. [2] proposed a Two-Dimensional code detection method based on the Randon domain transform to extract 2D code features in the Rondon domain. This method is time-consuming. It cannot address the problem of feature contamination, but it can withstand noise interference and adapt to perspective-transformed images to a certain extent. Ha et al. [3] proposed a strategy of contour distance array estimation, which first roughly locates DM code based on morphological processing to determine the joint region, and then builds an array of boundary contour distance distribution to estimate the rotational angle of DM code based on their boundary characteristics, which is more dependent on the complete boundary of DM code and cannot be applied to cases such as code blurring and wear. To correct and recognize perspective deformation and column surface distortion DM code, Wang et al. [4] proposed several recognition methods for complex background and deformation DM code. However, the algorithms are time-consuming and cannot meet the industrial production demand in real time. Li et al. [5] proposed a feature edge pinpointing method based on the L-edge of DM code. The method includes fast positioning and priority ranking of DM code candidate regions based on corner point distribution, contour extraction through DM code candidate regions to reduce the interference produced by non-interest edges on positioning, and linear fitting using improved Hough transform and iterative weighted least squares method to pinpoint L-edge. This technique can significantly speed up the positioning of DM code with low contrast and poor resolution. Still, it demands excellent integrity for the edges of the DM code features and cannot be used in scenarios with contamination or wear. Yang et al. [6] proposed a DM code positioning algorithm based on corner points and region growth. Firstly, Harris corner points are used as high-frequency features, and a Gaussian pyramid is constructed to filter the background metal texture corner points. Radial basis functions are introduced to smooth the corner point density map, candidate regions are coarsely localized by threshold segmentation as well as region growth, and finally, the minimum outer rectangle is calculated and corrected to achieve fine positioning. This method improves the detection efficiency of tiny DM code to a certain extent. Omar et al. [7] proposed a particular solution for Quick Response (QR) code detection in uncontrolled environments. A binary large object- (BLOB-) based algorithm with subsequent iterative filtering QR symbol position detection patterns is used in recognizing geometrical features of QR code. The method is not time-consuming. However, it cannot be adaptive to small codes. Li et al. [8] proposed a DM code recognition algorithm based on local thresholding and the Otsu algorithm. Firstly, local thresholding and the Otsu algorithm are used to realize the binarization of the image containing DM code; then, corrosion, expansion, and other algorithms are used to filter out the background further, and the Canny algorithm is used to detect the edges of the Data Matrix code; finally, Hough transform is used to extract the L-shape region, and rotation, interpolation and other operations are carried out to realize the identification of the 2D code region. This method has high accuracy, but the processing is complicated and time-consuming. Ladislav et al. [9] have devised and compared various methods for localizing DM code in arbitrary images, all using a typical L-shaped lookup pattern to detect DM code in images. Although such approaches have a high detection rate, the immunity to interference is potentially insufficient. These techniques have high background differentiation and can localize objects quickly and precisely in less distracting environments. However, scenarios, contamination, and other factors frequently exist in actual production, making it difficult for image processing techniques to meet the demand for precise positioning.
(2) Deep learning methods. With the rapid advancement of deep learning in recent years, several outstanding object detection algorithms have surfaced [10–13], considerably enhancing object detection accuracy by automatically extracting characteristics. A deep learning-based 2D code identification system based on the Mask Region-based Convolutional Neural Network (R-CNN) [14] segmentation model was proposed by Cai et al. [15]. Still, it did not include DM code detection in industrial environments despite having a greater recognition speed in reflected backlight scenarios. Yang et al. [16] proposed an improved You Only look Once (YOLOv3-ms) for 2D code detection. Firstly, adding Spatial Pyramid Pooling (SPP) structure to the original YOLOv3 network for multi-scale feature fusion. The K-Means algorithm is used to re-cluster the prior frame for the dataset, which helps to shorten the training time. Finally, the Mosaic data enhancement method is used to expand the dataset during the training process, which has high detection speed and accuracy, but is only limited to high resolution and clear 2D code images. Hu et al. [17] proposed a semantic segmentation-based DM code positioning method. Firstly, the Semantic Segmentation Network (SegNet) [18] is used to segment the DM code region from the image and localize and decode the 2D code for the region. While this method has a high level of accuracy, its inference speed is slow and cannot keep up with the demands of real-time industrial production. Guney et al. [19] proposed an image processing and YOLO algorithm based on Electric shore-to-ship charging socket detection, using image processing techniques to preprocess the input image and extract the relevant features. Then the YOLO algorithm is used to achieve real-time detection and positioning of charging sockets, which is faster to reason than the semantic segmentation approach. Still, we are more committed to getting the results in one inference. Wan et al. [20] proposed a lightweight CenterNet network for multi-scale 2D code positioning by lightweighting the backbone of the original CenterNet network to Cross Stage Partial Network Tiny (CSPDarkNet53-Tiny), while adding SPP modules to the network structure for multi-scale fusion and replacing the normal convolution in the detection head part with a depth-separable convolution, which realizes fast 2D code recognition in low configuration conditions. Almeida et al. [21] compared and analyzed several deep neural networks for detecting and decoding DM code in complex indoor environments. They investigated various deep neural network architectures ranging from two-stage to single-stage and evaluated their performance detecting DM code in indoor environments. The experimental results show that deep neural networks perform better in detecting and decoding DM code with higher accuracy and robustness than traditional methods. Lou et al. [22] proposed a YOLOv5-based QR code recognition algorithm. By designing a customized neural network architecture for the specific attributes and structure of QR codes, and YOLOv5 is used to model training and inference, the algorithm can quickly and accurately detect and recognize QR codes in complex images, and the results show that the algorithm performs excellently in terms of performance and robustness through a large amount of experimental data evaluation and comparison. Although these techniques can increase detection accuracy, they can only use a horizontal 2D box for the envelope. Since the detection box contains more background areas, which cannot get the positioning results of the fit code, it must still use an image processing algorithm, which lowers the algorithm’s overall effectiveness. In practical applications, 2D codes usually have arbitrary rotational angles and perspective transformation, and to further improve the positioning accuracy, some scholars [23] proposed the solution of rotational object detection by increasing the rotational angle based on the horizontal 2D box, which solves the problem of including more background areas during detection to the maximum extent. Ma et al. [24] developed a Rotated Region of Interest (RRoI) pooling layer for extracting rotational characteristics based on Region Proposal Network (RPN). They suggested an arbitrary orientation text detection framework based on natural scene images, which can effectively improve text detection accuracy. To generate RRoI, Ding et al. [25] proposed a method based on horizontal prior box learning that effectively solves the misalignment issue between feature regions and objects. Yang et al. [26] proposed an end-to-end rotational object detector with feature refinement. They introduce the idea of denoising into the network structure and adjust the refined bounding box to the corresponding object to achieve feature reconstruction and alignment. Zhou et al. [27] proposed the polar coordinate system for rotational object detection. They developed a prior frame-free polar coordinate remote sensing object detection framework, Polar Remote Sensing Object Detector (P-RSDet), in which the polar coordinates regression approach is used to enhance the correlation between regression parameters and improve the convergence speed of the network. A two-stage rotational object detection framework called Oriented R-CNN was proposed by Xie et al. [28] that first generates directed candidate boxes by Oriented RPN and then extracts fixed-size features by RRoI Align to align features and objects. This framework has higher accuracy but still necessitates setting a priori boxes, making the process more laborious. Han et al. [29] proposed a rotational object detection network, Single-shot Alignment Network (S2A-Net), based on feature alignment, which effectively solves the problem of inconsistency between regression and classification by using a Feature Alignment Module (FAM) and Orientation Detection Module (ODM). Although these methods can make the detection box fit the object contour to a certain extent, they still cannot achieve a complete fit for quadrilaterals with perspective transformation.
Table 1 summarizes the characteristics of the above two types of methods. Although the traditional image processing methods have a solid ability for fine positioning, the interference resistance is poor; deep learning methods are primarily horizontal 2D frame detection but do not achieve fine positioning, and the rotational object detection lacks the processing of perspective deformation, the model is not only too complex but slower. In summary, there needs to be a method to achieve DM code fine positioning directly through neural networks and to meet industrial real-time demands. To address the above problems, we propose a DM code key point detection network based on CenterNet, which can directly obtain the four corner point positions of DM code and localize the DM code at the corner point level. The two contribution goals of this paper are summarized as follows:

a. We proposed a DM code key point detection algorithm based on CenterNet, which can directly detect the four key points of DM code. In addition, for the geometric characteristics of DM code, we designed a series of enhanced loss functions to make full use of this characteristic and further improve the accuracy and speed of the algorithm.
b. We proposed a DM code key point detection dataset, including DM code with complex backgrounds, contamination, and small objects, to demonstrate the effectiveness and robustness of our algorithm.
As shown in Fig. 1, the overall flow chart of the proposed DM code key point detection algorithm is shown in this paper.
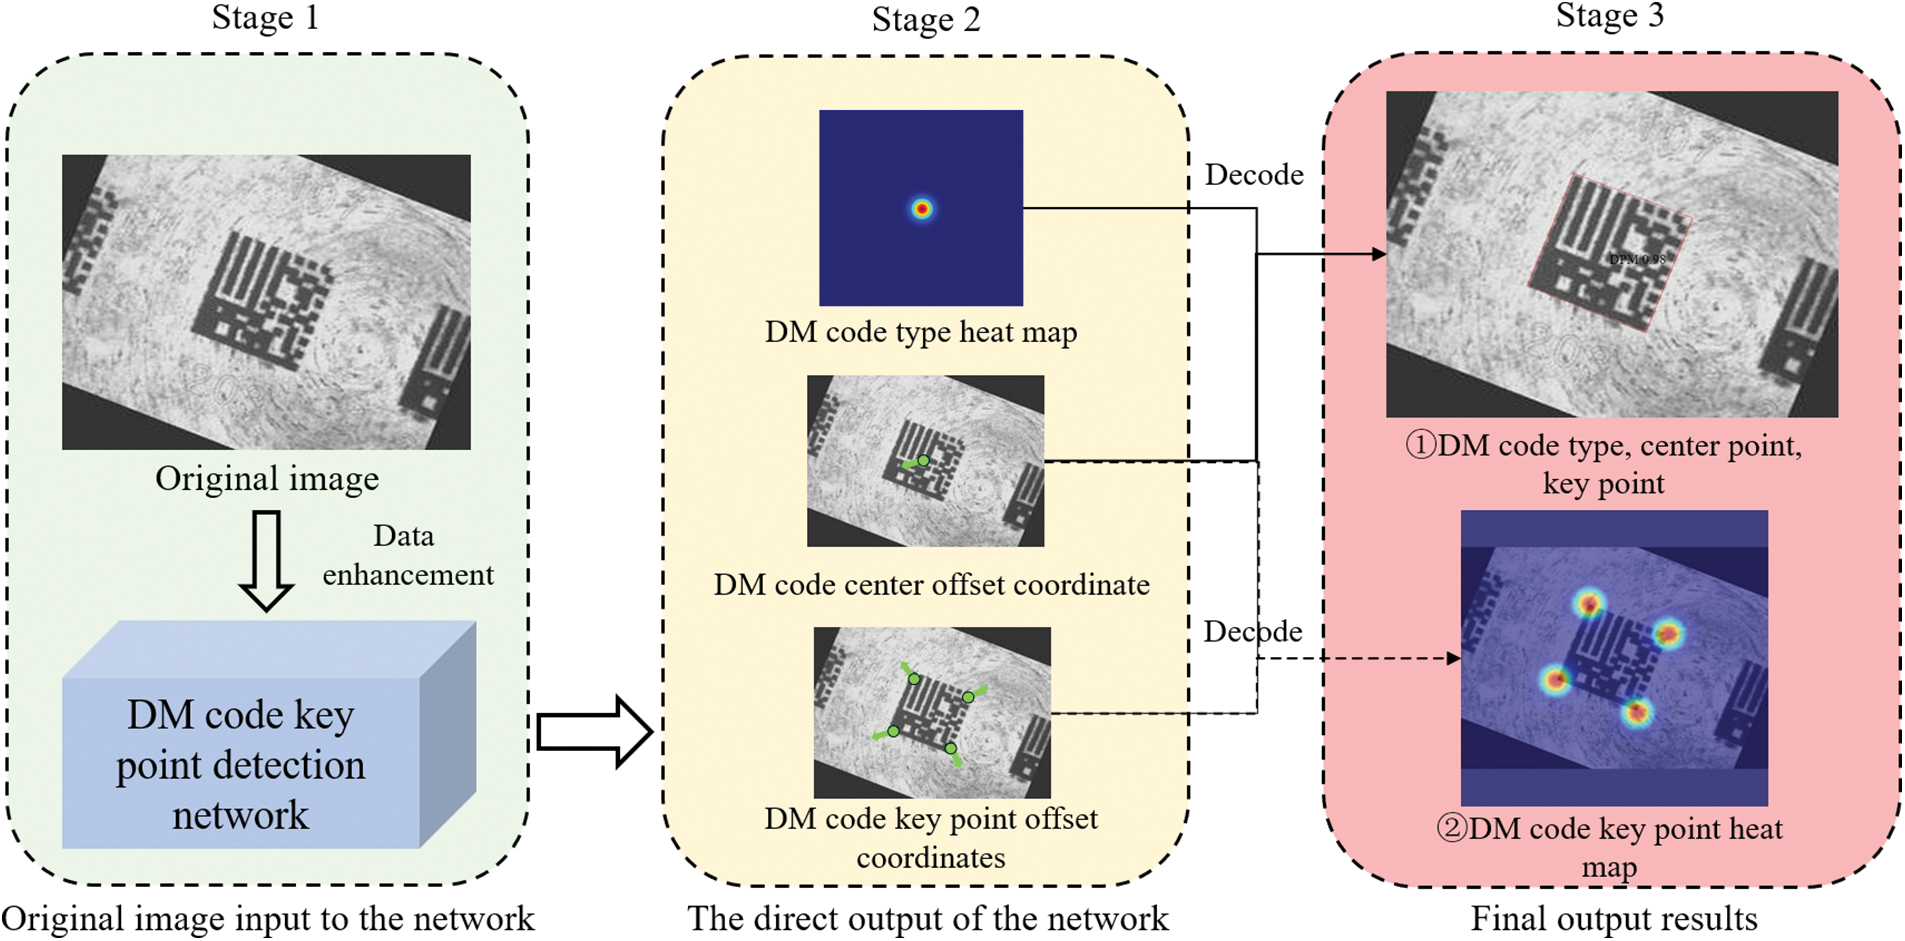
Figure 1: Flow chart of DM code key point detection
Firstly, the original image containing the DM code is fed into the designed network after data enhancement, as shown in Stage 1 in Fig. 1; then, the DM code type is decoded by the heat map obtained from the network, and the image coordinates of DM code center offset and DM key point offset are also regressed, as shown in Stage 2 in Fig. 1; finally, the type and offset information are decoded into the final results, as shown in Stage 3 in Fig. 1.
3 DM Code Key Point Detection Network
CenterNet is a representative anchor-free object detection algorithm with a simple design and good scalability, so it is chosen as the base network and improved with the application of the algorithm in this paper. The overall structure of the network in this paper is shown in Fig. 2, which contains three parts: the backbone feature extraction network, the enhanced feature extraction network, and the multi-task detector.
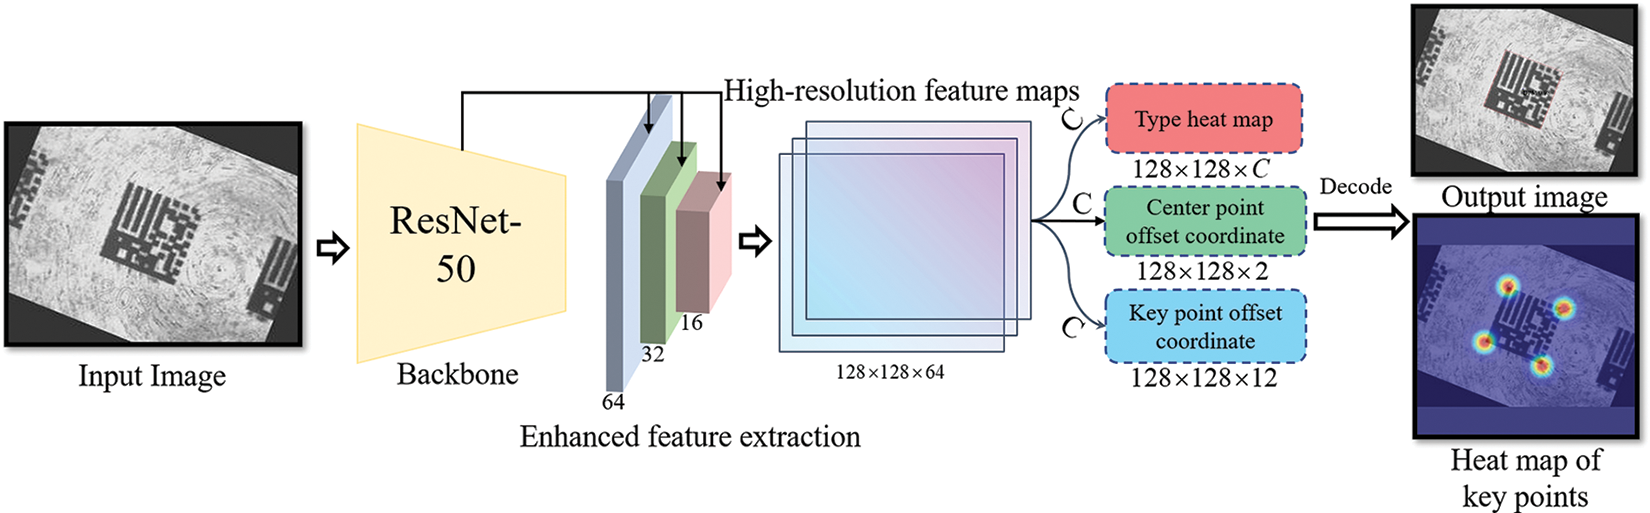
Figure 2: Network structure of DM code key point detection
In the structure, we define the input image as
In Fig. 2, we use ResNet-50 [30] as our backbone feature extraction network. Engineering applications and experiments show that the backbone has a substantial feature extraction and generalization capability, and the number of parameters is smaller. As a result, we can obtain three feature maps from the backbone with size
To improve the detection ability of multi-scale DM code, we weigh and fuse the three feature maps obtained from the backbone feature extraction network and get a fused high-resolution feature map with size
Compared with the traditional loss function design based on the 2D detection box, the DM code of the detection object in this paper contains more directional randomness, so it is necessary to utilize some geometric constraints in the loss function to obtain accurate detection results. Therefore, in the training process of the algorithm, we divide the loss function into the base loss function and the enhanced loss function. The base loss function comprises three parts: DM code classification loss, DM code center offset coordinate regression loss, and DM code key point offset coordinate regression loss. And the enhanced loss function consisted of three other components: DM code key point heat map loss, standard DM code projection loss, and DM code polygon IoU loss.
(1) DM code classification loss. DM code occupies a few areas in the image with typical positive and negative sample imbalance characteristics. To solve the problem of positive and negative sample imbalances, we use the modified Focal Loss with the following equation:
where
(2) DM code offset coordinate regression loss. We use L1 regression loss with the following equations:
where
To further improve the DM code key point detection accuracy, we designed the enhanced loss function by adding the geometric constraints of the DM code into the loss function as follows:
(1) DM code key point heat map loss. A set of key points in the graph can correspond to a group of responding heat maps. When the key point locations are predicted accurately, the corresponding heat map responding values will also be located at the exact locations, so we use heat maps to further constrain the key point locations. As shown in Fig. 3, the DM code key point offset is recovered to the DM code key point coordinates, and a set of response values
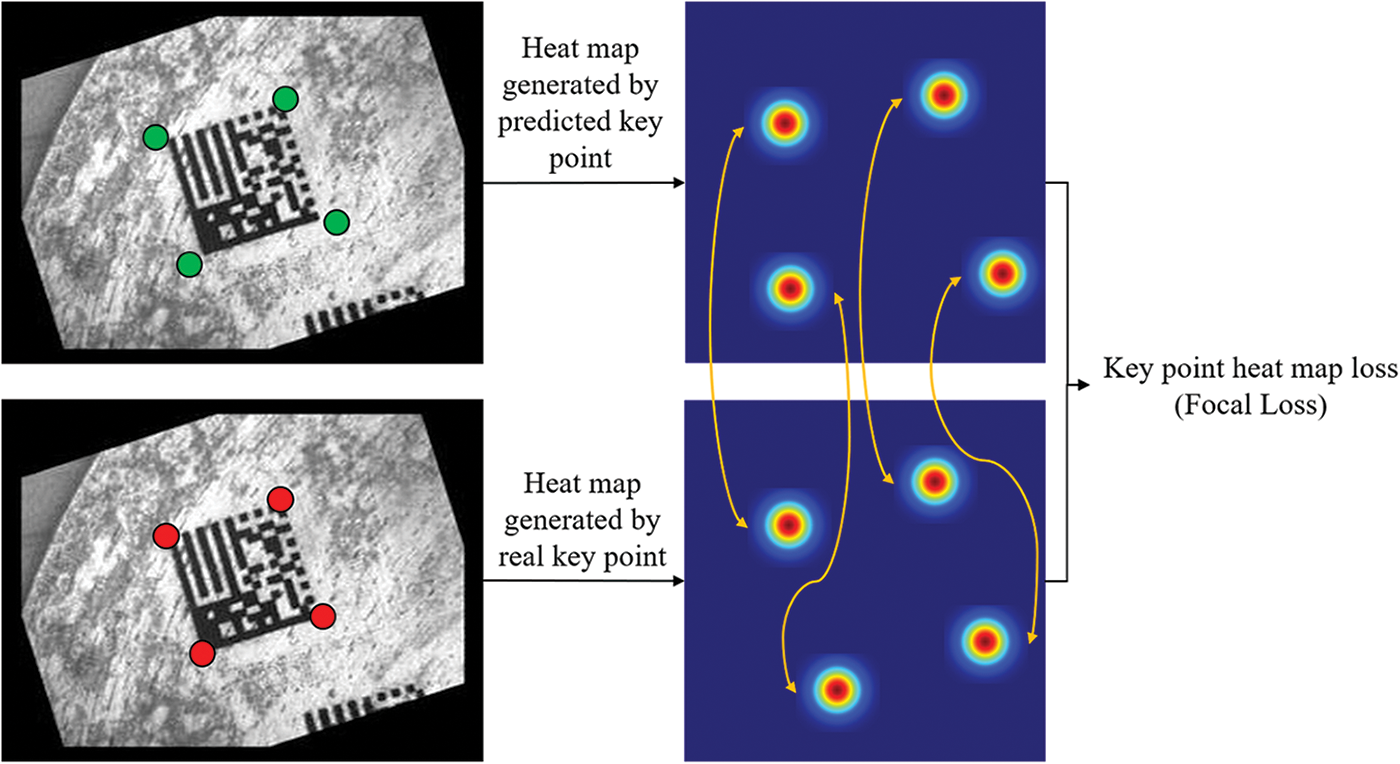
Figure 3: Diagram of heatmap loss of DM code key point detection
(2) Standard DM code projection loss. Since the DM code has the same number of grids in the width and height directions, they are presented as squares in physical space. Each DM code in the image can be perspective transformed to obtain the corresponding standard square DM code image, so we use the perspective transformation projection to constrain the DM code key point prediction further. The real perspective transformation matrix is generated from the actual annotation, defined as the standard DM code perspective transformation, and the obtained center and key points are considered standard. As shown in Fig. 4, the network output’s DM code center and key point offset are recovered to the predicted DM code center and key point coordinates. Then the predicted standard DM code center and key point are obtained by the perspective transformation of the corresponding standard DM code, which constitutes a set of constraints with the actual standard DM code center and key point. We use L1 regression loss with the following equation:
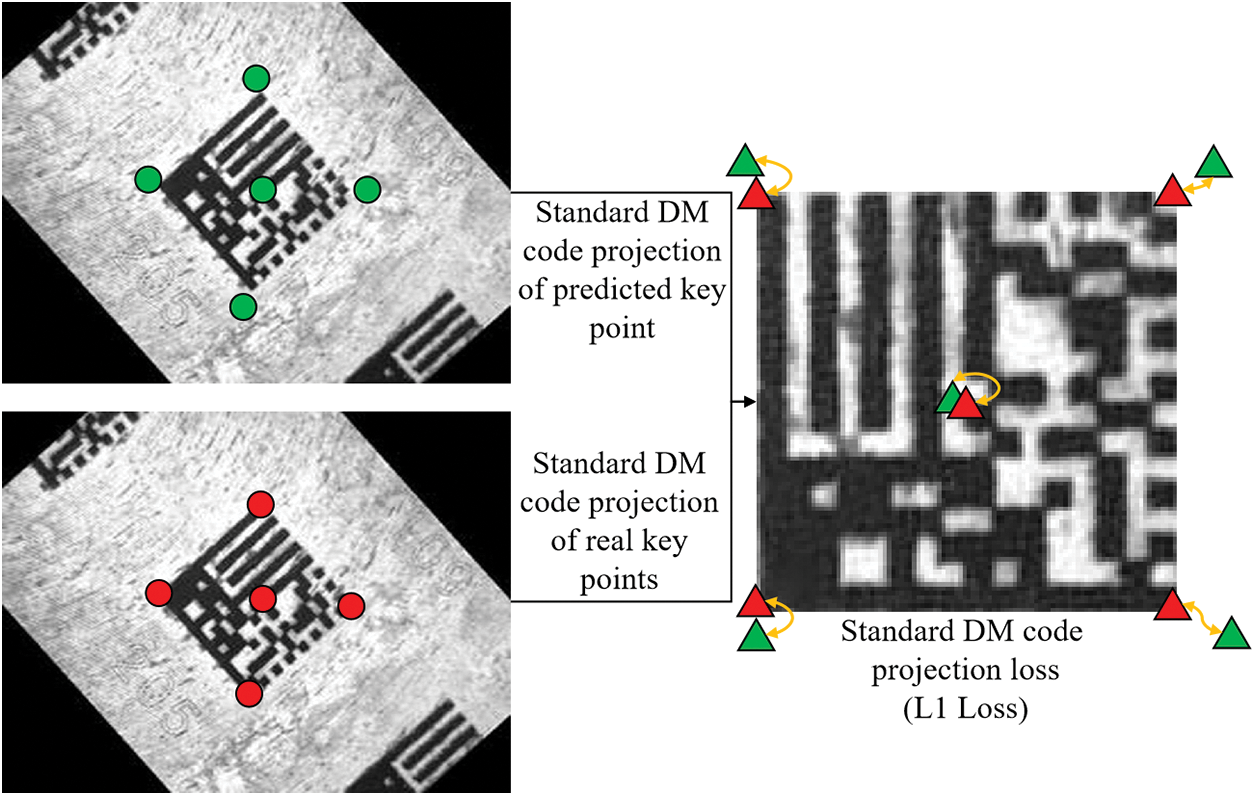
Figure 4: Diagram of standard DM code projection loss
where
(3) DM code polygon IoU loss. The IoU loss can reflect both the correlation between key point coordinates and the matching degree of key points enclosing polygons, which is conducive to faster convergence of the network. Since the DM code is an irregular quadrilateral, we use polygonal IoU loss to constrain the DM code key point locations further. As shown in Fig. 5, the IoU of the polygon formed by the true DM code key points and the polygon formed by the coordinates of the DM code key points, which is recovered by decoding the DM code key point offset from the network output, constitute a set of constraints using the L1 regression loss as follows:

Figure 5: Diagram of DM code polygon IoU loss
where
With the above six loss functions, the multi-task loss function can be defined as follows:
where
4 Experimental Results and Analysis
4.1 DM Code Key Point Detection Data Set
To perform DM code key point detection, we produced a DM code key point detection dataset with two types of acquisition devices: fixed and non-fixed. Fixed type for industrial camera shooting, non-fixed type for ordinary camera shooting. The DM code type is DPM code, mainly used for DM code marked on parts in industrial production environments. For the annotation tool, we use the polygon annotation tool named LabelMe, and the DM code center is represented by the intersection of the two diagonals of the label. Finally, we obtained 3112 samples for the dataset, including 2956 for the training set and 156 for the validation test set. As shown in Fig. 6, sample examples of the data set are shown, including cases of small codes, worn codes, and complex backgrounds. In Table 2, the number of images acquired by each device and the number of each particular sample are shown.

Figure 6: Examples of samples in the dataset

4.2.1 Hardware and Software Environment
The algorithm in this paper is implemented using the PyTorch deep learning framework with a Core i7-8700 CPU and a GTX 1080Ti GPU. We used the above homemade dataset for experimental validation. The dataset is divided into training and validation test sets in the ratio of 9.5:0.5. During training, we use the Adam optimizer with an initial learning rate of 0.001, and the backbone feature network is selected as ResNet-50 for feature extraction, with migration learning accelerating convergence using a pre-trained model of the ImageNet dataset.
The actual shooting scenes are complex and variable, and the limited locations in the dataset are far from being able to simulate all the acquisition environments. Therefore, to expand the number of samples in the dataset and prevent the network from overfitting, data enhancement, including random contrast transformation, horizontal flipping, and rotation, is performed during the training process. Meanwhile, according to the camera imaging principle, the changes in camera spatial position, view angle, and internal parameters correspond to the changes in the projection matrix. Thus, we use the perspective transformation in the image to simulate this projection change for simulating the variable image acquisition view angle. After data enhancement, the training validation set can be expanded from 3112 images to 5 times the original. Fig. 7 shows the diagram of data enhancement, we padded the image with gray pixels to prevent scale distortion.

Figure 7: Diagram of data augmentation
We refer to AP [32], a common evaluation metric for object detection, for the evaluation of algorithm accuracy, and use polygon IoU to calculate the Intersection-over-Union ratio as follows:
where
The algorithm speed is expressed using FPS with the following equation:
where
4.3 DM Code Key Point Detection Results
Table 3 shows the statistical detection results of this paper using Eqs. (8) and (9) on the test set of the DM code key point detection dataset. As shown in Fig. 8, a visualization of the DM code detection results on the test set of the DM code key point detection dataset, including the positioning results and the heat map, is shown. From Table 3 and Fig. 8, it can be seen that our algorithm can locate DM code accurately in a variety of environments while meeting the real-time requirements in practical applications. And Fig. 9 shows a graph of the AP results for DM code key point detection.

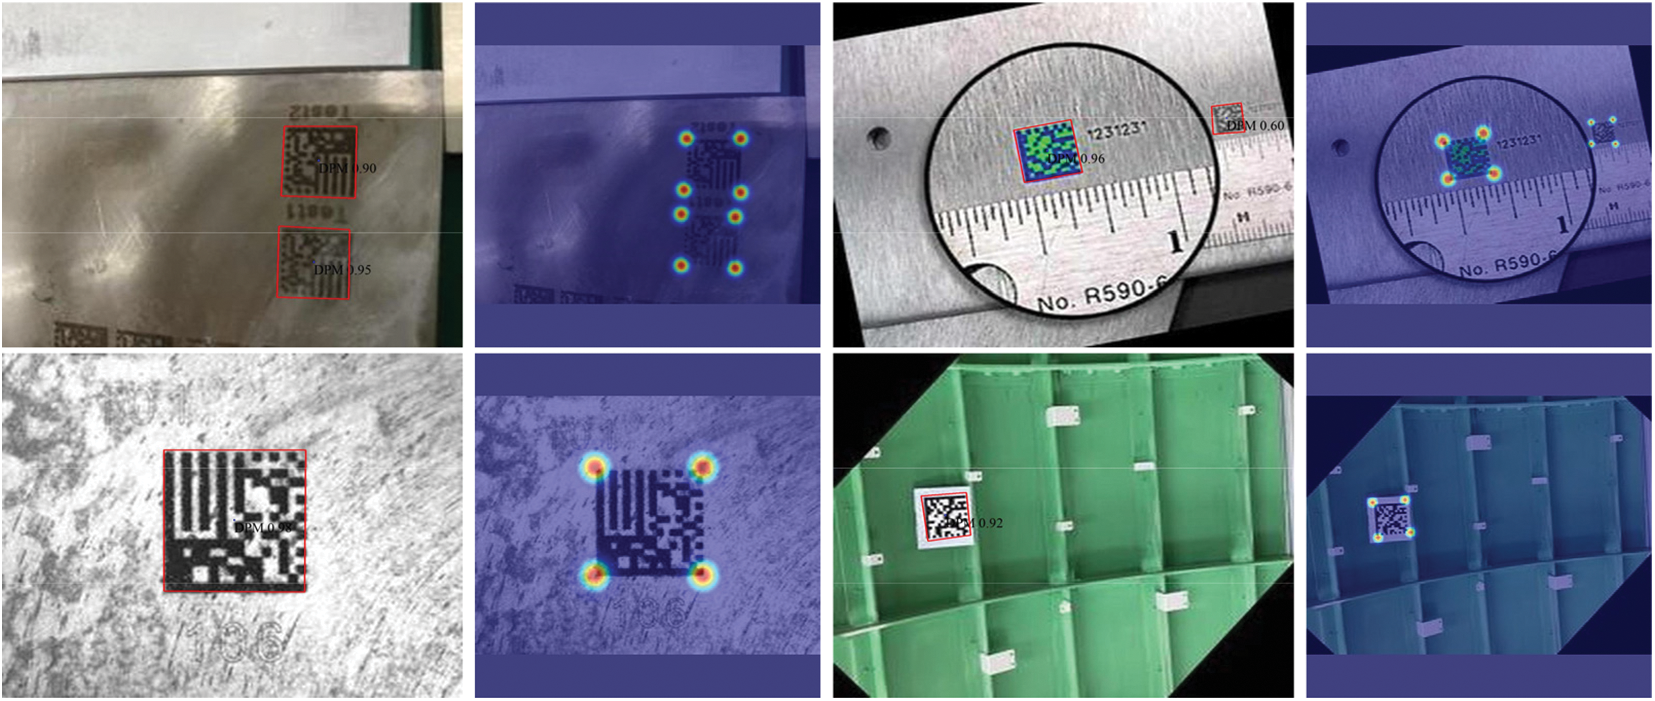
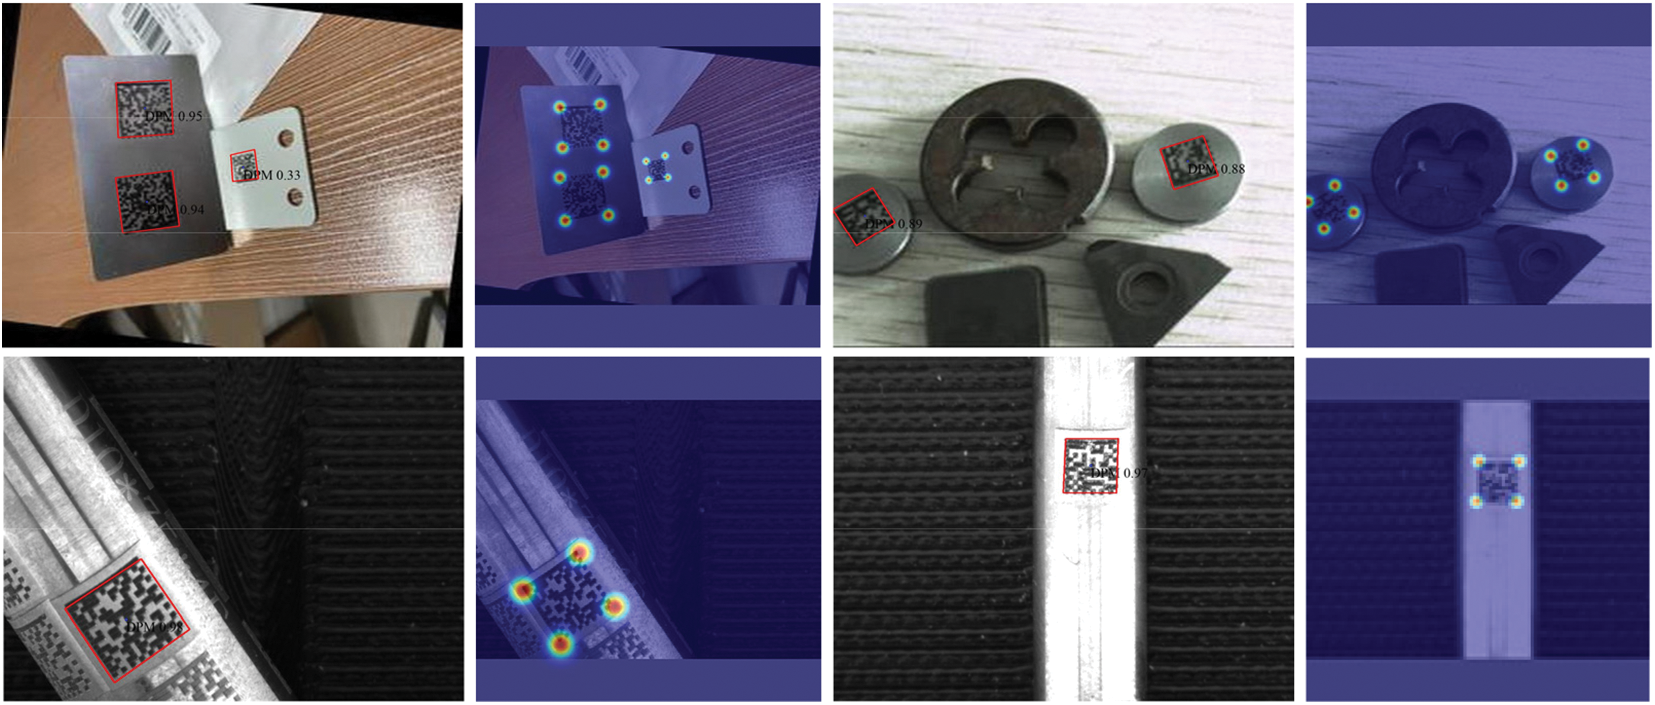
Figure 8: Visualization of DM code detection results on the test set of DM key point detection dataset

Figure 9: AP of DM key point detection
To demonstrate that our algorithm is more accurate in DM code positioning with perspective transformation, we selected the object detection algorithms of the horizontal 2D box and the rotational 2D box for training and testing on the above dataset. The comparison results are shown in Table 4. Besides, the visualization of detection results of the six algorithms on perspective transformation, small, worn, and multiple codes are shown in Fig. 10. From Table 4 and Fig. 10, it can be revealed that although the horizontal 2D box detection algorithms can achieve the best AP and FPS, the fit degree of DM code is low with more background left. While the rotational 2D box detection algorithm can get better performance in fitting the code, however, AP and FPS are lower than horizontal 2D detection. In contrast, our algorithm can achieve precise code alignment with high AP and FPS. In addition, in Table 4, the calculation of AP depends on the detection methods. Horizontal IoU is used in the horizontal 2D box, while polygonal IoU is used in rotational 2D box and key point detection.

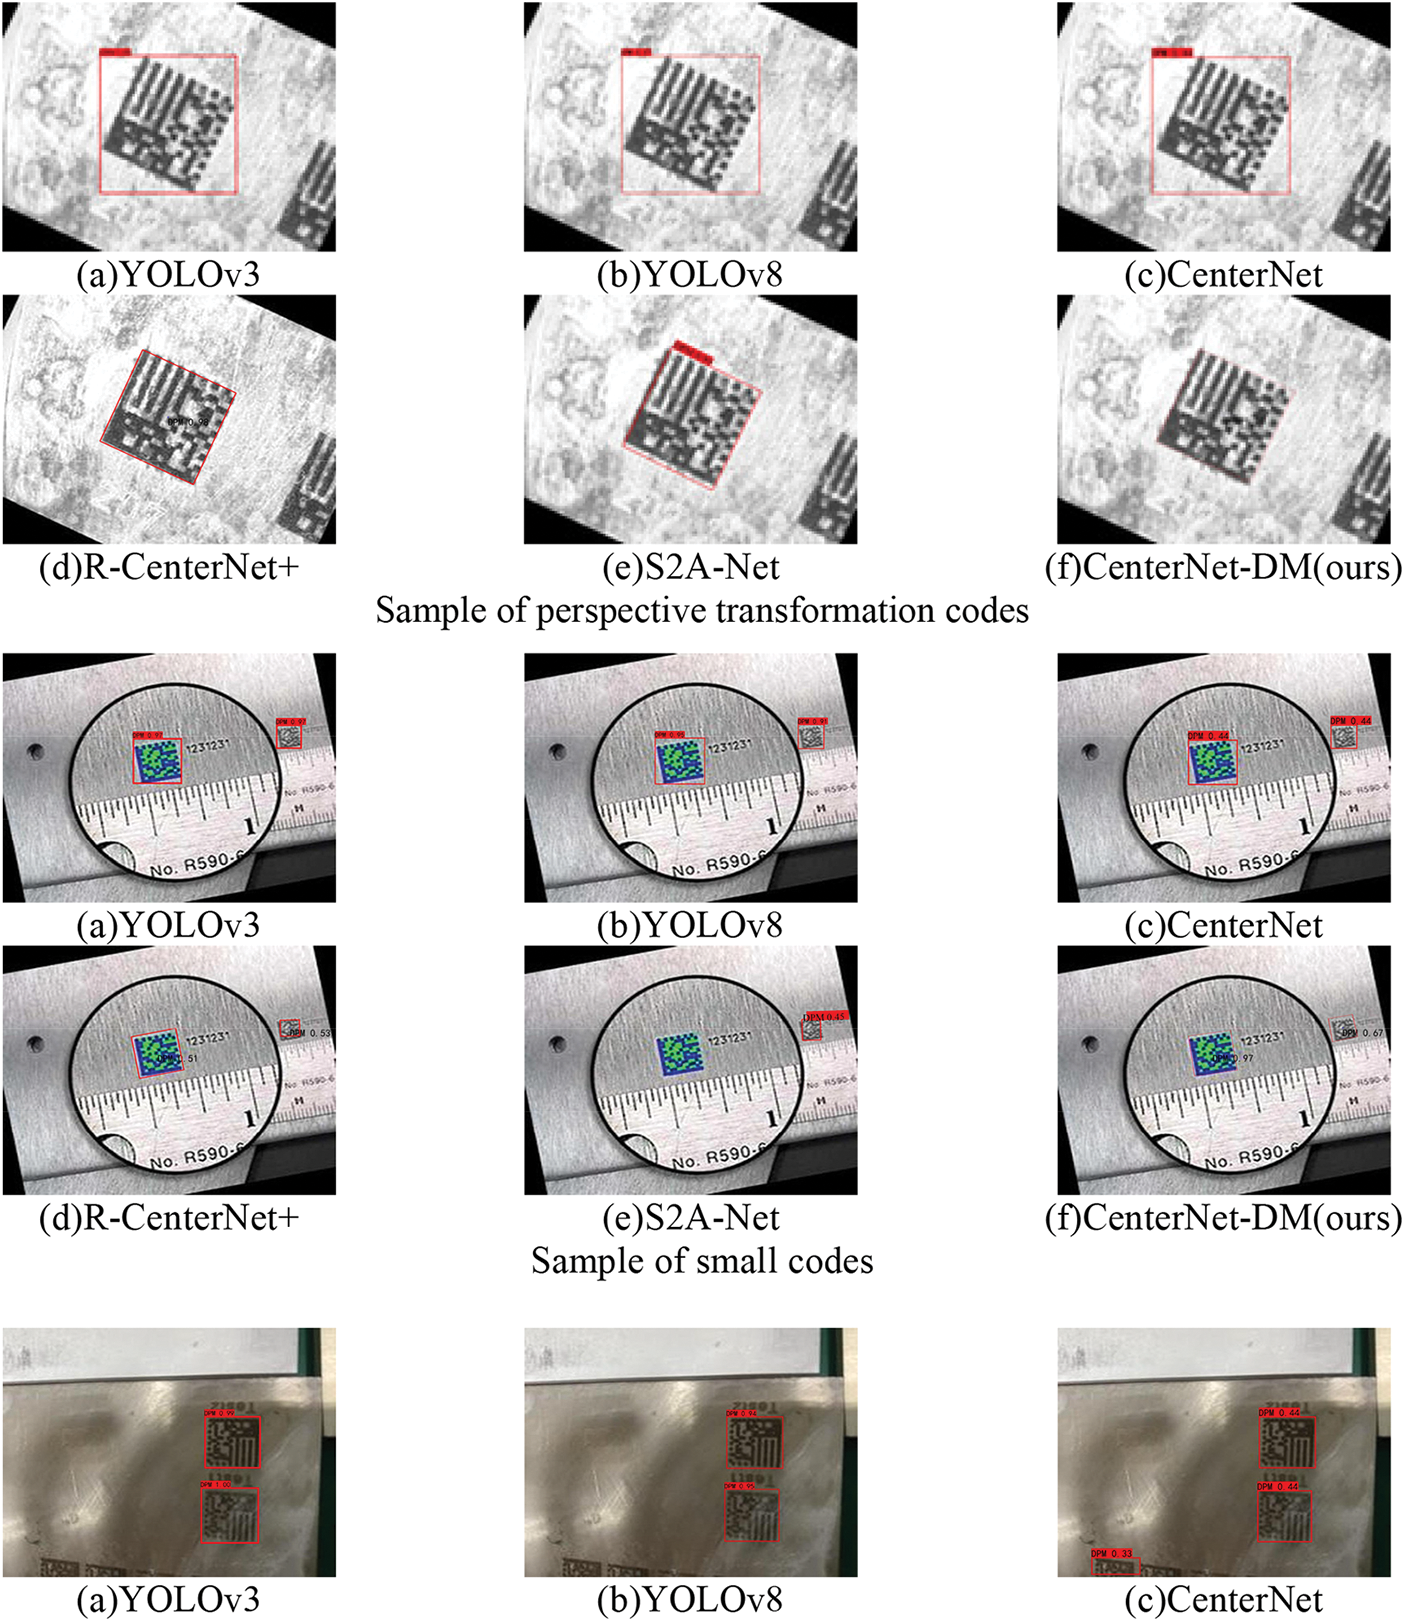
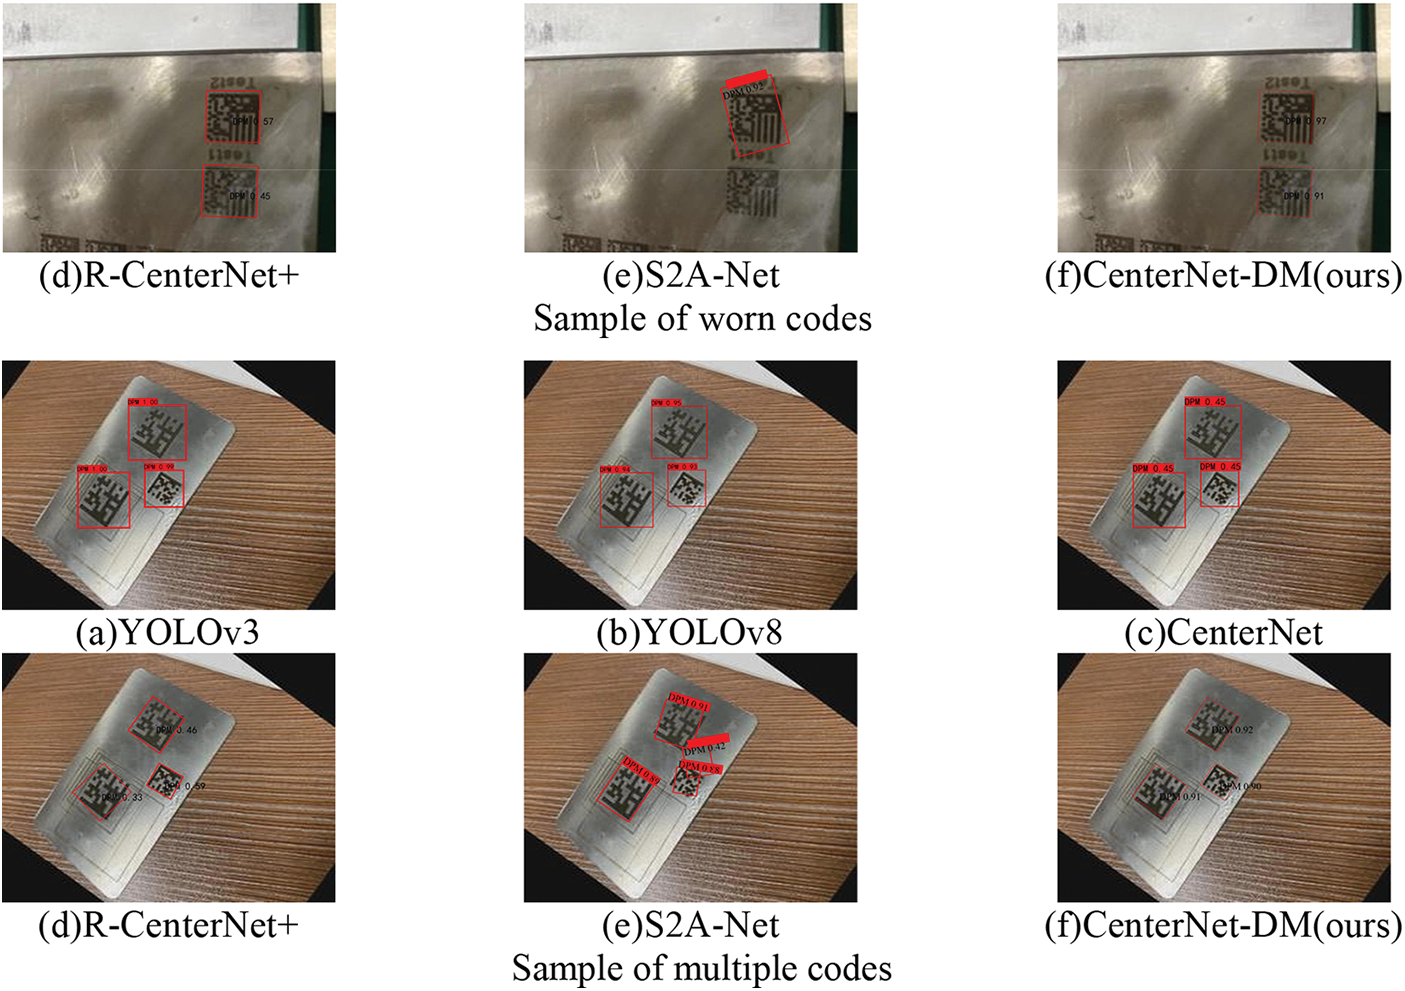
Figure 10: Comparison of detection results of six algorithms on perspective transformation codes, small codes, worn codes, and multiple codes
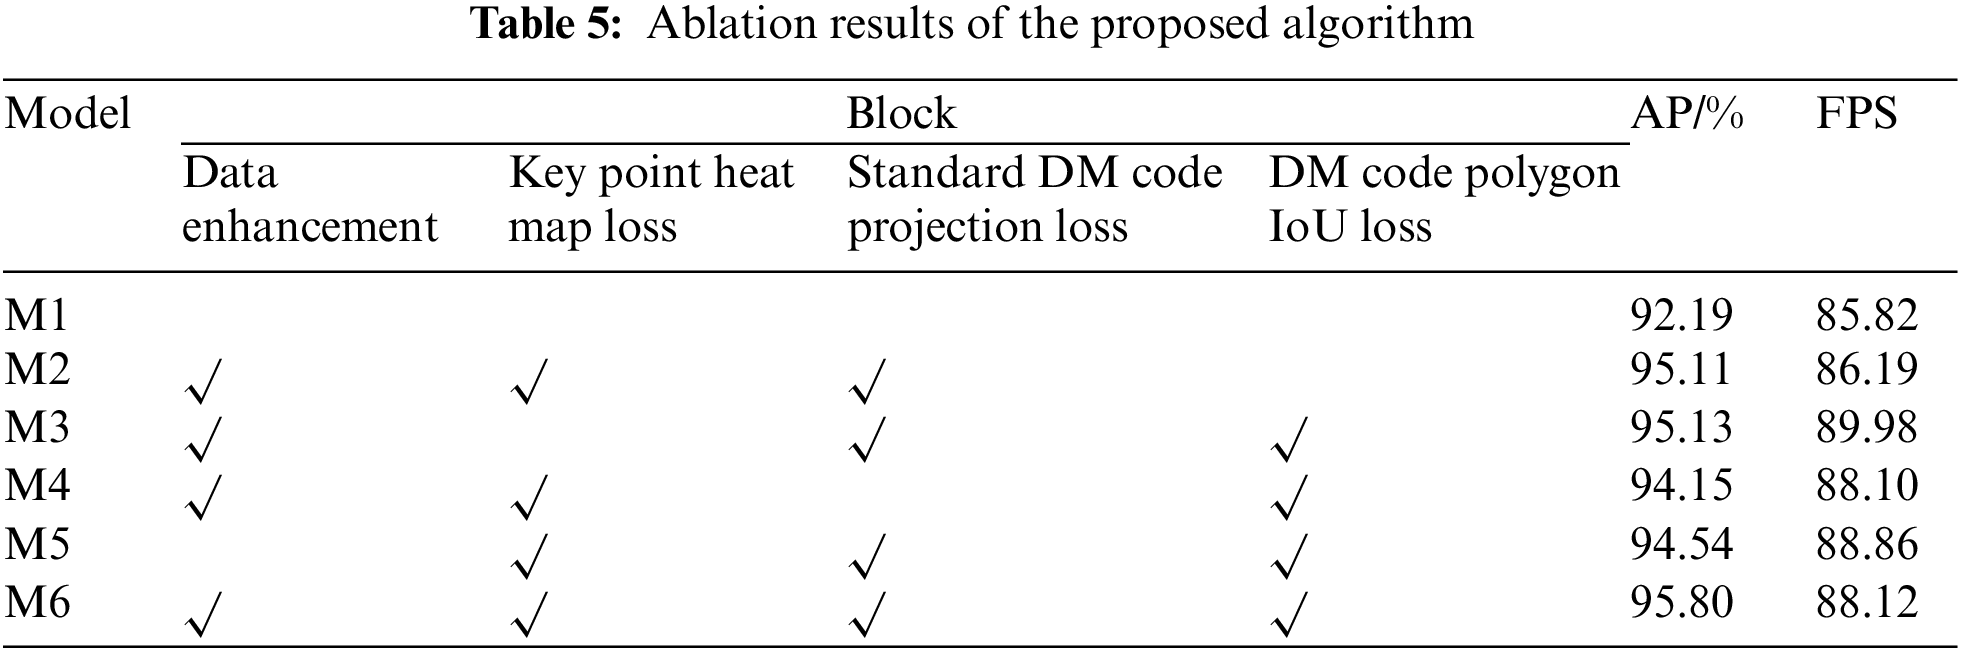
To further demonstrate the effectiveness of our proposed enhanced loss function and data-enhanced perspective transformation, we conducted ablation experiments on the test set of the DM code key point detection dataset, and the benchmark model M1 is a network without adding any modules designed in this paper by using the backbone feature network as ResNet-50, on which the modules we created are added one by one for validation, and the validation results are shown in Table 5. It is apparent from Table 5 that the three enhanced loss functions and data-enhanced perspective transformation we designed improved the AP by 0.67%, 1.65%, 0.69%, and 1.26%, respectively, on the test set. Among them, the standard DM code projection loss in the enhanced loss function takes full advantage of the geometric properties of DM code in space and therefore is most influential for network performance improvement.
5 Conclusion and Future Studies
Our proposed algorithm can directly obtain the four key points of the DM code compared to the current method, which is more accurate in fitting the DM code and facilitates the subsequent direct decoding, and improves the overall efficiency of the algorithm. In this paper, the contributions include: (1) According to the actual application requirements, a network capable of directly obtaining the four key points of DM code is designed with CenterNet as the base network, and three enhanced loss functions (DM code key point heat map loss, standard DM code projection loss, and DM code polygon IoU loss) are designed by making full use of the spatial geometric characteristics of DM code in the loss function, which is conducive to further improve the positioning accuracy of DM code. (2) The proposed dataset for DM code key point detection. From the experimental analysis, it can be revealed that the AP of the algorithm in this paper is 95.80%, and the processing frame rate is 88.12, which can achieve the real-time requirement while ensuring accuracy. However, there is still a limitation to the current method. Future work can be carried out in the following aspects:
a. Detection method. The fit of the positioning results to the DM code contour can be further improved by introducing an image segmentation prior. The fitting ability of network fine positioning can also be continued to be enhanced by adding constraints.
b. Dataset. The current dataset has relatively few data samples of small codes, worn codes, and complex backgrounds, and such data can be expanded subsequently to enhance the overall performance of the algorithm.
c. Reading system. Combined with the detection algorithm proposed in this paper, a complete reading system can be further developed for DM code reading in real scenarios. The system can include functions such as image preprocessing, DM code detection, DM code recognition, result output, etc.
Acknowledgement: The authors would like to thank Xi’an Soar Electromechanical Technology, Ltd. for providing DM codes which is used in our dataset.
Funding Statement: This research was funded by the Youth Project of National Natural Science Foundation of China (52002031), the General Project of Shaanxi Province Science and Technology Development Planned Project (2023-JC-YB-600), Postgraduate Education and Teaching Research University-Level Project of Central University Project (300103131033), the Transportation Research Project of Shaanxi Transport Department (23–108 K).
Author Contributions: Study conception and design: W. Wang and X. Y. Tang; data collection: C. F. Liu, K. Zhou and C. H. Zhao; analysis and interpretation of results: W. Wang, X. Y. Tang and K. Zhou; draft manuscript preparation: W. Wang, X. Y. Tang and K. Zhou. All authors reviewed the results and approved the final version of the manuscript.
Availability of Data and Materials: Not applicable.
Conflicts of Interest: The authors declare that they have no conflicts of interest to report regarding the present study.
References
1. L. Leong and W. Yue, “Extraction of 2D barcode using keypoint selection and line detection,” in Proc. of Advances in Multimedia Information Processing-PCM 2009, Berlin Heidelberg, Germany, Springer, pp. 826–835, 2009. [Google Scholar]
2. D. Hu, H. Tan and X. Chen, “The application of Radon transform in 2D barcode image recognition,” Wuhan University Journal: Natural Science Edition, vol. 51, no. 5, pp. 584–588, 2005. (In Chinese). [Google Scholar]
3. J. Ha, “A new method for detecting data matrix under similarity transform for machine vision applications,” International Journal of Control, Automation and Systems, vol. 9, no. 4, pp. 737–741, 2011. [Google Scholar]
4. W. Wang, W. He, L. Lei and Q. Lin, “Speedy location of 2D barcode region under complicated metal background,” Journal of Tianjin University (Natural Science and Engineering Technology), vol. 46, no. 6, pp. 531–538, 2013. (In Chinese). [Google Scholar]
5. D. Li, H. Guo, J. Tian and Y. Tian, “An improved detection method of locating L-edges in data matrix codes,” Journal of Shenzhen University (Science and Technology Edition), vol. 35, no. 2, pp. 151–157, 2018. (In Chinese). [Google Scholar]
6. S. Yang, W. He, Y. Wang and G. Guo, “Fast and accurate localization of micro data matrix code on metal parts,” Journal of Shanghai Jiaotong University, vol. 52, no. 7, pp. 816–824, 2018. (In Chinese). [Google Scholar]
7. L. R. Omar, S. Oleg, A. A. Vicente and C. G. H. Juan, “Binary large object-based approach for QR code detection in uncontrolled environments,” Journal of Electrical and Computer Engineering, vol. 2017, 4613628, pp. 1–15, 2017. [Google Scholar]
8. B. Li, M. Cao, S. L. Li, M. Yang, C. Lin et al., “Seal data matrix code verification method based on image processing,” Journal of Wuhan University (Engineering Edition), vol. 52, no. 11, pp. 1020–1027, 2019. (In Chinese). [Google Scholar]
9. K. Ladislav and E. Pivarčiová, “Comparative study of data matrix codes localization and recognition methods,” Journal of Imaging, vol. 7, no. 9, pp. 163, 2021. [Google Scholar]
10. S. Ren, K. He, R. Girshick and J. Sun, “Faster R-CNN: Towards real-time object detection with region proposal networks,” IEEE Transactions on Pattern Analysis & Machine Intelligence, vol. 39, no. 6, pp. 1137–1149, 2017. [Google Scholar]
11. J. Redmon and A. Farhadi, “YOLOv3: An incremental improvement,” arXiv.1804.02767, 2018. [Google Scholar]
12. W. Liu, D. Anguelov, D. Erhan, C. Szegedy, S. Reed et al., “SSD: Single shot multibox detector,” in Proc. of European Conf. on Computer Vision, Cham, Springer, pp. 21–37, 2016. [Google Scholar]
13. X. Zhou, D. Wang and P. Krähenbühl, “Objects as points,” arXiv.1904.07850, 2019. [Google Scholar]
14. K. He, G. Gkioxari, P. Dollár and R. Girshick, “Mask R-CNN,” in Proc. of 2017 IEEE Int. Conf. on Computer Vision (ICCV), Venice, Italy, pp. 2980–2988, 2017. [Google Scholar]
15. R. Cai, H. W. Chen, W. J. Ye, Y. J. Liu, Y. Y. Lv et al., “Positioning and detection technology of QR code based on deep learning,” Modern Computer (Professional Edition), vol. 33, pp. 41–44, 2018. [Google Scholar]
16. Q. Yang, J. Zang and S. Yang, “YOLOv3-ms algorithm developed for QR code positioning,” Journal of Heilongjiang University of Science and Technology, vol. 30, no. 6, pp. 692–697, 2020. (In Chinese). [Google Scholar]
17. B. Hu, J. Zhao, X. Zhang and J. Gao, “A SegNet-based DM code region extraction method,” Machinery Design & Manufacture, vol. 365, no. 7, pp. 62–65, 2021. [Google Scholar]
18. V. Badrinarayanan, A. Kendall and R. Cipolla, “SegNet: A deep convolutional encoder-decoder architecture for image segmentation,” IEEE Transactions on Pattern Analysis and Machine Intelligence, vol. 39, no. 12, pp. 2481–2495, 2017. [Google Scholar] [PubMed]
19. E. Guney, I. H. Sahin, S. Cakar, O. Atmaca, E. Erol et al., “Electrics shore-to-ship charging socket detection using image processing and YOLO,” in Int. Symp. on Multidisciplinary Studies and Innovative Technologies (ISMSIT), Ankara, Turkey, pp. 1069–1073, 2022. [Google Scholar]
20. W. Wan, C. Li, H. Zhu and Y. Tao, “Two-dimensional barcode positioning algorithm of lightweight CenterNet network,” Journal of Electronic Measurement and Instrument, vol. 36, no. 5, pp. 128–135, 2022. [Google Scholar]
21. T. Almeida, V. Santos, O. Mozos and B. Lourenco, “Comparative analysis of deep neural networks for the detection and decoding of Data Matrix landmarks in cluttered indoor environments,” Journal of Intelligent & Robotic Systems, vol. 103, no. 13, pp. 202312, 2021. [Google Scholar]
22. Y. Luo and J. Chen, “Two-Dimensional codes recognition algorithm based on Yolov5,” Academic Journal of Computing & Information Science, vol. 5, no. 7, pp. 68–72, 2022. [Google Scholar]
23. S. An, H. Lou, S. Chen and Y. Bai, “Research progress of rotating object detection methods based on deep learning,” Electronic Measurement Technology, vol. 44, no. 21, pp. 168–178, 2021. [Google Scholar]
24. J. Ma, W. Shao, H. Ye, L. Wang, H. Wang et al., “Arbitrary-oriented scene text detection via rotation proposals,” IEEE Transactions on Multimedia, vol. 20, no. 11, pp. 3111–3122, 2018. [Google Scholar]
25. J. Ding, N. Xue, Y. Long, G. S. Xia and Q. Lu, “Learning RoI transformer for oriented object detection in aerial images,” in Proc. of 2019 IEEE/CVF Conf. on Computer Vision and Pattern Recognition (CVPR), Long Beach, CA, USA, pp. 2844–2853, 2019. [Google Scholar]
26. X. Yang, J. Yang, J. Yan, Y. Zhang, T. Zhang et al., “SCRDet: Towards more robust detection for small, cluttered and rotated objects,” in Proc. of 2019 IEEE/CVF Int. Conf. on Computer Vision (ICCV), Seoul, Korea (Southpp. 8231–8240, 2019. [Google Scholar]
27. L. Zhou, H. Wei, H. Li, W. Zhao, Y. Zhang et al., “Object detection for remote sensing images based on polar coordinates,” arXiv:2001.02988, 2020. [Google Scholar]
28. X. Xie, G. Cheng, J. Wang, X. Yao and J. Han, “Oriented R-CNN for object detection,” in Proc. of 2021 IEEE/CVF Int. Conf. on Computer Vision (ICCV), Montreal, QC, Canada, pp. 3500–3509, 2021. [Google Scholar]
29. J. Han, J. Ding, J. LI and G. S. Xia, “Align deep features for oriented object detection,” IEEE Transactions on Geoscience and Remote Sensing, vol. 1, no. 99, pp. 1–11, 2021. [Google Scholar]
30. K. He, X. Zhang, S. Ren and J. Sun, “Deep residual learning for image recognition,” in Proc. of 2016 IEEE Conf. on Computer Vision and Pattern Recognition (CVPR), Las Vegas, NV, USA, pp. 770–778, 2016. [Google Scholar]
31. T. Y. Lin, P. Goyal, R. Girshick, K. He and P. Dollár, “Focal loss for dense object detection,” in IEEE Int. Conf. on Computer Vision (ICCV), Venice, Italy, pp. 2999–3007, 2017. [Google Scholar]
32. M. Everingham, L. Gool, C. Williams, J. Winn and A. Zisserman, “The PASCAL Visual Object Classes (VOC) challenge,” International Journal of Computer Vision, vol. 88, no. 2, pp. 303–338, 2010. [Google Scholar]
33. G. Jocher, “YOLOv8,” 2023. [Online]. Available: https://github.com/ultralytics/ultralytics [Google Scholar]
34. Y. H. Jiang, W. W. Li and L. Liu, “R-CenterNet+: Anchor-free detector for ship detection in SAR images,” Sensors, vol. 21, no. 17, pp. 5693, 2021. [Google Scholar] [PubMed]
Cite This Article
 Copyright © 2023 The Author(s). Published by Tech Science Press.
This work is licensed under a Creative Commons Attribution 4.0 International License , which permits unrestricted use, distribution, and reproduction in any medium, provided the original work is properly cited.
 Downloads
 Citation Tools