
 Submit a Paper
 Propose a Special lssue
 Open Access
ARTICLE

A Memory-Guided Anomaly Detection Model with Contrastive Learning for Multivariate Time Series
1 School of Electronic and Information Engineering, Hebei University of Technology, Tianjin, 300401, China
2 School of Artificial Intelligence, Hebei University of Technology, Tianjin, 300401, China
3 School of Computer Science and Engineering, University of Electronic Science and Technology of China, Chengdu, 611731, China
* Corresponding Author: Ping He. Email:
(This article belongs to the Special Issue: Development and Industrial Application of AI Technologies)
Computers, Materials & Continua 2023, 77(2), 1893-1910. https://doi.org/10.32604/cmc.2023.044253
Received 25 July 2023; Accepted 25 September 2023; Issue published 29 November 2023
 View Full Text
 Download PDF
Abstract
Some reconstruction-based anomaly detection models in multivariate time series have brought impressive performance advancements but suffer from weak generalization ability and a lack of anomaly identification. These limitations can result in the misjudgment of models, leading to a degradation in overall detection performance. This paper proposes a novel transformer-like anomaly detection model adopting a contrastive learning module and a memory block (CLME) to overcome the above limitations. The contrastive learning module tailored for time series data can learn the contextual relationships to generate temporal fine-grained representations. The memory block can record normal patterns of these representations through the utilization of attention-based addressing and reintegration mechanisms. These two modules together effectively alleviate the problem of generalization. Furthermore, this paper introduces a fusion anomaly detection strategy that comprehensively takes into account the residual and feature spaces. Such a strategy can enlarge the discrepancies between normal and abnormal data, which is more conducive to anomaly identification. The proposed CLME model not only efficiently enhances the generalization performance but also improves the ability of anomaly detection. To validate the efficacy of the proposed approach, extensive experiments are conducted on well-established benchmark datasets, including SWaT, PSM, WADI, and MSL. The results demonstrate outstanding performance, with F1 scores of 90.58%, 94.83%, 91.58%, and 91.75%, respectively. These findings affirm the superiority of the CLME model over existing state-of-the-art anomaly detection methodologies in terms of its ability to detect anomalies within complex datasets accurately.Keywords
Anomaly detection in multivariate time series has been extensively applied in industrial operation maintenance and early warning, medical and health monitoring, financial risk analysis, etc. [1]. Considering the difficulty of gathering labeled multivariate time series data and the uncertainty and diversity of anomalies, this task is typically handled using unsupervised learning techniques [2,3]. Concretely, unsupervised learning adopts normal data to learn the distribution rendering normality during the training phase. When testing, those samples that do not conform to the distribution are usually identified as anomalies. Therefore, timely and efficient anomaly detection requires the exploitation of algorithms to mine patterns and relationships in multivariate data to accurately make decisions about the behavior of normal and anomaly [4].
Profiting from the fruitful progress of neural networks, the performance of anomaly detection models based on deep learning techniques has experienced prominent enhancements [5,6]. Among them, reconstruction-based models usually follow the paradigm of encoder-decoder. The encoder learns a representation of the latent space by reducing the dimensionality of the input data while the decoder attempts to recover data from the representation. In the detection phase, the residuals obtained by subtracting the input and reconstructed data are regularly used to discriminate anomalies. Under this paradigm, some representative deep models, such as the autoencoder (AE) and recurrent neural network (RNN), are leveraged to construct the core components of the encoder and decoder. Normally, RNN is always used to deal with time series-related tasks. RNN-based models [7,8] often fail to model long-term dependencies and suffer from poor computational efficiency [9,10]. The model [2] constructed with AE has the advantage of low overhead, which makes up for the defect of low computational efficiency [11]. However, the model often lacks the utilization of temporal information and sufficient generalization ability in anomaly detection tasks [12]. Besides, another optional model is the recently prevalent transformer [13], which can deal with long-term dependencies by virtue of the attention mechanism. Researchers have also extended its application to anomaly detection [14,15].
Although the above models bring remarkable performance improvements, there are still two challenges. First, some reconstructed models [2,15–17] suffer from weak generalization ability due to overfitting. Compared with image-based tasks, the training data of time series anomaly detection models does not have some data augmentation techniques, such as random flipping [18]. Therefore, the patterns of normal data learned by the model are limited by the abnormal data patterns of unpredictability and uncertainty. This leads to the model being sensitive to overfitting and further exhibiting poor generalization ability, ultimately resulting in a decline in detection performance. Second, there is a lack of identification of anomalies. The generalization ability further induces the phenomenon that anomalies may also be well reconstructed [19]. In this case, some recent models, such as [2,14], that only use the reconstruction residual as a criterion to identify anomalies have the problem of misjudgment, which increases the difficulty of anomaly identification [20].
To handle the above challenges, we innovatively propose a transformer-like anomaly detection model using contrastive learning and memory (CLME). First, to cope with the problem of generalization ability, we adopt a contrastive learning module and a memory block. The module can learn the contextual relationships of the time series to generate enhanced representations. The block clusters and records the representation pattern of normal data, thus boosting generalization ability through attention-based addressing and retrieval mechanisms. Second, to tackle the problem of anomaly identification, we propose a fusion anomaly detection strategy that integrates residual and feature discrepancies. This strategy takes into account the data discrepancy in the feature space. It enlarges the gap between normal and abnormal to a certain extent, which will be beneficial to the identification of anomalies. Therefore, the model proposed in this paper can improve detection performance. Our main contributions are summarized as follows:
• We propose a novel anomaly detection framework (CLME) to deal with the poor generalization ability through time series contrastive learning and memory block.
• We propose a fusion anomaly detection strategy that fuses residual and feature space discrepancies to expand the gap between normal and abnormal data.
• Experiments on two publicly available datasets show that our model achieves detection performance superior to the state-of-the-art approaches.
The remaining sections are organized below. Section 2 expounds on the relevant literature on anomaly detection models from two aspects: deep learning and memory. Section 3 describes the methodology, including the model framework, training loss function, and calculation of the anomaly score. Section 4 explains the experimental results, which are displayed visually through tables and graphs. Section 5 gives a summary of the proposed model.
2.1 Anomaly Detection Based on Deep Models
Lately, most deep models have been flourishingly implemented in the area of anomaly detection. For instance, with its strong nonlinear representation ability, AE is usually employed as a fundamental component to build models. The reference [2] adopted the architecture of AE, consisting of one encoder and two decoders, and leveraged an adversarial learning technique to perform anomaly detection. Moreover, RNNs possess the ability to capture temporal features for handling time-series tasks [7]. Reference [8] introduced a one-class anomaly detection model that employed a dilated RNN with skip connections to extract multi-scale temporal information and incorporated a clustering mechanism to enhance its anomaly detection capabilities. Reference [17] developed a probabilistic autoencoder-based anomaly detection model with multi-scale convolutional operations. Besides, with excellent graph structure modeling ability, the reference [20] adopted two graph attention networks to optimize the reconstruction and prediction models to perform anomaly detection, but such a model is relatively complicated. Reference [16] adopted a hybrid model using graph structure learning and a variational autoencoder to perform anomaly detection for multivariate time series. Despite the impressive improvements in detection performance brought by these reconstruction-based models, their generalization ability for anomaly detection remains lacking or insufficient.
Notably, transformer [13] has garnered considerable attention owing to its remarkable advantages in dealing with long sequences and large-scale data. For anomaly detection, there have been some pioneering works that have explored its potential. The reference [14] presented a transformer-based anomaly detection model equipped with graph structure learning to perform anomaly detection. Reference [15] enhanced the detection performance through an adversarial transformer structure and the strategy of fusing anomaly probability. However, when performing anomaly detection, these transformer-based variants only use the residuals for anomaly discrimination. This leads to a certain degree of misjudgment.
2.2 Anomaly Detection with Memory Network
The memory network can memorize and infer input and stored information [21,22]. Recently, memory networks have found applications in anomaly detection. Researchers [23–25] proposed memory-based video anomaly detection models, which enhanced the abilities of remembering normal data and reasoning by introducing external storage technology. References [19,26] introduced self-supervised learning based on memory, improving the feature representation ability and detection performance. Reference [27] developed a hyperspectral image anomaly detection model that combined memory with the optimal transportation theory to improve detection performance.
Overall, memory networks have shown remarkable effectiveness in anomaly detection. By virtue of its superior memory capacity and advanced inference mechanism, it offers distinct advantages in processing long-term time-dependent tasks. Therefore, in this paper, we employ the power of memory to detect anomalies in multivariate time series.
The multivariate time series data is symbolized as
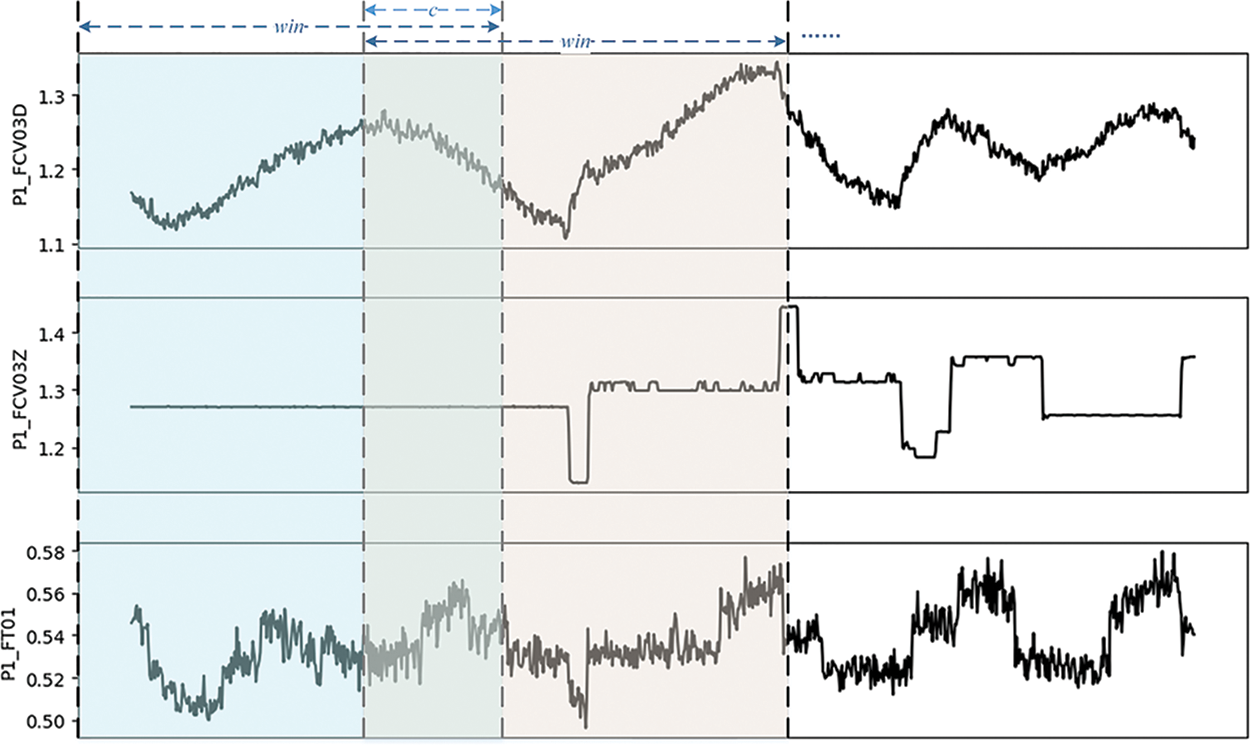
Figure 1: The example of sliding window
In response to the limitations inherent in existing reconstruction models concerning weak generalization ability and the deficiency in anomaly identification, we introduce a novel transformer-based architecture. This architecture adopts contrastive learning, a memory block, and a fusion anomaly detection strategy to alleviate the above problems jointly. The time series-based contrastive learning serves to generate fine-grained and robust representations in a self-supervised manner, while the memory effectively clusters the normal patterns of these representations by virtue of its attention-driven addressing and reintegration. This enhances the generalization ability of the model. Furthermore, the proposed fusion anomaly detection strategy widens the disparity between normal and abnormal samples, thereby mitigating the challenges associated with anomaly identification.
As depicted in Fig. 2, our proposed CLME is mainly composed of three core components: a contrastive learning module, a memory block, and a reconstruction network. The processed multivariate time series data is first fed into the contrastive learning module. This module is capable of learning contextual relationships in the temporal dimension to generate enhanced representations. Next, these representations and the memory block undergo a series of calculations to obtain integrated vectors. The memory block memorizes patterns of these representations in an attention-based clustering manner. Finally, these vectors are passed to the reconstruction network. Such a network synergistically integrates the outputs of the previous two modules to generate the final output. Additionally, the concator serves as a linear layer that performs concatenation of the relevant information. Further details about the first two components are thoroughly explained below.

Figure 2: A high-level framework of CLME
3.2.1 Contrastive Learning Module
Contrastive learning of time series can learn the intrinsic nature of data to obtain fine-grained representations for anomaly detection tasks [28,29]. In order to better generate temporal representations, we construct a contrastive learning module h employing a transformer-based encoder and a projector in Fig. 2.
To avoid the requirement of dot product self-attention, we adopt the attention free transformer (AFT) module according to [30]. The AFT first combines the key and value with a set of learned positional biases and then multiplies the query in an element-wise manner, as formulated in Eq. (1). This operation eliminates the need for computing and storing a large attention matrix while still preserving the global interaction between query and value, like the multi-head attention mechanism. In addition, we build the projector, namely a linear layer, after the encoder for two functions: (1) It facilitates highly flexible feature dimension matching within the memory block, allowing memory to be adaptable across various dimensions instead of being limited to specific ones; (2) The output of the module is utilized for contrastive learning, which promotes the embedding ability of the model [31].
where Q, K and V indicate the outputs after the linear transformation. a is the learned positional bias. T denotes the length of the input series.
The input data x and its variant
where h denotes the contrastive learning module.
For contrastive learning, these outputs, namely representations, should be consistent over the same time step according to [29]. Therefore, we declare that two representations occurring at the same time step are considered positive samples, whereas those occurring at different time steps are considered negative samples. By implementing contrastive learning over time series, such a module can learn more robust and fine-grained representations.
Memory is a typical technique for recording data patterns that clusters latent representations through an attention-based mechanism [21,32]. In this paper, we define memory
To be specific, the representation f obtained by the contrastive learning module will be calculated the similarity with each item in
Indeed, due to the complex interaction of normal patterns, the model may result in high-quality reconstruction of abnormal samples during training. This situation is not desirable, as the objective of this paper is to accentuate the distinction between normal and abnormal samples. To prevent this behavior, the normal patterns in memory should be sparse. Therefore, we adopt the sparsity mechanism following [21], as shown in Eq. (5). Such a mechanism forces the memory to reintegrate the output using fewer but more informative items.
where
Finally, we renormalize
In conclusion, for the representation, the memory block calculates the similarity with each item and reintegrates it into a new representation according to the similarity. Since the training dataset consists of normal samples, the above attention-based addressing and reintegration mechanisms of latent representations enable the memory block to grasp normal patterns of data dynamically. During testing, the representations of abnormal samples can only be reintegrated using memory items based on normal patterns rather than feature extraction from the original anomalies. Such a particular operation obstructs the propagation of anomalies. The ultimate reconstruction output generated by the model diverges significantly from that of the anomalous samples and converges towards the normal samples. This essentially increases the separability between normal and abnormal data.
In the training phase, the model reconstructs samples to increase the discriminative ability of normal and abnormal data using the contrastive learning technique and a memory block. Therefore, we employ the reconstruction loss, contrastive loss, and triplet loss to jointly optimize the model, as shown in Eq. (7).
where
Under the reconstruction paradigm, the model dynamically learns typical patterns in memory. Therefore, one of the learning objectives is to minimize the reconstruction residual by adopting the mean squared error, as shown in Eq. (8).
To extract fine-grained and robust feature representations of input sequences, we use a temporal contrastive learning loss following [29]. Two different views of the same timestamp t are positive sample pairs; otherwise, they are negative sample pairs, as shown in Eq. (9).
where
To increase the diversity of items in memory while preventing their similarity, we adopt a triplet loss to constrain the learning of the memory referring to [33], as shown in Eq. (10).
where
Typically, reconstruction residual is a primary anomaly criterion in some existing models [2,14]. Taking into account the generalization ability of the neural networks, the anomaly may be reconstructed effectively. Consequently, the anomaly reconstruction residuals are small, which presents a challenge in identifying them and hampers the overall detection performance of the model. To address this issue, we propose a fusion anomaly detection strategy that integrates feature discrepancy and reconstruction residual.
Specifically, harnessing the ability of memory to capture normal patterns, we calculate the feature discrepancy before and after the memory in feature space. Such a discrepancy is linked to the residual by defining an adjustment factor, as shown in Eq. (11). Based on the residual, the discrepancy can amplify the distinction between normal and abnormal data. This detection strategy considers both the data space and the feature space, which effectively alleviates the difficulties associated with anomaly identification and significantly improves the detection capability of the model.
where
In experiments, we adopt two publicly available datasets, including secure water treatment (SWaT) [20], pooled server metrics (PSM) [15], mars science laboratory (MSL) [14], and water distribution (WADI) [14]. SWaT and WADI are typical operational water treatment testbeds primarily utilized for research in anomaly detection. PSM is server data collected from the IT system to detect anomalies in multiple application server nodes. MSL contains a variety of mars observation data collected by NASA. Table 1 gives the description in detail. In order to display the data more intuitively and clearly, we portray parts of the SWaT to present the multivariate time series in Fig. 3.
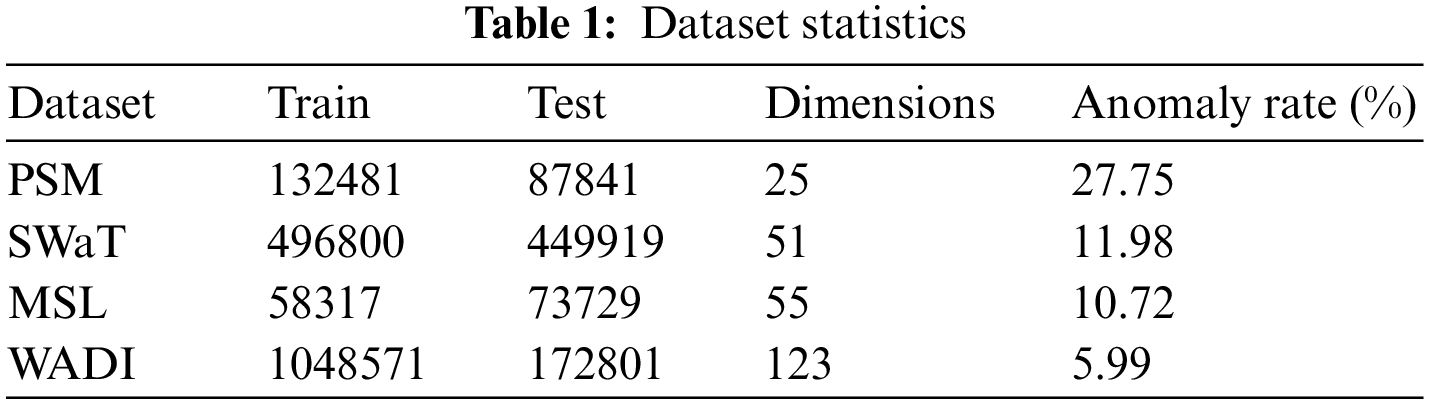
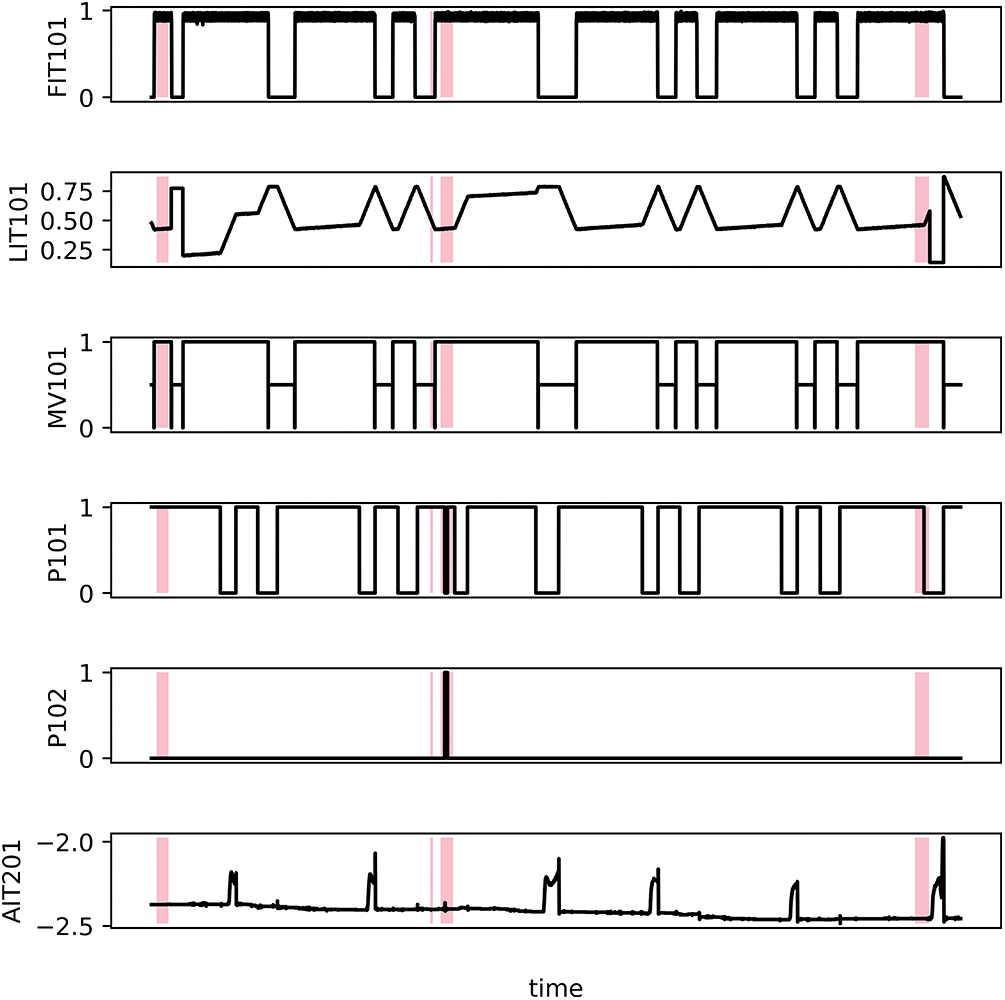
Figure 3: Visualization of SWaT dataset. The pink highlights represent anomalous segments
As performance metrics for the proposed model, we employ precision (
The preprocessing operations of input data include normalization and sliding window (
4.4 Comparison with State-of-the-Art Methods
We conduct a comprehensive comparison between the proposed CLME and the existing state-of-the-art (SOTA) approaches, including LSTM-VAE [7], USAD [2], MTAD-GAT [20], THOC [8], GReLeN [16], GTA [14], PAMFE [17], and Adformer [15].
Table 2 illustrates the comparison of the models in terms of P, R, and

4.5 Anomaly Detection Visualization
In order to intuitively visualize the detection performance of the proposed model, we perform anomaly detection visualization on the SWaT dataset. According to the test set of SWaT, we roughly divide the anomalies into three types: significant anomaly (relatively obvious and easy to detect), moderate anomaly (different from normal data but not significant), and tiny anomaly (concealment and nearly no difference between anomaly and normal). The detection visualizations of these three types of anomalies correspond to Figs. 4–6. In each figure, two subfigures are displayed as a group. The first subfigure represents test and reconstructed values, while the second subfigure denotes anomaly scores. The highlighted area denotes the abnormal segment. In Fig. 4, there are significant differences between abnormal and normal. Our model basically detects the anomaly interval accurately. In Fig. 5, there are some differences between abnormal and normal data. Our model can detect each anomalous segment efficiently. For the tiny anomalies in Fig. 6, the model also exhibits accurate identification even when there is little discrepancy between normal and abnormal samples. The ability to accurately differentiate between subtle differences greatly contributes to the overall effectiveness and robustness of our model.

Figure 4: Visualization of anomaly detection for significant anomaly

Figure 5: Visualization of anomaly detection for moderate anomaly

Figure 6: Visualization of anomaly detection for tiny anomaly
In this paper, contrastive learning of time series promotes memory to learn fine-grained normal patterns, which can ultimately achieve normal sample reconstruction. Indeed, the process of reconstructing anomalies using normal patterns retrieved from memory can lead to notable reconstruction residuals. This is because anomalies inherently deviate significantly from the learned normal patterns. Furthermore, the feature difference calculated using memory further amplifies the distinctions between normal and abnormal instances, resulting in increased separability between the two classes. Through the above analysis, our model demonstrates excellent detection performance.
We validate the effectiveness of the model with respect to each component, including memory, loss constraints, and the fusion anomaly detection strategy. Specifically, we investigate the impact on model performance by removing each component individually. Firstly, we assess the importance of memory by observing the change in model performance after its removal. Secondly, to discuss the impact of loss constraints on performance, we exclude the contrastive loss and triplet loss separately. Finally, we only adopt the reconstruction residual to evaluate the effect of the detection strategy. The comparison results of P, R, F1, and Acc are presented in Table 3.

From Table 3, we can make the following observations. Firstly, these variants, with the specific components discarded, are dramatically inferior to the proposed model. It clearly indicates that each part is integral to the model and beneficial for performance. Notably, F1 and Acc drop prominently after removing the memory block. This underscores the vital and indispensable role of memory in effective anomaly detection. Secondly, the loss constraints also contribute to the overall performance improvement, as indicated by the comparative results. Lastly, it is essential to highlight that detection performance experiences a decline when only relying on residuals as an abnormal criterion. The decline serves as further confirmation of the effectiveness of the proposed fusion anomaly detection strategy. These findings collectively reinforce the significance of the above core components in enhancing the model’s anomaly detection capabilities.
We perform a parameter analysis for the main hyperparameters on SWaT, including the length of window (
(1) The

Figure 7: Display of performance changes under different windows and steps
(2) The M and D of memory. In memory, a larger size offers a greater capacity, which enhances the ability to store and retrieve extensive knowledge. However, it also leads to increased computational and storage costs and potentially requires more training data. Besides, higher dimensions enable the model to capture richer representation capabilities, facilitating the understanding of relationships and semantic information within memory. Nevertheless, higher dimensionality comes with a trade-off of increased parameter counts and computational complexity. Hence, it is crucial to carefully consider the requirements and feasibility of the model when determining the size and dimension of the memory. In this paper, we ascertain the optimal memory size and dimension through experimentation and tuning, as illustrated in Fig. 8. The model achieves the highest score when

Figure 8: Display of performance changes under different memory sizes and dimensions
(3) The

Figure 9: Display of performance changes under
This paper proposes a novel transformer-based anomaly detection model with contrast learning and a memory block for multivariate time series. The contrast learning module enables the model to acquire temporal views while the memory clusters the normal patterns of the data. This enhances the generalization ability of the model to some extent. Moreover, the fusion anomaly detection strategy proposed in this paper increases the gap between normal and anomaly, making anomalies easier to detect. The proposed model has excellent anomaly detection abilities, especially for some tiny anomalies. Experiments on two publicly available datasets confirm that the model outperforms existing SOTA methods. In the future, we will explore more possibilities to improve the performance of anomaly detection further.
Acknowledgement: The authors thank the editor and anonymous reviewers for their helpful comments and valuable suggestions.
Funding Statement: The authors would appreciate support from the Major National Science and Technology Special Projects (2016ZX02301003-004-007) and the Natural Science Foundation of Hebei Province (F2020202067).
Author Contributions: Study conception and design: W. Zhang, P. He; data collection: T. Li, Y. Liu; analysis and interpretation of results: W. Zhang, P. He, F. Yang; draft manuscript preparation: W. Zhang, P. He, T. Li. All authors reviewed the results and approved the final version of the manuscript.
Availability of Data and Materials: All datasets used in this study are available upon request from the corresponding author.
Conflicts of Interest: The authors declare that they have no conflicts of interest to report regarding the present study.
References
1. A. Blázquez-García, A. Conde, U. Mori and J. A. Lozano, “A review on outlier/anomaly detection in time series data,” ACM Computing Surveys, vol. 54, no. 3, pp. 1–33, 2021. [Google Scholar]
2. J. Audibert, P. Michiardi, F. Guyard, S. Marti and M. A. Zuluaga, “USAD: Unsupervised anomaly detection on multivariate time series,” in Proc. of KDD, San Diego, CA, USA, pp. 3395–3404, 2020. [Google Scholar]
3. H. Xu, W. Chen, N. Zhao, Z. Y. Li, J. H. Bu et al., “Unsupervised anomaly detection via variational auto-encoder for seasonal kpis in web applications,” in Proc. of WWW, Lyon, France, pp. 187–196, 2018. [Google Scholar]
4. S. Han and S. S. Woo, “Learning sparse latent graph representations for anomaly detection in multivariate time series,” in Proc. of KDD, Washington DC, USA, pp. 2977–2986, 2022. [Google Scholar]
5. H. Zhou, K. Yu, X. Zhang, G. Wu and A. Yazidi, “Contrastive autoencoder for anomaly detection in multivariate time series,” Information Sciences, vol. 610, pp. 266–280, 2022. [Google Scholar]
6. J. Moon, Y. Noh, S. Jung, J. Lee and E. Hwang, “Anomaly detection using a model-agnostic meta-learning-based variational auto-encoder for facility management,” Journal of Building Engineering, vol. 68, no. 106099, pp. 1–13, 2023. [Google Scholar]
7. D. Park, Y. Hoshi and C. C. Kemp, “A multimodal anomaly detector for robot-assisted feeding using an lstm-based variational autoencoder,” IEEE Robotics and Automation Letters, vol. 3, no. 3, pp. 1544–1551, 2018. [Google Scholar]
8. L. Shen, Z. Li and J. Kwok, “Timeseries anomaly detection using temporal hierarchical one-class network,” in Proc. of NIPS, Vancouver, Canada, pp. 13016–13026, 2020. [Google Scholar]
9. S. Qin, J. Zhu, D. Wang, L. Ou, H. Gui et al., “Decomposed transformer with frequency attention for multivariate time series anomaly detection,” in Proc. of Big Data, Osaka, Japan, pp. 1090–1098, 2022. [Google Scholar]
10. H. Wu, T. Hu, Y. Liu, H. Zhou, J. Wang et al., “TimesNet: Temporal 2D-variation modeling for general time series analysis,” in Proc. of ICLR, Kigali, Rwanda, pp. 1–23, 2023. [Google Scholar]
11. S. Tuli, G. Casale and N. R. Jennings, “TranAD: Deep transformer networks for anomaly detection in multivariate time series data,” in Proc. of VLDB, Sydney, Australia, pp. 1201–1214, 2022. [Google Scholar]
12. B. Wu, Z. Y. Yao, Y. H. Tu and Y. X. Chen, “A dilated transformer network for time series anomaly detection,” in Proc. of ICTAI, Macao, China, pp. 48–52, 2022. [Google Scholar]
13. A. Vaswani, N. Shazeer, N. Parmar, J. Uszkoreit, L. Jones et al., “Attention is all you need,” in Proc. of NIPS, Long Beach, CA, USA, pp. 1–19, 2017. [Google Scholar]
14. Z. Chen, D. Chen, X. Zhang, Z. Yuan and X. Cheng, “Learning graph structures with transformer for multivariate time series anomaly detection in IoT,” IEEE Internet of Things Journal, vol. 9, no. 12, pp. 9179–9189, 2022. [Google Scholar]
15. F. Zeng, M. Chen, C. Qian, Y. Wang, Y. Zhou et al., “Multivariate time series anomaly detection with adversarial transformer architecture in the Internet of Things,” Future Generation Computer Systems, vol. 144, pp. 244–255, 2023. [Google Scholar]
16. W. Zhang, C. Zhang and F. Tsung, “GReLeN: Multivariate time series anomaly detection from the perspective of graph relational learning,” in Proc. of IJCAI, Vienna, Australia, pp. 2390–2397, 2022. [Google Scholar]
17. G. Zhang, X. Gao, L. Wang, B. Xue, S. Y. Fu et al., “Probabilistic autoencoder with multi-scale feature extraction for multivariate time series anomaly detection,” Applied Intelligence, vol. 53, no. 12, pp. 15855–15872, 2023. [Google Scholar]
18. S. Qin, Y. Luo and G. Tao, “Memory-augmented U-Transformer for multivariate time series anomaly detection,” in Proc. of ICASSP, Rhodes Island, Greece, pp. 1–5, 2023. [Google Scholar]
19. Y. Zhang, J. Wang, Y. Chen, H. Yu and T. Qin, “Adaptive memory networks with self-supervised learning for unsupervised anomaly detection,” IEEE Transactions on Knowledge and Data Engineering, pp. 1–13, 2022. https://doi.org/10.1109/TKDE.2021.3139916 [Google Scholar] [CrossRef]
20. H. Zhao, Y. Wang, J. Duan, C. R. Huang, D. F. Cao et al., “Multivariate time-series anomaly detection via graph attention network,” in Proc. of ICDM, Sorrento, Italy, pp. 841–850, 2020. [Google Scholar]
21. D. Gong, L. Liu, V. Le, B. Saha, M. R. Mansour et al., “Memorizing normality to detect anomaly: Memory-augmented deep autoencoder for unsupervised anomaly detection,” in Proc. of ICCV, Seoul, South Korea, pp. 1705–1714, 2019. [Google Scholar]
22. T. Zhao, L. Jin, X. Zhou, S. Li, S. Liu et al., “Unsupervised anomaly detection approach based on adversarial memory autoencoders for multivariate time series,” Computers, Materials & Continua, vol. 76, no. 1, pp. 330–345, 2023. [Google Scholar]
23. H. Gao, B. Qiu, R. J. D. Barroso, W. Hussain, Y. Xu et al., “Tsmae: A novel anomaly detection approach for internet of things time series data using memory-augmented autoencoder,” IEEE Transactions on Network Science and Engineering, vol. 10, no. 5, pp. 1–14, 2022. [Google Scholar]
24. L. Wang, J. Tian, S. Zhou, H. Shi and G. Hua, “Memory-augmented appearance-motion network for video anomaly detection,” Pattern Recognition, vol. 138, no. 109335, pp. 1–13, 2023. [Google Scholar]
25. R. Cai, H. Zhang, W. Liu, S. Gao and Z. Hao, “Appearance-motion memory consistency network for video anomaly detection,” in Proc. of AAAI, Vancouver, Canada, pp. 938–946, 2021. [Google Scholar]
26. N. Huyan, D. Quan, X. Zhang, X. Liang, J. Chanussot et al., “Unsupervised outlier detection using memory and contrastive learning,” IEEE Transactions on Image Processing, vol. 31, pp. 6440–6454, 2022. [Google Scholar] [PubMed]
27. N. Huyan, X. Zhang, D. Quan, J. Chanussot and L. Jiao, “Cluster-memory augmented deep autoencoder via optimal transportation for hyperspectral anomaly detection,” IEEE Transactions on Geoscience and Remote Sensing, vol. 60, pp. 1–16, 2022. [Google Scholar]
28. E. Eldele, M. Ragab, Z. Chen, M. Wu, C. Keong et al., “Time-series representation learning via temporal and contextual contrasting,” in Proc. of IJCAI, Montreal, Canada, pp. 2452–2359, 2021. [Google Scholar]
29. Z. Yue, Y. Wang, J. Duan, T. M. Yang, C. R. Huang et al., “TS2Vec: Towards universal representation of time series,” in Proc. of AAAI, Vancouver, Canada, pp. 8980–8987, 2022. [Google Scholar]
30. S. Zhai, W. Talbott, N. Srivastava, C. Huang, H. Goh et al., “An attention free transformer,” arXiv preprint arXiv:2105.14103, 2021. https://doi.org/10.48550/arXiv.2105.14103 [Google Scholar] [CrossRef]
31. T. Chen, S. Kornblith, M. Norouzi and G. Hinton, “A simple framework for contrastive learning of visual representations,” in Proc. of ICML, Vienna, Australia, pp. 1597–1607, 2020. [Google Scholar]
32. D. Wang, Q. Hu and K. Wu, “Dual-branch network with memory for video anomaly detection,” Multimedia Systems, vol. 29, no. 1, pp. 247–259, 2023. [Google Scholar]
33. H. Park, J. Noh and B. Ham, “Learning memory-guided normality for anomaly detection,” in Proc. of CVPR, Seattle, WA, USA, pp. 14372–14381, 2020. [Google Scholar]
34. D. P. Kingma and J. Ba, “ADAM: A method for stochastic optimization,” in Proc. of ICLR, San Diego, CA, USA, pp. 1–15, 2015. [Google Scholar]
Cite This Article
 Copyright © 2023 The Author(s). Published by Tech Science Press.
This work is licensed under a Creative Commons Attribution 4.0 International License , which permits unrestricted use, distribution, and reproduction in any medium, provided the original work is properly cited.
 Downloads
 Citation Tools