
 Submit a Paper
 Propose a Special lssue
 Open Access
ARTICLE

Modeling a Novel Hyper-Parameter Tuned Deep Learning Enabled Malaria Parasite Detection and Classification
1 Department of Computer Science & Engineering, Koneru Lakshmaiah Education Foundation, Vaddeswaram, Andhra Pradesh, India
2 Department of Artificial Intelligence and Data Science, KPR Institute of Engineering and Technology, Coimbatore, Tamil Nadu, 641407, India
* Corresponding Authors: Dinesh Kumar Anguraj. Email: ; S. V. Sudha. Email:
Computers, Materials & Continua 2023, 77(3), 3289-3304. https://doi.org/10.32604/cmc.2023.039515
Received 02 February 2023; Accepted 18 July 2023; Issue published 26 December 2023
 View Full Text
 Download PDF
Abstract
A theoretical methodology is suggested for finding the malaria parasites’ presence with the help of an intelligent hyper-parameter tuned Deep Learning (DL) based malaria parasite detection and classification (HPTDL-MPDC) in the smear images of human peripheral blood. Some existing approaches fail to predict the malaria parasitic features and reduce the prediction accuracy. The trained model initiated in the proposed system for classifying peripheral blood smear images into the non-parasite or parasite classes using the available online dataset. The Adagrad optimizer is stacked with the suggested pre-trained Deep Neural Network (DNN) with the help of the contrastive divergence method to pre-train. The features are extracted from the images in the proposed system to train the DNN for initializing the visible variables. The smear images show the concatenated feature to be utilized as the feature vector in the proposed system. Lastly, hyper-parameters are used to fine-tune DNN to calculate the class labels’ probability. The suggested system outperforms more modern methodologies with an accuracy of 91%, precision of 89%, recall of 93% and F1-score of 91%. The HPTDL-MPDC has the primary application in detecting the parasite of malaria in the smear images of human peripheral blood.Keywords
Plasmodium parasites are responsible for instigating the devastating global scourge known as malaria. These insidious parasites have caused the demise of over two million individuals and inflicted infection upon a staggering 300 to 500 million people, as reported by the esteemed World Health Organization (WHO) [1]. Detecting malaria infections promptly is paramount, as it allows healthcare specialists to recommend appropriate treatments. The conventional method for diagnosing malaria involves scrutinizing peripheral blood smears through microscopy, which remains the most prevalent and revered diagnostic technique, often considered the gold standard in malaria diagnosis [2].
Malaria parasites wreak havoc upon the red blood cells (RBCs) within the human circulatory system. Skilled pathologists examine these RBCs under a light microscope, meticulously assessing their shape, size, and color variations to discern the telltale signs of malaria infection. However, this manual process, reliant on the expertise of pathologists, is fraught with complexity and prone to errors attributable to subjectivity, resulting in inconsistent and erroneous diagnoses. These diagnostic inaccuracies can have dire consequences, including the loss of patients’ lives. Recent research has shown a decline in concurrence rates among pathologists in identifying this epidemic disease. The primary objective of this research endeavor is to develop computerized detection frameworks for malaria, which seek to replicate the traditional gold standard of malaria diagnosis when analyzing smear images of blood. This automated diagnostic system proves immensely beneficial to malaria specialists, significantly enhancing the efficiency of pathologists and reducing the reliance on these experts in remote rural areas [3]. Within the realm of microscopy-based malaria diagnosis, a renowned stain by the name of Giemsa is expertly applied to peripheral blood smear images with the precise aim of visually discerning the presence of malaria parasites. This intricate staining procedure imparts a resplendent purple tint to the unblemished red blood cells, while platelets, parasites, white blood cells (WBCs), and incidental artifacts are cast into a profound shade of purple. It thus becomes an imperious necessity to methodically categorize the constituents of these amethyst-hued blood cells into two discrete classifications, employing visual cues as our guideposts. These classifications encompass non-parasitic blood cell elements, such as artifacts, WBCs, and platelets, in tandem with the components of blood cells afflicted by the parasitic invaders [4]. Consequently, this scholarly inquiry introduces an avant-garde malaria detection system, one that artfully wields the formidable capabilities of deep learning (DL) within the confines of a computer-aided framework.
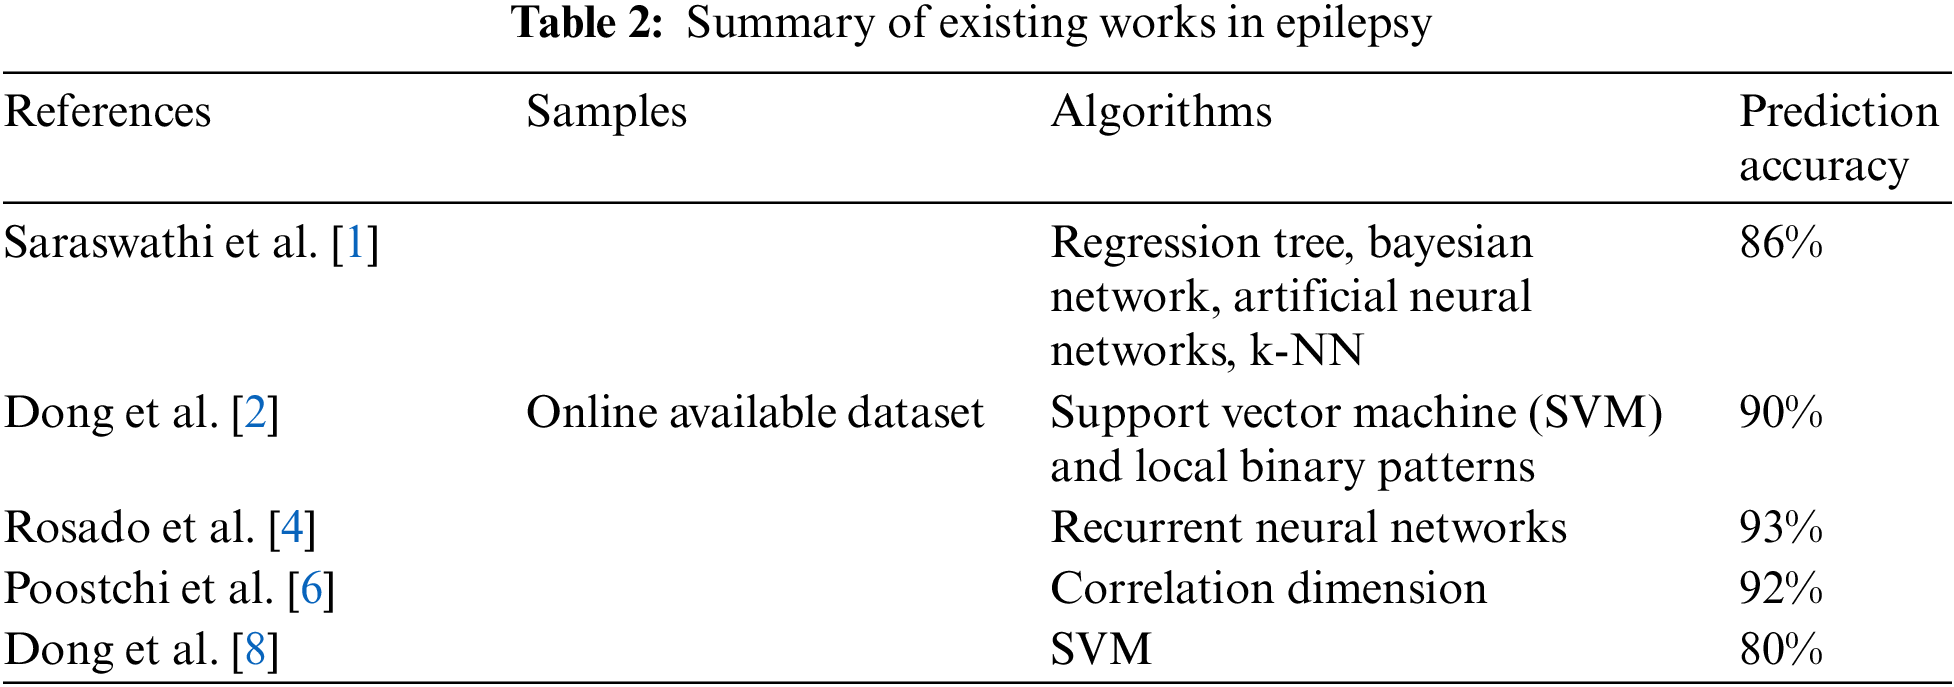
The realm of computer vision assumes a pivotal role in the automated identification of malaria parasites from smear images of peripheral blood, a proposition advanced within the confines of this study. The methodology for detecting stained objects draws inspiration from the scholarly contributions of Quinn et al. [5], who advocate an approach rooted in color histograms. Subsequently, an innovative method grounded in binary classification, hinging on the principles of k-nearest neighbor (k-NN), is proffered [6]. Furthermore, Rajaraman et al. [7] have devised a statistical technique to identify the malaria parasite.
A system to identify the malaria parasite is suggested depending on the feature set based on the histogram, and various statistical classifiers like SVM, Artificial Neural Network (ANN), naïvebayes, and k-nearest neighbors (k-NN) are utilized by Dong et al. [8], where ANN obtains the greatest accuracy of detection. The classification models based on DBN are utilized for hand-written recognition, information retrieval, 3-D object recognition [9], machine transliteration and motion capture model. The probabilistic generative models, also called DBNs, have different hidden variable layers using the merging of trained Restricted Boltzmann Machine (RBM). DBNs are trained using the discriminative tune-up procedure in the greedy unsupervised technique to improve the classification tasks’ performance. The deep belief networks obtain higher modeling capability than general networks, which are not deep. The discriminative or generative models are the trained factor by these networks. The backpropagation is used for the discriminative training of DBNs. DBNs introduce the multilayer feed-forward Neural Networks (FFNN) using the achieved features in every layer to lower the data overfitting. The feature is needed in the supervised classification with the less training samples. A granulometry technique and a mathematical morphology are suggested for identifying the parasite infections, which Ren et al. designed [10]. By classifying the malaria parasite from a blood sample’s microscopic images, Sampathila et al. revealed a computational method for diagnosing malaria [11]. Residual Attention Network (RAN) technology was used by Qanbar et al. [12] to aid in examining and classifying blood samples as infected or non-infected. One of the earliest deep learning algorithms was used by Fuhad et al. [13] to create a completely automated system to identify malaria parasites and their stages from blood smears. To find the infected RBC parasites, VGG16 was used by Masud et al. [14]. Alok et al. unveiled a new deep-learning method for diagnosing malaria [15]. Irmak [16] suggested using a special convolutional neural network (CNN) architecture to recognize malaria from thin blood cell images. Li et al. proposed malaria detection using a Residual Attention learning network with the help of SVM [17], which presents more contemporary methods for malaria detection. Oyewola et al. in [18] described a recently suggested deep-learning model called a convolutional data augmentation neural network (DACNN). The existing studies should have mentioned the merits of deep-learning architecture. The major research gap is that the researchers must address the over-fitting and under-fitting issues while adopting a classifier model. Also, the existing approaches encounter computational complexity. Therefore, these gap needs to be addressed in this work. The basic aim is to establish the correct and powerful machine learning model with the help of Deep Boltzmann Machine (DBM) for separating the objects of stained blood cell-like non-parasites and parasites in the proposed system to consider as the major critical phase in the automatic diagnosis system of malaria. This research gives a more effective and easy technique than previous research in the malaria parasites classification. The major research contributions are:
1) To propose an intelligent hyper-parameter tuned deep-learning enabled malaria parasite detection and classification (HPTDL-MPDC) technique on blood smear images.
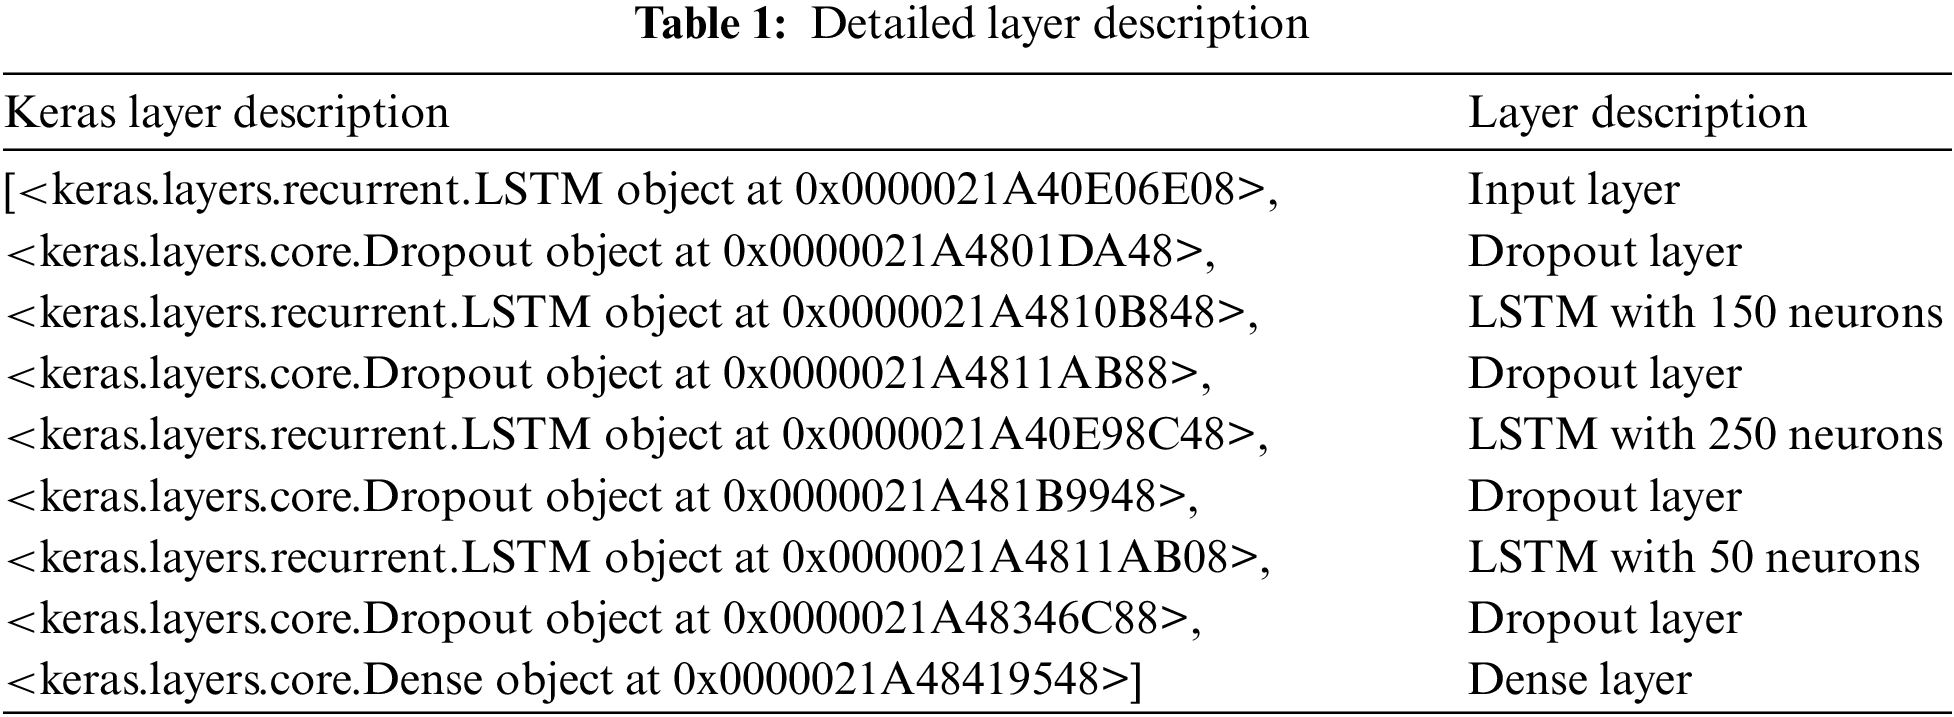
2) The proposed HPTDL-MPDC technique incorporates data pre-processing, Visual Geometry Group (VGG)19-based feature extraction, deep neural network (DNN) with Long short-term memory (LSTM) + CNN for classification, and Adagrad optimization (ADO) based hyperparameter tuning.
3) The global and local features are analyzed based on the texture and color features. Then, a pre-trained network model with VGG19 is adopted to reduce the feature dimensionality, and the vector size is evaluated with the parameter to enhance the classification. The proposed model enhances the classification by 91%, which is substantially higher than other approaches.
4) As a complete framework, the proposed model intends to predict and classify using the proposed model, which works well in feature extraction, classification and prediction. The proposed model gives better prediction accuracy and establishes a better trade-off than other approaches.
The below remainder is organized for this research. The preliminaries are described in Section 2 to describe the major novel elements of this proposed model. The experiments and the results are evaluated in Section 3. Section 4 describes the conclusion and the future goal.
This section explains Deep Neural Networks (DNN) model. The methodology elaborates the DNN training with the Adagrad optimizer model and the DNN adoption for optimizing and classifying samples via the discriminative fine-tuning phase using hyper-parameters.
In the proposed system, the utilized dataset comprises images derived from meticulously obtained thin blood smears stained with Giemsa, originating from the malaria screening research conducted by experts. This dataset consists of 150 instances of P. falciparum-infected patients and 50 instances of healthy patients, all graciously provided by the National Institute of Health (NIH) [19]. The images within this dataset have been meticulously annotated through manual efforts, involving the collaboration of the National Library of Medicine (NLM) and proficient slide readers associated with the Mahidol Oxford Tropical Medicine Research Unit in Bangkok, Thailand. This comprehensive dataset comprises a total of 27,558 images, evenly representing both unaffected and affected red blood cells (RBCs). Notably, Fig. 1 portrays illustrative samples of the images featuring RBCs afflicted with plasmodium, while Fig. 1 showcases samples of uninfected blood cell images devoid of plasmodium presence. To standardize the data for classifier input, diverse sizes of colored patches on red blood cells, ranging from 110 to 150 pixels, are rescaled to a uniform 120 × 120 dimension during the preprocessing phase. Furthermore, rigorous measures are implemented to mitigate noise within the dataset and scrutinize any artifacts that may be present.
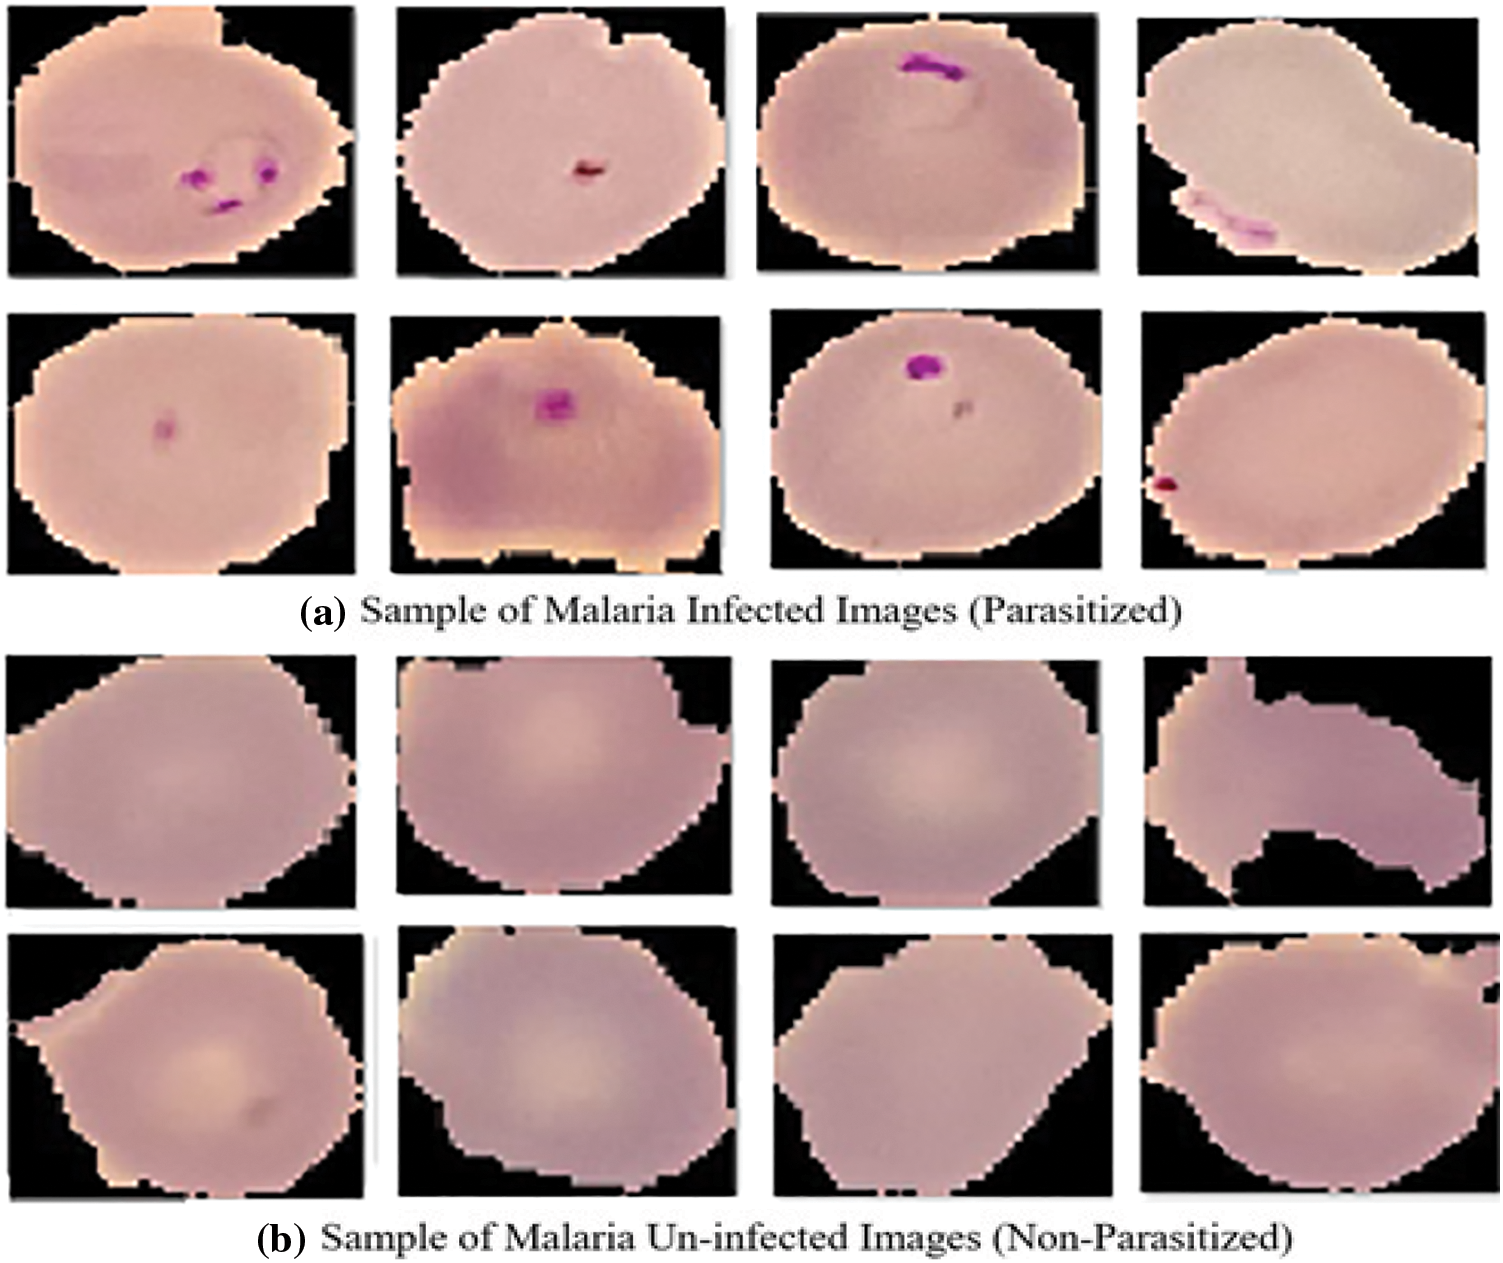
Figure 1: Sample images (a) Malaria parasitized (b) Malaria uninfected. Adapted with permission from reference [20], Copyright©https://lhncbc.nlm.nih.gov
Before performing feature extraction, the noises over the images are removed using preliminary pre-processing and filtering techniques. However, the intermediate layers analyze and extract noise over the images. The extraction of features has a considerable major part in the classification of the image. The classification task has a performance based on the critical image features. The object’s global and local features depend on its shape, texture, or color. The texture and color features are considered the local features, and the global features are represented by shape. Handcrafted and deep features are extracted from the pre-trained deep Neural Network (DNN) VGG19. The deep model extracts the global and local features of the image.
Simonyan and Zisserman suggested the VGG19 in 2014 as the CNN, with 19 layers having 3 fully connected and 16 convolution layers for classifying the images into 1000 objects. The pre-trained network with huge or thousands of images is acquired from the input database. This pre-trained network model intends to categorize the images with various objects over the image. The benefits of the model rely on quicker training speed, lesser training samples and superior accuracy. The training of VGG19 is done on the database of ImageNet, which has a 1000 classification of million images. It is a famous methodology for classifying images because of the usage of multiple 3 × 3 filters in every convolutional layer. Fig. 2 shows the VGG19 architecture. The convolutional layers are included for extracting features and the classification for the next 3 layers task. The segregation of the feature extraction is used by the layers to 5 layers, with every group presented using the max-pooling layer. The image has a 224 × 224 size as the input to the model and then outputs the label by the model for the image object. The extraction of the features is done via the model of VGG19, which is pre-trained, and yet, a different technique for machine learning is used for the classification. There is a requirement to reduce the dimensionality to lower the feature vector size as the model of CNN calculates the large parameters after the feature extraction, which is present in Fig. 2. The classification method helps the dimensionality reduction to follow the Locality Preserving Projection.
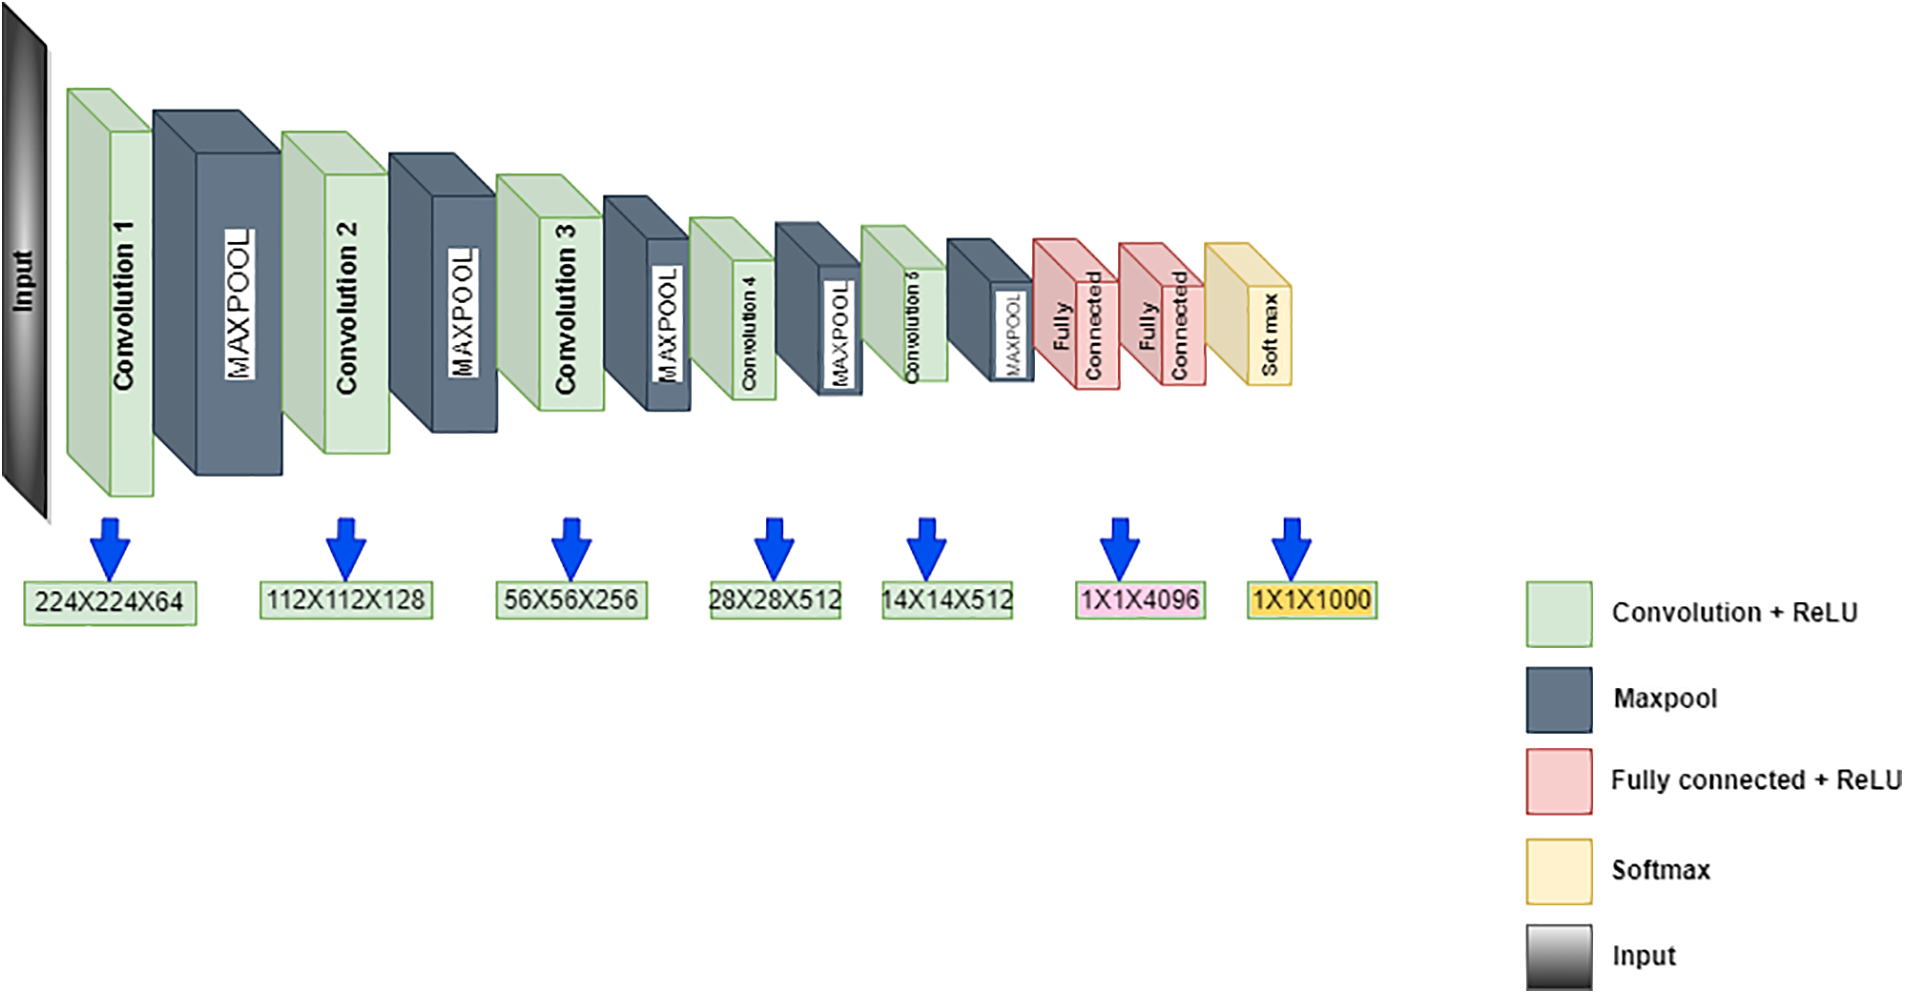
Figure 2: VGG19 architecture
Here, the extracted features from VGG19 are provided to the LSTM sequentially for predicting the outcome. A special Recurrent Neural Network (RNN) replaces the hidden layers via the gate and storage mechanism. Therefore, the LSTM model can be applied to malarial parasite prediction. There are three gates, i.e., input, forget and output gates. The former gate depicts the sequential input data to the LSTM unit update; the forget gate is utilized to retain selectively (state of prior LSTM), and the last gate manages the output information and provides the current hidden state passed to the successive iteration. It is expressed as in Eqs. (1)–(5):
Here,
It is observed from the above Fig. 2 that the dense network attains the appropriate features from the input signal via local receptive field and weight sharing. The model acquires the features via the gate mechanism. The proposed LSTM-CNN model is combined as a dense network for automatically predicting malarial parasites. The CNN model extracts the local feature information, integrates all the features attained from the two structures to the fully connected layers, and performs the prediction process. Based on Fig. 3, it is seen that the proposed model provides simple architecture without a complex one. It helps to reduce overfitting issues, complex hardware requirements, and time costs. Operating the equipment with diverse configurations and attaining better prediction outcomes is easy. In contrast, training the DL optimizer model requires reducing the loss function and changing the epoch’s weight. The optimizer modifies the NN attributes like learning rate and weight. Therefore, it enhances the accuracy and diminishes overall loss.
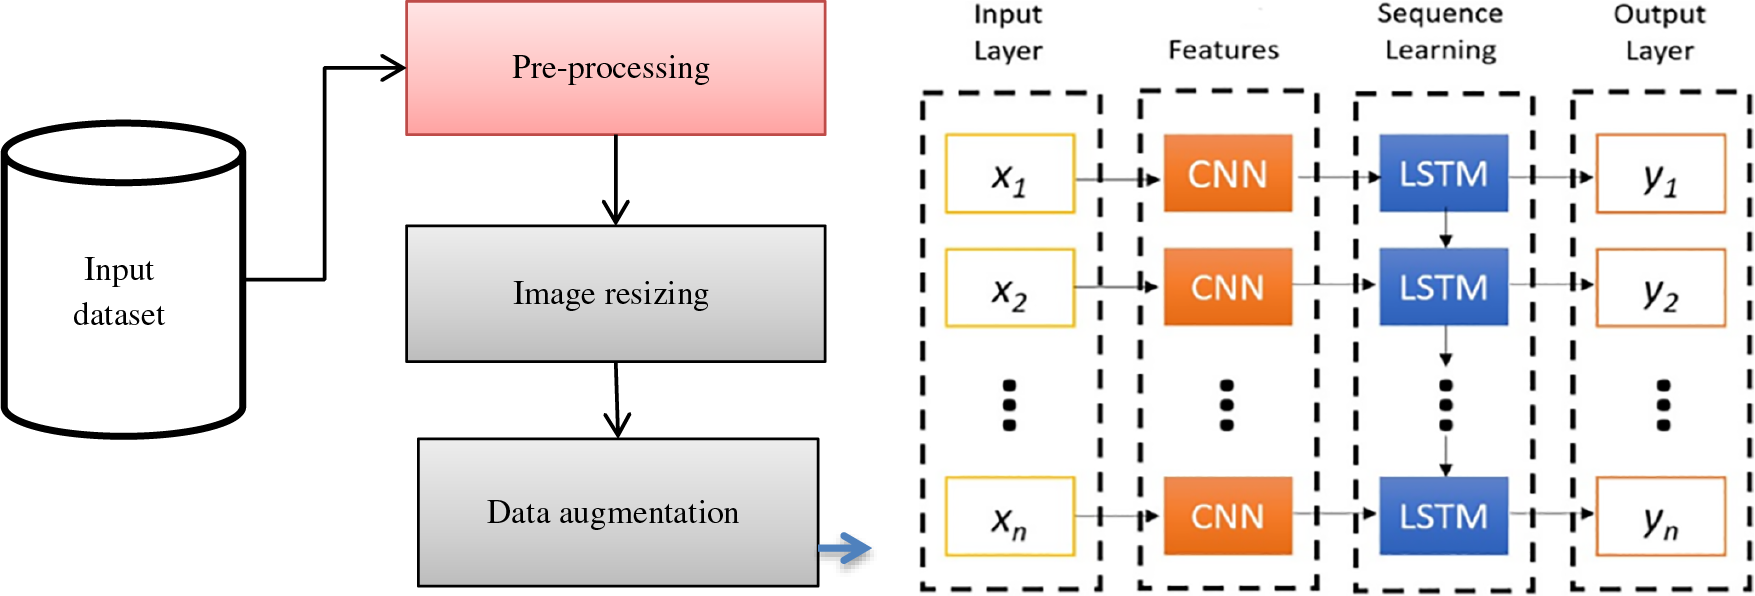
Figure 3: LSTM with dense CNN architecture
The CNN model optimization has the fundamental algorithm, which is Adagrad optimization. The below iteration of parameters is done in Gradient Descent (GD):
Here, the upgraded value for the parameter is
Here, the cost function is
The gradient has a huge volume of noise in every iterative computation. The momentum method initiates the variable
Here, the attenuation coefficient is
Here, the element-wise square
Here, the first and second-order moment gradient estimates are the
2.4.1 Optimization Functionality
The second section presents that the learning rate is the major part of Adagrad’s iteration parameter. The greater the step size is yielded, the greater the learning rate to iterate the parameter and the greater risk of missing the optimum results. A smaller rate of learning attains more refined learning. Moreover, the results of a smaller learning rate give less convergence speed. The important enhancement optimizer trend is the rate of adaptive learning. Every parameter identifies the optimum solution using every dimension of the parameter has the rate of adaptive learning more quickly, and the convergence is realized for the function of cost.
Several adaptive algorithms are developed to increase with the beginning of Adagrad. The global estimation of the gradient gives the rate of adaptive learning factor by many algorithms. Yet, the local gradient is ignored to a few extensions. The rate factor of adaptive learning enhances the attraction given to the present and latent gradient in the proposed system. The fundamental Adam algorithm ensures the global gradient control at a similar time. In the training model of CNN, the essence of degrade is used as the multi-objective optimization concept. The gradient sign implies more information. Similarly, the objective function for the gradients is contiguous, having a similar sign, while the learning rate is too small, and the parameter is placed at the rising edge of the falling edge. Hence, the proposed system’s larger learning rate is used to iterate the parameter. At the same time, the negative and positive alternations occur in the gradients when the learning rate is too large that the objective function can hover over the minimum value. Hence, the smaller learning rate is used in the proposed system to iterate the parameter. The new rate factor of adaptive learning is introduced in the proposed system depending on the mentioned concept defined below:
Here, two consecutive gradients are
The sig function is found as the monotonically increasing function. The sig function has a steeper rising edge like the increases of base
The suggested technique is combined with Adagrad in the proposed system. The adaptive learning rate is used to construct with the first-order moment of offset-corrected and the second-order moment of offset-corrected for controlling the global gradient. Moreover, a new adaptive rate factor of learning is initiated to control the local gradient. The parameters have the final iteration realized in the proposed system based on the below rule:
Here,
2.4.2 Convergence Rate Analysis
The proposed framework for learning is used for analyzing the system’s convergence. The cost function is
Here,
The algorithm’s ability is tested using the test function to find the global minimum that consistently has the CNN model’s training process. Different forms of test functions are used for testing the proposed performance algorithm. The algorithms share similar parameters,
The iteration parameter trajectory is the same as the algorithm to identify the global minimum and finish the work, even though Adagrad can identify the global minimum after 40 iterations. The proposed algorithm works well when compared to Adagrad. The result is nearer to the global minimum after 40 iterations. The less noise is there in the test functions. The RMSprop outperforms other previous algorithms. The proposed algorithm improves the RMSprop, which has a better performance.
The testing process is simple for the traditional architecture of CNN in the dataset test. The network has two convolution layers: one fully connected and one flattened layer. The flattening layer considers dropouts, and the convolution layer uses (300, 600) convolution kernels. The dataset has 2515 testing and 3555 training samples (70:30) and blood smear images of 28 ∗ 28 pixels. The CNNs capability has the better classification on the dataset with the large attraction from the people. The available online dataset is used to test. The test depends on the mini-batch RMSprop with the proposed algorithm’s help to fasten the training process. The convergence curves for the cost function based on the algorithms and the models have the classification error rates after training on the verification set. The test groups are carried out for every algorithm since there are multiple random numbers in the CNN initialization.
The proposed algorithm is combined with another degradation algorithm to enhance the performance since the algorithm has the core which initiates the innovative adaptive rate factor for learning. The RMSprop and adagrad have improved performance when combined with the proposed algorithm. The improved algorithms have the convergence curves in the CNN training process presented below with the original algorithm to indicate the process has a faster convergence speed. The proposed algorithm obtains a better performance by the RMSprop.
The proposed model’s performance is completely based on the input data. Thus, pre-processing plays a substantial role in performing various experiments. Here, the images are manually resized, and patches are rescaled to map the feature range to acquire faster convergence. Then, data augmentation is applied to enhance the model performance. The parameters are rotation:
The proposed system’s highly accurate and effective models are designed to predict the Malaria parasites from the blood smear under microscopy. The sequence of experiments is conducted in the proposed system to assess the deploying the models’ suitability in the power-related devices to conduct the experiments. The autoencoder performs well than other techniques in the experiments. The autoencoder model has a reported accuracy of 91%. On the other hand, the model has a better performance and is reported as 91% concerning accuracy, which is presented in Table 2. The VGG19 model has the ensemble to obtain the performance. Moreover, a severe loss of model concerning efficiency makes them not too suited to deploy in power-related devices. Billions of flops are required by the VGG19 alone. On the other hand, this model needs a total of 4600 flops. This proposed model is a thousand times more effective when compared to the better performances which are reported.
This system is designed not for the diagnosis of malaria parasites effectively, yet a higher accuracy is maintained. The accuracy of 91% is obtained by the experimental model having the 28 × 28 images presented in Table 2, which is equivalent to the mentioned better performance. The experimented model is suggested to consider the quality of the image with 91% accuracy. Compared to modern performances, this model is performed considerably concerning specificity, precision, and sensitivity.
The proposed system compares precision, accuracy, F1-score, and recall. Table 2 shows all the measures having the respective results. The suggested architecture is to perform 5-fold cross-validation, which performs well with 89% precision, 91% accuracy, 91% F1-score, and 93% recall. Few results are obtained from Table 2, with various convolutional layers. The accuracies of 90.33%, 89.80%, 87.50%, 73%, and 84% by the Faster R-CNN, Single Shot Detection (SSD) model, Asymmetric prediction (AIP) model, and Multi-layered Asymmetric model (MLA-ASMP) model are attained accordingly. The number of CNN layers observed increases until the accuracy, 5-layers, F1-score, and precision are also increased. The CNN layers perform cross-validation results, one of the best in the proposed system. Fig. 4 gives the graphical representation of the result. The training accuracy and loss are shown in Fig. 4, and the loss is analyzed for 40 epochs. The precision, recall, and loss for the stacked architecture of CNN are also provided. The trained model has an accuracy greater than 91% for 13 epochs.
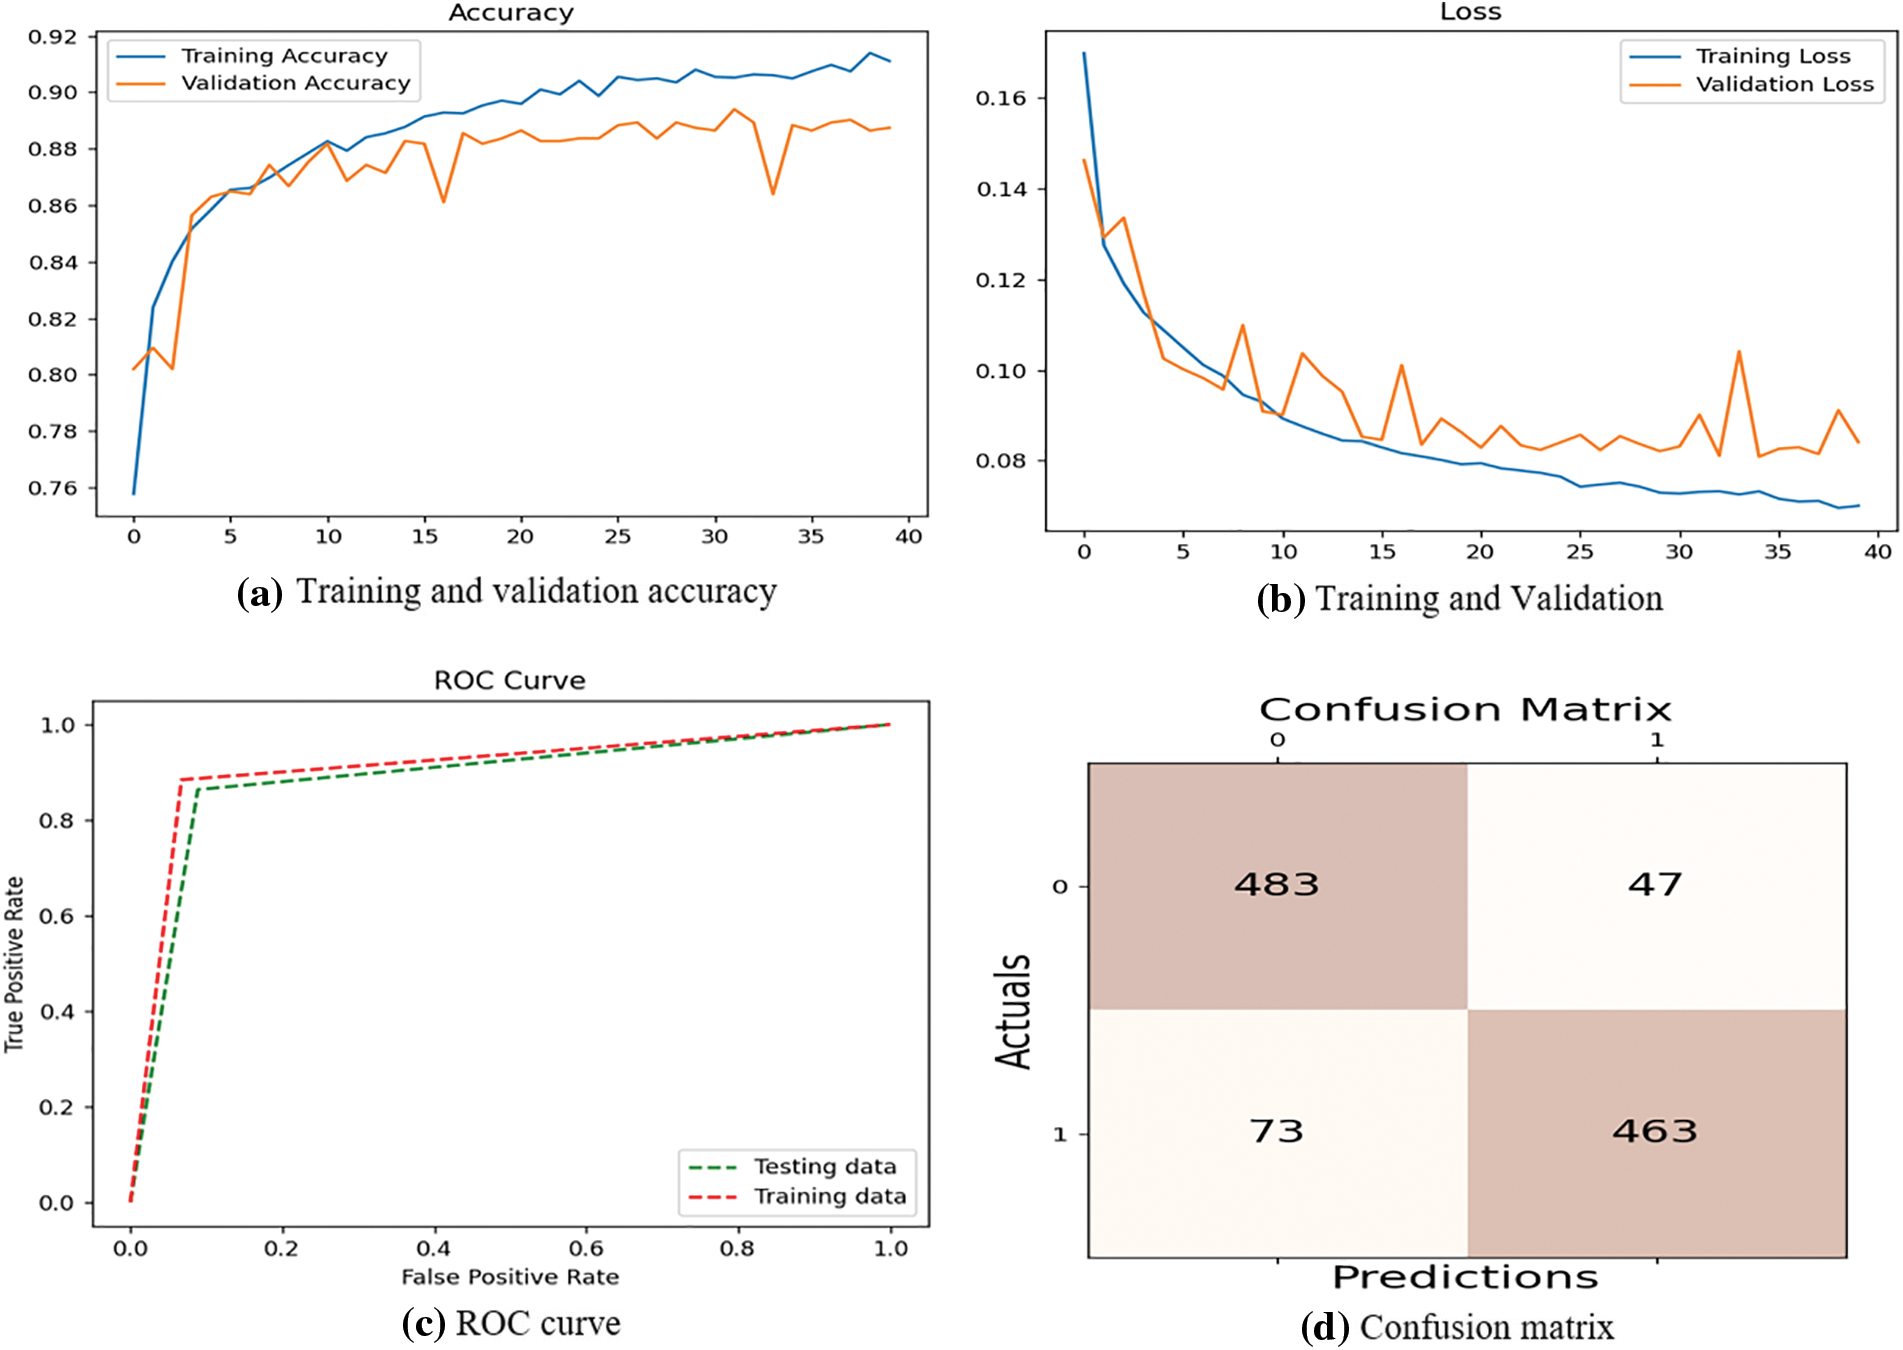
Figure 4: Performance evaluation based on training
It is complicated to distinguish the stains from other artifacts or plasmodium in the blood. In the pre-processing stages, the normalization of the stain is used. The noise is reduced in the proposed system to improve the image quality in pre-processing. After performing the pre-processing steps, there is a drastic variance in precision, accuracy, F1-score, and recall. The proposed CNN obtained the values of the optimum measures using the five-fold pre-processing, various filter sizes, dropout layers, and hyperparameter optimization.
The pre-trained CNN extracts feature before classification; another customized CNN is also considered. The stacked technique performs well in the uninfected cell image of blood and the parasitized classification. This scenario has the optimum layers of CNN found to extract the feature before the classification to detect the malaria parasites. The infected cells are found accurately based on precision, accuracy, F1-score, and recall.
Further comparison with the outcomes of the suggested stacked model of CNN is done with the suggested deep learning models. The baseline methodologies are selected to compare with the suggested model as it obtains better outcomes in detecting the malaria parasite. The models are chosen to compare the dataset, which is tested depending on the image slides of Giemsa-stained thin blood smear. The shallow models are observed to provide a larger accuracy. Further, kernel shape (300, 600) plays a major part in CNN. Small size trains the infected cell image model of parasitized blood on the small spots. The ROC curve computation. Similarly, the confusion matrix with the actual and the predicted outcomes.
In [21], the ResNet model is suggested to perform well among the five pre-trained deep learning models, having an accuracy of 85%, and the customized 3-layered CNN model obtains an accuracy of 90.00%. The approach of color normalization is used to enhance the accuracy [21]. The suggested model improves the accuracy better than the baseline using the normalization of color at pre-processing [21]. The suggested model is compared with other modern models and is presented in Table 3. The performance comparison among the DL models based on CNN on the dataset of malaria is presented in Table 4. The TL-VGG16 is customized with 16 and 8 convolutional layers and was used by another CNN-related model to detect the malaria parasite. The customized technique obtains 96.29% accuracy [19], and TL-VGG16 obtains 97.77% accuracy. More time for training is needed by very deep architecture like converges of TL-VGG16 [19] at 80 epochs. Tables 3 and 4 show the performance evaluation of the training dataset.
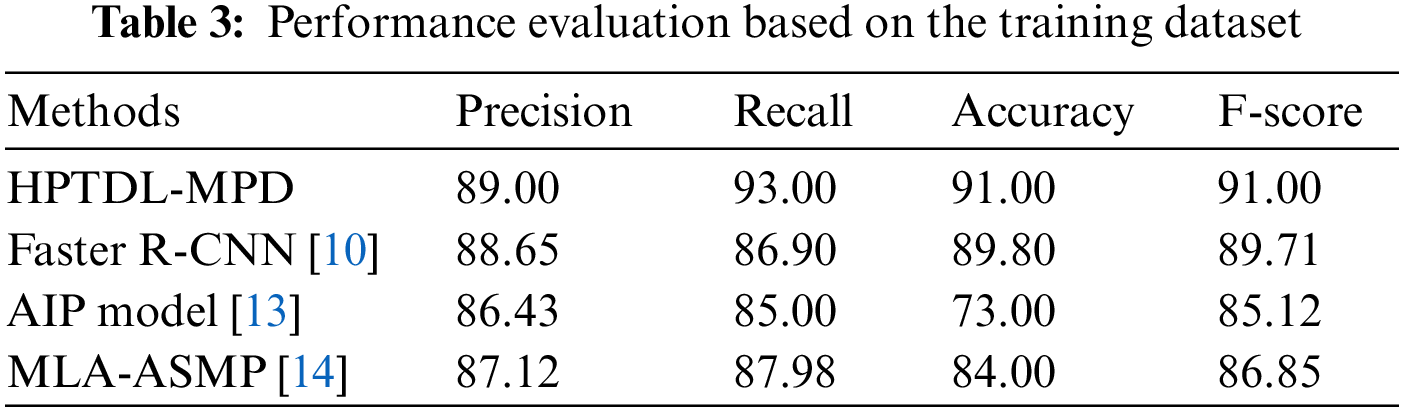
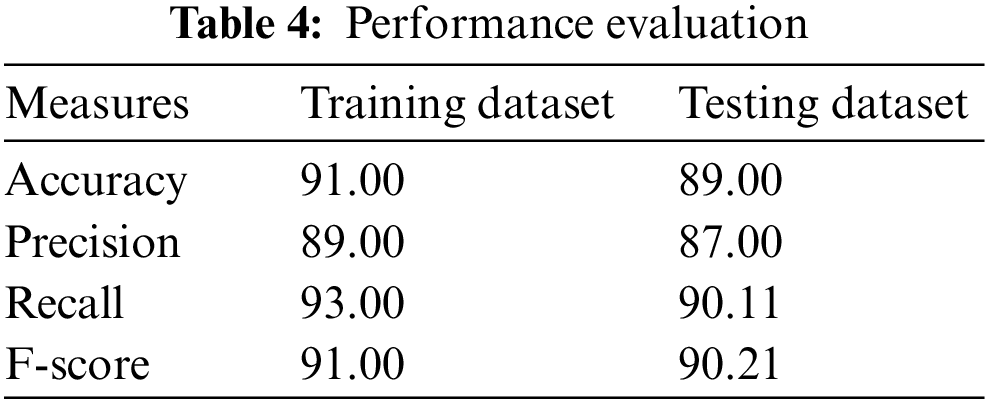
Fig. 5 shows the comparison of the proposed model with other approaches in testing and training data, precision and recall. The dense architecture of LSTM with CNN for sequential feature analysis is used to evaluate the smear images of blood with no normalization of stain. The CNN model is used directly to the images of the dataset providing a poor value of accuracy of 0.08%. The remarkable stain normalization improves the suggested model’s performance by 50% and reaches 91% and identifies the phase for training and evaluating the suggested model.
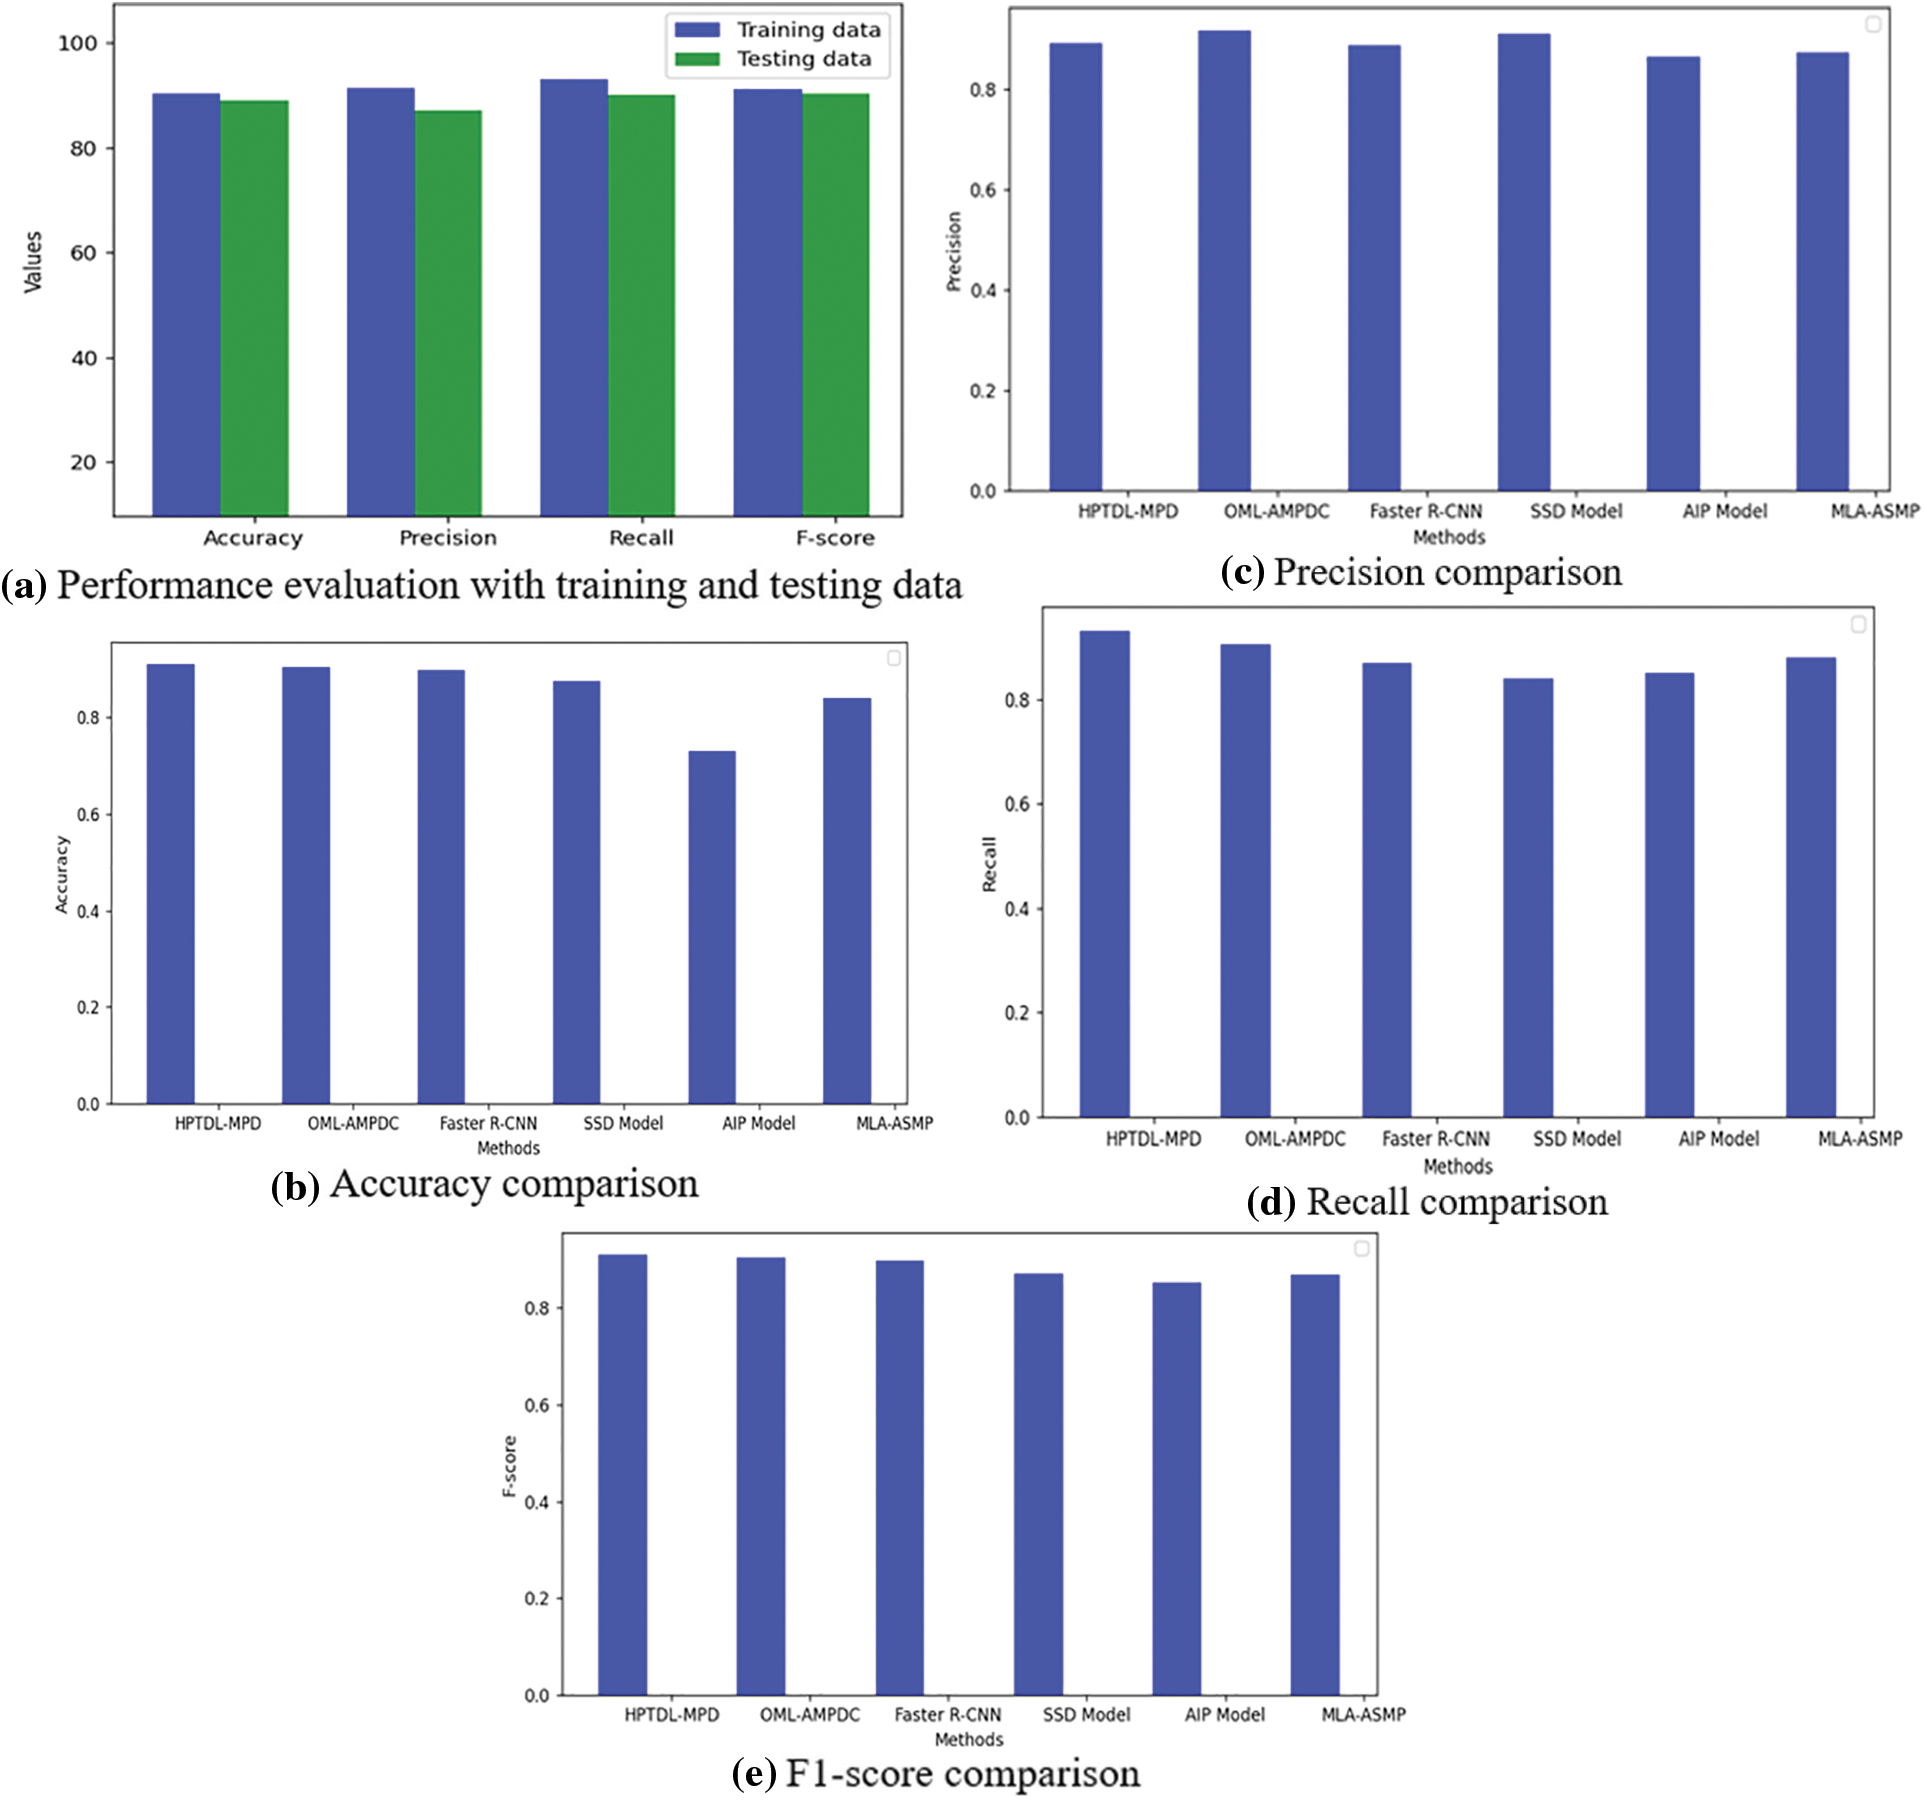
Figure 5: Performance evaluation based on training and testing
This work models a novel, intelligent hyper-parameter-tuned deep learning-enabled malaria parasite detection and classification (HPTDL-MPDC). Many parameter operations are added because of the introduction of the new rate of adaptive learning. A new rate factor of adaptive learning is introduced depending on the present and latest gradients that are not controlled by the changes of global gradient yet also mention the changes of local gradient. When the gradient sign is similar, the parameter is placed at the rising or falling edge for the objective function. The objective function has the minimum value to identify the larger step quickly. The present and latest gradient values give the adjustment factor of adaptive learning rate are higher than 1 via the algorithm to enhance the relevant parameters learning rate. The parameter oscillates near the objective function minimum value indicated when the gradient value sign varies between negative and positive.
In this phase, the present and latest gradient value gives the adjustment factor of adaptive learning rate less than 1 and higher than 0 via the algorithm to minimize the relevant parameters’ learning rate. This algorithm supplements the previous algorithm combined with other previous algorithms. The role of degrade shows the results to combine the proposed algorithm to have the best performance. This methodology has yet to improve the original algorithm’s convergence speed. Yet, higher accuracy is obtained in the test sets of classification. It has a flaw even though the proposed algorithm performs better in the experiment. The proposed algorithm introduces knowing that the gradient provides the alternation of the negative and positive phenomenon to train using the smaller learning rate. The risk of falling is increased to the local minimum. The present and latent gradients are used in the proposed system for further study for constructing other calculation functions of the adaptive learning rate factor; hence the local gradients play the proper part in the training process of CNN. The suggested system outperforms more considerably modern methodologies having 91% accuracy, 91% as accuracy and F1-score, and 93% recall. Due to the hardware constraint, the major research constraint is analyzing the input samples. There are only fewer samples which turn out to be a limitation in the prediction process. Thus, in the future, samples for evaluation need to be improved. However, it will be resolved with validation with huge samples.
Acknowledgement: I thank Computer Science and Engineering Department of the Koneru Lakshmaiah Education Foundation offered me to accomplish this with the enriched research environment.
Funding Statement: The authors received no specific funding for this study.
Author Contributions: Tamal Kumar Kundu: The conceptualization of the research work and defined the research hypothesis and also played a significant role in drafting the methodology and contributed to the results and discussion of the manuscript. Dinesh Kumar Anguraj: formal analysis, data curation, software implementation, resources and conducted statistical analysis and data interpretation. S.V. Sudha: critical review and revision, proofreading, and made substantial edits to improve the clarity and coherence of the manuscript. All authors have read and agreed to the published version of the manuscript.
Availability of Data and Materials: There are no data and materials available to share.
Conflicts of Interest: The authors declare that they have no conflicts of interest to report regarding the present study.
References
1. S. Saraswat, A. Utkarsh and F. Neetu, “Malarial parasites detection in RBC using image processing,” in Proc. of ICRITO, Noida, Uttar Pradesh, India, pp. 599–603, 2017. [Google Scholar]
2. Y. Dong, Z. Jiang, H. Shen, W. D. Pan, L. A. Williams et al., “Evaluations of deep convolutional neural networks for automatic identification of malaria-infected cells,” in Proc. of IEEE EMBS Int. Conf. on Biomedical & Health Informatics (BHI), Orland, FL, USA, pp. 101–104, 2017. [Google Scholar]
3. J. Hung and A. Carpenter, “Applying faster R-CNN for object detection on malaria images,” in Proc. of IEEE Conf. on Computer Vision and Pattern Recognition Workshops, Honolulu, Hawaii, USA, pp. 56–61, 2017. [Google Scholar]
4. L. Rosado, L. Correia da Costa, J. Elias and D. Cardoso, “A review of automatic malaria parasites detection and segmentation in microscopic images,” Anti-Infect Agents, vol. 14, no. 1, pp. 11–22, 2016. [Google Scholar]
5. J. Quinn, R. Nakasi, P. Mugagga, P. Byanyima, W. Lubega et al., “Deep convolutional neural networks for microscopy-based point of care diagnosis,” in Proc. of PMLR, Los Angeles, CA, USA, pp. 271–281, 2016. [Google Scholar]
6. M. Poostchi, K. Silamut, R. Maude, S. Jaeger and G. Thomas, “Image analysis and machine learning for detecting malaria,” Translational Research, vol. 194, pp. 36–55, 2018. [Google Scholar] [PubMed]
7. S. Rajaraman, S. K. Antani, M. Poostchi, K. Silamut, M. A. Hossain et al., “Pre-trained convolutional neural networks as feature extractors toward improved malaria parasite detection in thin blood smear images,” PeerJ, vol. 6, no. 4568, pp. 1–17, 2018. [Google Scholar]
8. C. Dong, C. Loy and X. Tang, “Accelerating the super-resolution convolutional neural network,” in European Conf. on Computer Vision-ECC, Cham, Amsterdam, Netherlands, pp. 391–407, 2016. [Google Scholar]
9. W. Liu, D. Anguelov, D. Erhan, C. Szegedy, S. Reed et al., “SSD: Single shot multi-box detector,” in Proc. European Conf. on Computer Vision—ECCV, Amsterdam, Netherlands, pp. 21–37, 2016. [Google Scholar]
10. S. Ren, K. He, R. Girshick and J. Sun, “Faster R-CNN: Towards real-time object detection with region proposal networks,” Advances in Neural Information Processing Systems, vol. 28, pp. 1137–1149, 2016. [Google Scholar]
11. P. Krishnadas, K. Chadaga, N. Sampathila, S. Rao and S. Prabhu, “Classification of malaria using object detection models,” Informatics, vol. 9, no. 4, pp. 76, 2022. [Google Scholar]
12. M. M. Qanbar and S. Tasdemir, “Detection of malaria diseases with residual attention network,” International Journal of Intelligent Systems and Applications in Engineering, vol. 7, no. 4, pp. 238–244, 2019. [Google Scholar]
13. K. M. Fuhad, J. F. Tuba, M. Sarker, R. Ali, S. Momen et al., “Deep learning based automatic malaria parasite detection from blood smear and its smartphone-based application,” Diagnostics, vol. 10, no. 5, pp. 329, 2020. [Google Scholar] [PubMed]
14. M. Masud, H. Alhumyani, S. S. Alshamrani, O. Cheikhrouhou, S. Ibrahim et al., “Leveraging deep learning techniques for malaria parasite detection using the mobile application,” Wireless Communications and Mobile Computing, vol. 2020, pp. 1–15, 2020. https://doi.org/10.1155/2020/8895429 [Google Scholar] [CrossRef]
15. K. Alok, K. Krishan and P. Chauhan, “Deep learning-based image classifier for malaria cell detection,” Journal of Machine Learning for Healthcare Applications, vol. 65, no. 1, pp. 187–197, 2021. [Google Scholar]
16. E. Irmak, “A novel implementation of deep-learning approach on malaria parasite detection from thin blood cell images,” Electrica, vol. 21, no. 2, pp. 216–224, 2021. [Google Scholar]
17. D. Li and Z. Ma, “Residual attention learning network and SVM for malaria parasite detection,” Multimedia Tools and Applications, vol. 81, no. 8, pp. 10935–10960, 2022. [Google Scholar]
18. D. O. Oyewola, E. G. Dada, S. Misra and R. Damaševičius, “Detecting cassava mosaic disease using a deep residual convolutional neural network with distinct block processing,” PeerJ Computer Science, vol. 7, pp. e352, 2021. [Google Scholar] [PubMed]
19. J. Rangel, J. Martínez-Gómez, C. Romero-González, J. García-Varea and M. Cazorla, “Cazorla semi-supervised 3D object recognition through CNN labelling,” Applied Soft Computing, vol. 65, pp. 603–613, 2018. [Google Scholar]
20. https://lhncbc.nlm.nih.gov/LHC-research/LHC-projects/image-processing/malaria-datasheet.html (acce-ssed on 28/12/2020) [Google Scholar]
21. S. Rajaraman, S. Jaeger and S. K. Antani, “Performance evaluation of deep neural ensembles toward malaria parasite detection in thin-blood smear images,” PeerJ, vol. 7, pp. e6977, 2019. [Google Scholar] [PubMed]
Cite This Article
 Copyright © 2023 The Author(s). Published by Tech Science Press.
This work is licensed under a Creative Commons Attribution 4.0 International License , which permits unrestricted use, distribution, and reproduction in any medium, provided the original work is properly cited.
 Downloads
 Citation Tools