
 Submit a Paper
 Propose a Special lssue
 Open Access
ARTICLE

A Lightweight Deep Learning-Based Model for Tomato Leaf Disease Classification
1 Department of Software Engineering, University of Engineering and Technology, Taxila, 4400, Pakistan
2 Department of Computer Science, Faculty of Physics, Engineering, and Computer Science, University of Hertfordshire, Hatfield, AL10 9AB, UK
3 Department of Computer Science, College of Computer Science and Information System, Najran University, Najran, 55461, Saudi Arabia
4 Departments of Information Systems, College of Computer Science and Information Systems, Najran University, Najran, 61441, Saudi Arabia
5 Department of Computer Sciences, College of Computer and Information Sciences, Princess Nourah bint Abdulrahman University, Riyadh, 11671, Saudi Arabia
* Corresponding Authors: Javed Ali Khan. Email: ; Eman Abdullah Aldakheel. Email:
(This article belongs to the Special Issue: Optimization for Artificial Intelligence Application)
Computers, Materials & Continua 2023, 77(3), 3969-3992. https://doi.org/10.32604/cmc.2023.041819
Received 08 May 2023; Accepted 30 October 2023; Issue published 26 December 2023
 View Full Text
 Download PDF
Abstract
Tomato leaf diseases significantly impact crop production, necessitating early detection for sustainable farming. Deep Learning (DL) has recently shown excellent results in identifying and classifying tomato leaf diseases. However, current DL methods often require substantial computational resources, hindering their application on resource-constrained devices. We propose the Deep Tomato Detection Network (DTomatoDNet), a lightweight DL-based framework comprising 19 learnable layers for efficient tomato leaf disease classification to overcome this. The Convn kernels used in the proposed (DTomatoDNet) framework is 1 × 1, which reduces the number of parameters and helps in more detailed and descriptive feature extraction for classification. The proposed DTomatoDNet model is trained from scratch to determine the classification success rate. 10,000 tomato leaf images (1000 images per class) from the publicly accessible dataset, covering one healthy category and nine disease categories, are utilized in training the proposed DTomatoDNet approach. More specifically, we classified tomato leaf images into Target Spot (TS), Early Blight (EB), Late Blight (LB), Bacterial Spot (BS), Leaf Mold (LM), Tomato Yellow Leaf Curl Virus (YLCV), Septoria Leaf Spot (SLS), Spider Mites (SM), Tomato Mosaic Virus (MV), and Tomato Healthy (H). The proposed DTomatoDNet approach obtains a classification accuracy of 99.34%, demonstrating excellent accuracy in differentiating between tomato diseases. The model could be used on mobile platforms because it is lightweight and designed with fewer layers. Tomato farmers can utilize the proposed DTomatoDNet methodology to detect disease more quickly and easily once it has been integrated into mobile platforms by developing a mobile application.Keywords
Agriculture is essential to the stability and expansion of many economies. Early diagnosis of plant diseases is essential since the commercialization of agricultural practices influences our ecosystem and the world’s economy. Diseases may significantly impact yields and market value, particularly in the case of tomatoes, which are both a staple crop and a key commercial item. Rapid detection can stop the spread of disease, prevent large-scale outbreaks, and lessen severe financial losses. Minor symptoms might develop into serious diseases that imperil vast estates. Therefore, improving early detection techniques is essential for sustainable agriculture and economic well-being [1], notably for tomatoes. Tomatoes are the world’s most widely grown and consumed plant with high nutritional value [2]. According to the most recent data, the globe produces more than 180 million metric tons of tomatoes annually, which are exported for USD 8.81 billion [3]. Unfortunately, tomato production is decreasing because of several diseases and pests, and agronomists find it difficult to accurately identify these diseases [4]. Moreover, one of the main reasons tomato plants fail and farmers suffer financial losses is because of tomato leaf diseases. Several tomato diseases can lead to crop losses, including Septoria leaf spot, viruses such as YLCV, BS, and leaf blights. The recognition of tomato leaf diseases and agricultural financial activity are inextricably intertwined. Finding tomato leaf diseases and implementing suitable control measures is crucial to ensure tomato output and farmer revenue. Farmers in traditional disease identification methods have used their knowledge and visual examination to detect plant diseases. Still, this approach has significant cost, efficiency, and reliability problems [5] due to human mistakes. Due to the wide variety of plant species and identical symptoms, it is occasionally possible for even a skilled farmer and botanist to make a mistake in diagnosing crop diseases. Additionally, reliable, and automated diagnosis of plant diseases is difficult due to the cluttered background, numerous simultaneous diseases, complex disease features, changes in symptoms, etc. Also hindering overall agricultural output are farmers’ nonexistence of specialized expertise and the unavailability of specialists with farming training who can recognize diseases in distant areas. This kind of negligence puts the world’s food production in danger and causes big losses for those involved in tomato production. In addition, a rise in global temperature brought on by climate change has increased the likelihood of diseases developing and catching swiftly [6]. All the identified concerns might be resolved using automated technologies and procedures for early tomato disease detection and identification accessible to farmers [7] to avoid severe losses.
Motivated by the significant achievements of artificial intelligence (AI) methodologies, such as the latest deep learning (DL) methods and traditional machine learning (ML) algorithms in numerous areas, including plant diseases classification [8], crop pest recognition and categorization [9], industry [10], and healthcare [11], numerous AI approaches have been utilized for the automatic identification and detection of tomato plant diseases in precision farming [12]. The production of tomatoes is essential for the food business and the global economy since they are a staple food crop worldwide, a part of several culinary traditions, and have significant economic significance. Thus, disease outbreaks in tomato crops endangered food security and provided significant economic difficulties. This highlights the urgent need for precise and quick tomato disease detection. The recognition and detection of tomato diseases have been addressed in different ways utilizing conventional ML techniques. Although hand-crafted features are frequently used in the classifiers in traditional ML approaches, these techniques are costly (expensive) and time-consuming because the expert must physically (by hand) build these features. Moreover, the amount of available data determines how successful ML classifiers are; for example, a small dataset results in poor accuracy, but bigger data has little effect on accuracy if a particular accuracy threshold is attained. DL models can address these problems by extracting relevant deep features from pictures and achieving greater accuracy than traditional ML procedures. Convolutional neural network (CNN) is one DL technique frequently used to classify plant diseases. The possibility of identifying diseases in tomato crops founded on changes in leaf structures was opened by the development of the CNN model [13]. Consequently, depending on the disease, treatment may start right away. Various tomato disease detection applications have used DL algorithms in recent years to diagnose tomato diseases, delivering state-of-the-art findings [14].
It is still possible to develop highly accurate automated systems for classifying tomato diseases despite the wide range of research on the recognition and categorization of tomato leaf diseases. Despite the recent presentation of a few papers on the classification and identification of illnesses that affect tomato leaves, this area of research has yet to be explored in depth. The approach that is most used for classifying and identifying tomato leaf diseases for studies nowadays is transfer learning (TL) using pre-trained networks and support vector machines (SVM). However, it takes longer to train the SVM ML technique with larger datasets [15,16]. The most problematic limitations in transfer learning are negative transfer and overfitting [17–19]. Furthermore, the researchers have also designed numerous CNN architectures, many of which have deep layers and parameters. As a result, updating these parameters requires powerful computing power, which raises the complexity of classification. We created a novel lightweight DTomatoDNet framework for tomato leaf disease detection to solve these issues in this research. Nineteen learnable layers comprise the proposed model, sixteen of which are Convn, and three are completely linked (FC). The convolution (Convn) kernels used in our framework are 1 × 1, ultimately reducing the number of parameters. We used our approach to categorize nine types of tomato leaf diseases, i.e., SLS, SM, YLCV, TS, LM, BS, EB, LB, MV, and Healthy images.
The research study’s primary achievements are as follows:
• Through the early detection of 10 forms of tomato leaf disease, we created a lightweight and efficient DTomatoDNet framework for improving tomato disease classification performance.
• To accurately classify and identify tomato leaf disease, the unique end-to-end DTomatoDNet framework that is currently proposed automatically retrieves the strongest discriminative features.
• We evaluated the performance of the proposed DTomatoDNet model to the recent state-of-the-art methods for classifying and identifying tomato leaf diseases.
The remainder of the article is ordered as follows. The related work is described in Section 2. The approach is enlightened in Section 3. The particulars of the tests and their outcomes are covered in Section 4. Discussions are covered in Section 5. Section 5 concludes our effort in the end.
Finding the best method for recognizing agricultural diseases has been the subject of much study. This has been achieved through developing techniques that help with crop identification in an agricultural setting. This section discusses peer-reviewed studies with a particular emphasis on tomato plant disease classification.
The prompt detection of tomato plant diseases substantially affects the quantity and quality of tomato plant products. ML techniques are employed in several studies for tomato leaf disease categorization tasks. Narla et al. [20] offered a technique for recognizing plant diseases from their leaf-reflected symptoms that utilize digital image processing (DIP). Three pipelining processes were utilized in the DIP technique: preprocessing, segmentation, and feature extraction. The sick leaf creates color, texture, and structure characteristics. Moreover, collected features create an SVM classifier to label different diseases. Using cross-validation, testing on tomato leaf images from the publicly available datasets produced results with a reasonable level of accuracy. Javidan et al. [21] developed a unique weighted majority voting ensemble strategy to categorize pictures to detect normal tomato leaves and tomato leaves with LB, BS, SLS, LM, and EB. The pictures’ color, texture, and shape characteristics were retrieved and utilized as basic classifier inputs. To improve identification accuracy, effective features were chosen using the Relief approach. Six ML techniques were employed as basic classifiers—discriminative analysis, decision trees, k-nearest neighbors, SVM, random forests (RF), and Naive Bayes (NB). Then, simple majority and weighted majority voting ensemble approaches were used to increase the accuracy of disease categorization. Bhagat et al. [22] classified leaf diseases in plants such as pepper bell, potato, and tomato using hybrid ML approaches. For expressing sick leaf features graphically, they employed a bag-of-feature. The strongest features are extracted using the SURF approach, and SVM was employed for the classification challenge.
Tomato illnesses were categorized using ML techniques using classifiers that were given manually constructed features based on the color, texture, and shape of tomato leaves [23]. These studies, which were often confined to certain conditions and centered largely on a small number of disorders, included extensive feature development. ML techniques relied on substantial preprocessing operations, like color adjustment, a section of interest trimming, background abolition, filtering, and scaling for useful feature extraction since the retrieved features from leaf images were sensitive to their surroundings. Conventional ML strategies can only identify a few diseases from a small dataset because of the increased sophistication brought on by these preprocessing techniques, and they cannot generalize to larger datasets [3]. Furthermore, their conclusions were incomparable because many earlier efforts were based on small, self-curated datasets with few images. The PlantVillage dataset [24], which included 54,309 images of 14 distinct plants and 26 diseases, significantly reduced this issue. Recently, some researchers have employed DL methods for detecting and categorizing plant leaf diseases because these algorithms depend on enormous amounts of data to work properly. One such dataset is PlantVillage. Sagar et al. [25] compared and experimented with several classical ML techniques, such as SVM, RF, NB, and DL, to categorize tomato leaf diseases. According to this study, with a trained Inception V3 framework, CNN could identify or categorize more accurately than traditional approaches.
Furthermore, the effectiveness of a variety of pre-trained CNNs using different hyperparameters has been assessed in existing TL-based algorithms using the PlantVillage database for leaf disease diagnosis to reduce reliance on hand-crafted features and improve the accuracy of classification with large amounts of picture data. Using the conditional generative adversarial network (C-GAN) to generate fictitious images of tomato leaves, Abbas et al. [26] proposed a DL technique for identifying tomato illness. This strategy was one of those tests. Subsequently, TL is used to train a DenseNet-121 to classify tomato leaf images into ten, 7, and 5 illness categories. Like this, Attallah [27] presented an augmentation strategy to provide artificial data supplied to a boundary-aware refined network (BARNet) to categorize tomato leaf diseases into four classes and reach acceptable accuracy results. By separating ill and healthy tomato leaf pictures using two pre-trained CNNs, Inception RessNet V2 and Inception V3, Saeed et al. [28] identified tomato leaf disorders. Several 5225 images and an open-source database called PlantVillage were used to train the frameworks. Several dropout rates were examined for the algorithms. The Inception ResNet V2 and Inception V3 frameworks, with 15% and 50% dropout rates, respectively, provided the most accurate results.
On the other hand, Bensaadi et al. [29] developed a low-cost CNN architecture-based automated crop diseases categorization system that enables quicker online categorization. The training employed about 1,57,000 naturally shot tomato leaf images from 9 distinct classes without any background removal. The created framework was quite accurate in differentiating one disease from another. For the localization of items Kaur et al. [30] utilized the 1610 tomato leaf pictures of various categories from the PlantVillage collection. A very successful DL-modified Mask Region CNN (Mask R-CNN) was developed to independently detect tomato plant leaf diseases. The proposed model included a light head R-CNN to reduce computational cost and memory use. The recognition accuracy and performance of computing the metrics were enhanced by adjusting the anchor ratios in the region proposal network (RPN) and the feature extraction architecture. It was contrasted with current state-of-the-art systems to determine if the proposed approach is workable and reliable. The model’s outcomes met expectations in terms of performance. Afify et al. [31] compared the performance of 4 distinct contemporary state-of-the-art DL frameworks to identify nine distinct tomato diseases and develop a reliable smart scheme for identifying tomato problems to assist farmers and agricultural employees. Fine-tuning, data augmentation, dataset enrichment, and label smoothing strategies were researched to increase the system’s generalization capacity. Furthermore, for categorizing six different tomato diseases, a technique built on multi-ResNet34 multi-modal (MM) fusion learning founded on residual learning was proposed by Zhang et al. [32]. TL, which combines data from several sources, speeds up training, reduces data dependencies, and guards against overfitting caused by a limited sample size, was presented by the authors based on the ResNet34 base framework (environmental parameters and tomato disease pictures data). The feature-level MM data fusion approach is utilized to keep the crucial details of the image used to recognize the feature for the diverse modal data to correct, support, and complement one another and produce a more precise recognition outcome. Similar models fail to forecast the six tomato infections with the same accuracy as the proposed multi-modal fusion network multi-ResNet34.
These earlier approaches for classifying tomato leaf diseases had an impressive performance, but they still have several drawbacks. First, several of these are founded on ML, which traditionally requires domain expertise and understanding. The effort and time needed for manual feature extraction decreases the system’s efficiency. Second, most are built using CNN structures with many deep layers and parameters. Changing these hyperparameters requires advanced computing skills, which raises classification uncertainty. This paper suggests a unique, lightweight, and effective DTomatoDNet for tomato leaf disease classification to get over these constraints.
DL techniques have substantially influenced image processing (more exactly, plant disease detection and categorization). This work proposes the DTomatoDNet DL framework for classifying tomato illnesses. Utilizing the (Tomato leaf disease detection) dataset, we could categorize tomato diseases into ten classes. Fig. 1 depicts the proposed approach’s abstract view. We supplied tomato images into the model to run the proposed method. Additionally, a DTomatoDNet architecture with 16 Convn layers was created and intended to categorize images for the optimum configurations into 10 categories. Finally, we assessed the proposed framework using the (Tomato leaf disease detection) dataset. The proposed model has 19 learned layers, including three FC and 16 Convn layers. The proposed strategy’s specifics are defined in more detail below.
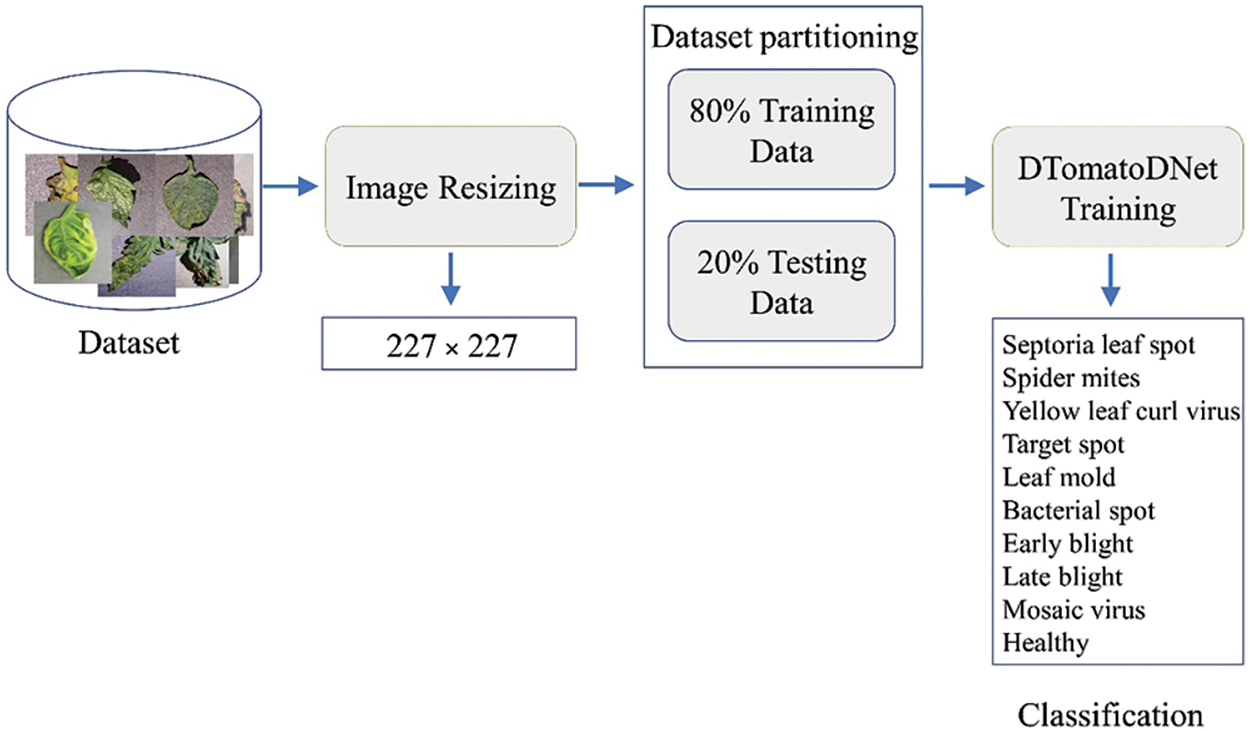
Figure 1: Methodology overview of the proposed method
We performed initial preprocessing by reducing the input images from 256 × 256 pixels to 227 × 227 pixels to preserve consistency and accelerate processing.
The image data is divided into testing and training sets for all experiments. In further detail, we utilized 20% of the pictures for network testing and 80% of the dataset for model training.
We can prevent tomato crop failure by preventing diseases that attack tomato plants. Misclassifying the disease can occasionally result in ineffective treatment plans (using inappropriate chemicals), harming agricultural outputs and the ecosystem. Accurate and early detection and classification of tomatoes are required to ensure food safety and minimize financial loss. This motivates us to create an effective, efficient, lightweight DL model for automatic tomato leaf disease classification and recognition. Squeezenet [33] is the most extensively utilized CNN developed by Forrest N. Iandola. Squeezenet has a remarkable performance in the case of image detection, classification, and recognition. SqueezeNet achieved performance comparable to AlexNet with 50x fewer parameters (using the ImageNet database). Inspired by the Squeezenet model, we proposed a (Deep Tomato Disease Net) DTomatoDNet model for tomato leaf disease identification and categorization. The key purpose of this study was to create a DL-based framework that can effectively and efficiently classify potato leaf diseases. The architecture of our proposed framework is based on the following strategies:
• Architecture depth: Compared to DenseNet’s 100+ layers, ResNet’s deep variations like ResNet-152, and VGG’s 3 × 3 filter-intensive designs like VGG-19, our 16 convolutional layer model is shallower. Our system achieves parameter economy and quick inference using 1 × 1 filters and fire modules, achieving the perfect mix for limited situations.
• Decreasing the number of parameters: The majority of the Convn kernels used in this framework are 1 × 1, since a 1 × 1 kernel has 9X fewer parameters than a 3 × 3 filter. The total quantity of parameters in the layer can be calculated as the (((number of input channels) * (filter width * filter height)) + 1) * (number of filters).
• Parameter efficiency: The emphasis in our model’s design is on parameter efficiency. We can extract useful information from input data with the fewest number of parameters feasible because of the combination of 1 × 1 filters and fire modules.
• Detailed feature extraction: To extract complicated properties more precisely, we employed compact filters, such as 1 × 1 and 3 × 3. We accomplish this with the hope that a feature will be extracted from the image by the linear combination of the convolutional filter-weighted pixels. These considerations guide its completion: Most important characteristics in an image are typically local. Therefore, applying Convns to a limited number of local pixels makes sense using tiny filters simultaneously. These helpful elements can be seen in various locations across an image. So, it makes sense to move a single kernel across the image to extract that feature utilizing that kernel in various locations throughout the image. Therefore, we used small-sized filters to extract more fine-grained and local features.
• Accuracy improvement on a limited number of parameters: In CNN, the spatial resolution of the output activation map produced is often greater than 1 × 1. We controlled the height and width of these activation maps by: (1) employing input images of size 227 × 227 images and (2) employing maximum pooling layers with a stride of 2 × 2 after using many layers of stride 1 × 1 to produce a large activation map. Delayed downsampling (large activation maps) results in higher classification accuracies [34].
• Batch normalization (BN): Batch normalization minimizes network complexity, speeds up training, unifies inputs, cuts down on the number of epochs needed, and offers regularization to keep the framework from overfitting. Leaky Relu (LR): The LRlayer is used to fix the “dying ReLU” issue (no zero slope in the case of LR) and speed up the training process.
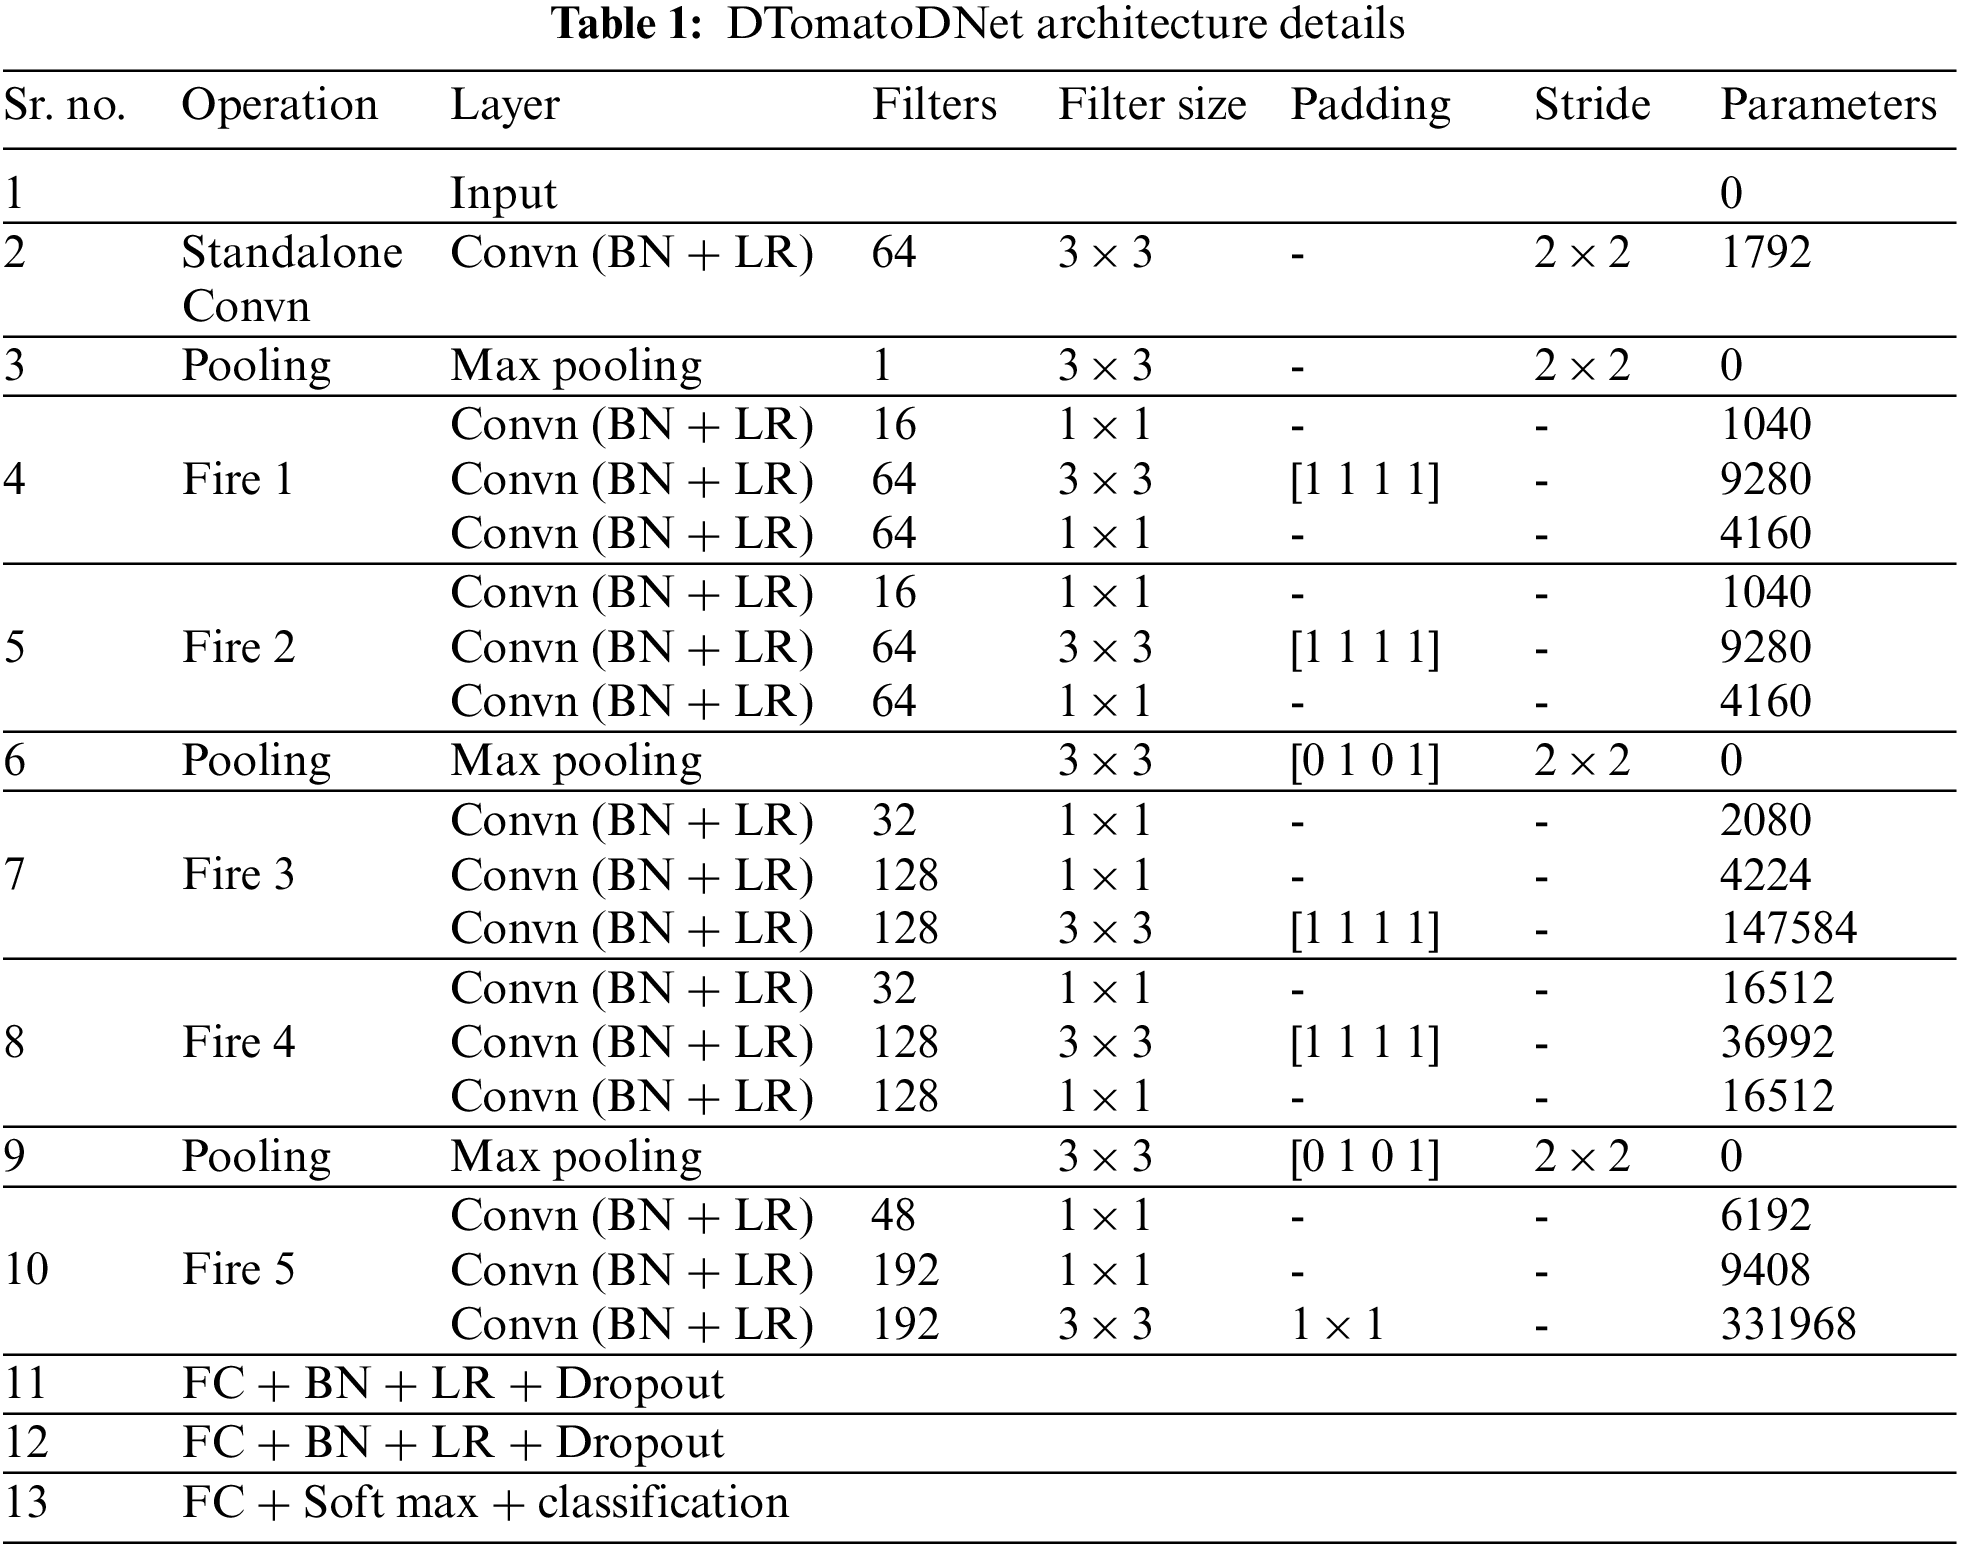
3.4 DTomatoDNet Architecture Details
This research proposed a DTomatoDNet framework for categorizing tomato leaf disease. The architecture starts with the first standalone Convn layer with 64 kernels of size 3 × 3, followed by 5 Fire modules (Fire 1 to Fire 5) and three fully connected (FCD) layers. The fire module consists of three Convn layers, i.e., a squeeze Convn layer with multiple kernels of size 1 × 1, followed by a mix of 3 × 3 and 1 × 1 Convn layers (expand layer). We used 1 × 1 layers to lessen the total amount of parameters. The parameters in the layer can be calculated as the (number of filters) × (number of input channels) × (filter size, i.e., 3 × 3). Therefore, to diminish the number of inputs (input channels) to 3 × 3 filters, we utilized fewer filters in the squeeze layer than in the expand layer. To form the output of the 1 × 1 and 3 × 3 kernels of the same size, we utilized padding of 1 pixel in the Convn layers with 3 × 3 kernels. From the start of the network until its end, we constantly increase the number of kernels per fire module to extract more in-depth features. We used three maximum pooling layers, i.e., after the first standalone Convn layer, Fire 2 and Fire 4.
The architecture is shown in Fig. 2. The DTomatoDNet model consists of 19 learned layers, i.e., 16 Convn layers and 3 FCD layers. Our architecture contains 63 layers, including one image input layer, 16 Convn layers, 18 BN layers, 18 Leaky relu layers, 3 maximum pooling layers, 3 FCD layers, two dropouts, a softmax, and a classification layer. Convn and pooling layers are followed by normalization operation and Leaky relu activation function.

Figure 2: Architecture of proposed DTomatoDNet model
The first layer in our network is the input layer, which processes input images of size 227 × 227. Convn layers with filter sizes of 1 × 1 and 3 × 3 are utilized, which execute Convn processes to generate the feature maps. The initial standalone Convn layer extracts the feature from the input picture (dimensions 227 × 227) by using 64 filters of size 3 × 3 with a stride of 2 × 2. The output of Convn layers (feature map) is calculated as follows:
where the layer number is represented with k (kth layer), the feature’s value is represented with h, the pixel coordinates are represented with (i, j), the filter is represented with , and finally the bias value is represented with
Normalization operations and activation functions follow all Convn and FCD layers (except the last FCD layer). We employed the BN operation to standardize the results of Convn and pooling layers (excluding the last FCD layer).
Activation functions usually follow convn layers. The activation function explains how a layer node converts the input’s weighted sum into an output. The relu activation (RA) function deactivates all neurons with negative values, making many networks inactive. We used an improved version of the RA function (Leaky RA function) after all Convn layers and FCD layers (excluding the last FCD layer) to improve the model’s classification performance. Unlike RA, the leaky relu function does not disable the inputs and produces an output for negative values. Leaky RA function works as follows:
The leaky relu layer yields x (in case of positive input), but in negative input, it proceeds 0.01 times x (slight value).
Moreover, the maximum pooling layers with a stride (shift) of 2 × 2 after the first standalone Convn layer, Fire 2 and Fire 4, are employed for down-sampling. This layer decreases the number of parameters, spatial size, calculations, and computational complexity. Using maximum pooling layers at the network’s end after many layers with stride 1 × 1 produces a large feature map and improves accuracy.
F(x) provides the optimized feature map. Maximum pooling in our framework uses the kernel of size 3 × 3 with stride 2 × 2 to choose the maximum value from the neighborhood pixels (in the picture). The output of the standalone Convn (first Convn layer) is sent to the Fire 1 module, specifically, the first squeeze layer (second Convn layer with 1 × 1 filter) after employing normalization, activation, and pooling. The output first squeeze layer is transferred into the third Convn layer (first expand layer), which applied 64 filters of size 3 × 3 with padding of 1 pixel. Then, the output of the first expand layer is forwarded into the fourth Convn layer (expand layer), which employs 64 filters of size 1 × 1. The output of the initial fire 1 module is directed to the squeeze layer of the subsequent Fire 2 module, continuing this flow until the output of the fifth fire module is transmitted to the initial fully connected dense (FCD) layer. The FCD layer transforms the two-dimensional feature map extracted by the Convn layers into a one-dimensional feature vector. The FCD layer works as below:
where i, m, n, d, w, and b denote the index of the FC layer’s output, width, height, depth, weight, s and bias, respectively. We used BN, leaky relu, and dropout layers (to avoid overfitting) after the first two FCD layers. Whereas the last FCD layer is followed by 10-way softmax and classification layers (as given in Table 1).
The selection of hyper-parameters, often chosen by a trial-and-error-based approach, is crucial to the effectiveness of DL architectures [35]. We tested the efficacy of the proposed DTomatoDNet framework with various hyper-parameter values to identify the best hyper-parameters values, considering the different available choices. We picked a few hyperparameters for a framework to determine how the DL framework hyperparameter influences the representation of the whole model. The framework was trained to employ various parameters on a smaller dataset (a subset of the dataset used in this work), and network performance measures were examined. This approach was repeated utilizing a fresh set of hyperparameter settings until the ideal values were achieved. The model’s accuracy and loss were ideal (high accuracy and low loss values). The conclusive hyper-parameter values can be found in Table 2. Employing the stochastic gradient descent optimization algorithm, we prioritized its speed, memory efficiency, and its compatibility with larger datasets. The framework underwent training for 50 epochs, considering the potential risk of overfitting. Preliminary tests were the foundation for the decision to train the algorithm for 50 epochs. We performed several experimental runs with epoch counts ranging from 10 to 80. We carefully watched the accuracy and loss of the validation during these experimental rounds. The validation loss started to plateau and, in certain situations, even slightly rise for epochs exceeding 50, which indicated that the algorithm was starting to become overfit to the training set of data. As a result, 50 epochs were the best option since they struck a compromise between appropriately training the algorithm and preventing substantial overfitting. Furthermore, the LR layer is used to fix the “dying ReLU” issue and speed up the training process. Whereas a fraction of neurons is arbitrarily “dropped out” or switched off during training as part of the dropout approach, which prevents neurons from turning highly specialized. Numerous DL investigations have objectively supported 0.5 as a fair option. It incorporates just enough unpredictability to avoid over-reliance on neurons and ensure that the algorithm generalizes adequately to new inputs. In our first experiments, a dropout value of 0.5 consistently outperformed alternative dropout values regarding validation performance, supporting its inclusion in the final method we developed. Given the complexity of tomato diseases, using an 80–20 data split in our work follows best practices in ML and DL, giving the algorithm a wide range of data for efficient learning. A sizeable 20% budget set aside for validation guarantees that the effectiveness of our framework is measured on a representative subset, which is essential for an objective evaluation. To best utilize computing resources, it was decided to set the validation frequency at 30 epochs. Our early investigation revealed that across brief epochs, the performance of our framework remained mostly stable. We found a healthy equilibrium by verifying frequently enough to follow framework advancements effectively without putting undue computing burden on the system.

In this section, we offer an extensive assessment of the outcomes of various experiments intended to evaluate the performance of our DTomatoDNet model. We provide information about the experimental setup and evaluation metrics to assess the model’s performance. Additionally, there is more information about the dataset in this section. We used the publicly available Kaggle dataset (Tomato leaf disease detection) to assess the performance of our system.
To judge the performance of the proposed approach, we utilized an easily accessible “Tomato leaf disease detection” dataset [36]. The dataset comprises two collections, i.e., train and val. The training group holds 10,000 pictures for training, whereas the val group holds 1000 pictures for model validation. We used the images of the train collection for both training and validation of our model. The pictures in the dataset have a resolution of 256-by-256 pixels, a bit depth of 24, and both vertical and horizontal resolutions of 96 dpi. The dataset consists of ten classes, i.e., healthy and nine various forms of tomato leaf disease images. The dataset includes TS, EB, BS, LB, LM, YLCV, SLS, SM, MV, and H. All images have three channels (RGB). Some examples of the image data used in this research are presented in Fig. 3.

Figure 3: Sample images of the dataset (a) SLS (b) SM (c) YLCV (d) TS (e) LM (f) BS (g) EB (h) LB (i) MV (j) H
To assess the performance of our method, we used the accuracy, precision, sensitivity, specificity, and F1-score metrics. These metrics are calculated as follows:
where TP, TN, FP, FN, and TS are the total number of samples and, in turn, true positive, true negative, false positive, and false negative results.
4.3 Experimental Setup and Evaluation
We conducted all the studies on a personal laptop with an Intel (R) Core (TM) i5-5200U CPU and 8 GB of RAM. We employed MATLAB R2020a forthe execution (as given in Table 3). For each experiment, the pictures are split into testing and training parts. In more detail, we used 20% of the pictures for experimental validation and 80% of the pictures for training the model. Several experiments are run to assess the effectiveness of the proposed network for tomato disease classification.

4.3.1 Performance Evaluation of Tomato Leaf Disease Classification
The core purpose of this experiment is to assess and test the multi-class classification capacity of the proposed DTomatoDNet framework. We conducted this test to estimate the performance of DTomatoDNet architecture for tomato disease classification into SLS, SM, YLCV, TS, LM, BS, EB, LB, MV, and H. For this experiment, we used 10,000 images (1000 images of each class) of the standard Kaggle “Tomato leaf disease detection” dataset [36], where 8000 images (800 images of each class) were utilized for training and the outstanding 2000 tomato leaf pictures (200 pictures of each class) for testing. The confusion matrix (CM) of our proposed approach is revealed in Table 4. The off-diagonal terms reflect faulty predictions, whereas the diagonal words indicate the number of properly recognized tomato images. During our examination, we noted cases when our algorithm misclassified data. The FP rate for images of healthy tomatoes is an important finding. Even while the results were mostly favorable, 4.5% of the tomato images that were rated as Healthy were unhealthy. This may be due to the initial disease phases’ minor morphological alterations, readily obscured by the pictures’ predominately healthy characteristics. Additionally, the proposed approach performed admirably with diseases like MV and YLCV, reaching a 99.5% accuracy rate for each. The algorithm occasionally struggles to identify these diseases from other pathologies or ailments with a similar appearance, as seen by the marginal 0.5% misclassification in these groups. Future work might reduce these misclassifications by adding more diverse instances of the early disease phases and improving our feature extraction. Precision, accuracy, F1-score, and recall are used as performance estimation measures of the system to measure its performance fully. Our method achieved an average accuracy of 99.34%, a precision of 96.5%, a recall of 96.6%, and an f1-measure of 96.55%, proving our proposed approach’s effectiveness for tomato disease classification and recognition. The loss function illustrates how effectively the DTomatoDNet architecture can identify the dataset. To assess the training performance of the proposed technique, accuracy and loss are displayed in Fig. 4. It is explained that loss and accuracy nearly remain the same (after epoch “30,” proving that we can also produce excellent results at lesser classification epochs. Fig. 4 illustrates how the model’s training and testing loss rapidly lowers while its accuracy increases after each epoch.

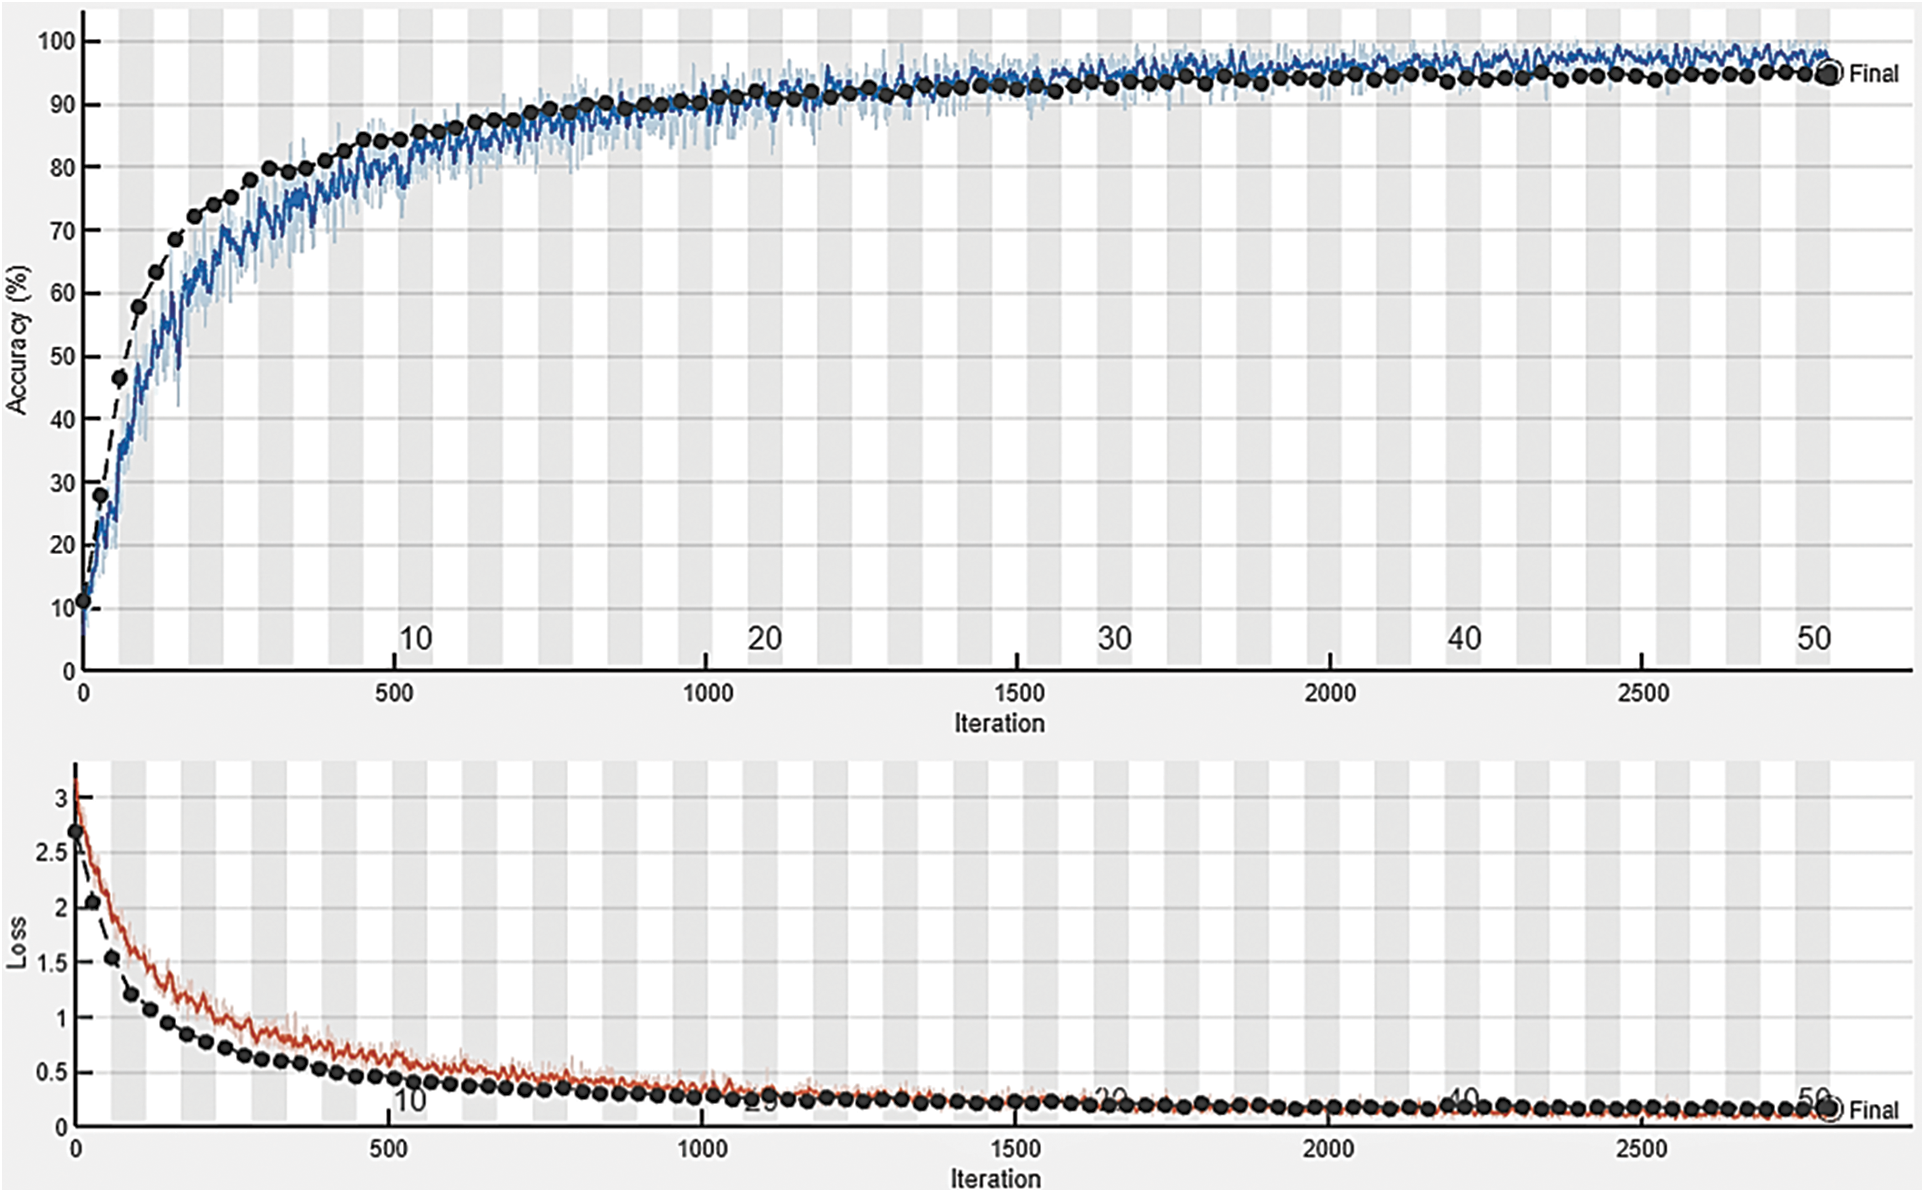
Figure 4: Accuracy and loss obtained by the proposed approach
There is a need for the precise identification and categorization of different tomato leaf diseases to establish the effectiveness and dependability of the proposed method. To do this, we assess how well the proposed DTomatoDNet approach categorizes (identifies the disease) each tomato leaf image. The efficacy of the novel DTomatoDNet approach in diagnosing tomato leaf diseases is demonstrated in Table 5, showcasing its recall, F1-score, accuracy, and precision. The results highlight the exceptional performance of the proposed framework across all evaluation metrics. Since it more correctly depicts each class, the newly built DL model’s strength is a key factor in the increased accuracy in pest identification.

To assess the categorization results of the proposed method more precisely, we utilized the valued area under the receiver operating characteristic curve (AUC-ROC) performance indicator. The ROC curve shows the proportion of TP to FP, showing the classification framework’s sensitivity. The AUC-ROC metric unquestionably helps assess and educate us about a framework’s ability to classify data. The judging criteria state that a model with a higher AUC is superior. The ROC for the proposed sDTomatoDNet architecture is displayed in Fig. 5. The AUC is near 1, or 0.9983, which suggests that the proposed model has a decent amount of separability.
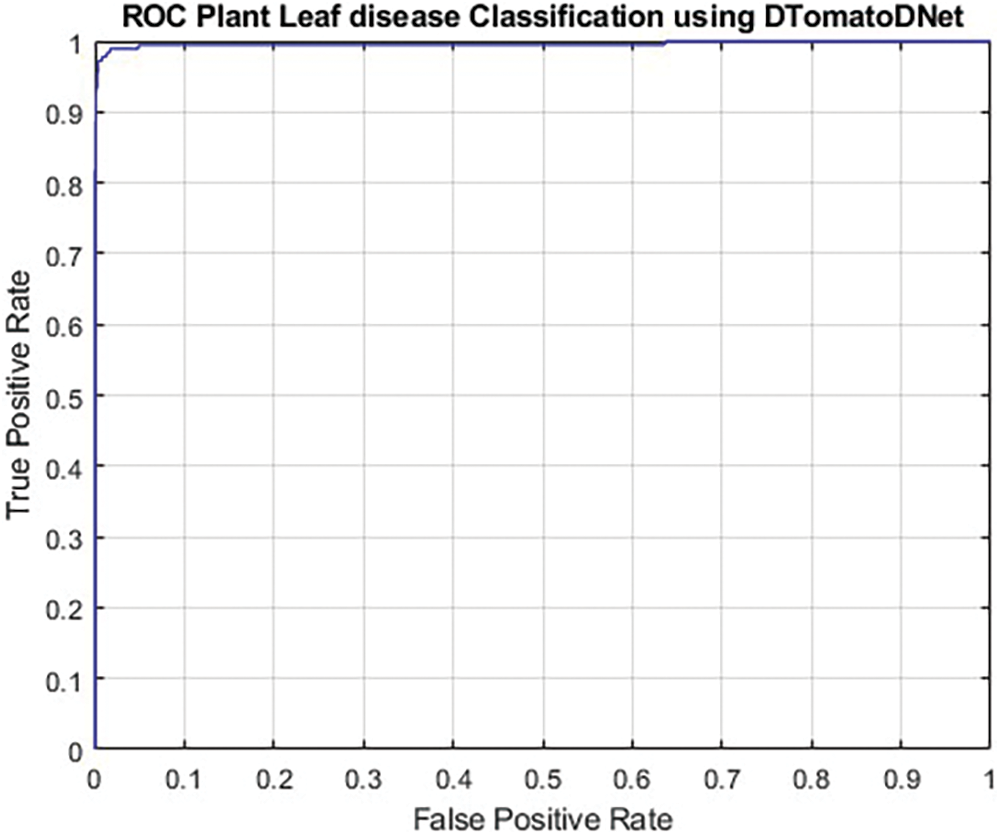
Figure 5: ROC plot of DTomatoDNet framework for tomato leaf disease classification
4.3.2 Comparison with Hybrid Methods
In this section, the usefulness of the proposed DTomatoDNet framework is examined by building a hybrid experiment for categorizing tomato leaf diseases to identify ten different tomato diseases. We contrasted our technique with hybrid approaches on the same dataset because we had the best classification performance when using 10 class classifications. It is underlined that utilizing an SVM for classification instead of a conventional CNN at the top of the model would yield better classification outcomes. The widely used deep CNNs, such as ResNet18 [37], SqueezeNet [33], MobileNetV2 [38], ShuffleNet [39], AlexNet [40], GoogleNet [41], and DarkNet19 [42] were employed to extract deep features and overcome this problem. We then utilized these features as inputs to make a linear SVM using these features (decision function). Gamma and C hyperparameter values were adjusted to 0.1 and 1.0, respectively, for a better effect. These algorithms have numerous layers and demand input images of varying sizes. For instance, the Squeezenet Network has 18 layers and uses input tomato leaf pictures of 224 × 224 dimensions; the GoogleNet framework has 22 layers and processes a picture of 227 × 227 dimensions. Hence, we resized the tomato leaf pictures using improved image datastore functions to comply with these models’ requirements for the input picture. We used the same experimental setting to train these DL-based models (values for the hyperparameters were selected using the same methodology as the indicated method). We employed activations because the deeper layer (final FC layer) includes greater high-level features than the earlier layers. These layers merge the global spatial positions of the input features after activation functions to create independent features (ShuffleNet and AlexNet produce a total of 544 and 1000 features, respectively). The dataset consists of 80% training sets and 20% testing sets. Surely, for this experiment, we used 10,000 images (1000 images of each class) of the standard Kaggle “Tomato leaf disease detection” dataset [31], where 8000 images (800 images of each class) were utilized for training and the outstanding 2000 tomato leaf pictures (200 pictures of each class) for testing. According to the results (Table 6), compared to DTomatoDNet, the deep features of these DL-based algorithms and the SVM technique produced inferior results (in terms of precision, accuracy, recall, and F-measure). ShuffleNet attained the second greatest results (accuracy of 98.89%), whereas GoogleNet achieved the lowest classification performance (accuracy of 97.13%) of all contemporary models GoogleNet. The proposed DTomatoDNet model effectively extracts more distinguishing features from the tomato leaf pictures. Therefore, this novel method outperformed the present tomato leaf disease classification approach to recognize various kinds of tomato leaf diseases. We extracted more detailed and in-depth features using small filters with 3 × 3 and 1 × 1 sizes. Moreover, the DTomatoDNet model’s BN method normalizes and reduces generalization errors and regularizes the inputs to a layer for each mini-batch.

4.3.3 Performance Evaluation on “Tumor Classification Data” Dataset
According to experimental tests, the DTomatoDNet framework achieves well in the case of several plant disease categorization tasks and datasets. However, more validation on different datasets in other domains is required to show our framework’s adaptability, robustness, and power across all fields. To classify brain tumors, we put the proposed DTomatoDNet system to the test using benchmark medical pictures. This work’s “Tumor Classification Data” (Dataset for tumor classification), which is easily available on the Kaggle website [43], was used to categorize brain tumors into malignant and benign types. Together with images of the normal brain, this dataset also contains magnetic resonance imaging (MRI) scans of malignant and benign tumors. The dataset is divided into two folders, Train and Test, with three subcollections, Normal, Malignant, and Benign, in each. The 350 malignant and 350 benign MRI images from the training collection were the only pictures we utilized to test and train the proposed framework, meaning no other images were used. The remaining 280 images of each category were utilized for training our framework, whereas we only needed 70 pictures of each category for testing. We used the identical experimental system described in Table 2 to train our model. Our framework needed 420 min and 40 s to train. The results demonstrated that the proposed DTomatoDNet technique functioned satisfactorily, obtaining F1-scores of 95.27%, 94.5, 95.5, and 94.99 in the related medical domain. This confirms the effectiveness of the proposed strategy.
In the field of DL, the phrase “ablation research” is increasingly used to track how well the recommended DL model performs by examining the results of changing certain components. A thorough ablation study demonstrated the effectiveness of the DTomatoDNet architecture. To assess how each component of the DL architecture contributes to the representation of the entire network, an ablation investigation involves removing or altering a portion of the architecture. To be more precise, after removing each fire module, the performance of the DTomatoDNet model is assessed. It is essential to assess the stability of the DTomatoDNet architecture in this ablation research to ascertain how the fire modules and convolutional layers affect the system’s performance. Four experiments that included deleting some layers, or fire modules, from the proposed architecture were used to conduct an ablation analysis. We used the identical experimental setup (Table 2) and dataset for all our studies as we did for our main experiment. To verify the effect of fire modules on the model’s performance, we deleted the fire modules (with three convolutional layers) in these trials. Table 7 provides an overview of the ablated models’ performance. The results show that the framework performance decreases when any aspect of the DTomatoDNet model is changed or eliminated. However, the computational burden may be reduced by removing one or more modules from the architecture, and the framework will still achieve satisfactory performance, as shown in Table 7.

4.3.5 Performance Evaluation on Train/Validation/Test Split
The major objective of this experiment was to examine our model’s effectiveness in detecting tomato leaf diseases in samples that have not been observed. This experiment’s dataset is divided into three parts: training, validation, and testing sets. We used 70% of the input data for training, 20% for validation, and 10% (unseen samples) for testing for the proposed DTomatoDNet approach. We utilized 10,000 pictures total from all 10 classes (900 for testing, 1800 for validation, and 7300 for training our model), which is more information. The training set employs the proposed DTomatoDNet model for categorizing tomato leaf diseases using the criteria specified in Table 2. There are 50 epochs and 2800 total iterations in the training phase of DTomatoDNet (56 iterations per epoch). The model’s average validation and testing (on unseen samples) accuracies at epoch 50 were 99.03% and 98.95, respectively. The proposed DTomatoDNet approach’s validation and testing confusion matrices are displayed in Tables 6 and 7, respectively. Table 8 displays the outcomes from the validation, test, and train splits.

4.3.6 Comparison of the Proposed DTomatoDNet with State-Art Methods
Additionally, an experiment was conducted to assess the classification proficiency of the DTomatoDNet model for distinguishing tomato leaf diseases, in comparison to other state-of-the-art methodologies. In this experiment, we compared the proposed work against the most recent ML-based [20–22] and DL-based [44–46] methods for categorizing tomato leaf diseases. This is not a direct comparison because of variations in training and testing techniques, processing power, and data preprocessing used in the respective methodology. In [44], the authors used data from the PlantVillage dataset to classify tomato leaf diseases using CNNs and TL. There were around 16,000 leaf images spread over 10 classes in the dataset. The training, test, and validation set received 70%, 20%, and 10% of the total data. The performance of a CNN model created from scratch for learning was compared to that of four TL models: ResNet50, DenseNet121, VGG16, and InceptionV3. The algorithms are assessed using cross-entropy loss and accuracy. For the provided dataset, the VGG16 and CNN models, created from scratch, demonstrated encouraging results, with validation accuracy on the test set of 90% and 83%, respectively. In [45], the authors offered a cutting-edge technique for classifying distinct plant types. The technique was created to discover and categorize different tomato leaf diseases. Utilizing 2598 images from the PlantVillage dataset, DL networks were trained to identify tomato leaf diseases (PVD). The trained model demonstrated competence by reaching an accuracy level of 96.37%. The authors of [46] presented a T-LeafNet that can recognize normal leaves and nine distinct diseases in tomato plant leaves. The effectiveness of classification was evaluated by training the proposed system from scratch. Also, the dataset was used to analyze pre-made network models MobileNetV2, AlexNet, and VGG16 architectures, and the outcomes were contrasted as part of TL. The effects of data augmentation and learning coefficient parameters on achievement were also examined by utilizing tests on both the original and augmented data with varied learning coefficients. T-LeafNet achieved the highest classification accuracy of 97.32%. In [47], the authors employed two TL-based frameworks, VGG19 and VGG16, together with a customized CNN algorithm to categorize tomato leaf diseases. Additionally, ablation research was carried out to determine the ideal network parameters. After employing data augmentation approaches, the proposed method had the greatest accuracy and recall of all the models, 95.00%. A new network for classifying tomato leaf diseases was developed using the Dense Inception MobileNetV2 parallel convolutional block attention module network (DIMPCNET) [48]. An improved bilateral filtering and threshold function (IBFTF) method was developed to eliminate noise. The issue of big intra-class differences and minor inter-class differences was addressed by the Dense Inception CNN module (DI). MobileNetV2 now has a parallel convolutional block attention module (PCBAM) to lessen the effect of complicated backdrops. According to the experimental findings, DIMPCNET’s recognition accuracy and F1-score are 94.44% and 0.9475, respectively. According to the results in Table 9, our approach outperformed all the contemporary methods. Notably, the DTomatoDNet technique employs an end-to-end learning framework, eliminating the need for distinct feature extraction, selection, or segmentation procedures.

It is important to remember that premature monitoring is essential for choosing the greatest operative treatment plan and stopping the disease transmission. Professionals routinely recognize and diagnose diseases by simple observation. Farmers commonly identify issues based entirely on their knowledge, necessitating the need for professionals to monitor the work and a precise recognition procedure continually. To do this, the expert needs academic training, in-depth knowledge of many different disciplines, expertise with disease symptoms, and an understanding of various diseases’ causes. So, a skilled doctor must be knowledgeable about all the symptoms and warning signals the disease brings. Also, it is a laborious chore for farmers to check plants regularly. As a result, much work has gone into developing a method that uses leaf images to classify diseases automatically. These methods’ primary goal is identifying diseases in their earliest stages so that the right therapy can be given when needed.
DL is advancing significantly in problem-solving thanks to the adaptability of computer vision techniques, and its outcomes outperform the state-of-the-art in different areas. DL refers to using artificial neural network (ANN) architectures with substantial processing layers instead of the “shallower” architectures of more traditional ANN approaches. The ability to directly use raw data without depending on specialized features is the main advantage of DL. DL may be utilized for various tasks, such as object identification and image classification, which have greatly enhanced image classification in several industries, including agriculture. In this study, a lightweight DTomatoDNet architecture is used to identify tomato disorders, inspired by the success of DL and the rapid expansion of CNNs. Nine different tomato leaf diseases can be more precisely (99.33%) identified by our algorithm than healthy plant leaves. The proposed DTomatoDNet model took 1338 min and 23 s to train on a computer with 8 GB of RAM for categorizing tomato leaf images. But this time, it depends on the computational power of our machine, the number of epochs, and iterations. The length of time depends on how much processing power is used to build and train our model. During the training phase, the DTomatoDNet experienced 3100 iterations—62 iterations each for 50 epochs. We can reduce this training time by reducing the number of layers, using machines with high computational power (without affecting the classification performance), or training the model with fewer epochs. Based on the experiments in the ablation study, we can reduce the number of layers and still achieve good classification performance. Furthermore, based on the training graph (Fig. 4), we can achieve the best results even at fewer epochs. The proposed model is assessed against state-of-the-art methods discovered in the field and hybrid approaches (DL + SVM). We tested the system using “Tumor Classification Data,” another well-liked and freely accessible Kaggle dataset [38], to investigate the efficacy and universal applicability of the recommended DTomatoDNet architecture. The proposed architecture surpasses innovative and hybrid techniques and works well.
Our work achieves this best because our novel DTomatoDNet based method employed the LR activation function instead of the RA function. To solve the dying ReLU issue, we additionally applied the LR activation function. The DL model will not function if Relu dies for some reason. We used LR and the DTomatoDNet method that was recommended to resolve this problem. The LRactivation technique allows a non-zero (small) gradient whenever the part is unused. Thus, it continues to learn without halting or encountering obstacles. Therefore, the proposed DTomatoDNet network performs better when categorizing tomato leaf diseases due to the enhanced feature extraction capabilities of the LR activation function. We used fire modules consisting of three Convn layers, i.e., a squeeze Convn layer with multiple kernels of size 1 × 1, followed by a mix of 1 × 1 and 3 × 3 Convn layers (expand layer). We used 1 × 1 layers to reduce the number of parameters. Moreover, these outcomes can be ascribed to our method’s capability in effectively capturing resilient and distinctive features from tomato leaf images, ensuring precise and reliable classification. The initial Convolutional layers capture fundamental features such as color and edges while deeper layers focus on extracting complex information like irregularities within the tomato leaf images.
Even though the recommended approach produced favorable results, we identified a few shortcomings and offered suggestions for further study. The key limitation of this method is that it cannot detect multiple diseases on the same leaf. Our approach only classifies images into disease types; however, the leaf may be affected by more than one disease in real life. The proposed technique involves regularly dividing the picture data into a training set (80%) and a test set (20%). On the contrary side, different divisions can result in different outcomes. To assess the effectiveness of the DL networks, we employed the most popular dataset for tomato disease detection. However, this dataset only contains a few images—approximately 1000 per class—of ten different laboratory-captured tomato diseases. In the future, we will publish pictures of the leaves with numerous diseases to identify them all. We have compared the effectiveness of the proposed system to hybrid methods (DL + SVM). Still, in the future, when we utilize the softmax for classification rather than SVM, we will compare the results of our method to those of other TL-based techniques. Furthermore, we will validate our model on a large (another) dataset of tomato leaf diseases in real conditions. In the future, we will test our approach on unseen samples from our dataset. Moreover, to validate the robustness of our approach, we will perform cross-dataset validation. In the future, we will use one dataset for the training of our model and another dataset for the validation of our model. Also, in the future, we will use deep dream images (which return the array of images) to visualize the features learned by our model.
It is crucial for anyone working in agricultural production to identify diseases quickly. It can assist agricultural practitioners in identifying disease kinds rapidly, reducing time spent talking to experts about disease types, recognizing disease kinds more rapidly and responding, and minimizing financial losses brought on by crop diseases. To classify tomato leaf diseases effectively, this paper presented the DTomatoDNet framework. The proposed framework is superior to current approaches, as evidenced by the accuracy of 99.34% for classifying tomato plant diseases. The effectiveness and resilience of the proposed model for tomato illness recognition and classification have also been proven by experimental findings on the medical domain’s common Kaggle dataset (Tumor Classification Data). We believe the proposed approach offers a potential resolution to benefit the agricultural industry. In the future, we will test the proposed model by integrating aerial images [49] and ground-level images to enhance the robustness of our model. Furthermore, we aim to validate the performance of the proposed DTomatoDNet approach by testing it on the classification of brain tumors, mask detection, epileptic seizure detection, predicting heart diseases, and breast cancer to generalize it further. We performed certain analyses on the proposed approach experiments, such as the confusion matrix shown in Table 4, to evaluate the performance of deep learning algorithms. However, in the future, we are interested in further evaluating the proposed approach performance by employing Heatmaps and TreeMaps to identify misclassification cases.
Acknowledgement: Authors thank Princess Nourah bint Abdulrahman University Researchers for Supporting Project Number (PNURSP2023R409), Princess Nourah bint Abdulrahman University, Riyadh, Saudi Arabia.
Funding Statement: The authors are thankful to the Deanship of Scientific Research at Najran University for funding this work under the Research Group Funding Program Grant Code (NU/RG/SERC/12/3). Also, this research was funded by Princess Nourah bint Abdulrahman University Researchers. Supporting Project Number (PNURSP2023R409), Princess Nourah bint Abdulrahman University, Riyadh, Saudi Arabia.
Author Contributions: N.U. developed the method, detailed investigation, and manuscript writing; J.A.K. and S.A. revised the methodology, supervised, and revised the manuscript writing (revised draft). M.S.A., E.A.D.S.K., and M.Q. revised the experiments and analysis, and edited the manuscript where necessary (final draft). All authors have read and agreed to the published version of the manuscript.
Availability of Data and Materials: The materials and data used in this paper are available on request from the corresponding author.
Conflicts of Interest: The authors declare that they have no conflicts of interest to report regarding the present study.
References
1. S. Savary, A. Ficke, J. N. Aubertot and C. Hollier, “Crop losses due to diseases and their implications for global food production losses and food security,” Food Security, vol. 4, no. 2, pp. 519–537, 2012. [Google Scholar]
2. M. S. Al-gaashani, F. Shang, M. S. Muthanna, M. Khayyat and A. A. El-Latif, “Tomato leaf disease classification by exploiting transfer learning and feature concatenation,” IET Image Process, vol. 16, no. 4, pp. 913–925, 2022. [Google Scholar]
3. S. Ahmed, M. B. Hasan, T. Ahmed, M. R. K. Sony and M. H. Kabir, “Less is more: Lighter and faster deep neural architecture for tomato leaf disease classification,” IEEE Access, vol. 10, no. 2, pp. 68868–68884, 2022. [Google Scholar]
4. S. Panno, S. Davino, A. G. Caruso, S. Bertacca, A. Crnogorac et al., “A review of the most common and economically important diseases that undermine the cultivation of tomato crop in the Mediterranean basin,” Agronomy, vol. 11, no. 4, pp. 2188–2192, 2021. [Google Scholar]
5. M. A. F. Azlah, L. S. Chua, F. R. Rahmad, F. I. Abdullah and S. R. Alwi, “Review on techniques for plant leaf classification and recognition,” Computers, vol. 8, no. 77, pp. 123–143, 2019. [Google Scholar]
6. FAO, Climate-Related Transboundary Pests and Diseases. Technical Background Document from the Expert Consultation, Rome, Italy, pp. 59–67, 2008. [Google Scholar]
7. L. Li, S. Zhang and B. Wang, “Plant disease detection and classification by deep learning—A review,” IEEE Access, vol. 9, no. 6, pp. 56683–56698, 2021. [Google Scholar]
8. N. Ullah, J. A. Khan, S. Almakdi, M. S. Alshehri, A. l. Qathrady et al., “An effective approach for plant leaf diseases classification based on a novel DeepPlantNet deep learning model,” Frontiers in Plant Science, vol. 14, no. 10, pp. 1212747–1212763, 2023. [Google Scholar] [PubMed]
9. N. Ullah, J. A. Khan, L. A. Alharbi, A. Raza, W. Khan et al., “An efficient approach for crops pests recognition and classification based on novel DeepPestNet deep learning model,” IEEE Access, vol. 18, no. 23, pp. 789–799, 2022. [Google Scholar]
10. Z. Jan, F. Ahamed, W. Mayer, N. Patel, G. Grossmann et al., “Artificial intelligence for Industry 4.0: Systematic review of applications, challenges, and opportunities,” Expert Systems with Applications, vol. 216, no. 24, pp. 119456–119477, 2022. [Google Scholar]
11. N. Ullah, A. Javed, A. Alhazmi, S. M. Hasnain, A. Tahir et al., “TumorDetNet: A unified deep learning model for brain tumor detection and classification,” PLoS One, vol. 18, no. 9, pp. e0291200–e0291224, 2023. [Google Scholar] [PubMed]
12. R. Thangaraj, S. Anandamurugan, P. Pandiyan and V. K. Kaliappan, “Artificial intelligence in tomato leaf disease detection: A comprehensive review and discussion,” Journal of Plant Diseases and Protection, vol. 129, no. 3, pp. 469–488, 2022. [Google Scholar]
13. M. Agarwal, S. K. Gupta and K. K. Biswas, “Development of efficient CNN model for tomato crop disease identification,” Sustainable Computing: Informatics and Systems, vol. 28, no. 45, pp. 100407–100417, 2020. [Google Scholar]
14. A. Kamilaris and F. X. Prenafeta, “Deep learning in agriculture: A survey,” Computers Electronics in Agriculture, vol. 47, no. 23, pp. 70–90, 2018. [Google Scholar]
15. N. Ullah, A. Javed, M. A. Ghazanfar, A. Alsufyani and S. Bourouis, “A novel DeepMaskNet model for face mask detection and masked facial recognition,” Journal of King Saud University-Computer and Information Sciences, vol. 12, no. 34, pp. 1234–1245, 2022. [Google Scholar]
16. N. Ullah, M. Marzougui, I. Ahmad and S. A. Chelloug, “DeepLungNet: An effective DL-based approach for lung disease classification using CRIs,” Electronics, vol. 12, no. 8, pp. 18160–18185, 2023. [Google Scholar]
17. W. Zhang, L. Deng, L. Zhang and D. Wu, “A survey on negative transfer,” IEEE/CAA Journal of Automatica Sinica, vol. 10, no. 2, pp. 251–305, 2022. [Google Scholar]
18. M. A. Haq, “CNN based automated weed detection system using UAV imagery,” Computer Systems Science and Engineering, vol. 42, no. 2, pp. 234–251, 2022. [Google Scholar]
19. M. A. Haq, G. Rahaman, P. Baral and A. Ghosh, “Deep learning based supervised image classification using UAV images for forest areas classification,” Journal of the Indian Society of Remote Sensing, vol. 49, no. 5, pp. 601–606, 2021. [Google Scholar]
20. V. L. Narla and G. Suresh, “Multiple feature-based tomato plant leaf disease classification using SVM classifier,” in Machine Learning, Image Processing, Network Security and Data Sciences, Singapore, Springer Nature Singapore, pp. 443–455, 2023. [Google Scholar]
21. S. M. Javidan, A. Banakar, K. A. Vakilian and Y. Ampatzidis, “Tomato leaf diseases classification using image processing and weighted ensemble learning,” Agronomy Journal, vol. 23, no. 5, pp. 234–252, 2023. [Google Scholar]
22. M. Bhagat and D. Kumar, “Efficient feature selection using BoWs and SURF method for leaf disease identification,” Multimedia Tools and Applications, vol. 34, no. 45, pp. 1–25, 2023. [Google Scholar]
23. S. Kaur, S. Pandey and S. Goel, “Plants disease identification and classification through leaf images: A survey,” Archives Computational Methods in Engineering, vol. 26, no. 34, pp. 507–530, 2019. [Google Scholar]
24. D. Hughes and M. Salathé, “An open access repository of images on plant health to enable the development of mobile disease diagnostics,” Computer Science, vol. 1511, no. 8060, pp. 145–176, 2015. [Google Scholar]
25. S. Sagar and J. Singh, “An experimental study of tomato viral leaf diseases detection using machine learning classification techniques,” Bulletin of Electrical Engineering and Informatics, vol. 12, no. 1, pp. 451–461, 2023. [Google Scholar]
26. A. Abbas, S. Jain, M. Gour and S. Vankudothu, “Tomato plant disease detection using transfer learning with C-GAN synthetic images,” Computures Electronics in Agriculture, vol. 187, no. 34, pp. 106279–106287, 2021. [Google Scholar]
27. O. Attallah, “Tomato leaf disease classification via compact convolutional neural networks with transfer learning and feature selection,” Horticulturae, vol. 9, no. 2, pp. 149, 2023. [Google Scholar]
28. A. Saeed, A. A. Abdel-Aziz, A. Mossad, M. A. Abdelhamid and A. Y. Alkhaled, “Smart detection of tomato leaf diseases using transfer learning-based convolutional neural networks,” Agriculture, vol. 13, no. 1, pp. 139–148, 2023. [Google Scholar]
29. S. Bensaadi and A. Louchene, “Low-cost convolutional neural network for tomato plant diseases classification,” IAES International Journal of Artificial Intelligence, vol. 12, no. 1, pp. 162–178, 2023. [Google Scholar]
30. P. Kaur, S. Harnal, V. Gautam, M. P. Singh and S. P. Singh, “An approach for characterization of infected area in tomato leaf disease based on deep learning and object detection technique,” Engineering Applications of Artificial Intelligence, vol. 115, no. 65, pp. 105210–105225, 2022. [Google Scholar]
31. M. Afify, M. Loey and A. Elsawy, “A robust intelligent system for detecting tomato crop diseases using deep learning,” International Journal of Software Science and Computational Intelligence (IJSSCI), vol. 14, no. 1, pp. 1–21, 2022. [Google Scholar]
32. N. Zhang, H. Wu, H. Zhu, Y. Deng and X. Han, “Tomato disease classification and identification method based on multimodal fusion deep learning,” Agriculture, vol. 12, no. 12, pp. 2014–2025, 2022. [Google Scholar]
33. F. N. Iandola, H. Song, W. Matthew, K. Moskewicz, W. Ashraf et al., “SqueezeNet: AlexNet-level accuracy with 50x fewer parameters and <0.5 MB model size,” arXiv:1602.07360, 2016. [Google Scholar]
34. H. Kaiming and S. Jian, “Convolutional neural networks at constrained time cost,” in CVPR, Boston, USA, pp. 5353–5360, 2015. [Google Scholar]
35. N. Ullah, J. A. Khan, S. Almakdi, M. S. Khan, M. Alshehri et al., “A novel CovidDetNet deep learning model for effective COVID-19 infection detection using chest radiograph images,” Applied Sciences, vol. 12, no. 12, pp. 6269–6291, 2022. [Google Scholar]
36. Dataset (Tomato leaf disease detection). [Online]. Available: https://www.kaggle.com/datasets/kaustubhb999/tomatoleaf (accessed on 02/01/2022) [Google Scholar]
37. H. Kaiming, Z. Xiangyu, R. Shaoqing and S. Jian, “Deep residual learning for image recognition,” in Proc. of the IEEE Conf. on Computer Vision and Pattern Recognition, Las Vegas, Nevada, pp. 770–778, 2016. [Google Scholar]
38. M. Sandler, A. Howard, M. Zhu, A. Zhmoginov and L. C. Chen, “MobileNetV2: Inverted residuals and linear bottlenecks,” in 2018 IEEE/CVF Conf. on Computer Vision and Pattern Recognition, Salt Lake City, UT, USA, IEEE, pp. 4510–4520, 2018. [Google Scholar]
39. X. Zhang, Z. Xinyu, L. Mengxiao and S. Jian, “ShuffleNet: An extremely efficient convolutional neural network for mobile devices,” in Proc. of the IEEE Conf. on Computer Vision and Pattern Recognition (CVPR), vol. 1707, no. 1083, pp. 6848–6856, 2017. [Google Scholar]
40. A. Krizhevsky, S. Ilya and E. H. Geoffrey, “ImageNet classification with deep convolutional neural networks,” Advances in Neural Information Processing Systems, vol. 987, no. 34, pp. 1123–1139, 2012. [Google Scholar]
41. C. Szegedy, L. Wei, J. Yangqing, S. Pierre, R. Scott et al., “Going deeper with convolutions,” in Proc. of the IEEE Conf. on Computer Vision and Pattern Recognition, vol. 65, no. 145, pp. 1–9, 2015. [Google Scholar]
42. J. Redmon, “Darknet: Open-Source Neural Networks in C,” [Online]. Available: https://pjreddie.com/darknet (accessed on 03/02/2023) [Google Scholar]
43. Dataset (Tumor Classification DatasAlif Rahman. [Online]. Available: https://www.kaggle.com/alifrahman/modiified (accessed on 08/07/2022) [Google Scholar]
44. S. Lingwal, K. K. Bhatia and M. Singh, “Deep convolutional neural network approach for tomato leaf disease classification,” Machine Learning, Image Processing, Network Security and Data Sciences, vol. 87, no. 34, pp. 199–208, 2023. [Google Scholar]
45. S. Bandyopadhyay, A. Sarkar, A. Paria and B. Jana, “Deep learning approaches for analysis and detection of tomato leaf diseases,” in Artificial Intelligence, Haldia, India, Springer, Cham, pp. 265–273, 2022. [Google Scholar]
46. I. Ecemis and H. İlhan, “The performance comparison of pre-trained networks with the proposed lightweight convolutional neural network for disease detection in tomato leaves,” Journal of the Faculty of Engineering and Architecture of Gazi University, vol. 38, no. 2, pp. 987–993, 2023. [Google Scholar]
47. S. G. Paul, A. A. Biswas, A. Saha, M. S. Zulfiker, N. A. Ritu et al., “A real-time application-based convolutional neural network approach for tomato leaf disease classification,” Array, vol. 3, no. 19, pp. 100313–100324, 2023. [Google Scholar]
48. D. Peng, W. Li, H. Zhao, G. Zhou and C. Cai, “Recognition of tomato leaf diseases based on DIMPCNET,” Agronomy, vol. 13, no. 7, pp. 1812–1824, 2023. [Google Scholar]
49. S. D. Khan, L. Alarabi and S. Basalamah, “Segmentation of farmlands in aerial images by deep learning framework with feature fusion and context aggregation modules,” Multimedia Tools and Applications, vol. 3, no. 45, pp. 1–20, 2023. [Google Scholar]
Cite This Article
 Copyright © 2023 The Author(s). Published by Tech Science Press.
This work is licensed under a Creative Commons Attribution 4.0 International License , which permits unrestricted use, distribution, and reproduction in any medium, provided the original work is properly cited.
 Downloads
 Citation Tools