
 Submit a Paper
 Propose a Special lssue
 Open Access
ARTICLE

Depression Intensity Classification from Tweets Using FastText Based Weighted Soft Voting Ensemble
1 Department of Artificial Intelligence, The Islamia University of Bahawalpur, Bahawalnagar, 63100, Pakistan
2 Department of Information Technology, Khwaja Fareed University of Engineering and IT, RYKhan, 64200, Pakistan
3 Department of Computer Science & Information Technology, The Islamia University of Bahawalpur, Bahawalnagar, 63100, Pakistan
4 Department of Signal Theory and Communications and Telematic Engineering, Unviersity of Valladolid, Paseo de Belén 15, Valladolid, 47011, Spain
5 Faculty of Social Science and Humanities, Universidad Europea del Atlántico Isabel Torres 21, Santander, 39011, Spain
6 Department of Project Management, Universidad Internacional Iberoamericana, Campeche, 24560, México
7 Fundación Universitaria Internacional de Colombia, Bogotá, 111611, Colombia
8 Universidad Internacional Iberoamericana, Arecibo, Puerto Rico, 00613, USA
9 Universidade Internacional do Cuanza, Cuito, 46703, Angola
10 Department of Information and Communication Engineering, Yeungnam University, Gyeongsan, 38541, South Korea
* Corresponding Author: Imran Ashraf. Email:
Computers, Materials & Continua 2024, 78(2), 2047-2066. https://doi.org/10.32604/cmc.2024.037347
Received 31 October 2022; Accepted 11 August 2023; Issue published 27 February 2024
 View Full Text
 Download PDF
Abstract
Predicting depression intensity from microblogs and social media posts has numerous benefits and applications, including predicting early psychological disorders and stress in individuals or the general public. A major challenge in predicting depression using social media posts is that the existing studies do not focus on predicting the intensity of depression in social media texts but rather only perform the binary classification of depression and moreover noisy data makes it difficult to predict the true depression in the social media text. This study intends to begin by collecting relevant Tweets and generating a corpus of 210000 public tweets using Twitter public application programming interfaces (APIs). A strategy is devised to filter out only depression-related tweets by creating a list of relevant hashtags to reduce noise in the corpus. Furthermore, an algorithm is developed to annotate the data into three depression classes: ‘Mild,’ ‘Moderate,’ and ‘Severe,’ based on International Classification of Diseases-10 (ICD-10) depression diagnostic criteria. Different baseline classifiers are applied to the annotated dataset to get a preliminary idea of classification performance on the corpus. Further FastText-based model is applied and fine-tuned with different preprocessing techniques and hyperparameter tuning to produce the tuned model, which significantly increases the depression classification performance to an 84% F1 score and 90% accuracy compared to baselines. Finally, a FastText-based weighted soft voting ensemble (WSVE) is proposed to boost the model’s performance by combining several other classifiers and assigning weights to individual models according to their individual performances. The proposed WSVE outperformed all baselines as well as FastText alone, with an F1 of 89%, 5% higher than FastText alone, and an accuracy of 93%, 3% higher than FastText alone. The proposed model better captures the contextual features of the relatively small sample class and aids in the detection of early depression intensity prediction from tweets with impactful performances.Keywords
Depression disorders are the leading cause of non-fatal health problems and a grave concern for public health. According to the fact sheet of the world health organization (WHO) published on January 30, 2020 [1], approximately 264 million people suffer from depression. It has been regarded as the second major cause of suicidal deaths among young people. More than 800,000 people die by suicide every year, which is an alarming and worrisome issue. People experiencing depression may feel a lack of interest in social activities and everyday tasks of life, which leads to several physical and mental problems like weight loss or gain, disturbed sleeping patterns, a lack of concentration, feelings of depravity and guilt, etc. [2]. In this context, the importance of an automatic approach for detecting depression and determining its severity is high. Regardless of the imbalanced training data, the proposed models generalize prediction. Early detection of depression symptoms, particularly the intensity of these symptoms, could help to prevent many suicide attempts and, as a result, deaths from depression [3].
The public data on social media is very helpful for getting insights into people’s physical and mental health. Even social media users do not know about their mental health but with data augmented by machine learning, early symptoms of mental health diseases can be detected and informed to concerned authorities to get timely treatment accordingly. Social media data has already been used for several similar tasks. For example, the early warning symptoms of cancer have been successfully detected from web search logs and other online activities [4]. Moreover, different mental health diseases, such as depression and post-traumatic stress disorder (PTSD) have been detected in recent studies from social media texts [5,6]. Methods for depression classification can have a significant impact on the health of the general public and individuals, as well as greatly assist governments in creating and maintaining healthy societies.
Another important problem regarding depression patients is that people do not self-report their depression conditions. On the contrary, depression detection is a very difficult task unless the patients self-report their symptoms. Furthermore, people are highly expressive about their depression or depressive thoughts, such as loneliness and tiredness, on social media platforms such as Twitter and Facebook [7]. Studies have provided evidence that the young generation is more likely to express their suicidal thoughts on social media than to doctors or family members [8]. Despite the available approaches and systems, their predominant use is for depression detection or classification without giving importance to more serious concerns, i.e., the severity of depression.
Keeping in view such repercussions, the primary intention of this study is to devise a model that can predict the intensity of depression using short text such as Tweets or other social media comments. The majority of work has already been done by classifying texts into depressive and non-depressive, but little has been done regarding the intensity of depression. This work can help the government or medical enterprises detect the mental conditions of the general public and take timely preventive actions to ensure a healthy society and their mental well-being, which further helps to devise different macro-level measures for the betterment of mental health for the general public.
This study proposes a method for determining the severity of depression using Tweets data that incorporates a FastText-based model. Also, to get better performance, it is suggested that FastText be used with other traditional models as part of an ensemble. To the best of our knowledge, FastText-based ensemble approaches have been used very rarely, so this study also aims to dig out the performance of the FastText-based ensemble model for depression intensity prediction. The key contributions of this research are as follows:
• A large dataset regarding depression-related Tweets is built by scraping Twitter. The corpus is extracted for this purpose by using various hashtags that are most relevant to depression. This study further uses the quantitative subjectivity score of each tweet, to filter out tweets that are more subjective and may have direct user thoughts and feelings.
• An algorithm is devised to annotate the data into three degrees of depression intensity: “mild depression,” “moderate depression,” and “severe depression.” The efficacy of the annotation algorithm is investigated by comparing its performance with manual annotation.
• The FastText classification algorithm is used on the annotated data to seek the best possible model settings for the best performance. Successfully obtained an F1 score of 0.84 which is far better than the other individual models in the study.
• A weighted soft voting ensemble is suggested as a way to improve FastText’s performance even more. This ensemble gets a much better performance.
This study aids in determining the severity of depression in tweets, and if some social media user has high-severity depression posts associated with a longer period of time, he or she may be advised to see a doctor.
The rest of the paper is organized into four sections. Section 2 discusses several important and contemporary research works related to this study. The proposed method and its related steps of Twitter corpus construction, annotating tweets into three depression label classes, data preprocessing, stratified splitting, and the proposed model are discussed in Section 3. Results are presented in Section 4 while this study is concluded in Section 5.
In this section, this paper review the latest research regarding depression detection using social media texts which is helpful to find research gaps in the existing literature and contemporary state-of-the-art.
There have been various recent studies regarding depression analysis using Twitter data. For example, using Twitter APIs, the depression-related tweets were collected and filtered to reduce noise by dividing Twitter users who posted these tweets into “diagnosed” vs. “control” [9]. With the help of the geolocation field in tweet data, authors separated tweets with respect to the origin country keeping the diagnosed vs. control tweets separated for each country. They applied different existing machine learning and deep learning models to the dataset to compare the results. Results show that bi long short-term memory (BiLSTM-SELFA) gives better performance and obtains up to 68% F1 score for the binary classification task. The study also analyzed the relationship between events like Christmas and COVID-19 with depression.
In another study [10], depression-related tweets were collected during the COVID pandemic in an automatic way to get depression insights. The research mainly developed a depression classification model using transformer-based algorithms to monitor the population level depression level during the different phases of the COVID pandemic. A tweet classifier was also proposed to predict the distress level of tweets. To deal with the imbalanced data, the under-sampling method was used. For the identification of depression in relation to emotions such as betrayed, frustration, hopelessness, and loneliness, Farruque [11] proposed an approach. Similarly, multi-class and multi-label emotion analysis of Arabic tweets is conducted in [12] using machine and deep learning techniques. BiLSTM with pre-trained word embedding performed better as compared to other machine learning algorithms such as support vector machine and random forests, etc. In addition, tweets related to depression are added to the dataset. Rank support vector machine (SVM) and LSTM with the bag of words and word embedding are used to obtain classification results. A demographic cohort-based depression study was conducted by [13] in which authors emphasize cohort-based depression analysis regarding a specific county or region in the US. Different models are applied to detect depression and PTSD.
In [14], the authors proposed a study to identify the impact of social media usage on the mental health of students. The study used data from 709 university students and proved that students who tend to use social media have more chance of mental health problems. To find different health disorders, specifically depression, qualitative analysis was performed in [15]. For data annotation, coding schemes of six resources were developed based on symptoms of depression and psychosocial stress provided by different research articles. Studies [16,17] used Latent Dirichlet Allocation (LDA) to find depression among students. A large dataset of Tweets is used for experiments using the newly proposed approach called auto-aggressive integrated moving average (ARIMA). Different depression and suicide-related trends and their corresponding deviations are identified. To identify suicidal thoughts using Twitter data, a suicide artificial intelligence prediction heuristic (SAIPH) was proposed in [18]. Using neural networks the authors constructed different binary classification models for different use cases such as stress, insomnia, anxiety, loneliness, etc.
Reddit is a famous social media platform for obtaining public insights [19] and has been used in several studies. For example, a depression classification model was proposed using Reddit posts in [20]. The collected data are classified into 4 classes which are anxiety, depression, bipolar disorder, and attention deficit hyperactivity disorder (ADHD). Co-training unsupervised models are used along with random forest (RF), SVM, and Naïve Bayes (NB) where the co-training model shows better performance. Similarly, LDA and Bigram features are used to identify users with depression from Reddit posts in [17]. LDA features are fed into a multi-layer neural network for classification. Performance appraisal with linear regression (LR), SVM, Adaboost, and RF shows that the neural network outperforms with 91% accuracy and 0.93% F1 score.
A framework for early detection of depression was proposed [21]. The study utilizes a convolutional neural network (CNN) based model and early risk detection error (ERDE) is used for finding drawbacks of the model. Experiments show promising results. In a similar fashion, the study [19] performed an analysis of Reddit posts for finding suicidal thoughts in Singapore-originated users. Besides classification, topic modeling is performed using LDA to investigate the most discussed topics among such users.
A relatively different approach to depression classification of social media users was presented in [22] which uses data from their corresponding community such as friends and followers. The data for 749 people is collected using a web-based survey and accessing their Instagram profiles using the clinically approved patient health questionnaire-8 (PHQ-8) standard. The authors used different linguistics features extracted from Instagram comments such as sentiment analysis and other meta-features, i.e., number of likes and comments length, etc. The authors train a variant of the LR model for this purpose. Two combinations achieved 0.71 and 0.72 area under the curve (AUC) results. Only user-generated data gives a poor performance of 0.63 AUC.
The use of text and image features for depression classification is done in [23]. The Instagram social media platform is used for collecting images, text, and posting behavior of the users. Three sets of features are extracted from image, text, and posting behavior, and fed to a deep learning model. Text features are extracted using Word2Vec while image features use a pre-trained convolution network. Results show that the proposed model obtains an 82.3% F1 score.
SVM-based machine learning model was proposed with multi-kernel SVM for the prediction of depressed vs. non-depressed people in [24]. The data is collected from Twitter-like Chinese microblogging platform, Sina Weibo which is one of the biggest microblogging social media platforms in China. Several features were used for classification such as the text of the microblog, the profile of the user, and the behavior of the user, etc. Further, the authors also considered the emotional feature from the collected dataset and calculated the frequency of different emotions within the data. The proposed model shows an error reduction of 16.55% which is much better than existing models. Another similar study using Weibo data is [25], which involves two different language processing systems. The extraction process involves those tweets having “I am diagnosed with depression” sentences, which they called self-reported tweets. Textual as well as non-textual features like age, user profile, color, followers, etc. are taken into account for experiments. Using an equal number of depressed and not depressed tweets, the deep neural network obtains a 78.5% F1 measure.
Depression intensity classification of tweets using small transformer-based language modes has also been proposed using the same dataset used in this study [26]. This study made a detailed analysis of the classification performance of language models having less than 15 million tunable parameters including Distilbert which is having 67 million parameters and concluded the best-performing model in terms of F1 as well as efficient training time.
In the upcoming sections, this article proposes an approach for depression intensity classification in the Tweets by employing different models including FastText and their soft voting ensemble. Fig. 1 shows the architecture of the proposed approach. As the first step, corpus construction of depression-related Tweets is carried out. Afterward, a novel algorithm is devised for data annotation and its performance is compared with the manual annotation. It is followed by the use of the FastText classification model for training and testing. Later, the weighted soft voting ensemble is proposed which outperforms all other individual models used in the study, i.e., NB, decision tree (DT), LR, and FastText. The performance is evaluated in terms of accuracy and F1 score.
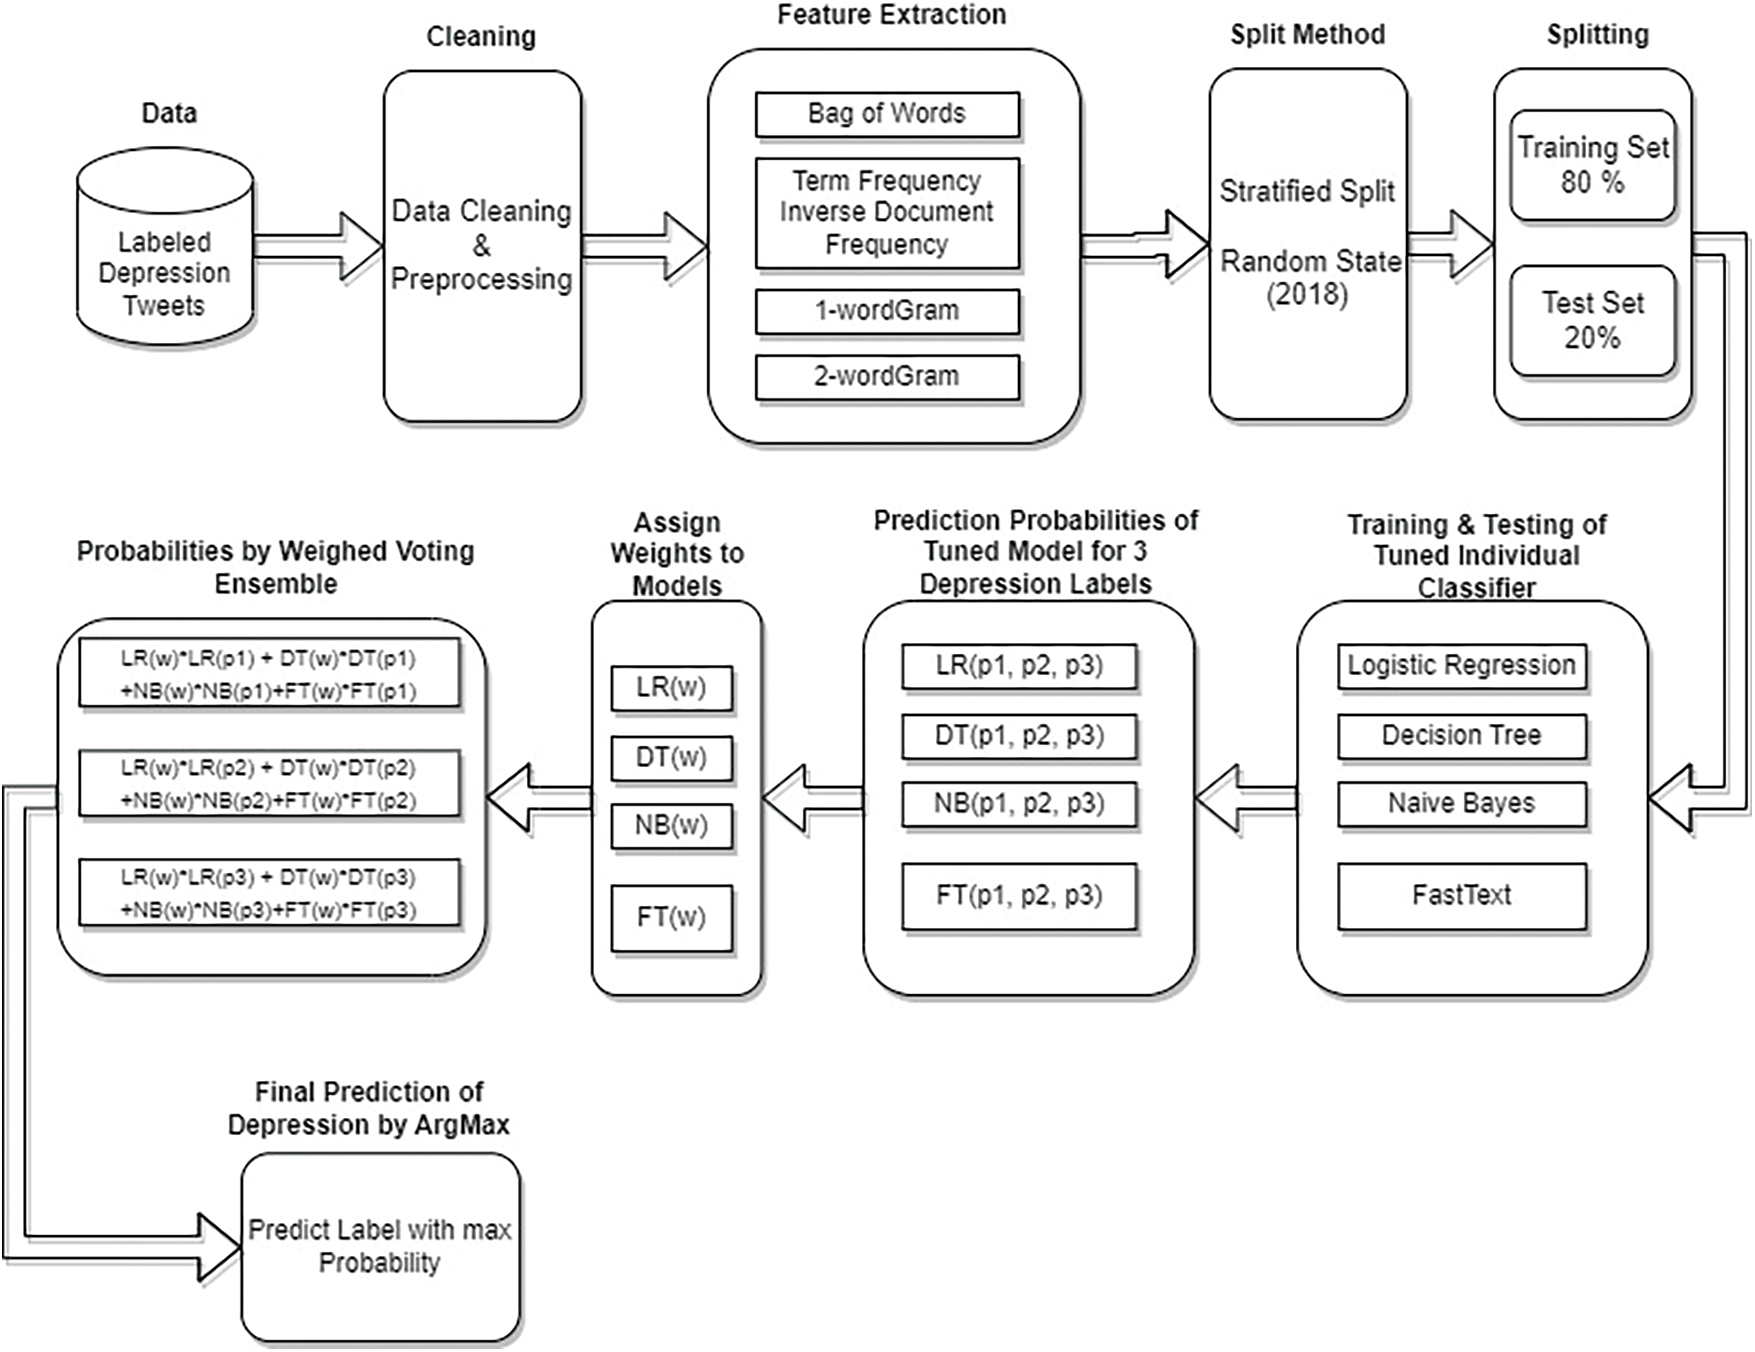
Figure 1: Overall workflow of depression intensity prediction of tweets using proposed FastText-based WSVE
As stated above, labeled data is needed for three depression intensity classes, i.e., ‘Mild’, ‘Moderate’, and ‘Severe’ according to ICD-10 depression diagnostic criteria which represent the intensity of depression in a short text [27]. ICD-10 depression diagnostic standard divided depression into three categories as mentioned above [28,29]. Although several social media platforms have been used for depression analysis in the past like Twitter, Reddit, Wiebo, etc. This study selects Twitter for two basic reasons. First, a predominantly large number of studies have used Twitter for data extraction and analysis for depression analysis. Twitter and Reddit have been the most famous platforms for depression-related machine learning and natural language processing (NLP) problems [30] as compared to the other social media platforms. Second, the number of users on the Twitter platform is high when it comes to social media platforms that use the English language. Consequently, this study used Twitter to collect data related to depression and extracted 210619 tweets in total.
Twitter is a widely used social media for sharing public posts and views. With respect to the use of Twitter data in existing studies, the general consensus is that since tweets are shared publicly on Twitter, they can be used for research [31,32]. The process of corpus construction from Twitter is illustrated in Fig. 2.
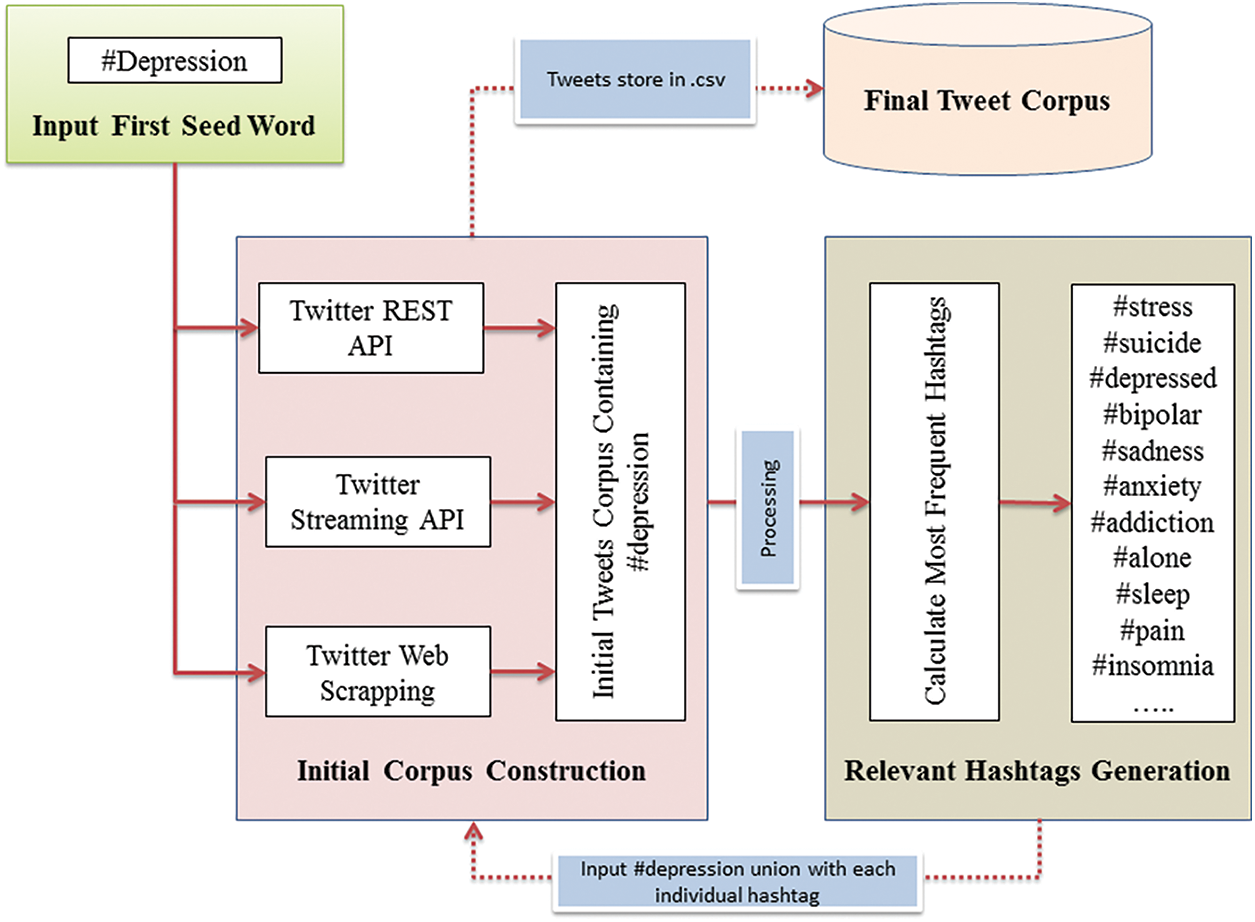
Figure 2: The process of corpus construction of depression-related tweets
The Twitter API is the interface designed to access Twitter’s public stream of data and all Twitter services which are not only used in desktop, mobile, and web applications to make them Twitter clients but also used to extract research data for different purposes. Twitter uses JavaScript object notation (JSON) format for sending and receiving results from API. Three methods were used to collect tweets filtered through the selected hashtags, i.e., Twitter search API, Twitter streaming API, and data scrapping.
The Twitter search API is the most widely used API and involves extracting Twitter’s data through a search or username. It provides access to a data set that already exists and has been entered by the Twitter community. With the help of the search API, users can request tweets that match specific ‘search’ criteria. The criteria can be keywords, usernames, geo-locations, places, etc. Unlike Twitter’s search API which performs extraction of data from tweets that have been posted, Twitter’s streaming API is a push of data as tweets happen in near real-time. With Twitter’s streaming API, clients can register a set of criteria like keywords, usernames, locations, named places, etc., and as tweets match the criteria, they are pushed directly to the client. It is like an agreement between the end user/client and Twitter and whenever Twitter receives tweets that match keywords relating to that criteria, a tweet is directly delivered to the intended user. The major drawback of the streaming API is that it provides only a sample of tweets that are generated by public Twitter users. The actual percentage of total tweets a client can receive with Twitter’s streaming API depends heavily on the criteria of the user’s request query and the current traffic. It is estimated that using Twitter’s streaming API users can expect to receive anywhere from 1 percent of the tweets to over 40 percent of tweets in near real-time. Web scraping has been used to extract specific data from the raw and unstructured hypertext markup language/cascading style sheets (HTML/CSS) web pages [33,34]. Web scrapping techniques provide the capability of automatic extraction of data from websites. Manual scraping is a time-consuming process so using software and APIs is advantageous as they automate the scraping process.
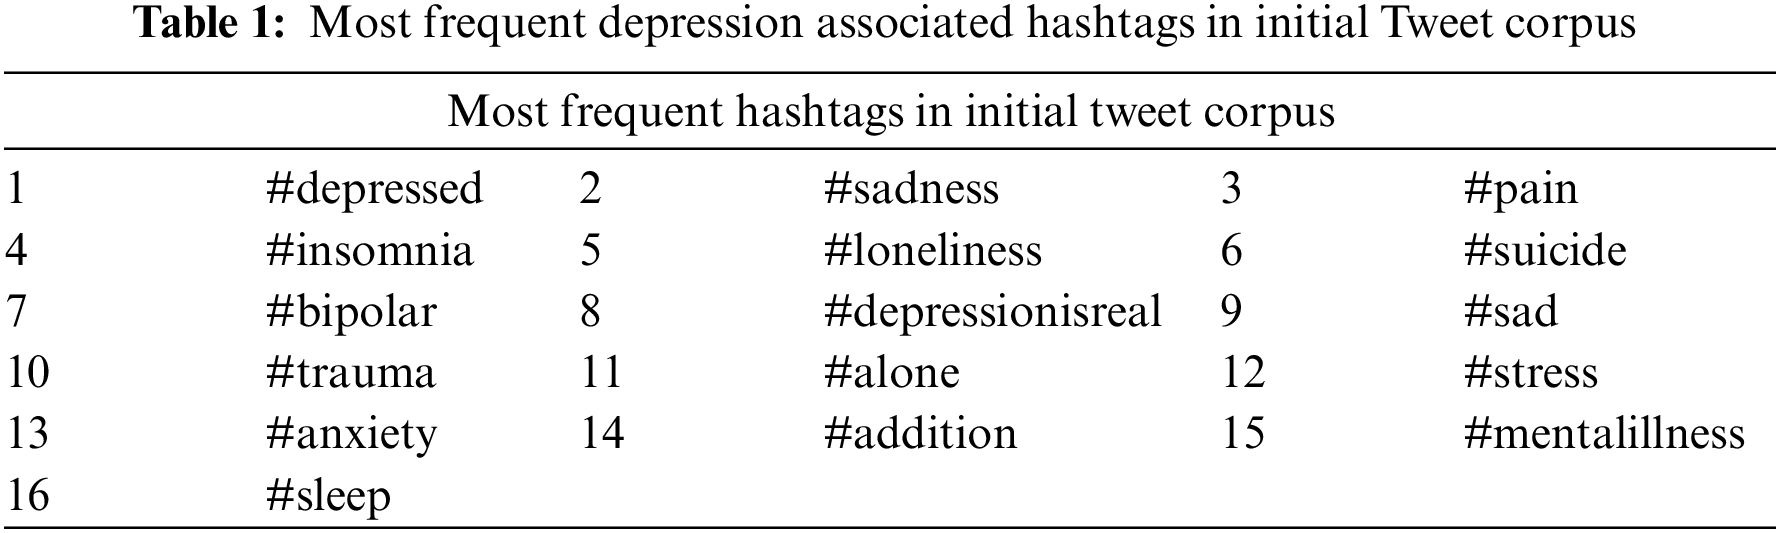
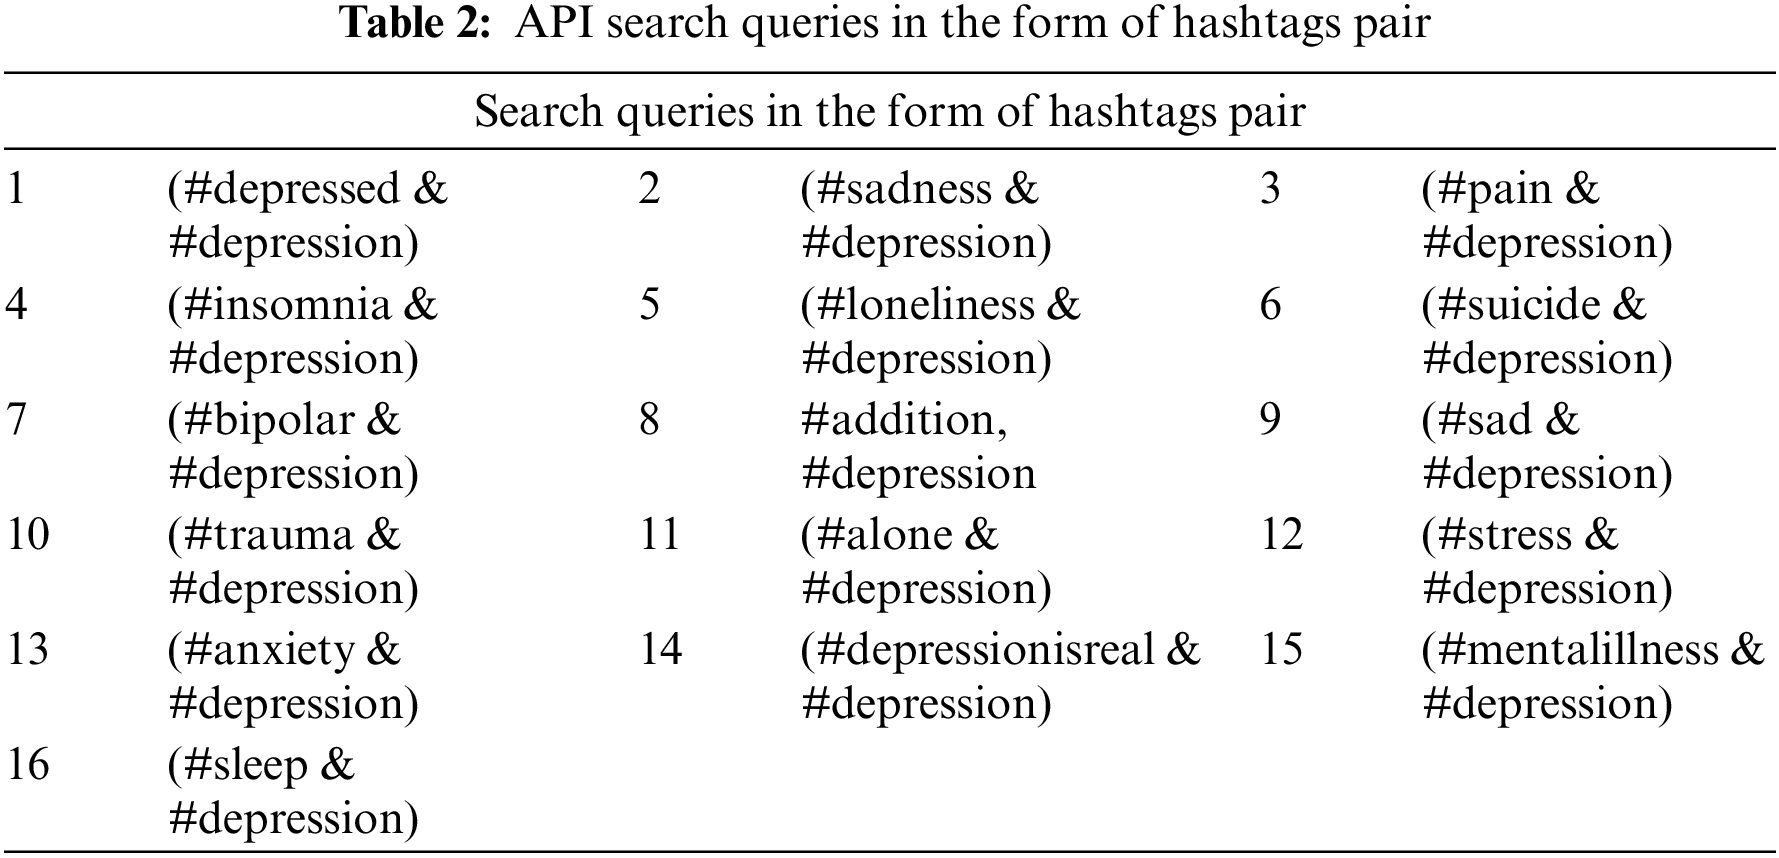
In this research, initially, tweets were collected using the #depression tag using Twitter public API as well as scrapping. Thereafter from the initially collected tweet corpus based on hashtag #depression only, the list of most frequently used hashtags such as #sadness, #insomnia, #suicide, etc., as mentioned in Table 1, were extracted excluding the seed hashtags #depression. Further, this research uses this list of frequent hashtags to complete the corpus in such a way by adding each hashtag in conjunction with #depression to the Twitter API so that only relevant tweets are collected. These words are used as seed words to collect more relevant tweets by putting them in the form of the search query with the AND operator and using public Twitter APIs and web scraping techniques to get the final tweet dataset of around 221,000 tweets. The “AND” query is used to make sure all tweets contain pair of hashtags as mentioned in Table 2.
As the study [35] indicated many tweets with depression-related keywords do not indicate actual depression. Therefore extracting such tweets which contain actual depressive text is not a straightforward task. To cope with this problem and annotation purpose, a quantitative subjectivity score is used which indicates how subjective a text is. Further, this research filter and remove such tweets which have lower subjectivity scores, as shown in Table 3.
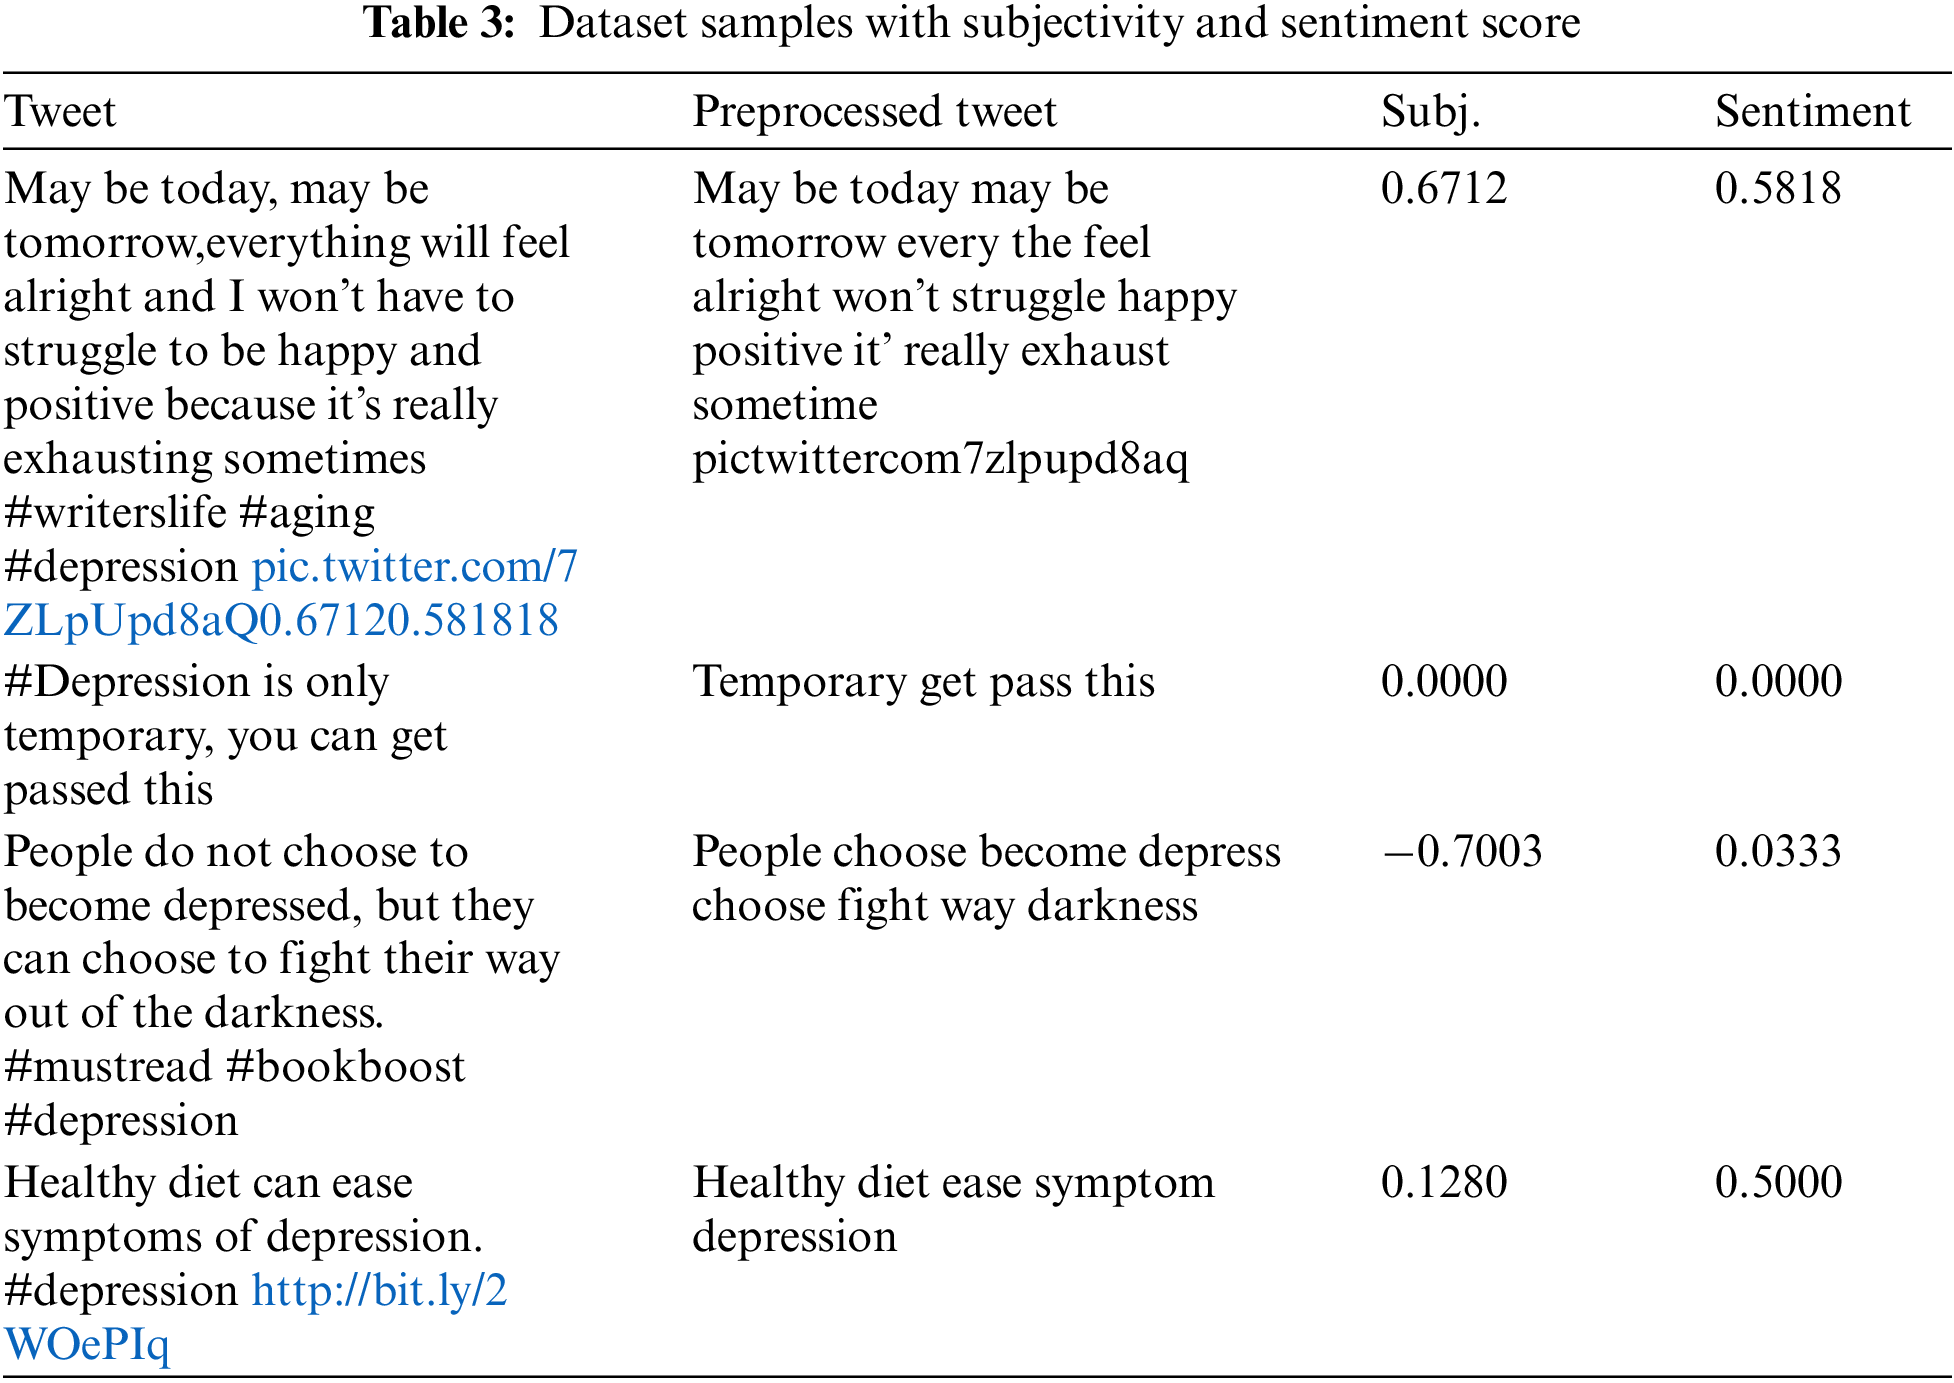
For improving the classification performance, experiments are performed by calculating quantitative subjectivity and objectivity of all tweets in a dataset as this paper focuses on the text which contains only subjective data which certainly represents words or phrases of depression condition. As subjective data is fact-based, it does not actually intend to have the actual depressive expression of social media users.
Previous studies conclude that Twitter users who have depression, tend to show negative sentiments in their tweets [36]. In this research, the calculation of the sentiment of each tweet within a filtered corpus has been done using the Python library valence aware dictionary and sentiment reasoner (VADER). Sample tweets are shown in Table 3 along with their subjectivity and sentiment.
The calculated quantitative sentiment is in the range of −1 to 1. Here, −1 refers to the maximum negative sentiment and +1 indicates the maximum positive sentiment. Although +1 and −1 scores rarely occur, the score always lies between −1 and +1. After that for the sake of annotating our corpus with three classes i.e., Mild Depression, Moderation Depression, and Severe Depression as indicated in the ICD-10 depression diagnostic criteria, the dataset is divided into three categories with respect to their corresponding sentiments as described in the following equations:
In Eq. (1),
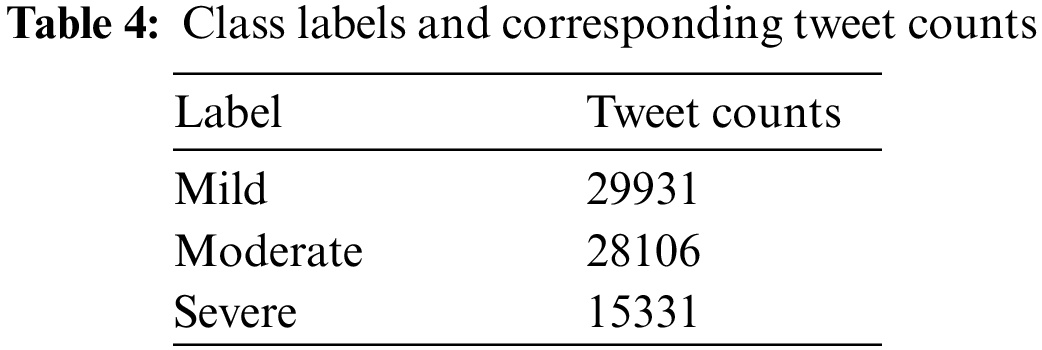
Eq. (3) of annotation is derived after several experiments of dividing the dataset into three classes with respect to different sentiment score ranges and checking the classification performance using baseline algorithms such as NB, etc. Finally, data is annotated as Mild for polarity less than −0.1, Moderate for polarity between −0.1 to +0.3 (inclusive), and Severe for polarity greater than +0.3. After annotating the data, the counting of tweets with respect to class labels can be seen in Table 4.
3.3 Data Cleaning and Preprocessing
Preprocessing of data is an important task before applying any classification algorithms. During the preprocessing, noise is removed which refers to unnecessary or redundant data. Such data comes as characters, symbols, and numeric data which do not contribute to the prediction of the target class. Often, removing such symbols and characters tends to show better performance as it improves the learning process of models. For example, hashtag removal in the preprocessing phase has been shown to be advantageous for the classification task. The preprocessing steps carried out in this research are shown in Fig. 3. Further tweets having null in the data frame were removed from the corpus as well to avoid the null value error during the training phase.
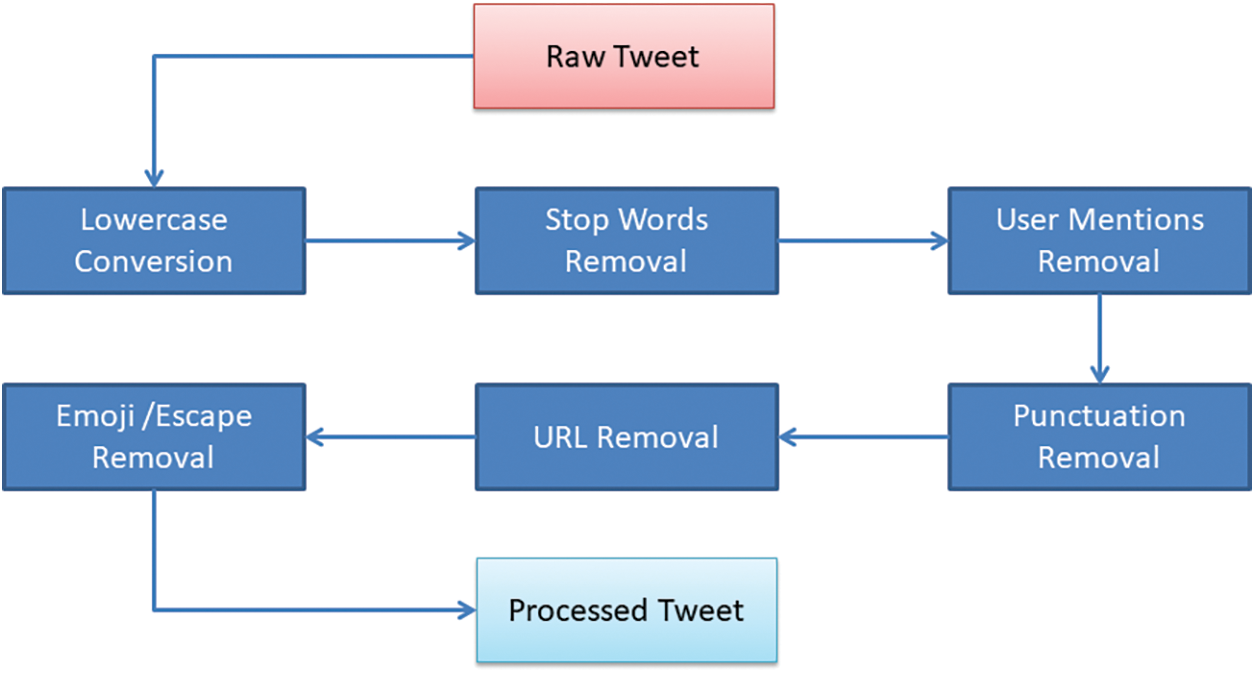
Figure 3: Preprocessing steps followed in this study
In this step, the corpus is split into training and test sets based on stratified sampling. For splitting in Python, the Sklearn library is used and its ‘train_test_split’ function supports the splitting of data in a stratified fashion. Stratified splitting ensures that training and test datasets both contain the same percentage of data according to multiple label classes which ensures model evaluation results are reliable enough. This paper split the annotated tweets into two parts, i.e., 80% of training data and 20% of test data.
In this section, this paper presents the comparison of the FastText fine-tuned model with baseline models regarding prediction accuracy and recall score. Data is split using stratified sampling into train and test sets comprise of 80 percent and 20 percent, respectively. Further FastText-based weighted soft voting ensemble is proposed which outperformed all other individual modes used in the study. This paper trains the baseline models, i.e., NB, LR, and DT using the bag of words (BoW) and term frequency-inverse document frequency (TF-IDF) features to check the comparative baseline accuracy, precision, recall, and F1 scores. Before generating the text features, the data is preprocessed which includes lowercase text, removing user mentions, removing hashtags, removing web links, and removing default English stop words supported by the Python SKlearn library and its corresponding modules. The performance of NB, LR, and DT is observed using BoW. In the upcoming subsections, this article elaborates in detail on each model architecture used for the experimentation of depression classification from labeled tweets. The performance measures used in the study are precision, recall, accuracy, and F1 which can be calculated by the help confusion matrix of each model.
3.5.1 FastText Depression Intensity Classification
The architecture of FastText depression intensity prediction is given in Fig. 4. The first step is the word-N-gram generation for each tweet in the corpus and corresponding word-N-gram vectors wi are generated against each tweet. The total number of word-N-grams in the tweet is denoted by n. The next task is to generate document vector Di which is achieved by averaging all word-N-gram d1...N vectors where N is the total number of document vectors. Each tweet is represented by the document vector to be further fed into the next hidden layer. The document vector layer is connected to a hidden layer with a set of weights also known as weight matrix H. Document d is further multiplied with the weight matrix H which produces the classification vector c.

Figure 4: Depression intensity prediction using FastText
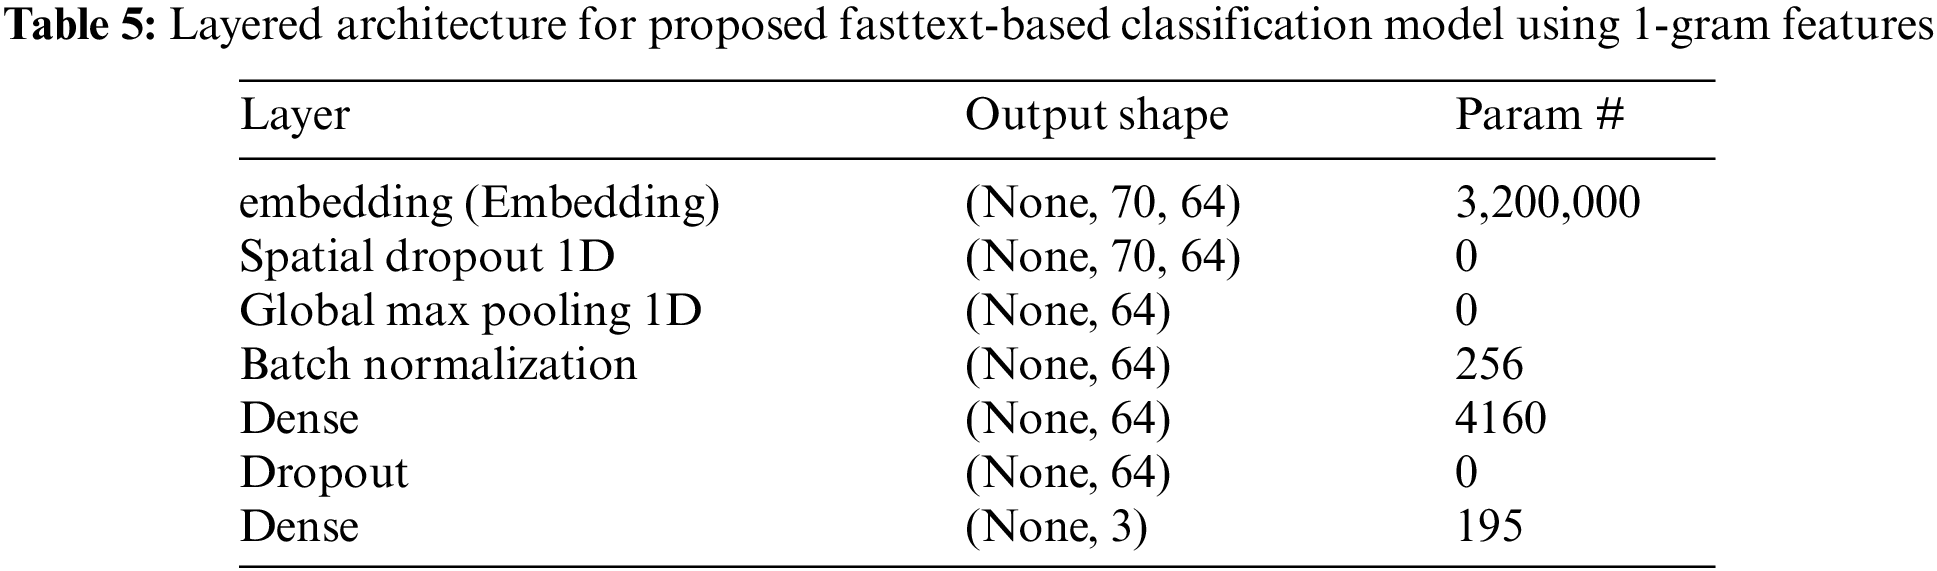
Instead of a single hidden layer, this research also adds some regularization layers in the model to avoid early over-fitting and improve performance in terms of accuracy and F1 score. In the model, tweets in the form of a document vector feed into a spatial dropout layer of 64 nodes which further connects with the max pooling layer to reduce the features from the previous layer. Later batch normalization layer added with subsequent dense and simple dropout layer. In the end, the class is estimated using the loss function Softmax layer of 3 nodes which is probability distribution against defined class labels. The softmax function can be mathematically represented by an equation where
The word embedding uses in the FastText is quite different than other conventional word embedding techniques such as word2vec which uses each individual valid word for corpus construction but FastText considers words to have consisted of N-gram characters and
NB is a supervised classification algorithm based on Bayes’ theorem which operates on the class variable
One popular probabilistic classifier for this purpose is the Multinomial Naive Bayes classifier. Scikit-learn’s default settings for this experiment are as follows: alpha = 1.0; fit_prior = True; class_prior = None; normalize = False. The alpha parameter acts as a smoothing factor to eliminate the possibility of zero probabilities, and the fit_prior parameter specifies whether class prior probabilities are to be learned or a uniform prior is to be used. Class priors are adjusted based on the data if class_prior is not supplied. At last, we have the normalized argument, which is a boolean value indicating whether or not the feature vectors should be normalized.
Although NB works on quite a simple assumption of independent features, it performed very well in many real-time scenarios, particularly in the case of text classification problems [37,38]. Moreover, it is computationally inexpensive compared to other advanced classification algorithms.
LR models data using the sigmoid function which maps the predicted outputs to calculated probabilities. Linear regression assumes a linear relationship between the target variable
Here
The algorithm predicts the
DT classifiers are non-parametric supervised learning methods for classification and regression. Scikit-learn’s default parameters are criterion = ‘gini’, splitter = ‘best’, max_depth = None, min_samples_split = 2, min_samples_leaf = 1, min_weight_fraction_leaf = 0.0, max_features = None, random_state = None, max_leaf_nodes = None, and min_impurity_decrease = 0.0. The splitter parameter chooses the split at each node, whereas the criterion parameter measures split quality. The max_depth option controls the tree depth, while the min_samples_split and min_samples_leaf parameters set the minimum number of samples needed to split an internal node and become a leaf node, respectively. Max_features controls the number of features to examine while finding the optimal split, while random_state seeds the random number generator. Finally, the max_leaf_nodes and min_impurity_decrease parameters control leaf nodes and early halting, respectively.
3.6 Proposed Weighted Soft Voting Ensemble for Depression Intensity Classification
It is normally challenging to get higher accuracy from machine learning algorithms for prediction purposes. With the help of the soft voting method and by combining different baseline machine learning models, this article can achieve state-of-the-art classification performance. This study proposes a FastText-based weighted soft voting ensemble by combining four individual models. WSVE is especially useful when an individual machine learning algorithm does not give that much good performance which, this study may have by combining all of them with some strategy of giving weights to individual algorithms [42,43]. WSVE certainly helps to improve the F1 score and cover textual context better than the individual FastText. Moreover, the proposed model is trained very quickly as compared to current deep learning models for text classification.
First of all, this study calculates the prediction probabilities of each individual classification model used in soft voting, done in the previous section. Further, this study needs to decide what weight it has to give to each individual classification model in the voting process. Weight can be assigned in an equal proportion where all the individual classifiers have the same weight or in different proportions where all individual classifiers have different weights. For soft voting, four algorithms were combined i.e., NB, Decision Tree, Logistic Regression, and FastText. In order to give relative importance in the form of weights to each model this paper seeks to assess the performance of individual models in terms of accuracy and F1. FastText performed best among the individual models. The performance of each model is analyzed, so according to those, FastText is given the highest weight, LR the second highest weight, while the rest of the models have low weight.
The prediction probabilities of each individual algorithm for each class are then multiplied by their corresponding weights and added to get the single probability for the label class. Suppose LR (p1, p2, p3) is the prediction probabilities of three depression-related classes where p1, p2, and p3 describe the probabilities of Mild, Moderate, and Severe respectively. LR (w) is the weight assigned to LR as per its individual performance [44]. In the same way, this paper has DT, LG, and FT prediction probabilities and corresponding weights as per their individual performances. The high weight scores were assigned to LR, i.e., 35%, and FT, i.e., 35%, and low weight scores were assigned to DT, i.e., 15%, and NB, i.e., 15%. The total of all weights must be equal to the sum of 100. The final probabilities by WSVE can be calculated as described in Eqs. (8)–(10). Further p1, p2, and p3 describe the final probabilities by WSVE. Amongst the three final probabilities, using Argmax the label with the highest probability will be selected as model prediction by the proposed voting ensemble classifier WSVE explained in Fig. 1 which represents the overall workflow of this research.
In this section, this article first analyzes the performance of FastText alone and then the contribution of FastText in our proposed weighted soft voting model to increase the overall performance.
As the name indicates, FastText trains very fast without compromising the performance of the model [38]. The FastText model overcomes the simplification of the BoW model by considering the bag of N-grams which also gives contextual information. Experiments are carried out using the same training and test as used by the other models in this study. The labels in the dataset were also converted to one-hot encoding to be compatible with FastText to further train the model.
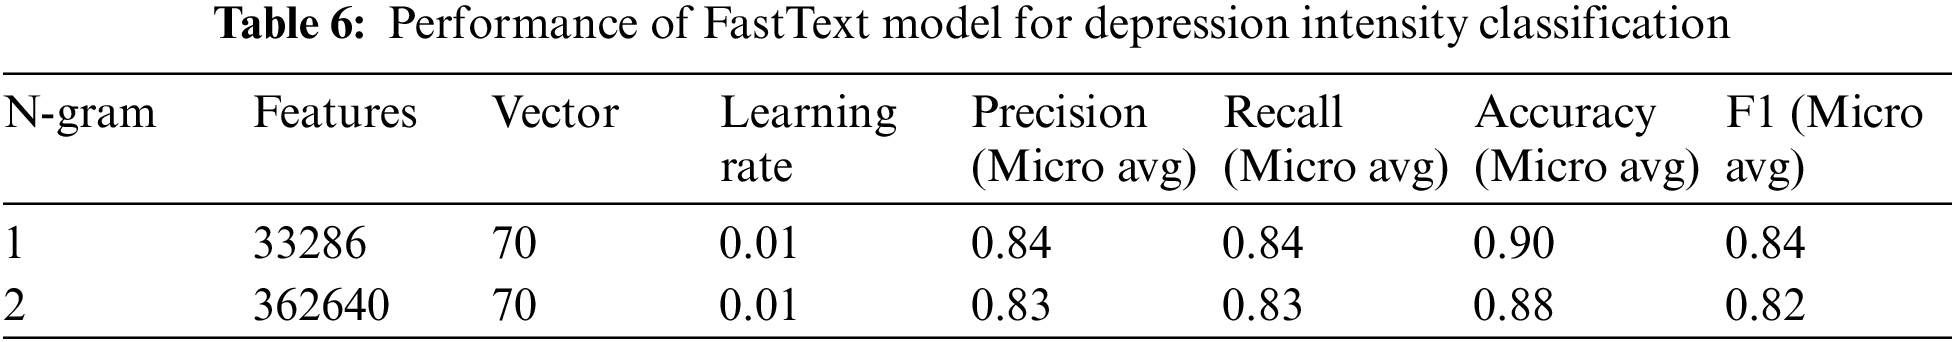
Performance of the FastText model is observed using both bi-wordGram and uni-wordGram. The uni-wordGram features in the training data are 33286, but bi-wordGram features increase the features to 362640 which also increases the training time. The learning rate of 0.01 and a word vector with a dimension of 70 is used. This article particularly targets the word N-grams and epochs by taking the other parameter values as default in combination with different preprocessing parameters such as stop words removal, hashtags removal, web links removal, and punctuation removal. It is evident from experiments that the FastText model over-fits early when used with the bi-wordGram feature and validation loss stops decreasing before the 3rd epoch of training but the model with uni-wordGram starts to overfit after the 4th epoch as well as decreases the validation loss up to 4th epoch. The second approach gives the best result in terms of accuracy and F1.
FastText gives good results with a maximum 0.84 F1 score which is much better than the performance of other individual models. Table 6 shows the results of depression intensity classification using the FastText algorithm by setting a combination of different hyperparameters techniques. The word N-gram setting has opted to be 1 or 2 and it has been evident from the results that a word N-gram value of 1 has performed better compared to a word N-gram of 2.
4.2 Performance of Proposed FastText Based WSVE Ensemble
WSVE is a combination of four algorithms that is FastText, NB, DT, and LR. The performance of baseline models for the multi-class depression classification on the labeled tweets can be seen in Table 7.
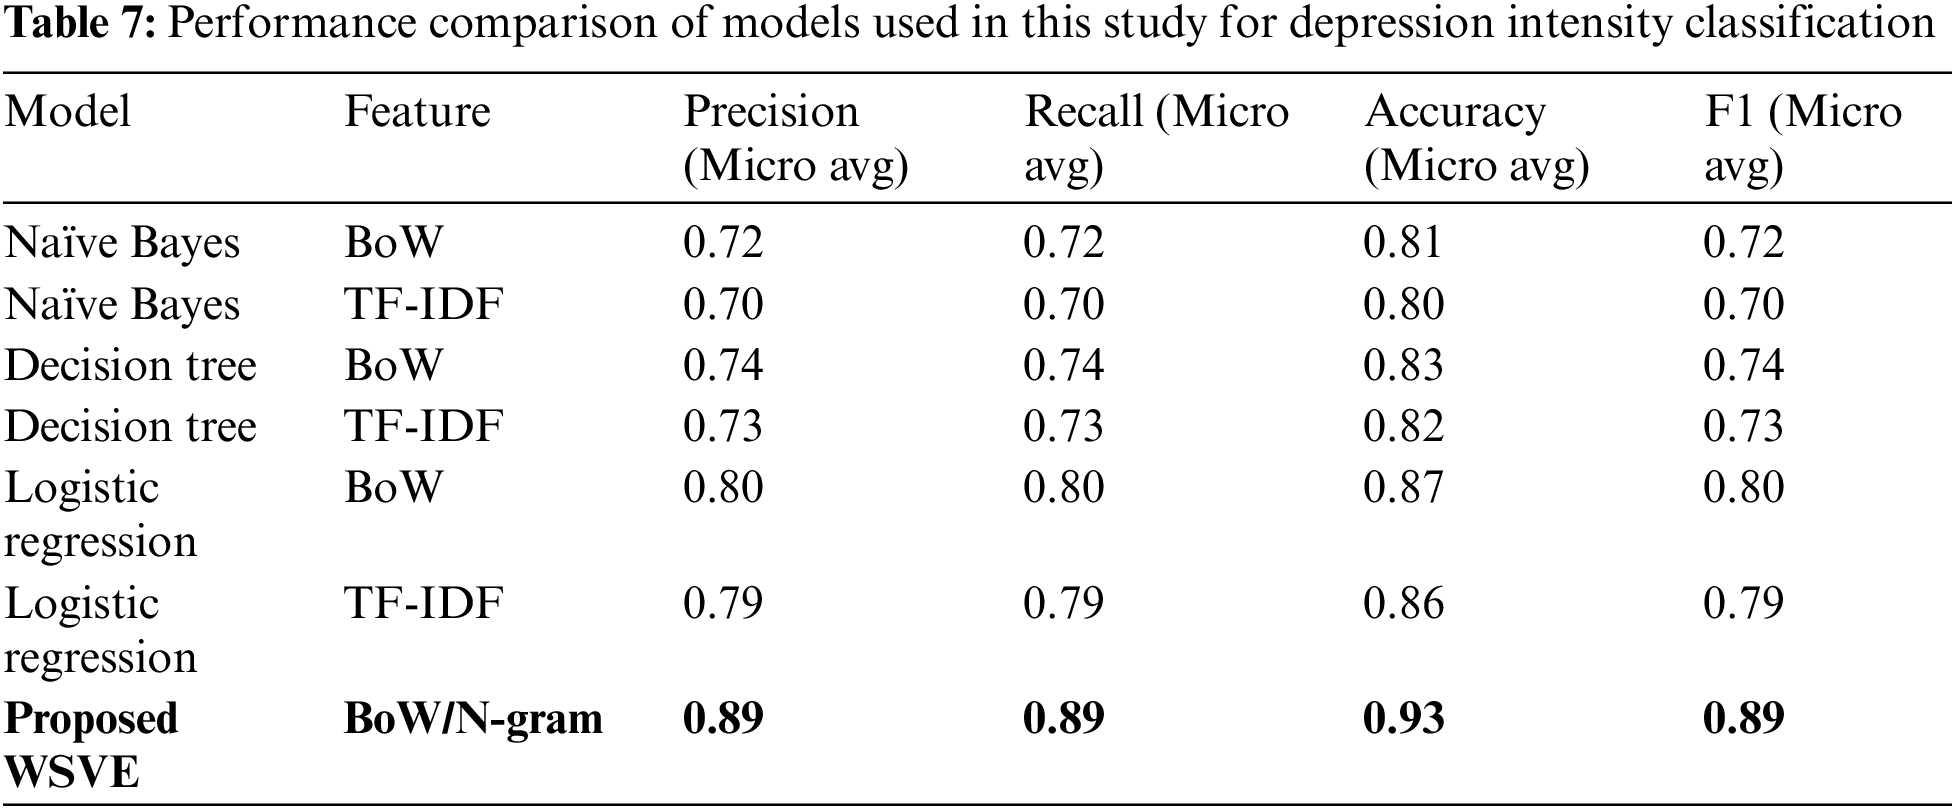
NB, LR, and DT were trained by BoW as well as TF-IDF but as evidenced by the results all three models performed well on BoW features. So in the proposed ensemble, this paper only includes individual models trained with BoW features. LR performs best in terms of F1 score among the three baseline algorithms previously discussed. Further FastText models give better performance using 1-wordGram features and 2-wordGram adds meaningless vocabulary in the feature set. FastText with 1-wordGram features is added as the fourth individual model. Our proposed FastText-based ensemble WSVE better generalizes the model prediction and gives much better performance, i.e., F1 and accuracy score of 89% and 93%, respectively. WSVE increases the accuracy of FastText alone by 3 percent and F1 by 5 percent which is a great improvement in FastText for text classification in general and depression intensity prediction specifically. It is clear by comparing the confusion matrix of WSVE in Fig. 5 and other individual models that, WSVE better captures the contextual features of the relatively low sample class “Severe” and contributed to improve the depression classification performance. To validate the performance of the proposed model, 5-fold stratified cross-validation is performed. Each fold contains four folds for training data and one fold for testing in a random fashion to maintain the class weightage in the test and training sets. The average score of 5-fold cross-validation maintains the same accuracy and F1 score.

Figure 5: Confusion matrix of the proposed model WSVE for depression intensity classification
In this study, the Twitter corpus was generated using public tweet data based on such hashtags which are associated with depression using Twitter’s public API and data scraping technique. An algorithm was also devised for the annotation of data into three classes according to depression intensity which proves to be an efficient strategy as it get a higher F1 score of 84% and accuracy of 90% for FastText depression intensity classification and got a much better score in comparison with baseline models. To improve the accuracy and F1 score of the individual models, a FastText-based ensemble WSVE is proposed which outperforms all individual models as well as FastText alone, i.e., 89% of F1 score and 93% of accuracy which is evident that the proposed model significantly improves depression intensity classification of tweets. This study proved that the proposed model captures contextualized representations of text much better as compared to baseline and FastText algorithms. This study helps to classify depression severity from public social media posts with very good performance. Although a depression indication in one tweet does not mean the user is in a depressive state, frequent detection of depression (specifically severe) in the posts of a particular social media user over a longer period of time may early indicate a higher depression level, and the user may be advised to seek a doctor. This early detection of depression ensures that the extreme consequences of persistent severe depression, such as suicide, are avoided. This study also helps governments observe the mental health of the general public, particularly in smart cities. The model may not perform well in finding depression intensity in longer snippets of text as it is trained on tweets that consist of shorter text.
In the future, this article will further investigate the same problem by deep learning models as well as Transformer based language model architecture to compare it with the proposed soft voting ensemble to seek which approach is more accurate in terms of F1 and accuracy and to further make depression classification model more useful for real-world deployment to public health projects. The model will also be tested by applying it to longer text such as a subreddit from Reddit to seek its performance in prediction for depression intensity classification in large text documents.
Acknowledgement: Not applicable.
Funding Statement: This research is supported by the European University of Atlantic.
Author Contributions: The authors confirm contribution to the paper as follows: Conceptualization and design: Muhammad Rizwan and Muhammad Faheem Mushtaq; data curation: Muhammad Rizwan and Maryam Rafiq; formal analysis: Muhammad Faheem Mushtaq and Maryam Rafiq; funding acquisition: Isabel de la Torre Torres; investigation: Arif Mehmood and Monica Gracia Villar; methodology: Maryam Rafiq and Arif Mehmood; project administration: Isabel de la Torre Diez and Helena Garay; resources: Isabel de la Torre Diez; software: Monica Gracia Villar and Helena Garay; supervision: Imran Ashraf; validation: Helena Garay and Imran Ashraf; visualization: Arif Mehmood and Monica Gracia Villar; writing—original draft: Muhammad Rizwan and Muhammad Faheem Mushtaq; writing—review & editing: Imran Ashraf.
Availability of Data and Materials: The data used in this study can be obtained from the authors on a reasonable request.
Conflicts of Interest: The authors declare that they have no conflicts of interest to report regarding the present study.
References
1. World Health Organization, “Depression.” [Online]. Available: https://www.who.int/news-room/fact-sheets/detail/depression (accessed on 05/08/2023) [Google Scholar]
2. S. G. Burdisso, M. Errecalde, and M. Montes-y-Gómez, “A text classification framework for simple and effective early depression detection over social media streams,” Expert Syst. Appl., vol. 133, pp. 182–197, Nov. 2019. doi: 10.1016/j.eswa.2019.05.023. [Google Scholar] [CrossRef]
3. World Health Organization, “Suicide data WEB.” [Online]. Available: https://www.who.int/teams/control-of-neglected-tropical-diseases/yaws/diagnosis-and-treatment/mental-health-and-substances-use (accessed on 11/06/2023) [Google Scholar]
4. J. Paparrizos, R. W. White, and E. Horvitz, “Screening for pancreatic adenocarcinoma using signals from web search logs: Feasibility study and results,” J. Oncol. Practice, vol. 12, no. 8, pp. 737–744, 2016. doi: 10.1200/JOP.2015.010504. [Google Scholar] [PubMed] [CrossRef]
5. G. Coppersmith, C. Harman, and M. Dredze, “Measuring post traumatic stress disorder in Twitter,” in Proc. Int. AAAI Conf. Web Soc. Media, Oxford, England, 2014, vol. 8. [Google Scholar]
6. M. Nadeem, “Identifying depression on Twitter,” arXiv Prepr. arXiv:1607.07384, 2016. [Google Scholar]
7. P. K. Gamaarachchige and D. Inkpen, “Multi-task, multi-channel, multi-input learning for mental illness detection using social media text,” in Proc. Tenth Int. Workshop Health Text Min. Inf. Anal., Louhi, Hong Kong, 2019, pp. 54–64. [Google Scholar]
8. A. John et al., “Self-harm, suicidal behaviours, and cyberbullying in children and young people: Systematic review,” J. Med. Internet Res., vol. 20, no. 4, pp. e9044, 2018. doi: 10.2196/jmir.9044. [Google Scholar] [PubMed] [CrossRef]
9. T. Tabak and M. Purver, “Temporal mental health dynamics on social media,” arXiv Prepr. arXiv:2008.13121, 2020. [Google Scholar]
10. Y. Zhang, H. Lyu, H. Liu, X. Zhang, Y. Wang and J. Luo, “Monitoring depression trends on twitter during the COVID-19 pandemic: Observational study,” JMIR Infodemiology, vol. 1, no. 1, pp. e26769, 2021. doi: 10.2196/26769. [Google Scholar] [PubMed] [CrossRef]
11. N. Farruque, C. Huang, O. Zaiane, and R. Goebel, “Basic and depression specific emotion identification in tweets: Multi-label classification experiments,” arXiv Prepr. arXiv:2105.12364, 2021. [Google Scholar]
12. E. A. H. Khalil, E. M. El Houby, and H. K. Mohamed, “Deep learning for emotion analysis in Arabic tweets,” J. Big Data, vol. 8, no. 1, pp. 1–15, 2021. doi: 10.1186/s40537-021-00523-w. [Google Scholar] [CrossRef]
13. S. Amir, M. Dredze, and J. W. Ayers, “Mental health surveillance over social media with digital cohorts,” in Proc. Sixth Workshop Comput. Linguist. Clin. Psychol., Minneapolis, Minnesota, 2019, pp. 114–120. [Google Scholar]
14. R. A. M. Saputri and T. Yumarni, “Social media addiction and mental health among university students during the COVID-19 pandemic in Indonesia,” Int. J. Ment. Health. Ad., vol. 21, pp. 1–15, 2021. doi: 10.1007/s11469-021-00582-3. [Google Scholar] [PubMed] [CrossRef]
15. D. Mowery, C. Bryan, and M. Conway, “Feature studies to inform the classification of depressive symptoms from Twitter data for population health,” arXiv Prepr. arXiv:1701.08229, 2017. [Google Scholar]
16. C. McClellan, M. M. Ali, R. Mutter, L. Kroutil, and J. Landwehr, “Using social media to monitor mental health discussions—evidence from Twitter,” J. Am. Med. Inform. Assn., vol. 24, no. 3, pp. 496–502, May 2017. doi: 10.1093/jamia/ocw133. [Google Scholar] [PubMed] [CrossRef]
17. M. M. Tadesse, H. Lin, B. Xu, and L. Yang, “Detection of depression-related posts in reddit social media forum,” IEEE Access, vol. 7, pp. 44883–44893, 2019. doi: 10.1109/ACCESS.2019.2909180. [Google Scholar] [CrossRef]
18. A. Roy, K. Nikolitch, R. McGinn, S. Jinah, W. Klement and Z. A. Kaminsk, “A machine learning approach predicts future risk to suicidal ideation from social media data,” npj Digit. Med., vol. 3, no. 1, pp. 78, Dec. 2020. doi: 10.1016/j.invent.2021.100424. [Google Scholar] [CrossRef]
19. J. H. K. Seah and K. J. Shim, “Data mining approach to the detection of suicide in social media: A case study of Singapore,” in 2018 IEEE Int. Conf. Big Data (Big Data), Seattle, WA, USA, Dec. 2018, pp. 5442–5444. [Google Scholar]
20. S. Tariq et al., “A novel co-training-based approach for the classification of mental illnesses using social media posts,” IEEE Access, vol. 7, pp. 166165–166172, 2019. doi: 10.1109/ACCESS.2019.2953087. [Google Scholar] [CrossRef]
21. M. Trotzek, S. Koitka, and C. M. Friedrich, “Utilizing neural networks and linguistic metadata for early detection of depression indications in text sequences,” arXiv Prepr. arXiv:1804.07000, 2018. [Google Scholar]
22. B. J. Ricard, L. A. Marsch, B. Crosier, and S. Hassanpour, “Exploring the utility of community-generated social media content for detecting depression: An analytical study on Instagram,” J. Med. Internet. Res., vol. 20, no. 12, pp. e11817, Dec. 2018. doi: 10.2196/11817. [Google Scholar] [PubMed] [CrossRef]
23. Y. Huang, C. F. Chiang, and A. Chen, “Predicting depression tendency based on image, text and behavior data from instagram,” in Proc. 8th Int. Conf. Data Science, Prague, Czech Republic, 2019, pp. 32–40. [Google Scholar]
24. Z. Peng, Q. Hu, and J. Dang, “Multi-kernel SVM based depression recognition using social media data,” Int. J. Mach. Learn. Cyb., vol. 10, no. 1, pp. 43–57, Jan. 2019. doi: 10.1007/S13042-017-0697-1. [Google Scholar] [CrossRef]
25. T. Shen et al., “Cross-domain depression detection via harvesting social media,” in Proc. Twenty-Seventh Int. Joint Conf. Artif. Intell., Stockholm, Sweden, Jul. 2018, pp. 1611–1617. [Google Scholar]
26. M. Rizwan, M. F. Mushtaq, U. Akram, A. Mehmood, I. Ashraf and A. Sahelice, “Depression classification from tweets using small deep transfer learning language models,” IEEE Access, vol. 10, pp. 129176–129189, 2022. doi: 10.1109/ACCESS.2022.3223049. [Google Scholar] [CrossRef]
27. S. Chancellor and M. de Choudhury, “Methods in predictive techniques for mental health status on social media: A critical review,” npj Digit. Med., vol. 3, no. 1, pp. 1–11, 2020. doi: 10.1038/s41746-020-0233-7. [Google Scholar] [PubMed] [CrossRef]
28. S. H. Pedersen, K. B. Stage, A. Bertelsen, P. Grinsted, P. Kragh-Sørensen and T. Sørensen, “ICD-10 criteria for depression in general practice,” J. Affect. Disord., vol. 65, no. 2, pp. 191–194, 2001. doi: 10.1016/S0165-0327(00)00268-8. [Google Scholar] [PubMed] [CrossRef]
29. M. Jim et al., “ICD-10 depression diagnostic criteria—general practice notebook,” Accessed: November 01, 2021. [Online]. Available: https://gpnotebook.com/simplepage.cfm?ID=x20091123152205182440 [Google Scholar]
30. S. Chancellor and M. de Choudhury, “Methods in predictive techniques for mental health status on social media: A critical review,” npj Digital Medicine, vol. 3, no. 1, pp. 43, Dec. 2020. doi: 10.1038/s41746-020-0233-7. [Google Scholar] [PubMed] [CrossRef]
31. M. A. Moreno, N. Goniu, P. S. Moreno and D. Diekema, “Ethics of social media research: Common concerns and practical considerations,” Cyberpsychol. Behav. Soc. Netw., vol. 16, pp. 708–713, 2013. doi: 10.1089/cyber.2012.0334. [Google Scholar] [PubMed] [CrossRef]
32. C. V. Talbot, S. T. O’Dwyer, L. Clare, J. Heaton, and J. Anderson, “How people with dementia use twitter: A qualitative analysis,” Comput. Hum. Behav., vol. 102, pp. 112–119, 2020. doi: 10.1016/j.chb.2019.08.005. [Google Scholar] [CrossRef]
33. T. Karthikeyan, K. Sekaran, D. Ranjith, and J. M. Balajee, “Personalized content extraction and text classification using effective web scraping techniques,” Int. J. Web Portals (IJWP), vol. 11, no. 2, pp. 41–52, 2019. doi: 10.4018/IJWP.2019070103. [Google Scholar] [CrossRef]
34. J. D. Bacsu et al., “Using Twitter to understand the COVID-19 experiences of people with dementia: Infodemiology study,” J. Med. Internet Res., vol. 23, pp. e26254, 2021. doi: 10.2196/26254. [Google Scholar] [PubMed] [CrossRef]
35. D. Mowery et al., “Understanding depressive symptoms and psychosocial stressors on Twitter: A corpus-based study,” J. Med. Internet Res., vol. 19, no. 2, pp. e48, Feb. 2017. doi: 10.2196/jmir.6895. [Google Scholar] [PubMed] [CrossRef]
36. M. Park, C. Cha, and M. Cha, “Depressive moods of users portrayed in Twitter,” in Proc. 18th ACM Int. Conf. Knowl. Discov. Data Min. (SIGKDD), Beijing, China, 2012, pp. 1–8. [Google Scholar]
37. S. Ahuja and G. Dubey, “Clustering and sentiment analysis on Twitter data,” in 2nd Int. Conf. Telecommun. Netw. (TEL-NET), Melbourne, Australia, Aug. 2017, pp. 1–5. [Google Scholar]
38. K. H. Manguri, R. N. Ramadhan, and P. R. M. Amin, “Twitter sentiment analysis on worldwide COVID-19 outbreaks,” Kurdistan J. Appl. Res., vol. 5, no. 3, pp. 54–65, May 2020. doi: 10.24017/covid.8. [Google Scholar] [CrossRef]
39. C. A. Melton, O. A. Olusanya, N. Ammar, and A. Shaban-Nejad, “Public sentiment analysis and topic modeling regarding COVID-19 vaccines on the Reddit social media platform: A call to action for strengthening vaccine confidence,” J. Infect. Public Heal., vol. 14, pp. 1505–1512, 2021. doi: 10.1016/j.jiph.2021.08.010. [Google Scholar] [PubMed] [CrossRef]
40. A. Mehmood, B. W. On, I. Lee, I. Ashraf, and G. S. Choi, “Spam comments prediction using stacking with ensemble learning,” J. Phys.: Conf. Series, vol. 933, no. 1, pp. 012012, 2017. doi: 10.1088/1742-6596/933/1/012012. [Google Scholar] [CrossRef]
41. M. Khalid, I. Ashraf, A. Mehmood, S. Ullah, M. Ahmad and G. S. Choi, “GBSVM: Sentiment classification from unstructured reviews using ensemble classifier,” Appl. Sci., vol. 10, no. 8, pp. 2788, 2020. doi: 10.3390/app10082788. [Google Scholar] [CrossRef]
42. S. W. A. Sherazi, J. W. Bae, and J. Y. Lee, “A soft voting ensemble classifier for early prediction and diagnosis of occurrences of major adverse cardiovascular events for STEMI and NSTEMI during 2-year follow-up in patients with acute coronary syndrome,” PLoS One, vol. 16, pp. e0249338, 2021. doi: 10.1371/journal.pone.0249338. [Google Scholar] [PubMed] [CrossRef]
43. A. Özçift, “Medical sentiment analysis based on soft voting ensemble algorithm,” Yönetim Bili ̧sim Sistemleri Dergisi, vol. 6, pp. 42–50, 2020. [Google Scholar]
44. Y. Zhang, H. Zhang, J. Cai, and B. Yang, “A weighted voting classifier based on differential evolution,” Abstr. Appl. Anal., vol. 2014, 2014. doi: 10.1155/2014/376950. [Google Scholar] [CrossRef]
Cite This Article
 Copyright © 2024 The Author(s). Published by Tech Science Press.
This work is licensed under a Creative Commons Attribution 4.0 International License , which permits unrestricted use, distribution, and reproduction in any medium, provided the original work is properly cited.
 Downloads
 Citation Tools