
 Submit a Paper
 Propose a Special lssue
 Open Access
ARTICLE

Enhanced Wolf Pack Algorithm (EWPA) and Dense-kUNet Segmentation for Arterial Calcifications in Mammograms
College of Computing and Information Technology, Shaqra University, Shaqra, 11961, Saudi Arabia
* Corresponding Author: Afnan M. Alhassan. Email:
(This article belongs to the Special Issue: Deep Learning in Medical Imaging-Disease Segmentation and Classification)
Computers, Materials & Continua 2024, 78(2), 2207-2223. https://doi.org/10.32604/cmc.2024.046427
Received 30 September 2023; Accepted 03 January 2024; Issue published 27 February 2024
 View Full Text
 Download PDF
Abstract
Breast Arterial Calcification (BAC) is a mammographic decision dissimilar to cancer and commonly observed in elderly women. Thus identifying BAC could provide an expense, and be inaccurate. Recently Deep Learning (DL) methods have been introduced for automatic BAC detection and quantification with increased accuracy. Previously, classification with deep learning had reached higher efficiency, but designing the structure of DL proved to be an extremely challenging task due to overfitting models. It also is not able to capture the patterns and irregularities presented in the images. To solve the overfitting problem, an optimal feature set has been formed by Enhanced Wolf Pack Algorithm (EWPA), and their irregularities are identified by Dense-kUNet segmentation. In this paper, Dense-kUNet for segmentation and optimal feature has been introduced for classification (severe, mild, light) that integrates DenseUNet and kU-Net. Longer bound links exist among adjacent modules, allowing relatively rough data to be sent to the following component and assisting the system in finding higher qualities. The major contribution of the work is to design the best features selected by Enhanced Wolf Pack Algorithm (EWPA), and Modified Support Vector Machine (MSVM) based learning for classification. k-Dense-UNet is introduced which combines the procedure of Dense-UNet and kU-Net for image segmentation. Longer bound associations occur among nearby sections, allowing relatively granular data to be sent to the next subsystem and benefiting the system in recognizing smaller characteristics. The proposed techniques and the performance are tested using several types of analysis techniques 826 filled digitized mammography. The proposed method achieved the highest precision, recall, F-measure, and accuracy of 84.4333%, 84.5333%, 84.4833%, and 86.8667% when compared to other methods on the Digital Database for Screening Mammography (DDSM).Keywords
Three-dimensional (3D) images, breast arterial calcification (BAC), angiographic cardiac sickness, and cardiovascular diseases (CVD) results have been connected to a common chance finding in mammography are illustrated in Fig. 1 [1]. Breast artery severity can be found during testing programs, according to a meta-analysis that found a frequency of 12.70% in breast cancer screening programs [2]. According to a comprehensive assessment of prior screened community surveys, the incidence of breast arterial calcification was 12.70% (95.00% confidence interval: 10.40%–15.10%), whereas 23.00% of patients in the current research possessed it. This is most likely due to the current cohort of patients a greater cardiovascular risk profile is associated with likely myocardial arterial disease than asymptomatic persons participating in screening programs [2]. It is the hardening of minor cardiac capillaries or arteries from the inside out, as opposed to the adventitial calcification of coronary artery disease.

Figure 1: A patient report impacted by significant BAC and CVD [1] is as follows: (a) medial oblique, (b) craniocaudally screening tests displaying aortic remineralization (c) contoured horizontal rationalization of the left coronary artery on CCTA showing obstructionist coronary artery disease, and (d) 3D CCTA restoration displaying obstructionist coronary artery disease in the left frontal downward coronary artery
Breast arterial calcification has been linked to risk variables for vast populations of individuals undergoing diagnostic mammograms an increased incidence of heart disease [2] and cardiac death [3]; however, only a small amount of study has been done on the relationship between breast vascular stiffness and myocardial heart disease against computed tomography (CT) image. A multiple measure has been used to quantify the degree of mineralization in the breast artery as indicated in Fig. 2 which was modified from the score [4]. Women’s cardiovascular disease risk is typically understated. In addition to intimate relations hazard variables for cardiac disease including menopausal and pre-eclampsia, traditional health conditions for heart illness such as pressure, diabetic mellitus, and smoking were greater accurate predictors for women than for men [5].

Figure 2: Scoring system for assessing the severity of breast arterial calcification: 0. no arterial calcification; 1. few punctate arterial calcifications with no coarse, tram track or ring calcifications; 2. coarse arterial calcification or tram track calcification in fewer than three vessels; 3. severe coarse or tram track calcification affecting three or more vessels [4]
Women are therefore greater likely to experience atypical heart painful symptoms which may be related to their lower diagnostic and treatment rates [6]. This is especially significant for women below the age of 55, who are expected to have undergone at least one cycle of mammography imaging [7] according to current criteria. Diagnostic mammograms can identify hardening in the breast arteries, according to a concept that found a frequency of 12.70% in breast cancer screening programs. It is the hardening of tiny glandular capillaries from the inside out, as opposed to the adventitial calcification of coronary artery disease. In huge partners of sufferers who underwent tested mammograms, chest aortic remodeling is associated with hazard variables for cardiac disorder, the presence of cardiac disorder [8], and an increased threat of cardiac fatalities [9]; but that said, the affiliation among chest aortic calcified and CT individuality of cardiac blood vessel disorder has just been assessed in tiny assessments to date.
Currently, there is no methods are available for the automatic detection of BAC in mammograms. Because most females between their 40 and 50 ages are routinely screened for breast cancer with mammography, identifying BAC could provide a cost-efficient, productive, and far-reaching approach to screening females for CVD. Deep learning models have shown promise in a variety of biomedical activities; BAC detection remains a difficult task. Wang et al. [10] are the only ones who have BACs; an approach was made to standardize CNN classification. Identification with twelve layers and its findings indicate its DL model practicality is comparable to those of people specialists. Therefore, the patch size has an impact; it only concentrates on the neighborhood of the selected pixel, limiting the information required by the network for the overall representations of the input.
In this study, k-Dense-UNetis was introduced to detect BAC in mammograms automatically, to develop as a CA danger sign, an automatic BAC detection in the future. Employ the summing process as opposed to the concatenated process near the end of the links that take a lengthy time to load, which merges highlight images at a similar grade and decreases the computing load, as opposed to the usual U-Net model. The optimal features are picked using the Enhanced Wolf Pack Algorithm (EWPA) and classified using Modified Support Vector Machine (MSVM) based learning techniques, and the performance is tested using several types of analysis techniques 826 filled digitized mammography were included in the study. The following is a summary of the publication’s findings and commitments:
• k-Dense-UNet is developed which combines the procedure of Dense-UNet and kU-Net for image segmentation. Longer bound associations occur among nearby sections, allowing relatively granular data to be sent to the subsequent subsystem and helping the system recognize smaller characteristics.
• Enhanced Wolf Pack Algorithm is used to choose the best features which are then classified using MSVM classifier.
• When compared to human performances, the given model demonstrates that deep learning can outperform human specialists in this activity.
The remainder of the paper is organized as follows: Section 2 highlights previous studies, whereas Section 3 describes the k-Dense-UNet framework including component choice and categorization that is proposed. In Section 4, the datasets and experimental setup are described, followed by the results and commentary. Finally, Section 5 closes the report with recommendations for future research.
AlGhamdi et al. [11] reported a deep learning (DL) approach for identifying BAC in mammography. Use the U-Net system with thick connectivity to detect BAC in mammography efficiently, influenced by encouraging results obtained in which the U-Net concept is used in several biological classification tasks and the Dense Net in semantic classification. The provided approach aids in the recycling of computations and improves the flow of gradients, resulting in improved accuracy and a simpler training model.
Mordang et al. [12] proposed a method for removing BAC from positive results. Computer-Aided Detection (CADe) system effectiveness in detecting malignant micro-calcifications will improve if these false positives are removed. BAC is deleted from the identified instances in the last step. In the BAC exclusion step, a GentleBoost classification is built on assessment characteristics that define its form, structure, and roughness. There are additional new factors suggested to identify BAC from similar successful findings.
Huang et al. [13] proposed to check the variation between BAC and chest diagnostic mammograms, the Coronary Artery Disease-Reporting and Data System (CAD-RADS) based on Deep Learning-coronary computed tomography angiography (CCTA). Wang et al. [14] compared the performance of three deep learning architectures for detecting BAC in digital mammography: You Only Look Once (YOLO), U-Net, and DeepLabv3+. To improve the BAC pattern, a basic multiresolution filtering predicated on Hessian is developed, and the binary mask of BAC is then generated using a personal self-binarization approach. Because BAC is small, a new metric was devised to properly assess limited object segmentation, and the suggested method obtains the best reliability.
Yeh et al. [15] integrated a deep Q network with a state-action-reward-state-action learning algorithm and a deep Reinforcement Learning (RL) network for BAC in mammography. An artificial agent in the suggested approach learns the technique automatically and can iteratively change the emphasis of concentration from an initial bounding box to a smaller bounding box containing the BAC area.
A deep learning model (Breast Cancer Convolutional Neural Network (BCCNN)) was suggested by Abunasser et al. [16] to identify and categorize breast tumors into eight types. Because of their excellent picture quality, the MRI scans were most accurate when magnified 400X.
A unique DeepBraestCancerNet DL model for the identification and categorization of breast cancer was introduced by Raza et al. [17]. Six convolutional layers, nine inception modules, and one fully linked layer make up the 24 layers of the suggested system. Additionally, batch normalization and cross-channel normalization are the two normalization processes used by the design, together with the clipped and leaky ReLu activation functions. A novel computer-aided diagnosis method based on thermography and artificial intelligence was presented by Chebbah et al. [18] to assist radiologists in accurately diagnosing breast disorders. To differentiate between normal and pathological thermograms, supervised learning algorithms-based classifiers are applied utilizing the retrieved features.
Using digital mammograms, Gutierrez et al. [19] proposed an automated deep learning-based breast cancer diagnostic (ADL–BCD) model. For feature extraction, a Residual Network (ResNet 34) based on a Deep Convolutional Neural Network is utilized. In particular, the ResNet 34 model’s hyperparameters are tuned via the application of the Chimpanzee Optimization Algorithm (COA). Digital mammograms are classified using the wavelet neural network (WNN) to identify breast cancer. Mansour et al. [20] included pre-processing, a fully Gaussian aggregate model (GMM) based on more appropriate adaptive learning, localization of the area of interest based on connected element analysis, and feature extraction predominantly based on AlexNet-DNN.
The review work shows how the DL methods are applied for BAC in mammography. U-Net system with thick connectivity is introduced to detect BAC in mammography [11]. The multistage method is proposed for the removal of false positives in BAC findings [12]. The Deep Learning method is introduced to check the variation between BAC and on-chest diagnostic mammograms [13]. Three deep learning architectures (YOLO, U-Net, and DeepLabv3+) are introduced for detecting BAC in digital mammography [14]. A deep Q network has been introduced for detecting BAC [15]. BCCNN [16], DeepBraestCancerNet [17], U-Net model [18], wavelet neural network (WNN) [19], and AlexNet-DNN [20] have been introduced for breast cancer classification.
Research Gap: The initial research of applying DL techniques is used to evaluate CAD against BAC. However, little study has been done on the use of these approaches to screen women for cardiovascular disease (CVD) using BAC. There is a necessity to design a new DL algorithm for accurate CAD classification, as well as to investigate the relationship among BAC on mammography and grades based on the DL approach in women. The current classification study has focused on boosting accuracy, which has resulted in considerable advancements in BAC identification. Previously, semantic classification with deep learning had reached higher efficiency, but this structure proved to be an extremely challenging task due to an overfitting model for capturing the patterns and regularities in the training set for healthcare areas.
In this paper, BAC classification is performed based on DL in the DDSM. Integrates combined techniques named current Dense-kUNet with MSVM. This strategy avoids the model learning unnecessary features and improves dataflow resulting in a more effective CNN. Use the summing function rather than the concatenation near the conclusion of the lengthy connections that combine image features of the identical stage as in the traditional U-Net architecture. EWPA algorithm is used to enhance retrieved characteristics. Finally, MSVM classifiers are used to classify the specified features. The architecture of the proposed framework is depicted in Fig. 3.

Figure 3: General framework design of the proposed methodology
Digital Database for Screening Mammography (DDSM) is a well-shared asset for breast cancer detection. The Curated Breast Imaging Subset of Digital Database for Screening Mammography (CBIS-DDSM) [21] is a subsequent edition of this dataset that includes pictures that have been transformed into the standard DICOM format. The scans were taken from 1,700 women who had one of three breast cancer-related disorders (normal, benign, and malignant). The Cranial-Caudal (CC) and Medio Lateral Oblique (MLO) images of every breast, as well as the patient and his or her surroundings imaging data, are included in the majority of instances. For 1,520 photos that constitute examples of ground-truth training, along with ROI extraction and boundary areas, the set also offers pathological diagnostics. This collection contains photos that are very huge in dimension, having a median width of 3131 pixels and an aggregate height of 5295 pixels. BAC may be detected in mammography as a risk factor for myocardial arterial illness. Dense-kUNet is introduced in abstract separation with dense connectivity to instantaneously diagnose BAC in mammography impacted by the promising outcomes acquired using the U-Net design and the Dense-kUNet with intently packed connectivity to recognize BAC in mammography. The provided approach aids in the recycling of computations and improves the flow of variations, resulting in improved accuracy and a simpler training model.
3.2 Image Segmentation Using Dense-kUNet
k-Dense-UNetis introduced for BAC image recognition. Dense-UNet is introduced by adding dense 1blocks into U-Net, resulting in deeper layers for enhanced information recovery, based on the features of U-long Net skip interoperability and Density Net’s short skipped connecting method. Secondly, Dense-UNet and kU-Net are combined to form the k-Dense-UNet system, which contains numerous Dense-UNetsubsystems. By successfully transmitting data across close submodules, skip associations are formed to aid the system in discovering fine characteristics. DenseNet [22] achieves superior results by using dense connectivity, every level takes new information from every previous level and transmits its unique showcase to all subsequent levels. The system shrinks and compresses as a result of so compact unit architecture, resulting in increased operational and storage performance. In practice, 33% of kernels with a stride size of 1 are used in all convolutional layers. ReLU is used for activation functions. Sequential standardization is used to minimize coupling problems and boost the development rate of the model.
Dense-kUNet is a hybrid of Dense-UNet and kU-Net. Fig. 4 shows an example of its design with k = 1. It uses Dense-feature UNet extraction and blends it with kU-concept Nets of progressively extracting characteristics to a finer scale. The up-sampling section of the DenseUNet submodule is changed in momentum to the pooled section of the subsequent Density UNet, which is equivalent to transferring coarser data to the next comment thread to receive additional exact picture classification results, similar to U-Net. The red line indicates the lengthy skip connection between the max pooled level and the corresponding up-sample level, the grey arrow suggests the 2
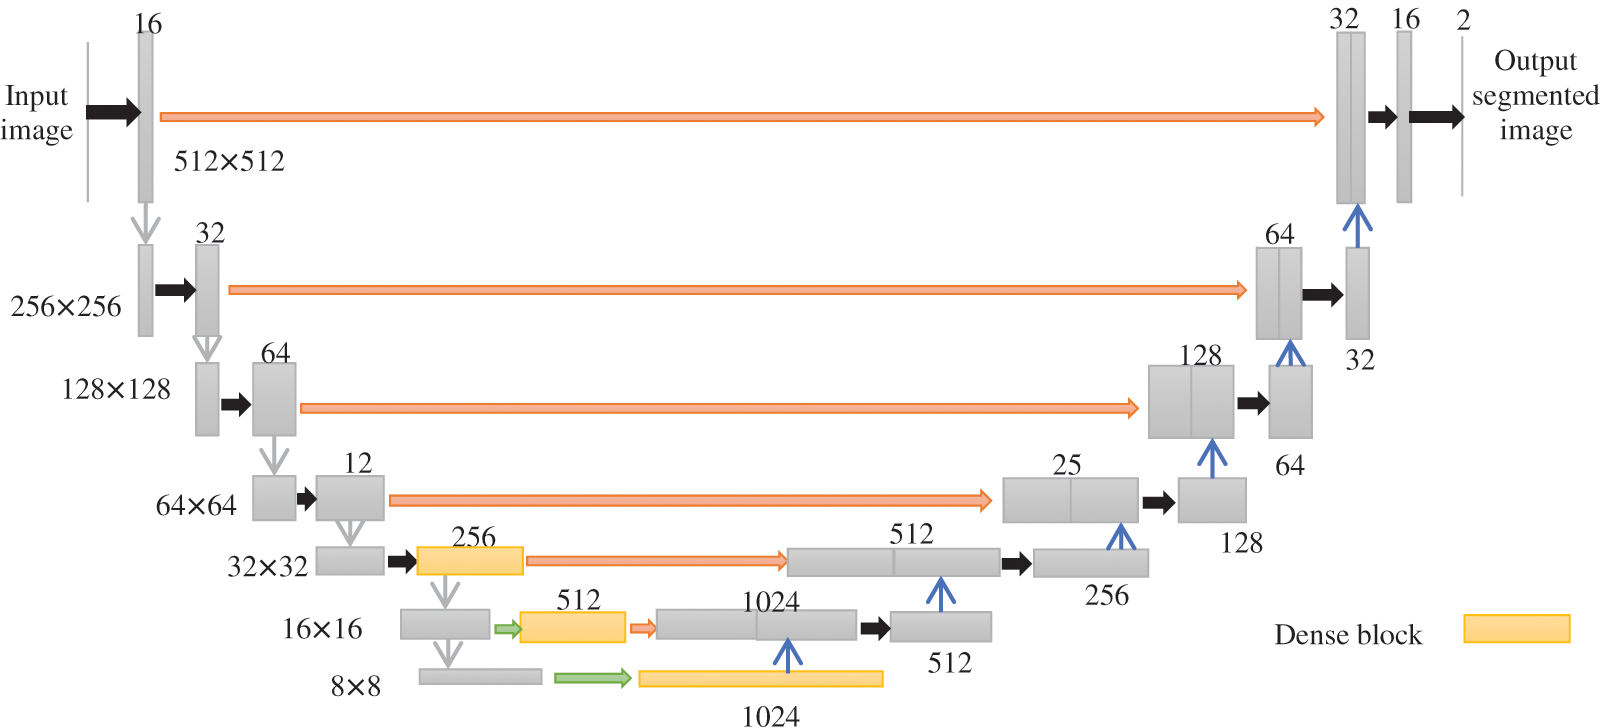
Figure 4: Architecture of Dense-kUNet (k = 1)
where [
The inbuilt procedure of every particular sub in the k-Dense-UNet prototype is comparable to Dense-UNet, and the grey arrow suggests two-convolution with regularization and ReLUexcitation feature, the black pointer reflects maximum accumulation of 2
3.3 Feature Selection Using Enhanced Wolf Pack Algorithm
WPA has a great overall searching capacity, but it is susceptible to localized optima and has a sluggish resolving frequency, similar to most similar swarm intelligence algorithms. Opposition-based learning is introduced to maintain population variety and avoid the algorithm.
Step 1: Initialization: The fine traits of the original population in the feature reduction of BAC, the original BAC is referred to as the xm. WPA is created at random, and it reduces the performance of the algorithm [23]. The steps are as follows:
Randomly generate the starting population
where
The optimal reduced feature
Step 2: Generation of head wolf: The wolf at
Step 3: Keep close to the prey: The leader wolf issues a call to action to the wolf pack, encouraging them to revise existing pixel locations. The current pixel location of the ith wolf in d-dimension is stated as Eq. (6),
where
Step 4: Encircle the prey: Eqs. (7) and (8), after identifying the prey, the head wolf transmits messages to the encircling wolf pack to finish the invasion and suppression of the targeted animal,
where
Step 5: The wolf pack competitiveness and rejuvenation process. The wolves that are unable to obtain an accuracy classifier in BAC food will be encircled and suppressed, while the remaining wolves will be maintained. At the same time, new wolves are randomly produced in the identical quantity as the ones that were destroyed.
Step 6: When the maximal amount of iterations, or the ideal quantity of the features indexing variables has been attained, the wolf location is produced. If the maximal amount of repetitions is never being achieved, go back to step 2. Fig. 5 shows a flowchart of how to choose the best features using WPA.
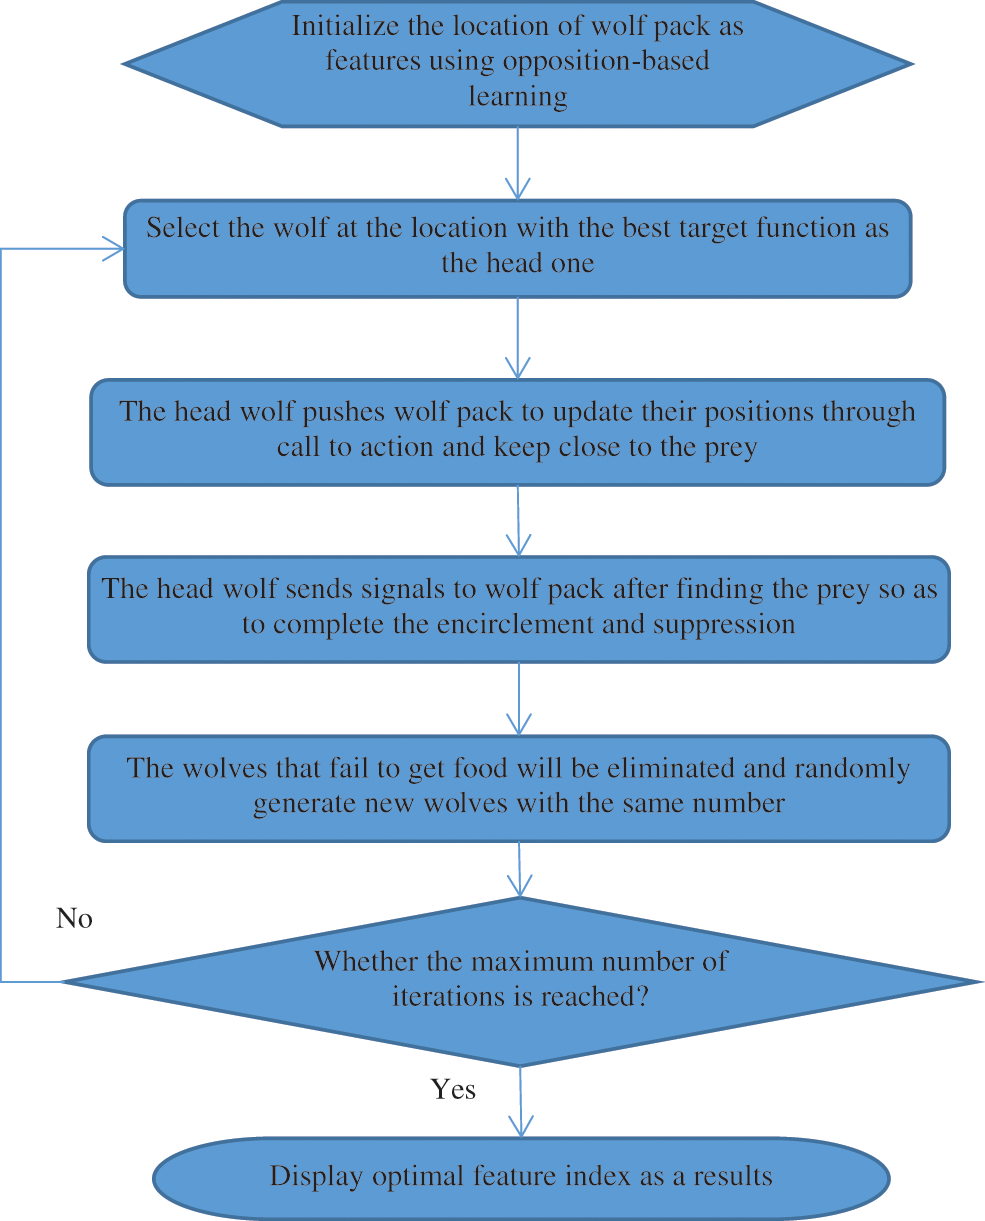
Figure 5: Flowchart of optimal feature selection using EWPA
The processing of feature index input data is accomplished using MSVM Classifier. Dataset forms a small subset
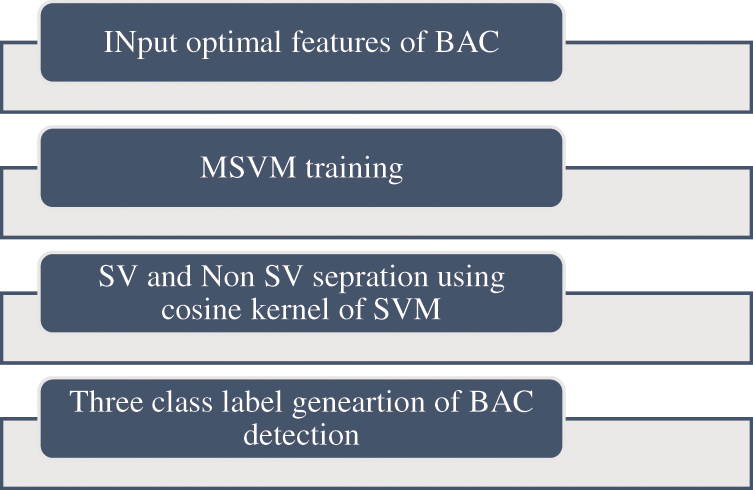
Figure 6: Proposed algorithm of MSVM classifier
MSVM thereby attaining a small data set with the images
where
The computation of the modified characteristic area and the dot products of the projected input values is done by the kernel function. The optimal hyperplane that separates the three classes (“normal”, “benign”, and “malignant”) is obtained by Eq. (11),
where, the optimal weight vector (w),
The general steps taken to accomplish the classification and prediction of BAC are given in Table 1.

4 Experimental Results and Discussion
The k-folds cross-validation approach was used to further quantify the Dense-kUNet with MSVM performance. The whole information was split into k-folds of similar dimensions at randomization, with k = 5. (k−1) folds were used to train the model, and the remaining kth fold was used to test it. The procedure was repeated till all pleats were used as a sample set, after which the efficiency was determined as the estimate of all folds. Fig. 7 shows the input sample, and output results of methods.
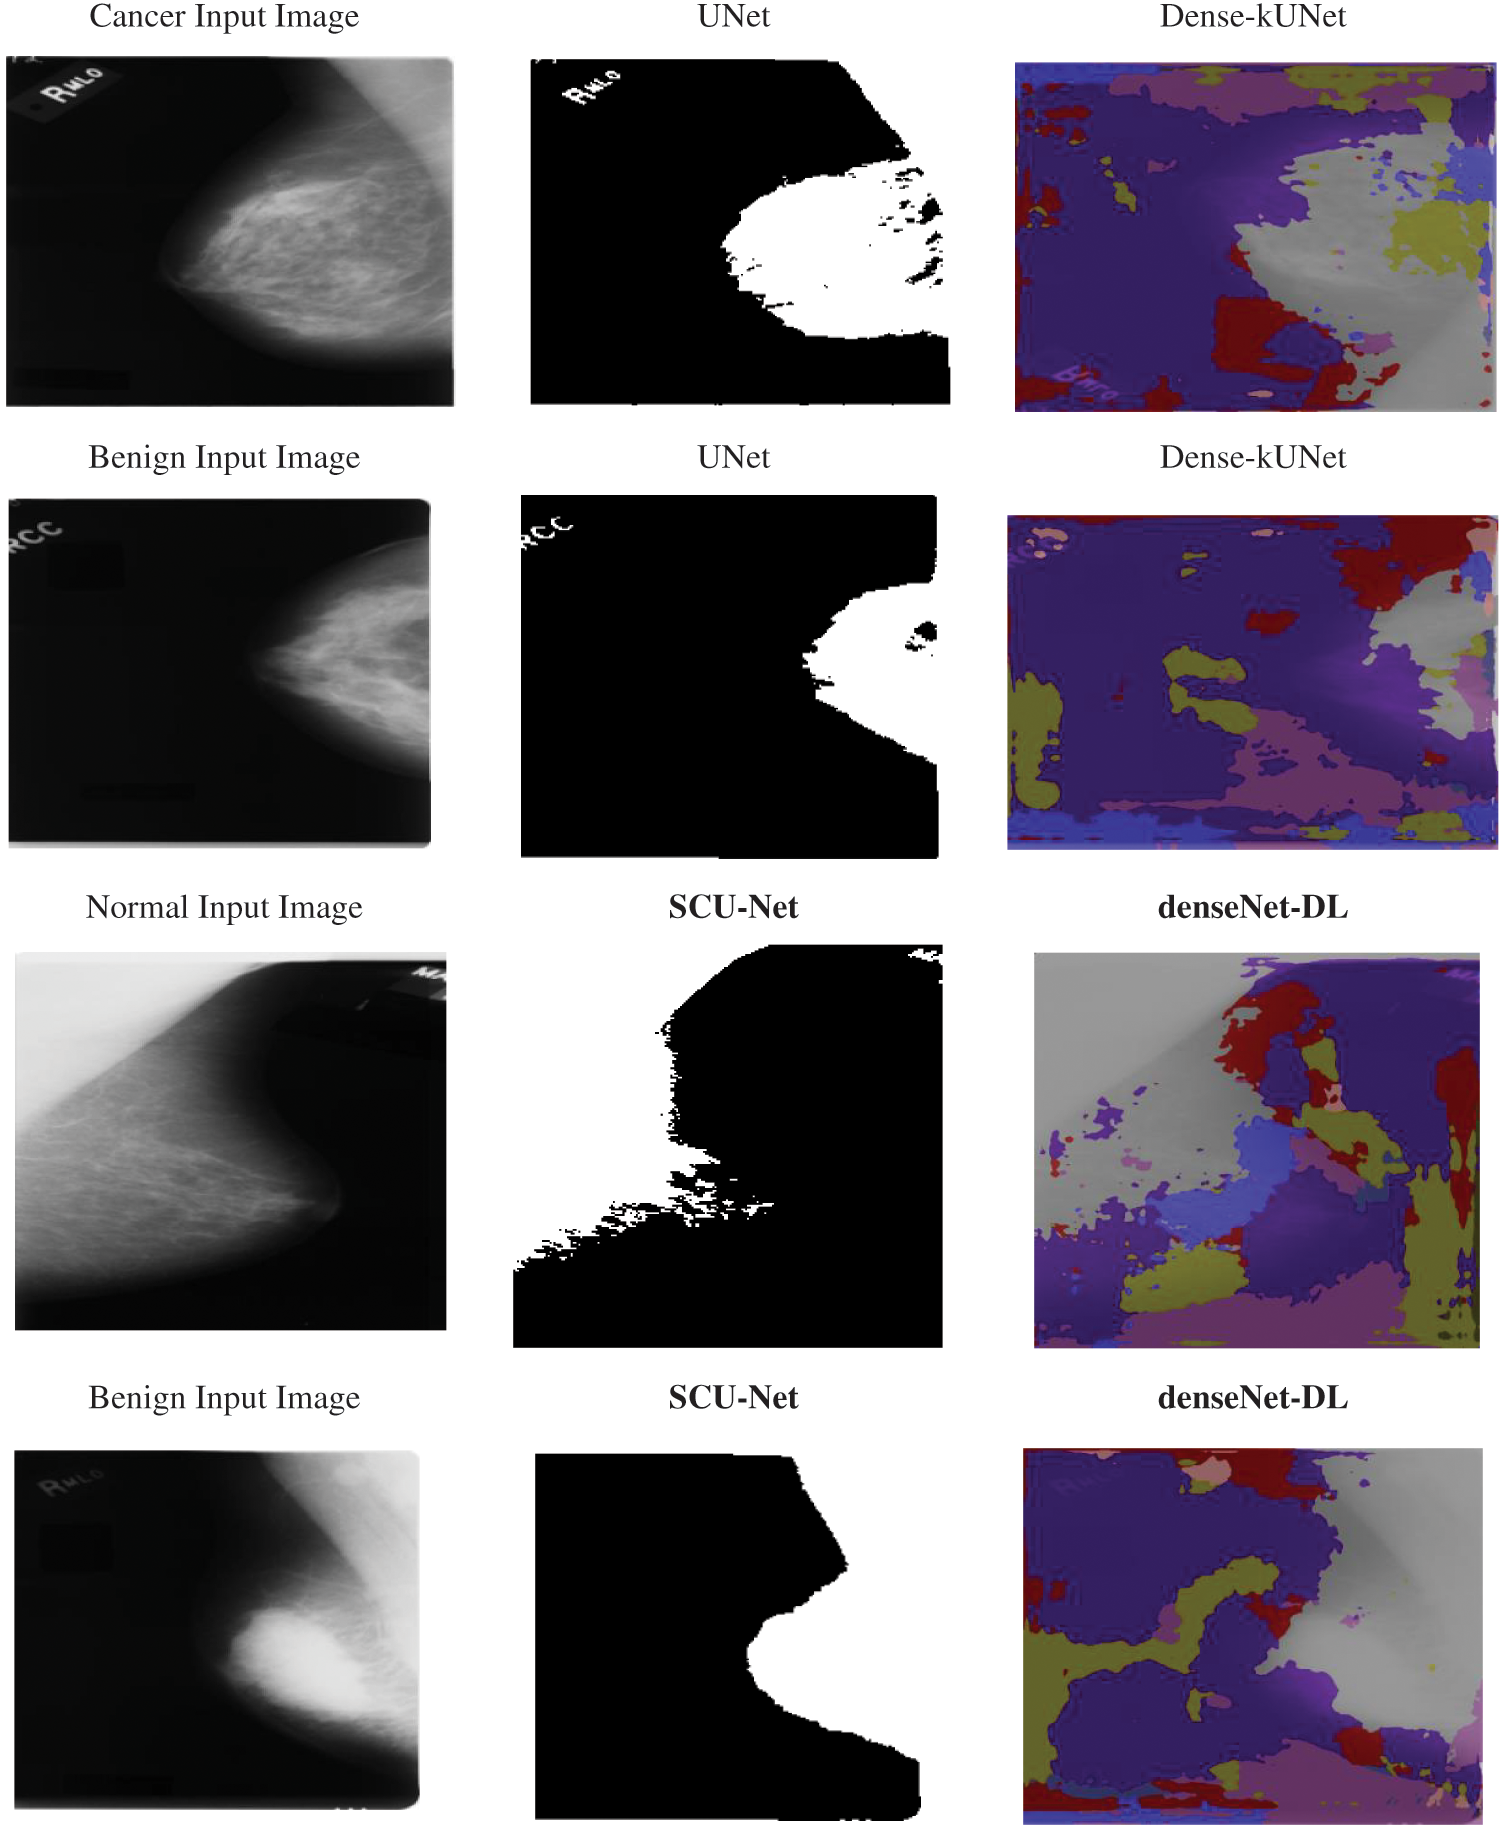
Figure 7: Input sample and output sample
With a sample number of 256 and a strong velocity, the retraining was completed using stochastic gradient descent (0.9). The learning rate (lr) was 0.01 at the start. Precision, recall, F-measure, Accuracy, and Matthews Correlation Coefficient (MCC) were used to evaluate the suggested Dense-kUNet with MSVM, DenseNet with DL [11], and SCU-Net [13]. Table 2 displays the numerical results. The following are the definitions for these measurements:

The precision, and recall curves derived from 826 mammography images using Dense-kUNet with MSVM, UNet, SCU-Net, denseNet-DL, and Deep Q-Network (DQN) are shown in Fig. 8. When analyzing these results, the Dense-kUNet with MSVM model brings the advantages of dense connectivity and kU-Net routes together. As shown, Dense-kUNet with MSVM model achieved 84.4333% precision rate. In comparison, the DenseNet with DL achieved 81.4557%, DQN achieved 82.4416%, SCU-Net achieved 75.0912%, and UNet achieved 73.5581%. Dense-kUNet with the MSVM model achieved an 84.5333% recall rate. In comparison, the DenseNet with DL achieved 79.7642%, DQN achieved 82.6175%, SCU-Net achieved 72.1342%, and UNet achieved 70.4463%. When utilizing a limited dataset, the SCU-Net mitigates the problem of overfitting by encouraging the system to acquire a more exclusionary set of characteristics.
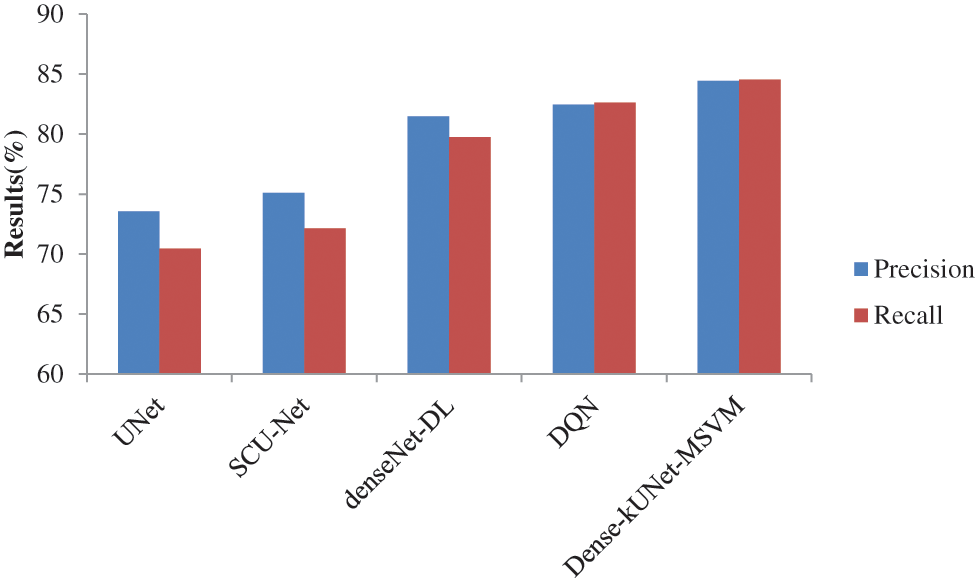
Figure 8: Precision and recall comparison of classifiers
As illustrated in Fig. 9, SCU-Net achieves an error rate of 24.8780%, which is lower than the DenseNet with DL. Meanwhile, DenseNet with DL achieves an Error rate = 17.6570%, which is lower than that achieved by using Dense-kUNet with MSVM with an Error rate = 13.1333% at the same FPR rate. Achieved highest error rate of 27.7855%, and DQN lowest error rate of 15.8452% than other existing methods. Dense-kUNet with MSVM model is more successful at identifying and tracking BAC. This is a truly encouraging outcome in terms of putting a system like this into medical practice and utilizing it to assess the risk of myocardial arterial illness. Because the features were obtained from the pooling layer, and the best feature was selected using EWPA optimization techniques, and then fused using a proposed approach, which was then categorized using a fast MSVM algorithm.
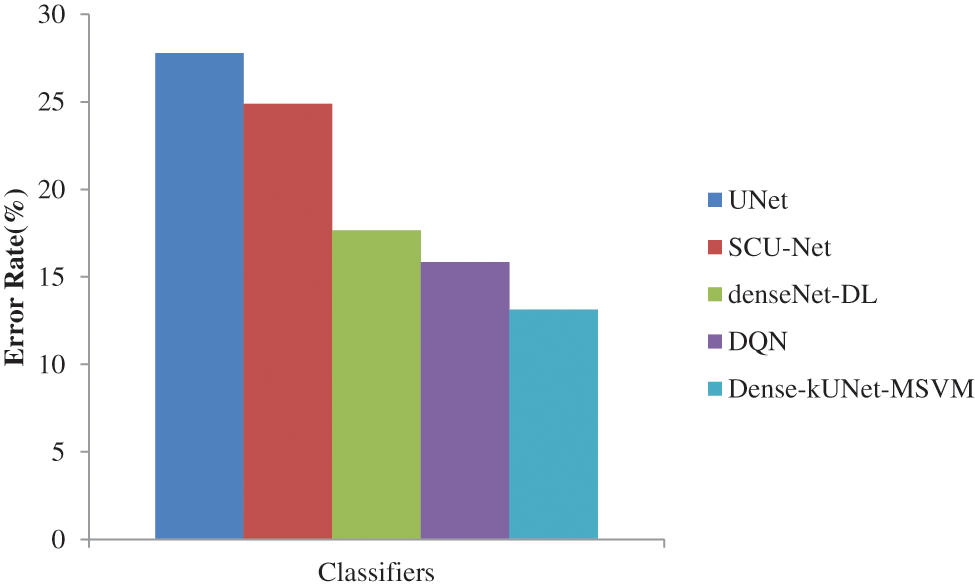
Figure 9: Error rate comparison of classifiers
Fig. 10 shows the F1-score generated after max-pooling levels in the contraction approach, which is deeply sufficient to produce and display distinguishing characteristics for categorization, to highlight the ability of the Dense-kUNet with the MSVM model to learn discriminative features. The Dense-kUNet with MSVM model learns BAC patterns with varied size, orientation, and perspective, as seen by the data. Based on non-BAC features, the algorithm was able to detect the existence of BAC and separate them from other types of nodules detected in mammograms. UNet, SCU-Net, denseNet-DL, DQN, and Dense-kUNet-MSVM give the accuracy results of 71.9685%, 74.2341%, 80.3341%, 82.5294%, and 84.4833% by Fig. 11.
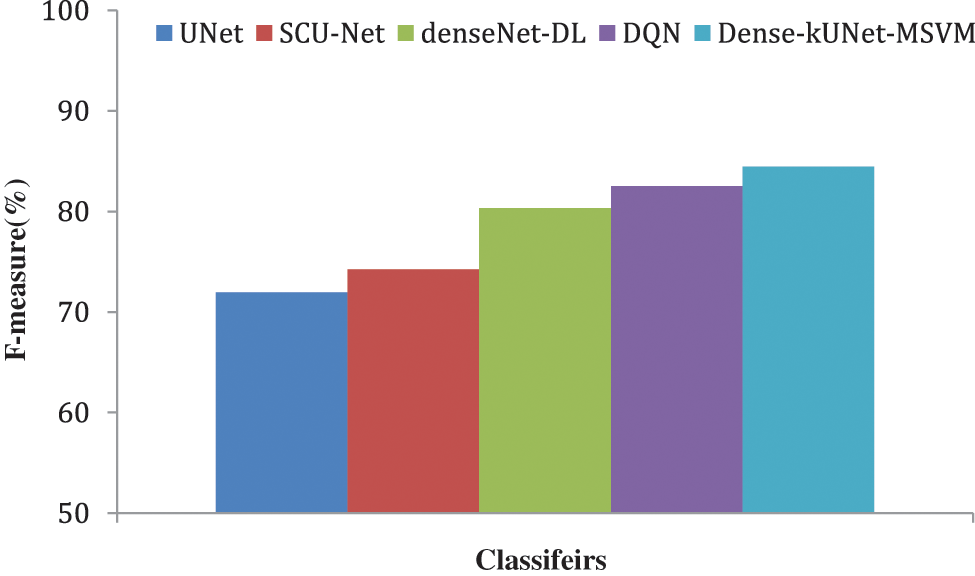
Figure 10: F-measure comparison of classifiers
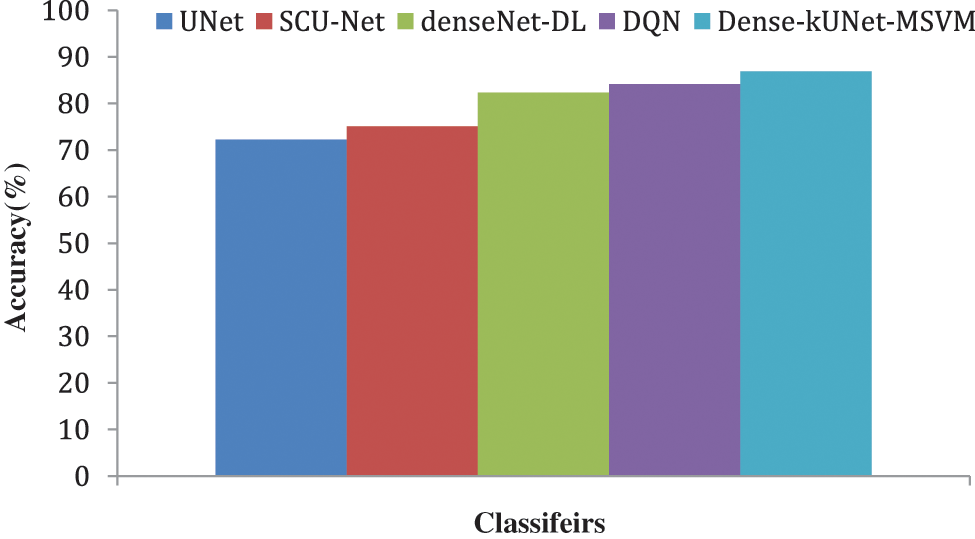
Figure 11: Accuracy comparison of classifiers
As shown in Fig. 12, the suggested approach is matched to state-of-the-art procedures. UNet, SCU-Net, denseNet-DL, DQN, and Dense-kUNet-MSVM give the MCC results of 69.8221%, 71.0000%, 78.0000%, 82.0000%, and 84.0000%. The most effective way for selecting features EWPA is the suggested technique of features merging, which is much superior because the initial features had a long computing time, which was reduced after the feature selection stage.

Figure 12: MCC comparison of classifiers
Implications of Experimentation Analysis: The results achieved by classifiers are measured in terms of precision, recall, F-measure, accuracy, MCC, and error. The results achieved by the proposed system have 10.8752%, 9.3421%, 2.9766%, and 1.9917% higher precision when compared to Dense-kUNet with MSVM, UNet, SCU-Net, denseNet-DL, and DQN. Similarity proposed system has 14.087%, 12.3991%, 4.7691%, and 1.9158% higher recall when compared to Dense-kUNet with MSVM, UNet, SCU-Net, denseNet-DL, and DQN. The proposed system has 12.5148%, 10.2492%, 4.1492%, and 1.9539% higher F-measure when compared to Dense-kUNet with MSVM, UNet, SCU-Net, denseNet-DL, and DQN. The proposed system has 14.6522%, 11.7447%, 4.5242%, and 2.7119% higher accuracy when compared to Dense-kUNet with MSVM, UNet, SCU-Net, denseNet-DL, and DQN. The proposed system has 14.1779%, 13.0000%, 6.0000%, and 1.9126% higher MCC when compared to Dense-kUNet with MSVM, UNet, SCU-Net, denseNet-DL, and DQN. Results analysis by MCC and accuracy shows how the proposed system will exactly detect the class than the other methods.
Using deep learning based approaches the automatic detection of BAC in has been achieved by Dense-kUNet with MSVM. Dense-kUNet combines the short-dense and long-summation connections of both approaches. Long-summation linkages are interconnected with the contractual and growing components to retain localized characteristics, while the teaching architecture extensive internet connectivity was introduced to the purchasing and growing routes, taking advantage of Dense-feature kUNet extraction functionality and combining the idea of kU-Net to progressively retrieve the characteristics to a finer scale. Using the dense block’s short skip connectivity and the Dense-kUNet submodules’ long skip connectivity, it can produce more exact image differentiation maps, and the skip connection between neighboring submodules. EWPA-based feature identification and an MSVM-based classifier are introduced to help locate and integrate the small sections of the identified BAC. Results achieved by the proposed classifier are 84.4333%, 84.5333%, 84.4833%, 86.8667%, 13.1333%, and 84.0000% for precision, recall, F-measure, accuracy, error, and MCC. It shows that the proposed system has 14.6522%, 11.7447%, 4.5242%, and 2.7119% higher when compared to other classifiers like UNet, SCU-Net, denseNet-DL, and DQN. In the future, data augmentation, filtering methods for noise removal, different optimization technologies, and novel deep learning methods for classification can be focused in future. In the present system, noises are presented in the input samples which may be solved by using filtering methods. It has a higher computation time for classification it may be solved by introducing parallel processing methods. Multi-modal biometrics by Conjugate 2DPalmHash Code (CTDPHC) has been used for securing the patient details in BAC.
Acknowledgement: The author would like to thank the Deanship of Scientific Research at Shaqra University for supporting this work.
Funding Statement: The author received no specific funding for this study.
Author Contributions: The author confirms contribution to the paper as follows: study conception and design: Afnan M. Alhassan; analysis and interpretation of results: Afnan M. Alhassan; draft manuscript preparation: Afnan M. Alhassan. The author reviewed the results and approved the final version of the manuscript.
Availability of Data and Materials: The dataset adopted in the current study is publicly available online.
Conflicts of Interest: The author declares that she have no conflicts of interest to report regarding the present study.
References
1. S. McLenachan, F. Camilleri, M. Smith, D. E. Newby, and W. C. Williams, “Breast arterial calcification on mammography and risk of coronary artery disease: A SCOT-HEART sub-study,” Clin. Radiol., vol. 74, no. 6, pp. 421–428, 2019. doi: 10.1016/j.crad.2019.01.014. [Google Scholar] [PubMed] [CrossRef]
2. E. J. E. Hendriks, P. A. deJong, G. Y. van der, W. P. Th. M. Mali, S. Y. T. van der and J. W. J. Beuelens, “Breast arterial calcifications: A systematic review and meta-analysis of their determinants and their association with cardiovascular events,” Atherosclerosis, vol. 239, pp. 11–20, 2015. doi: 10.1016/j.atherosclerosis.2014.12.035. [Google Scholar] [PubMed] [CrossRef]
3. P. F. Schnatz, K. A. Marakovits, and D. M. O’Sullivan, “The association of breast arterial calcification and coronary heart disease,” Obstet. Gynecol., vol. 117, pp. 233–241, 2011. doi: 10.1097/AOG.0b013e318206c8cb. [Google Scholar] [PubMed] [CrossRef]
4. L. Mostafavi et al., “Prevalence of coronary artery disease evaluated by coronary CT angiography in women with mammographically detected breast arterial calcifications,” PLoS One, vol. 10, no. 4, pp. e0122289, 2015. doi: 10.1371/journal.pone.0122289. [Google Scholar] [PubMed] [CrossRef]
5. N. R. Aggarwal et al., “Sex differences in ischemic heart disease: Advances, obstacles, and next steps,” Circ.: Cardiovasc. Qual. Outcomes, vol. 11, no. 2, pp. e004437, 2018. doi: 10.1161/CIRCOUTCOMES.117.004437. [Google Scholar] [PubMed] [CrossRef]
6. M. Garcia, S. L. Mulvagh, C. N. B. Merz, J. E. Buring, and J. E. Manson, “Cardiovascular disease in women: Clinical perspectives,” Circ. Res., vol. 118, no. 8, pp. 1273–1293, 2016. doi: 10.1161/CIRCRESAHA.116.307547. [Google Scholar] [PubMed] [CrossRef]
7. E. J. Hendriks, P. A. de Jong, Y. van der Graaf, W. P. Mali, Y. T. van der Schouw and J. W. Beulens, “Breast arterial calcifications and their association with incident cardiovascular disease and diabetes: the Prospect-EPIC cohort,” Journal of the American College of Cardiology, vol. 65, no. 8, pp. 859–860, 2015. [Google Scholar] [PubMed]
8. J. Wang, H. Ding, F. A. Bidgoli, B. Zhou, and C. Iribarren “Detecting cardiovascular disease from mammograms with deep learning,” IEEE Transactions on Medical Imaging, vol. 36, pp. 1172–1181, 2017. [Google Scholar] [PubMed]
9. P. F. AlGhamdi, M. Abdel-Mottaleb, and F. Collado-Mesa, “Du-Net: Convolutional network for the detection of arterial calcifications in mammograms,” IEEE T. Med. Imaging, vol. 39, no. 10, pp. 3240–3249, 2020. [Google Scholar]
10. J. Wang et al., “Detecting cardiovascular disease from mammograms with deep learning,” IEEE Trans. Med. Imaging, vol. 36, pp. 1172–1181, 2017. doi: 10.1109/TMI.2017.2655486. [Google Scholar] [PubMed] [CrossRef]
11. M. AlGhamdi, M. Abdel-Mottaleb, and F. Collado-Mesa, “Du-Net: Convolutional network for the detection of arterial calcifications in mammograms,” IEEE T. Med. Imaging, vol. 39, no. 10, pp. 3240–3249, 2020. doi: 10.1109/TMI.2020.2989737. [Google Scholar] [PubMed] [CrossRef]
12. J. J. Mordang, A. Gubern-Mérida, G. den Heeten and N. Karssemeijer, “Reducing false positives of microcalcification detection systems by removal of breast arterial calcifications,” Med. Phys., vol. 43, no. 4, pp. 1676–1687, 2016. doi: 10.1118/1.4943376. [Google Scholar] [PubMed] [CrossRef]
13. Z. Huang et al., “The correlation of deep learning-based CAD-RADS evaluated by coronary computed tomography angiography with breast arterial calcification on mammography,” Sci. Rep., vol. 10, no. 1, pp. 1–8, 2020. doi: 10.1038/s41598-020-68378-4. [Google Scholar] [PubMed] [CrossRef]
14. K. Wang, N. Khan, and R. Highnam, “Automated segmentation of breast arterial calcifications from digital mammography,” in 2019 Int. Conf. Image Vis. Comput. (IVCNZ), New Zealand, IEEE, 2019, pp. 1–6. [Google Scholar]
15. J. Y. Yeh, S. Y. Wu, and S. Chan, “Using a region growth algorithm and deep reinforcement learning for detecting breast arterial calcification in mammograms,” J. Inf. Sci. Eng. , vol. 37, pp. 4, 2021. doi: 10.6688/JISE.202107_37(4).0002. [Google Scholar] [CrossRef]
16. B. S. Abunasser, M. R. J. Al-Hiealy, I. S. Zaqout, and S. S. Abu-Naser, “Convolution neural network for breast cancer detection and classification using deep learning,” Asian Pac. J. Cancer Prev.: vol. 24, no. 2, pp. 1–14, 2023. doi: 10.31557/APJCP.2023.24.2.531. [Google Scholar] [PubMed] [CrossRef]
17. A. Raza, N. Ullah, J. A. Khan, M. Assam, A. Guzzo and H. Aljuaid, “Deep breast cancer net: A novel deep learning model for breast cancer detection using ultrasound images,” Appl. Sci., vol. 13, no. 4, pp. 1–19, 2023. doi: 10.3390/app13042082. [Google Scholar] [CrossRef]
18. N. K. Chebbah, M. Ouslim, and S. Benabid, “New computer aided diagnostic system using deep neural network and SVM to detect breast cancer in thermography,” Quant. Inf. Ther. J., vol. 20, no. 2, pp. 62–77, 2023. doi: 10.1080/17686733.2021.2025018. [Google Scholar] [CrossRef]
19. J. E. Gutierrez et al., “Automated deep learning empowered breast cancer diagnosis using biomedical mammogram images,” Comput. Mater. Con., vol. 71, no. 3, pp. 4221–4235, 2022. doi: 10.32604/cmc.2022.022322. [Google Scholar] [CrossRef]
20. R. F. Mansour, “A robust deep neural network based breast cancer detection and classification,” Int. J. Comput. Intell. Appl., vol. 19, no. 1, pp. 2050007, 2020. doi: 10.1142/S1469026820500078. [Google Scholar] [CrossRef]
21. R. S. Lee, F. Gimenez, A. Hoogi, K. K. Miyake, M. Gorovoy and D. L. Rubin, “A curated mammography data set for use in computer-aided detection and diagnosis research,” Sci. Data, vol. 4, no. 1, pp. 1–9, 2017. doi: 10.1038/sdata.2017.177. [Google Scholar] [PubMed] [CrossRef]
22. H. Gao, Z. Liu, L. V. D. Maaten, and K. Q. Weinberger, “Densely connected convolutional networks,” in Proc. IEEE Comput. Vis. Pattern Recognit., 2017, pp. 4700–4708. [Google Scholar]
23. X. Y. Chen, C. J. Tang, J. Wang, L. Zhang, and Y. Liu, “A novel hybrid based on wolf pack algorithm and differential evolution algorithm,” in 2017 10th Int. Symp. Comput. Intell. Design (ISCsID), 2017, vol. 1, pp. 69–74. doi: 10.1109/ISCID.2017.63. [Google Scholar] [CrossRef]
Cite This Article
 Copyright © 2024 The Author(s). Published by Tech Science Press.
This work is licensed under a Creative Commons Attribution 4.0 International License , which permits unrestricted use, distribution, and reproduction in any medium, provided the original work is properly cited.
 Downloads
 Citation Tools