 Open Access
ARTICLE
Detection Algorithm of Laboratory Personnel Irregularities Based on Improved YOLOv7
School of Electrical Engineering, Guizhou University, Guiyang, 550025, China
* Corresponding Author: Linghua Xu. Email:
Computers, Materials & Continua 2024, 78(2), 2741-2765. https://doi.org/10.32604/cmc.2024.046768
Received 14 October 2023; Accepted 18 December 2023; Issue published 27 February 2024
Abstract
Due to the complex environment of the university laboratory, personnel flow intensive, personnel irregular behavior is easy to cause security risks. Monitoring using mainstream detection algorithms suffers from low detection accuracy and slow speed. Therefore, the current management of personnel behavior mainly relies on institutional constraints, education and training, on-site supervision, etc., which is time-consuming and ineffective. Given the above situation, this paper proposes an improved You Only Look Once version 7 (YOLOv7) to achieve the purpose of quickly detecting irregular behaviors of laboratory personnel while ensuring high detection accuracy. First, to better capture the shape features of the target, deformable convolutional networks (DCN) is used in the backbone part of the model to replace the traditional convolution to improve the detection accuracy and speed. Second, to enhance the extraction of important features and suppress useless features, this paper proposes a new convolutional block attention module_efficient channel attention (CBAM_E) for embedding the neck network to improve the model’s ability to extract features from complex scenes. Finally, to reduce the influence of angle factor and bounding box regression accuracy, this paper proposes a new α-SCYLLA intersection over union (α-SIoU) instead of the complete intersection over union (CIoU), which improves the regression accuracy while increasing the convergence speed. Comparison experiments on public and homemade datasets show that the improved algorithm outperforms the original algorithm in all evaluation indexes, with an increase of 2.92% in the precision rate, 4.14% in the recall rate, 0.0356 in the weighted harmonic mean, 3.60% in the mAP@0.5 value, and a reduction in the number of parameters and complexity. Compared with the mainstream algorithm, the improved algorithm has higher detection accuracy, faster convergence speed, and better actual recognition effect, indicating the effectiveness of the improved algorithm in this paper and its potential for practical application in laboratory scenarios.Keywords
For several years, in higher education, the laboratories of major universities carried out teaching and scientific research tasks in an important place, due to the variety of equipment, and the quantity of large and varying levels of operators, there are many safety hazards, especially all kinds of chemical and biological, electrical and mechanical laboratories, is very easy to cause safety accidents due to irregular behavior of personnel. In the past decade, more than 10,000 safety accidents of various types have occurred in laboratories of colleges and universities nationwide, resulting in nearly 100 casualties [1]. In February 2023, the Ministry of Education of the People’s Republic of China in the issuance of the “Safety Code for Laboratories in Higher Educational Institutions” made it clear that: the laboratories of colleges and universities should establish and improve the safety classification and classification management system, and the experimental personnel using the laboratories should sign the safety responsibility book or letter of commitment, and the use of the important hazardous sources should be carried out first Risk assessment [2].
At present, university laboratory managers will develop laboratory safety guidelines according to the characteristics of the laboratory research task, such as general laboratory are prohibited from smoking, chemical, and biological laboratories are prohibited from eating and drinking, mechatronics laboratories are prohibited from doing phone calls, play cell phones and other distractions. However, due to the complexity of the laboratory environment, personnel to and from the intensive safety management work mainly rely on institutional constraints, education and training, and on-site supervision, there are management difficulties, high cost, low efficiency, and other issues, personnel irregularities occur frequently, and are very likely to cause safety hazards. According to Heinrich’s theoretical model, it is known that about 85% to 90% of safety accidents are induced by human irregular behavior [3]. Therefore, to reduce the safety hazards brought by personnel’s irregular behavior in the laboratory, there is a pressing need for low-cost, intelligent monitoring means to effectively detect laboratory personnel’s irregular behavior.
As deep learning rapidly advances, Two main forms of object detection technologies exist one-stage detection algorithms and two-stage detection algorithms. The region-based convolutional neural network (R-CNN) [4], Fast R-CNN [5], Faster R-CNN [6], etc. are examples of two-stage detection algorithms. Although the training period is lengthy and the detection speed is low, the model’s detection precision is good. Single Shot MultiBox Detector (SSD) [7], You Only Look Once (YOLO) series, etc., are examples of one-stage detection algorithms. Although compared to the Two-stage, the model’s detection precision has fallen, training time has been significantly reduced, and detection speed has improved noticeably.
At present, many scholars domestic and overseas have applied the above object detection algorithms in practical scenarios. Rashmi et al. [8] proposed a real-time student monitoring system that is based on a transfer learning approach using YOLOv3 for student action recognition and localization in computer lab scenarios. Liu [9] proposed a three-dimensional convolutional network-based personnel unsafe behavior pattern recognition method for preventing safety accidents in chemical laboratories and defined five typical laboratory personnel unsafe behaviors. Huang [10] realized the purpose of identifying unsafe behaviors of chemical laboratory personnel by integrating attention mechanism and Vision transformation in the time-domain segmentation network according to the actual scene requirements of the chemistry laboratory. Cao et al. [11] improved the algorithm detection precision by designing the feature pyramid network (FPN) and path aggregation network (PAN) structure based on YOLOv5 [12], but increased the number of model parameters and reduced the detection rate. Bodla et al. [13] improved the model’s detection rate of hidden targets by improving the target prediction frame score strategy and increasing the quantity of target prediction frames. Hu et al. [14] proposed a YOLOv5n-based detection algorithm for detecting underwater trash, which aims to improve the accuracy of underwater garbage detection by modifying the backbone network and the feature pyramid structure to enhance the feature extraction capability of the model for the complex underwater environment with insufficient light, and by optimizing the loss function. Niu et al. [15], based on the YOLOv5 model, proposed to adopt MobileViT as the network framework and drew into the attention mechanism and the focal efficient intersection over union (EIoU) to enhance the target recognition and localization accuracy. Wu et al. [16] proposed a more suitable ship-sized anchor frame to replace the fixed anchor frame used in the traditional YOLOv7 model [17] and introduced a novel multi-scale feature fusion module to enhance the precision of ship detection and recognition. Based on the YOLOv7 algorithm, Wang et al. [18] proposed an algorithm TBC-YOLOv7 for tea bud classification and detection in a complex context, which added a transformer structure to promote self-attention learning and enhance the integration of global feature information. Khan et al. [19] utilized the collaborative techniques of blockchain, IoT, and artificial intelligence with machine learning to design a blockchain with a permissionless network structure that supports IoT to address the issues of integrity, transparency, and reliability that exist in cross-chain platforms. Khan et al. [20] proposed a sawtooth framework for a blockchain-based Hyperledger. It enables the exchange of information between connected devices in the Industrial Internet of Things with limited resource utilization.
At present, for the specific scenario of the laboratory, due to its complex environment, and dense personnel traffic, behavior is easy to obscure, for the management of personnel irregular behavior still mainly relies on institutional constraints, education and training, on-site supervision, and other ways to carry out, which is both time-consuming and laborious, and will be mainstream algorithms applied in the laboratory scenarios generally have low detection accuracy, slow speed problems, is very prone to omission, misjudgment situation. Therefore, there is an urgent need for an efficient detection algorithm for personnel irregular behavior in laboratory scenarios to solve this problem. As shown in Fig. 1, it is a common laboratory scene.

Figure 1: Laboratory scene
To address the aforementioned issues, this paper proposes an improved YOLOv7 target detection algorithm, targeting the corresponding characteristics of laboratory scenarios and personnel behaviors, from the convolution method, attention mechanism, and loss function to improve the detection accuracy based on reducing the number of parameters and complexity of the model, to achieve the purpose of real-time monitoring of laboratory personnel behavior.
The following are the primary cited in this paper:
(1) To address the issue of insufficient feature extraction in the target area in laboratory scenarios due to a large number of personnel and dense comings and goings, we utilize DCN [21] to replace the traditional convolution, which enhances the model’s ability to capture the target features and reduces the model complexity.
(2) To address the issue of difficult detection of people’s behavior after being occluded in laboratory scenarios, this paper adds the CBAM_E attention module to the two effective input layers of the neck network to strengthen the model’s ability to extract important features of the target, suppressing the useless features, and improving the detection rate in the complex laboratory scenarios.
(3) To address the issue of the camera angle factor on target detection and the weighted optimization of the bounding box regression accuracy in laboratory scenes, this paper replaces the bounding box loss function CIoU [22] with α-SIoU [23] to more accurately measure the bounding box overlap situation, and to improve the model convergence speed and detection precision.
(4) To verify whether the algorithm’s effectiveness has been improved, this paper combines the public dataset and the homemade dataset to train and verify the algorithm and test the algorithm in real laboratory scenarios. Compared with other traditional algorithms, the detection speed and precision of the improved algorithm are significantly improved, and the test results are the best, fully demonstrating the efficacy of the algorithm enhancement suggested in this paper.
2 YOLOv7 Algorithm Introduction and Optimization
The YOLOv7 algorithm is a new generation of the YOLO family of algorithms proposed by Alexey Bochkovskiy’s team in July 2022. It is based on YOLOv5 with the main aim of optimizing the speed and accuracy of the model. Four parts make up the algorithm: Input, Backbone, Neck, and Head Prediction.
The input part is mainly to reduce or enlarge the input image to a fixed size to meet the input size criteria set by the backbone part.
The backbone part includes three components: the CBS module, the efficient local attention network (E-ELAN) module and the mixed precision convolutional (MPConv) module. The CBS module consists of the convolution layer, the BN layer with the silu function, and the E-ELAN module is constructed by splicing multiple CBS modules together. The MPConv module is formed by splicing the CBS module and the Maxpool.
The neck part adopts the spatial pyramid pooling with cross-stage partial convolution (SPPCSPC) structure [24], which calculates the information of the target’s category, location, and size by convolution operation based on the pixel information in the input Feature Map and performs feature extraction.
The head prediction part processes the feature maps extracted from the backbone part and the neck part, then combines all the prediction results into a target frame to obtain the final predicted target [25,26]. The system structure is shown in Fig. 2.
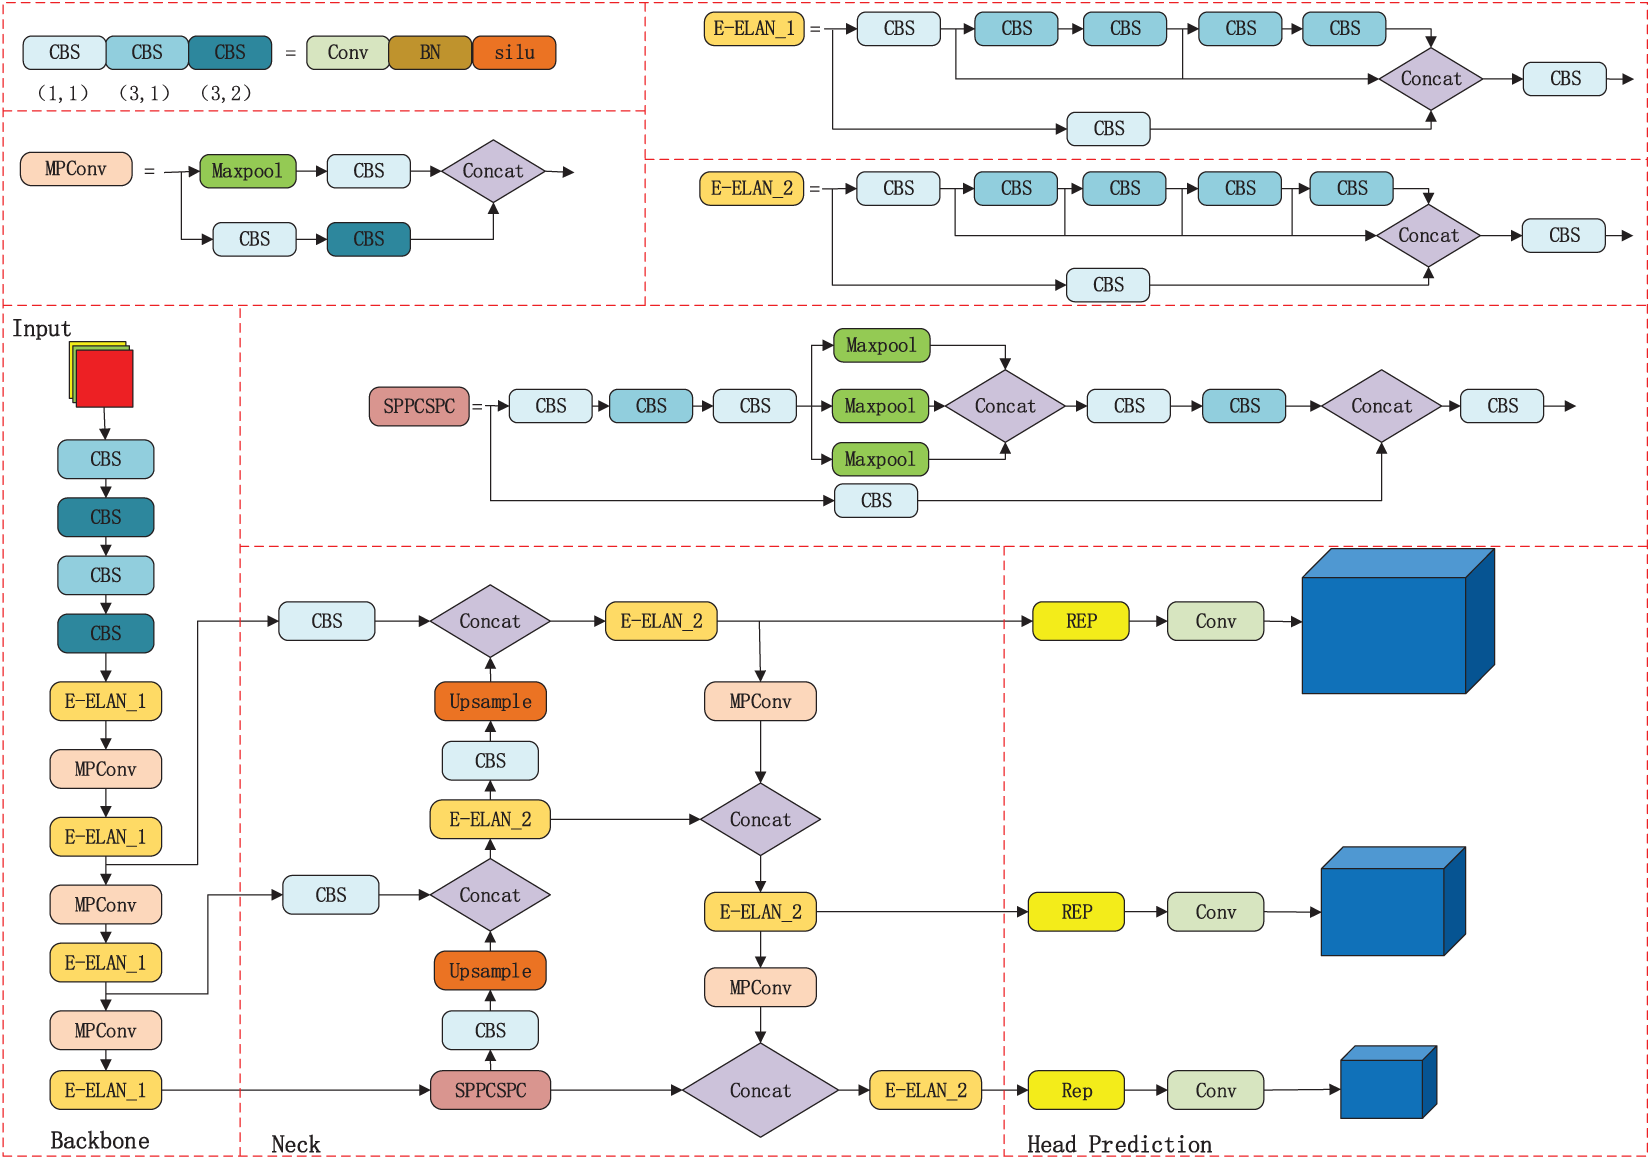
Figure 2: Structure of YOLOv7 algorithm system
Deep learning has made extensive use of attention mechanisms, particularly in computer vision and natural language processing, it can effectively solve the trade-off between computational resources and precision due to the excessive amount of information when dealing with long sequences or complex data structures [27].
Attention mechanisms in deep learning can be categorized into three major groups: global attention mechanisms, local attention mechanisms, and self-attention mechanisms [28]. Among them, the global attention mechanism assigns weights between 0 and 1 to each input item, and most of the information is taken into account, but to varying degrees, and is more computationally intensive; the local attention mechanism allocates the weight of each input item to neither 0 nor 1, and directly abandons some irrelevant items, which reduces the time cost and calculation cost, but may lose some information; the self-attention mechanism assigns a weight to each input based on the interaction between them, i.e., the part that determines attention internally, and has the advantage of parallel computation when dealing with longer inputs. The proper introduction of an attention mechanism can make the model pay greater attention to the important features of the input, reduce the interference of invalid targets, and enhance the overall recognition effect of the network model.
Loss function optimization in object detection determines where the prediction frame is placed. This loss function is usually set to the intersection over union (IoU) ratio between the predicted frame and the actual target frame. If the value of the intersection and merger ratio is higher, it means that the prediction frame is closer to the actual target frame, which means that the prediction frame is more accurate in localization. Therefore, optimizing the position of the prediction frames while training the target recognition model needs to be achieved by maximizing the intersection and merger ratio to improve the precision of the prediction frames [29]. Among them, the generalized IoU (GIoU) [30], which combines IoU and global information (GI), refers to the calculation of a minimum closed convex surface C of any two shapes A and B, and then calculating the ratio of the area of C after removing A and B to the original area of C. Finally, GIoU Loss obtained by subtracting this ratio from the original IoU can more accurately measure the degree of overlap between the target frame and the predicted frame and is less sensitive to the scale change. Based on the GIoU loss function, distance IoU (DIoU) [31] solves the problem of lateral offset and size mismatch between the prediction frame and target frame by introducing aspect ratio measurement and directly minimizes the normalized distance of center point between the target frame and prediction frame, that is, the center of prediction frame quickly converges toward target center. Thus, the accuracy of target recognition is further improved. CIoU is based on the idea of GIoU and DIoU loss function, which takes into account both the position and size difference between boxes and the overlapping area between them, as well as the center of mass, width, and height information of the overlapping area between them, when calculating the distance between the target box and the predicted box, aiming to improve the precision and stability of the target recognition algorithm.
3 Model Improvement and Optimization
3.1 DCN-Based Feature Extraction Network
In computer vision, the same detection target will produce different geometric deformations in different scenes and angles, which affects the detection effect. Traditional convolutional networks can only extract the features of the rectangular box, each convolutional kernel in the processing of image data at each location is the same, and can not adapt to process different locations of the image context information, resulting in some of the image region feature extraction is not sufficient, affecting the detection speed, and in the processing of high-resolution images when the traditional convolutional network is more time-consuming, is not conducive to efficient target detection.
Therefore, this paper proposes the use of deformable convolution to improve the accuracy of target feature extraction given the complex laboratory environment and the irregular and difficult-to-identify personnel behavior. DCN considers that the position of convolution is variable and will change with the target displacement, instead of fixing on the traditional N × N grid to do convolution, it can adaptively adjust the sensing field and sampling position, which makes the convolution kernel can be extended to a large range during the training process. Therefore, compared with the existing traditional convolutional networks, variability convolution can be more flexible in perceiving the features of the input image, thus improving the performance of the model.
The convolution method is to add an offset at each point on the standard convolution kernel, and different convolution kernel structures are obtained based on different offset data. The deformable convolutional structure is shown in Fig. 3.

Figure 3: Deformable convolutional structures
Where: (a) is the standard 3 × 3 convolution, (b), (c), and (d) are the deformable convolution kernels after the offset, the arrows are the direction of displacement, and the red dots are the new convolution points.
The deformable convolution process is shown in Fig. 4.
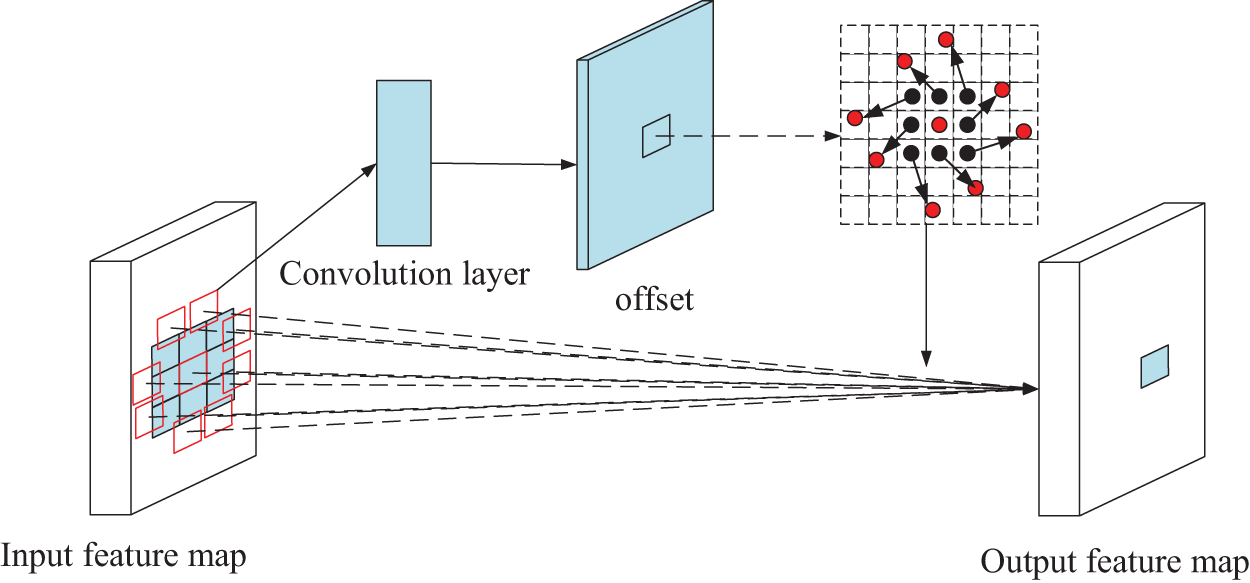
Figure 4: Deformable convolution process
As an example of ordinary 3 × 3 convolution, a set of pixel points are sampled from the input feature map and the sampling result is calculated using the convolution operation to get the result after the convolution operation. The formula is shown in Eq. (1).
where:
Since deformable convolution is a modification of the sampling result, thus indirectly realizing the effect of changing the shape of the convolution kernel, it is possible to use Expansion on the input feature map. The formula is shown in Eq. (2).
where:
The deformable convolutional network will fine-tune the position of the convolutional kernel to make it easier to adapt to the target’s deformation, which can improve model performance and precision without affecting the model’s computation and speed. The convolutional layer with 1 × 1 convolutional kernel in the backbone part is mainly used for cross-channel aggregation, which is convenient for upscaling and downscaling of the model, and does not carry out the aggregation operation of the image, to decline the amount of model parameter computation, we only replace the 3 × 3 convolutional layer in the backbone part with the DCN. Taking the MPConv module as an example, the deformable convolution process is shown in Fig. 5.
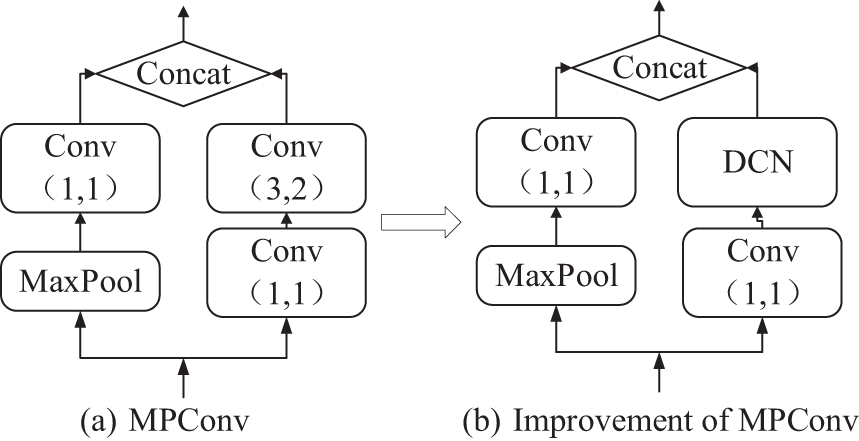
Figure 5: MPConv module deformable convolution process
3.2 Feature Fusion Network Based on CBAM_E Attention Mechanism
The scene in the university laboratory is complex, with a high volume of people coming and going, there is a lot of redundant information, personnel behavior is easily obscured, and it is not easy to carry out personnel behavior detection. To strengthen the detection of image features, make the algorithm pay greater concern to the behavioral characteristics of the personnel, and enhance the detection precision of the algorithm, this paper proposes a CBAM_E Attention Module based on the convolutional block attention module (CBAM) [32,33] in the feature fusion part of YOLOv7 algorithm. Firstly, the optimized channel attention module is used to enhance the fusion of information between channels, while the spatial attention module can focus on detecting the target location, secondly, by replacing the connection between the two, it enables the model to differentially weight the image features for learning. Compared with the original model, the application of the CBAM_E attention module can help the model to extract and focus on the key information in the image in a targeted way when processing the image, and then capture the key features more accurately and suppress the useless features, to achieve the purpose of improving the detection accuracy of the occluded person in the laboratory scene.
The CBAM attention module is divided into two parts, the channel attention module (CAM) and spatial attention module (SAM), and the network structure is shown in Fig. 6.

Figure 6: CBAM network structure
The role of the channel attention module is to calculate the importance of each channel in the model to better distinguish features between different channels. The structure is shown in Fig. 7.

Figure 7: Structure of channel attention
For an input feature, the feature
where:
The spatial attention module, on the other hand, weights each pixel in the corresponding two-dimensional space, allowing the model to better focus on the pixel regions of the image that play a role in determining the classification and ignore irrelevant regions [34]. The structure is shown in Fig. 8.

Figure 8: Structure of spatial attention
For channel attention mechanism output feature 1, the formula for feature 2 obtained after spatial attention mechanism is shown in Eq. (4).
where:
Since the quantity of parameters in the original channel attention module is proportional to the square of the number of channels, and when global maximum pooling and mean pooling operations are carried out in a channel, it is easy to ignore the information interaction within the channel. To reduce the model computation, reference [35] proposed to introduce the efficient channel attention (ECA) [36] module idea.
Firstly, the global maximum pooling operation is discarded and only the information of a feature map is aggregated by mean pooling; then the original multi-layer perceptron (MLP) network is replaced by a one-dimensional convolution operation with convolutional kernel size K to strengthen the information interaction capability between channels; finally, it is output by the Sigmoid function. The improved channel attention module is shown in Fig. 9.

Figure 9: Structure of improved CAM
The existing CBAM attention module is a “serial” structure, i.e., the CAM module is enabled first to modify the input feature layer, and then the SAM module is enabled to weigh the output feature layer. In this process, the features learned by the SAM module will be interfered with by the CAM module, which affects the precision of the model. To solve this problem, reference [37] proposed to connect the CAM module and SAM in “parallel”, i.e., both modules directly learn the original input feature layer, and after obtaining the corresponding weights, the weights are directly weighted with the original input feature layer to obtain the output feature layer. The structure of the improved CBAM is shown in Fig. 10.
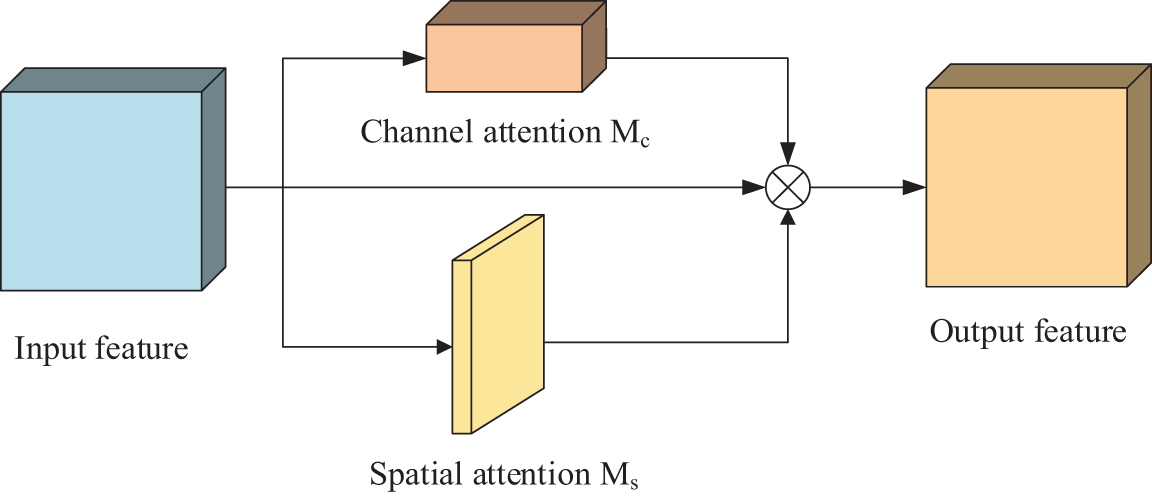
Figure 10: Structure of improved CBAM
To the model’s discriminative weighted learning of image features for the laboratory scenario where people come and go intensively and people are easily occluded, this paper introduces the methods in both the reference [35] and the reference [37], and makes the following improvements to the CBAM attention module:
(1) Remove the global maximum pooling operation in the CAM module and apply one-dimensional convolution to replace the original MLP network;
(2) Parallel connection of the improved CAM module with the original SAM module to reduce the mutual influence of the two modules.
The improved CBAM_E attention module is shown in Fig. 11.
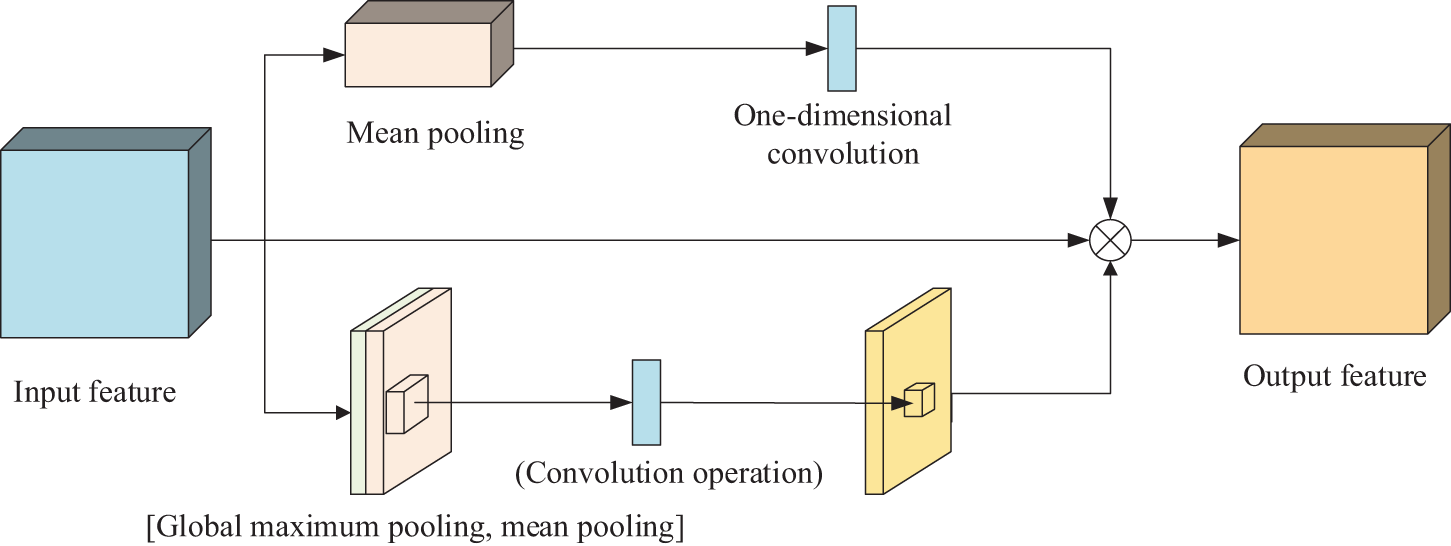
Figure 11: Structure of improved CBAM_E
The formula is shown in Eq. (5).
where:
In this paper, according to the actual test, we add the CBAM_E attention mechanism after the two input feature layers of the neck network can effectively enhance the model’s feature extraction ability and improve the accuracy of target detection.
3.3 Improvement of Bounding Box Loss Function Based on α-SIoU
In YOLOv7, CIoU is mainly used for the calculation of the bounding box loss. The formulas are shown in Eqs. (6)–(8).
where:
CIoU introduces a penalty term
Considering the influence of the camera angle factor on laboratory target detection and the optimization of the bounding box regression accuracy weighting method, this paper adopts the improved α-SIoU as the calculation method of the bounding box loss. α-SIoU takes the SIoU loss function as the basis function, takes into account the problem of the vector angle between the target frame and the real frame, and carries out the weighting method of the bounding box regression accuracy through the introduction of the hyperparameter α Optimization. This calculation method can make the model pay more attention to the direction matching between the target frame and the real frame in the regression process, to better guide the model to regression, and the optimization of the weighting method of the bounding box regression accuracy can make the model pay more attention to the position and shape of the bounding box during the regression process, and adjust the regression strategy of the model according to the specific scene to reduce the rate of leakage detection, which is more applicable in the laboratory This kind of complex scene. The base loss function is the SIoU loss function [38], and the penalty indicator is redefined by considering the influence of camera angle factors on detection. The formula is shown in Eq. (9).
where:
The four main components involved are angle loss, distance loss, shape loss, and IoU loss.
Angular loss uses a sinusoidal function to measure the angular difference between the true and predicted frames, which can drive the model to better fit the target. The parameter map is shown in Fig. 12.
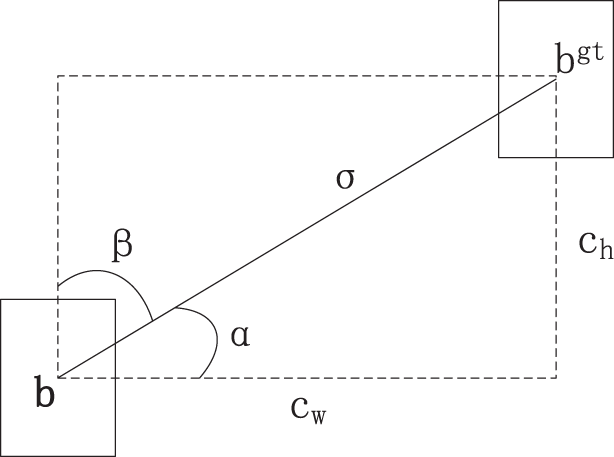
Figure 12: Angle loss parameter diagram
The formulas for calculating the angle loss assessment are shown in Eqs. (10)–(13).
where: (
The distance loss is the difference between the offsets and scale changes of the centroids of the real and predicted frames, indicating the error in position and scale produced by the predicted frame compared to the true value. The formulas are shown in Eqs. (14)–(17).
where:
The difference in form between the predicted box and the real box is represented by the shape loss. The formulas are shown in Eqs. (18)–(20).
where:
IoU Indicates the overlap rate of the predicted box and the real box, that is, the union value of the intersection and union of the predicted box and the real box. The formula is shown in Eq. (21).
Reference [18] showed a new alpha-IoU loss function by introducing the hyperparameter α in the loss function at IoU. The formula is shown in Eq. (22).
Choosing the right α improves the performance of the detector, and this weighting not only provides a great deal of flexibility in achieving regression accuracy for different bounding boxes, but the parameters do not increase additionally. Therefore, in this paper, the hyperparameter α is also introduced in SIoU for the optimization of the accuracy of the bounding box regression. The improved loss function formula is shown in Eq. (23).
In this paper, we propose an algorithm for detecting irregular behavior of laboratory personnel based on improved YOLOv7. The algorithm makes the following three improvements over YOLOv7:
(1) In the backbone part, the ordinary convolutional layer is replaced with DCN to enhance the capture of target shape features.
(2) In the neck part, the CBAM_E module is inserted into the two effective input layers to make the network pay greater attention to important features and suppress useless features.
(3) In the prediction head, to accelerate the model’s convergence, the bounding loss function α-SIoU is employed instead of CIoU.
The structure of the improved YOLOv7 model is shown in Fig. 13.
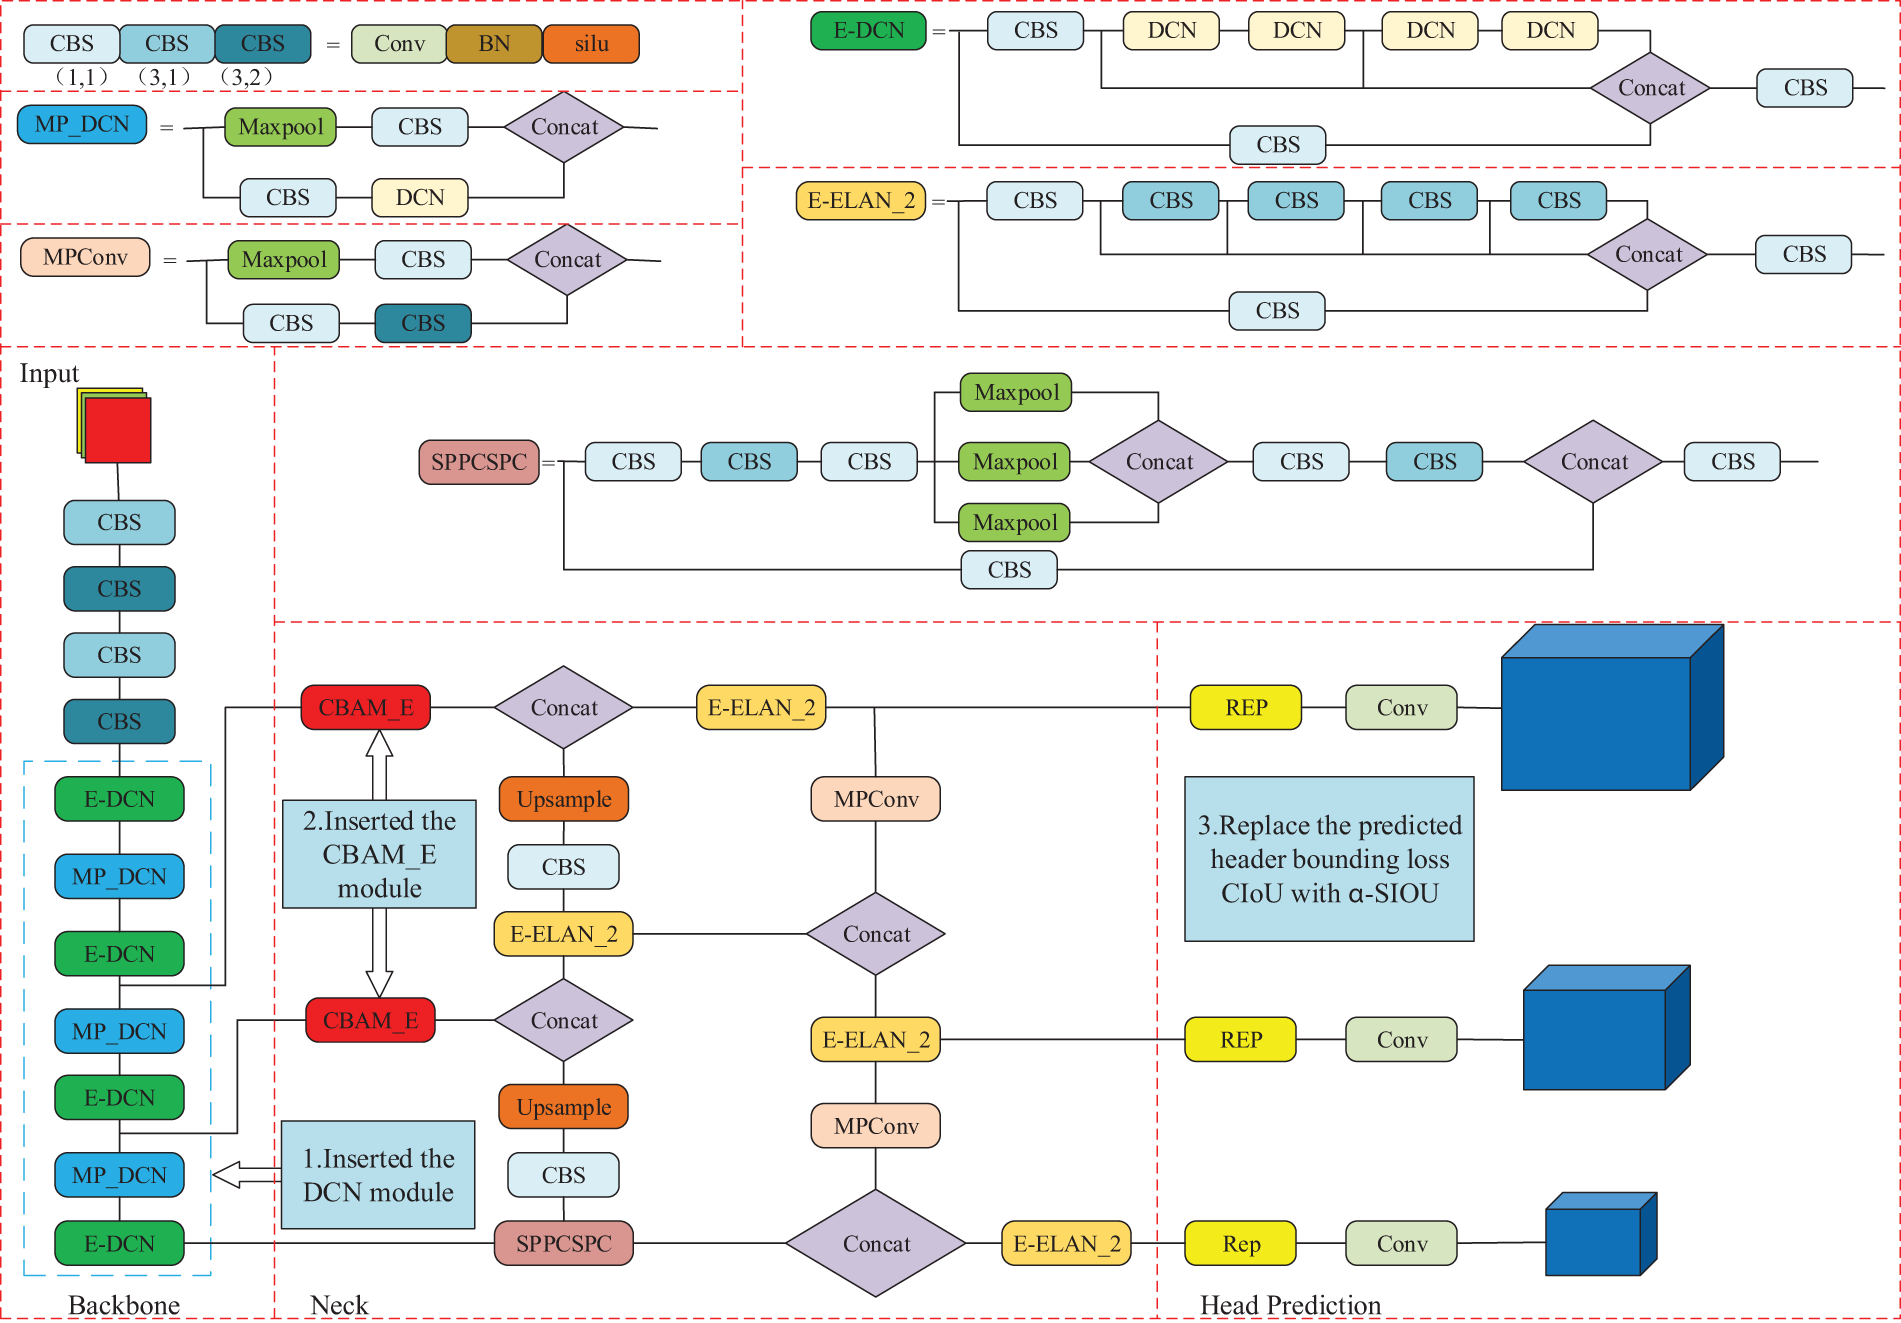
Figure 13: Improvement of YOLOv7 algorithm system structure diagram
4 Experimental Results and Data Analysis
The experimental operating system of this paper is Ubuntu 18.04, the CPU is i9-12900K, the graphics card is NVIDIA GeForce RTX 4090 with 24 GB of video memory, the Pytorch 1.13.1 framework is used to run the code, the CUDA version is 11.7.64, the IDE is Pycharm 2023.2.1, and the training environment is the same as the test environment.
For the rules and regulations in most laboratory scenarios, we select four of the common irregular behaviors, i.e., “calling”, “smoking”, “eating and drinking”, and “playing phone” as the experimental objects, and construct two types of datasets required in this paper: the personnel irregularities dataset and the safety sign dataset.
The personnel irregularities dataset is selected from the public datasets “HMDB51” [39] and “Hollywood2” [40]. Among them, the HMDB51 dataset was published by Brown University in 2011 and contains 51 categories of actions with a total of 6,849 videos, mostly from movies, public databases, and online video libraries; The Hollywood2 database was released by the IRISA Institute in 2009 and contains 12 types of actions and 10 different scenarios, with a total of 3,669 samples from 69 Hollywood movies. We selected a total of 350 samples in both datasets and used the Python technique to split the video clips into frames, a total of 5,000 images were selected, including 1,427 images of calling behavior, 1,368 images of smoking behavior, 1,208 images of eating and drinking behavior, and 997 images of playing phone behavior, with a total of 7085 people in the images.
The safety sign dataset is a self-made dataset, a total of 300 pictures of safety signs were collected through the network, and 2100 pictures were obtained after the pictures were expanded by using Python to randomly change the brightness and contrast, rotate and pan, and add Gaussian noise [41], including 689 of No calling signs, 664 of No Smoking signs, and 747 of No eat and drink signs. Some of the dataset images are shown in Fig. 14.
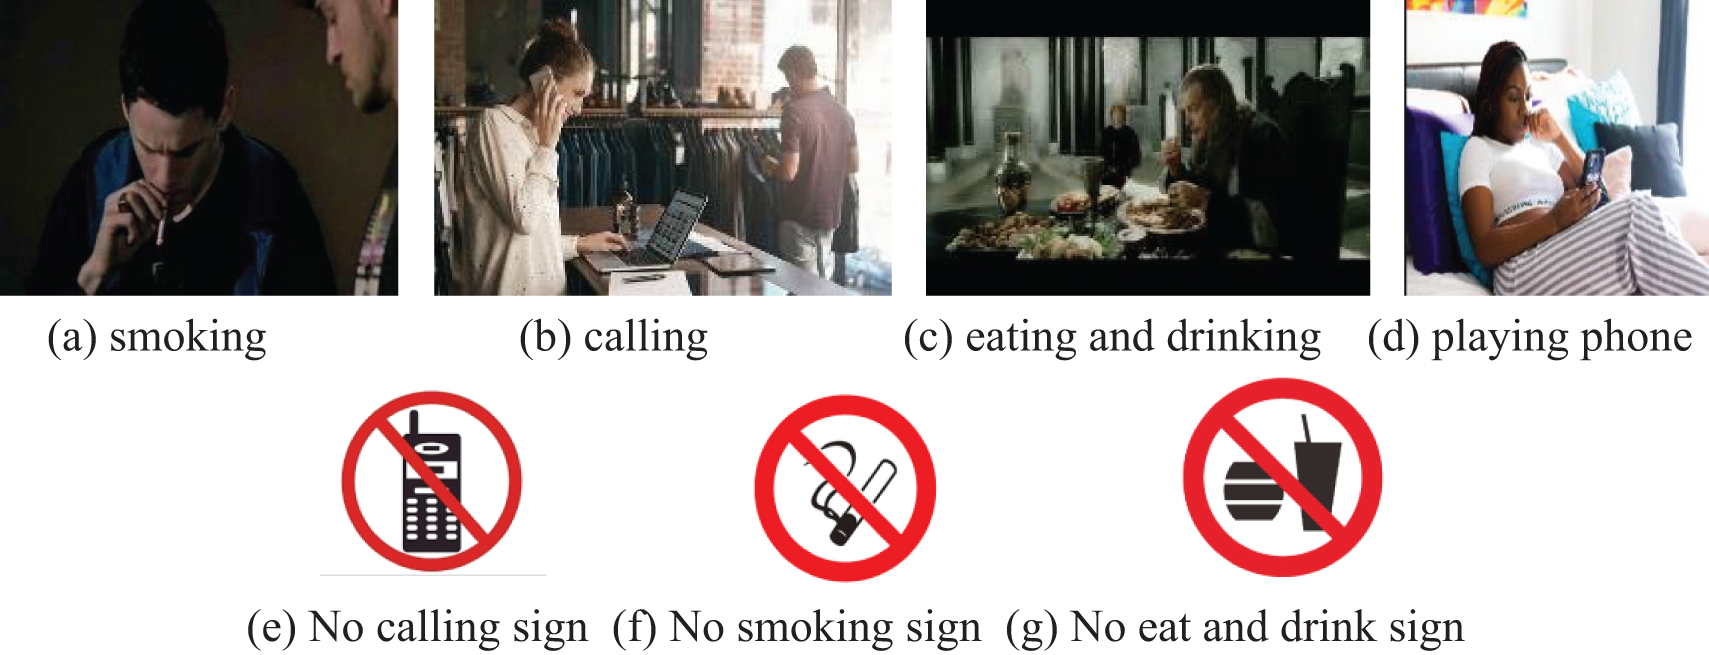
Figure 14: Pictures of selected experimental datasets
The experimental dataset was labeled using LabelImg software with the labels “person”, “calling”, “smoking”, “eating and drinking”, “playing phone”, “No calling sign”, “No smoking sign” and “No eat and drink sign”, which amounted to a total of 14,185 labels, and generate the corresponding .xml file. The training set, verification set, and test set are divided into an 8:1:1 ratio to satisfy the experimental requirements. Stochastic Gradient Descent (SGD) is used for training. The initial learning rate is set to 0.001 and the input image size is 640 × 640 pixels. Set the batch size to 16 and the epoch to 300. Table 1 shows the quantity of labels that are assigned to each category.

4.3 Experimental Evaluation Indicators
In this paper, Precision (P), Recall (R), Weighted Reconciliation Average (F1), Mean Average Precision (mAP), Parameters (Par), Floating Point Operations (Fs) and Weights (W) are used as the main evaluation indexes, where Parameters and FLOPs are measures of the computational complexity of the model and are proportional to it. The formulas are shown in Eqs. (24)–(29).
where:
4.4 Evaluation of Improved Algorithms
There are three improvements to the YOLOv7 algorithm in this paper. To examine the influence of each enhancement part on the model and verify its effectiveness, seven groups of different improvement methods were designed to compare and analyze the original model. All experiments were trained using identical parameters, environments, and data sets. Table 2 presents the results, where “✓” means the improvement method is applied, and “×” means the improvement method is not applied.

Through the analysis of experimental data, it can be seen that method 1 uses the DCN network structure to enhance the model’s ability to capture the target shape features and change the convolution mode. Compared with the original YOLOv7 model, the number of model parameters and complexity decreased by 23.81% and 24.67%, respectively. The precision rate, recall rate, F1 value, and mAP@0.5 are worthy of improvement, which indicates that DCN has better feature extraction capability.
Method 2 uses the method of adding a CBAM_E attention module to the neck network to make the model pay more attention to the important features of the target. Compared with the original model, the precision rate, recall rate, F1 value, and mAP@0.5 value are all improved. However, although the attention mechanism has been optimized, the number of parameters and complexity have decreased. However, it is far inferior to the optimization of the number and complexity of model parameters.
Method 3 uses α-SIoU to replace CIoU in the bounding box loss function, takes the angle factor and the optimization problem of the weighting method of the bounding box regression accuracy into account, and re-calculates the optimization of the prediction head loss function part, which reduces the number and complexity of model parameters. However, because of the recalculation of the model bounding box, more factors were considered compared with the original model, so the precision, recall, and F1 value decreased, but the overall model detection accuracy was improved to some extent.
Method 4 combines the DCN network structure and the CBAM_E attention module based on Method 1, which further improves the model’s ability to extract important features of the target and suppresses non-essential features based on effectively reducing the number of model parameters and complexity. Compared with Method 1, the precision rate is improved by 1.15%, the recall rate is improved by 2.96%, the F1 value is improved by 0.0210, the mAP@0.5 value is improved by 0.15%, the number of model parameters is reduced by 16.40%, and the model complexity is reduced by 11.71%.
Method 5 combines the DCN network structure and α-SIoU based on Method 1, taking into account the effect on the lightweight structure of the model after changing the calculation method of the loss function. Compared with Method 1, the precision is decreased by 3.03%, the recall is increased by 2.85%, the F1 value is decreased by 0.0148, the mAP@0.5 value is decreased by 1.11%, the number of model parameters is decreased by 24.10%, and the model complexity is decreased by 16.25%.
Method 6, on the other hand, adds α-SIoU to the Method 2 model to verify whether changing the calculation of the loss function will conflict with the attention mechanism and thus negatively affect the model. The final experimental results compared with Method 2, the precision is increased by 0.93%, the recall is increased by 0.68%, the F1 value is increased by 0.0050, the mAP@0.5 value is increased by 1.02%, the number of model parameters is decreased by 19.52%, and the model complexity is decreased by 19.63%.
Method 7 combines the three methods to verify the effectiveness of the three improved methods. Compared with the previous model, the precision rate, recall rate, F1 value and mAP@0.5 value of the model of method 7 are the best, and the number of parameters and complexity are the lowest.
In comparison to the original YOLOv7 algorithm, the final improved algorithm increased the precision by 2.92%, the recall by 4.14%, the F1 value by 0.0356, the mAP@0.5 value by 3.60%, and reduced the number of model parameters by 47.83%, while reducing the model complexity by 38.99%. The model detection precision is significantly improved.
4.4.2 Loss Function Convergence Comparison
Under the same experimental conditions as above, we compare and verify the convergence of the loss functions of each algorithm in the ablation experiment. The comparison results are shown in Fig. 15.
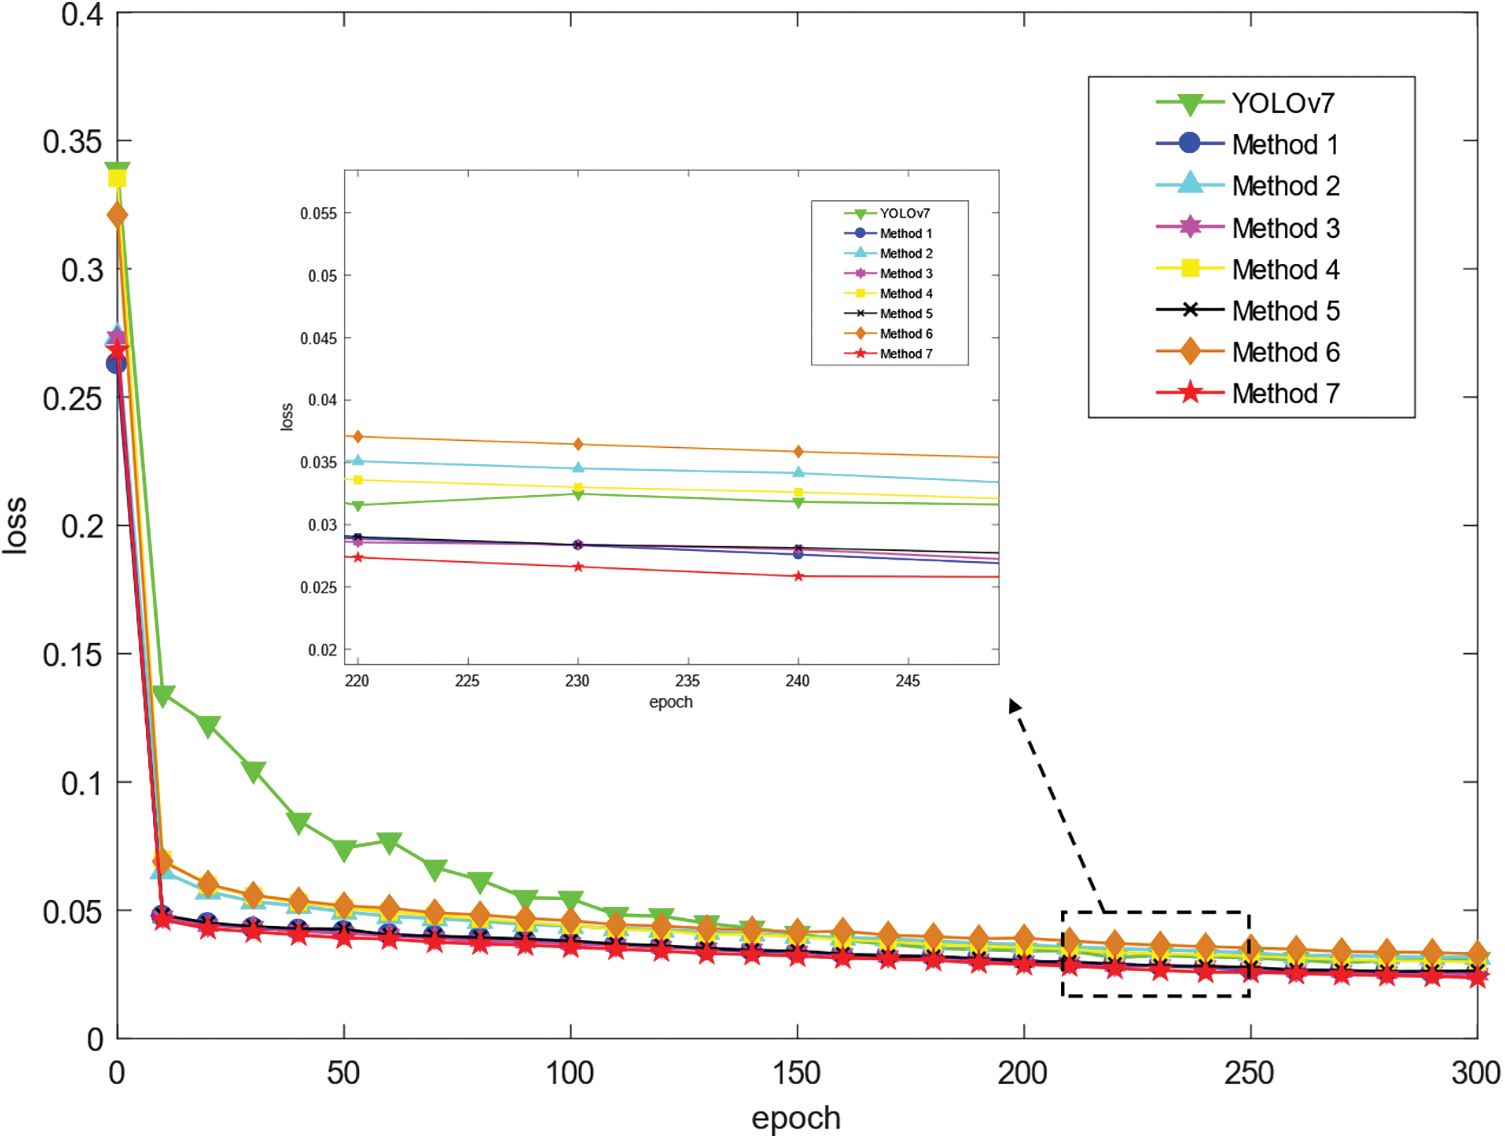
Figure 15: Comparison of loss function iterations
In Fig. 15, as iterations increase, the loss functions of the original algorithm and the 7 improved methods are in a convergence state. Among them, the loss function of the original algorithm is maintained at about 0.0308, the loss function of improvement 3 is maintained at about 0.0251, the loss function of improvement 5 is maintained at about 0.0247, and the loss function of method 7 is maintained at about 0.239. In comparison to the original model, the loss function of the improved algorithm converges faster and the loss value is smaller. Therefore, experiments have shown that the improved method in this paper has a significant effect on optimizing the model’s loss function and improving the overall performance of the model.
4.4.3 Improved YOLOv7 Model Compared with Other Models
To further verify the feasibility of the proposed algorithm, this paper compares the improved algorithm with current mainstream target detection algorithms, including Faster R-CNN, SSD, YOLOv5m, YOLOX [42], Yolov7-tiny and YOLOv7. The above algorithms are compared from eight aspects Precision, Recall, weighted reconciliation average, mAP@0.5, FPS, number of model parameters, model complexity, and Weights. The results are shown in Table 3.

In Table 3, under the same experimental conditions, the improved algorithm in this paper has obvious advantages compared with the current mainstream target detection algorithms. Among them, the improved YOLOv7 algorithm, compared to the Faster R-CNN algorithm, the SSD algorithm, the YOLOv5, and the YOLOX, improves the precision by 23.33%, 29.47%, 13.82%, and 10.87%, the recall by 25.21%, 27.03%, 17.48%, and 16.30%, respectively, and the mAP@0.5 improved by 25.46%, 28.65%, 15.40%, and 8.36%, respectively, the quantity of model parameters decreases by 67.85%, 61.90%, 12.30% and 55.33%, and the model complexity decreases by 78.82%, 66.10%, -30.69% and 21.10%, respectively. Among them, the model complexity of YOLOv5 is lower, but other indicators are far less than the improved algorithm.
The improved YOLOv7 algorithm improves all detection metrics compared to the original YOLOv7 algorithm, and the number and complexity of the model parameters are significantly reduced by 47.83% and 38.99%, respectively, and the size of the model weights is reduced by 26.33%. The YOLOv7-tiny algorithm optimizes the network structure, the quantity of parameters and complexity is greatly reduced, and the model is more lightweight, which is suitable for edge-side deployment, but the detection precision is far less than the algorithm in this paper.
After a comprehensive comparison of different algorithms, it is shown that all the changes made to the improved algorithm in this paper are optimal, which proves the effectiveness of the improved method in this paper. Fig. 16 shows the comparison of the mAP@0.5 values of the detection algorithms, and every ten points are marked, from which we can intuitively see that the improved YOLOv7 algorithm in this paper reaches convergence around 100 epochs, and its mAP@0.5 value is the highest among all the algorithms, reaching 92.04%.
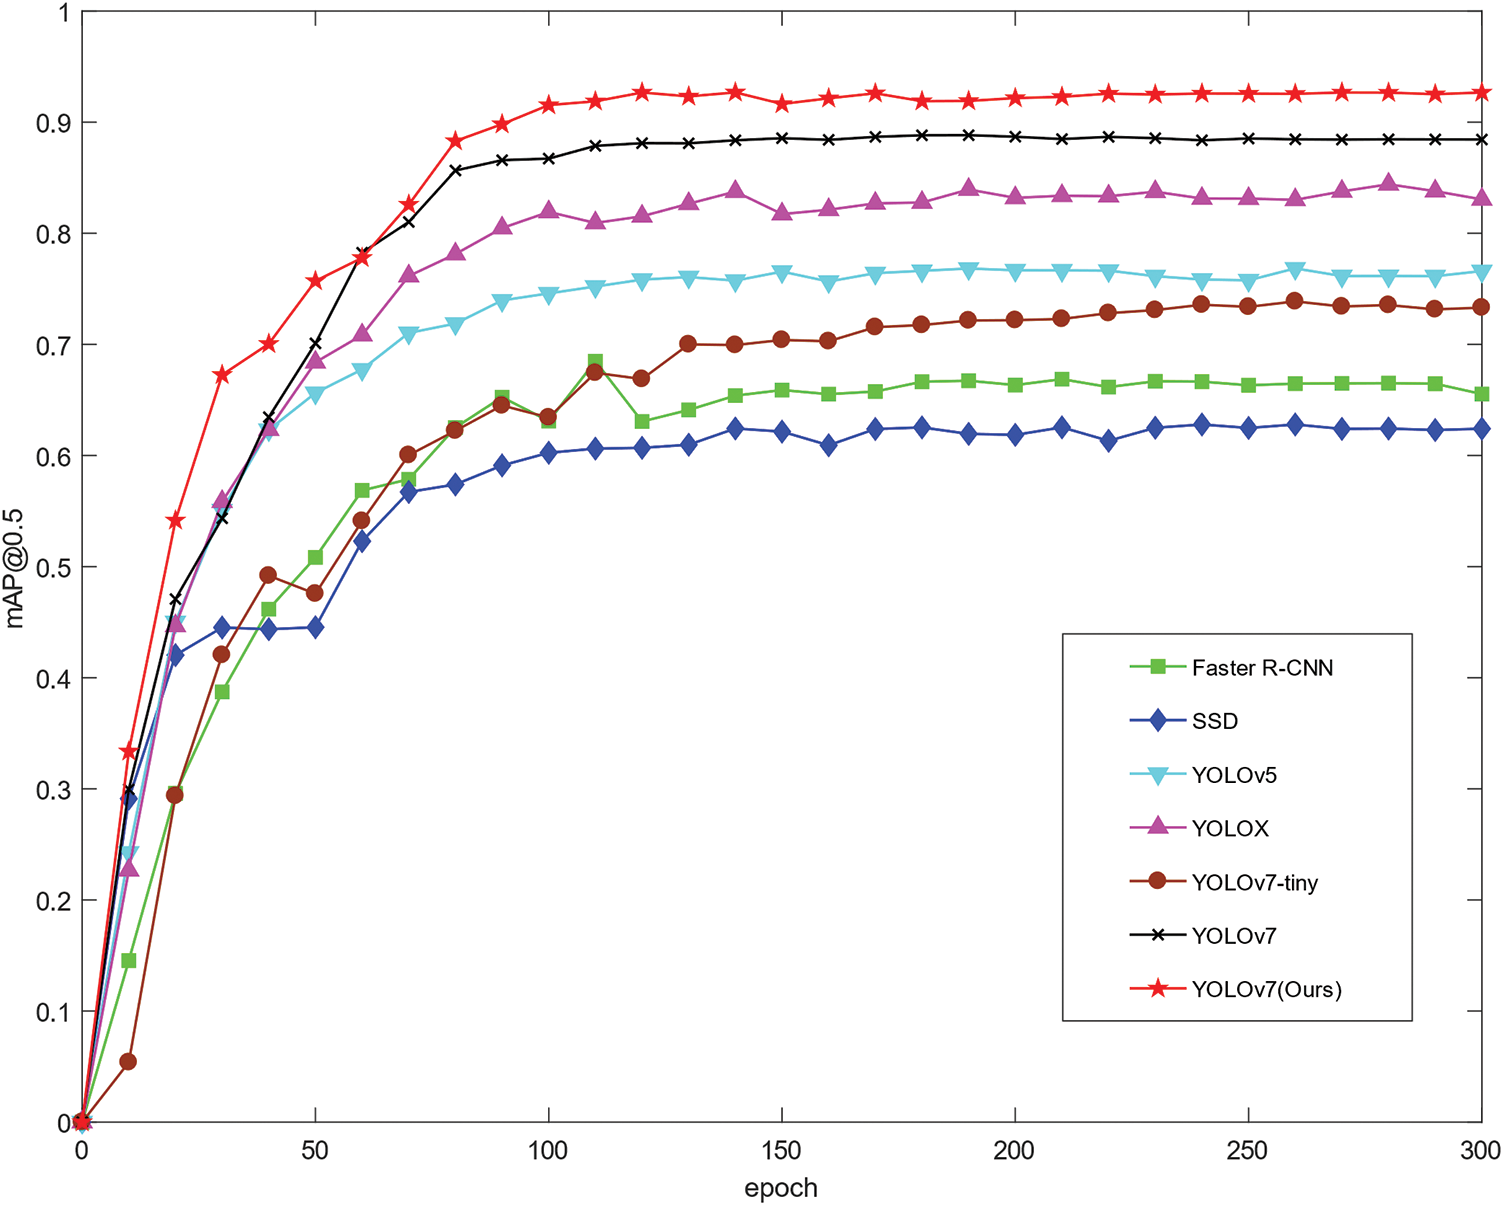
Figure 16: Comparison of mAP@0.5 values for each detection algorithm
To compare the detection effect of the improved model and the original model, combined with the actual situation, this paper selected the surveillance video clips of laboratory personnel doing experiments in a university for detection and comparison. Some of the comparison results are shown in Figs. 17 to 23.

Figure 17: Comparison of laboratory personnel behavioral testing results (1)

Figure 18: Comparison of laboratory personnel behavioral testing results (2)

Figure 19: Comparison of laboratory personnel behavioral testing results (3)

Figure 20: Comparison of laboratory personnel behavioral testing results (4)

Figure 21: Comparison of laboratory personnel behavioral testing results (5)

Figure 22: Comparison of laboratory personnel behavioral testing results (6)

Figure 23: Comparison of laboratory personnel behavioral testing results (7)
As can be seen from the comparison chart of the detection effect, the improved algorithm accurately detects all irregular behaviors, reduces the leakage rate in the laboratory when the behavior of the person is obscured, can detect more targets, and the detection precision is generally higher than that of the original model, and the detection effect is better. As in Figs. 17 and 18, in the laboratory background, the personnel behavior is partially obscured, the improved algorithm accurately identifies the personnel smoking behavior, but the original algorithm model fails to identify, and the improved model detection precision is higher than that of the original model. In Fig. 19, the original algorithm only identifies some of the personnel’s eating behaviors, while the improved algorithm accurately detects all the personnel behaviors. Figs. 20–23 compare the detection effectiveness of the improved model and the original algorithm, the improved model’s detection precision and effectiveness are typically higher than those of the original model, demonstrating that it is more capable of extracting features and has a better ability to detect targets.
In conclusion, the improved method in this paper has higher detection precision, better detection effect, reduces the leakage rate, and has better application prospects.
In this paper, an algorithm for detecting irregular behavior of laboratory personnel based on the improved YOLOv7 is proposed for the current problem of difficult and slow detection of irregular behavior of personnel in laboratory scenarios. The algorithm firstly improves the backbone part by using DCN module according to the characteristics of complex laboratory environment, irregular and difficult to identify personnel behavior, and changes the traditional convolution method, so that the model can perceive the features of the input image more flexibly, enhances the model’s ability to capture the shape features of the target, and reduces the number of model parameters and complexity; secondly, it adds the two effective input layers of the neck network to the CBAM_E attention module proposed in this paper, which helps the network model to target the extraction of key information when processing images, captures the target key features more accurately, and improves the detection accuracy of the occluded people in the laboratory scene; finally, the boundary box loss function CIoU of the prediction head is replaced by the improved α-SIoU, which not only solves the problem of the vector angle between the target box and the real box, but also makes the model to pay more attention to the location and shape of the bounding box in the regression process, and adjusts the regression strategy of the model according to the specific scene to reduce the leakage detection rate, which effectively improves the convergence speed and detection speed of the model. The experimental results on the public dataset and homemade dataset show that the improved algorithm is optimal in all indicators compared with the original algorithm and the current mainstream algorithm, and the number of model parameters and complexity have been greatly reduced. Among them, compared with the original algorithm, the final improved algorithm increased the precision by 2.92%, the recall by 4.14%, the mAP@0.5 value by 3.60%, the number of model parameters decreased by 47.83%, the model complexity decreased by 38.99%, and the precision of the model detection is significantly improved.
In future work, augmentation of the dataset will be considered to increase the number of categories of irregularities detected in different laboratories in the real scenario and to increase the value of the model in the real scenario.
Acknowledgement: The authors would like to thank the editorial department and reviewers for their suggestions on this article, which have helped us greatly improve the quality of the article.
Funding Statement: This study was supported by the National Natural Science Foundation of China (No. 61861007), Guizhou Provincial Department of Education Innovative Group Project (QianJiaohe KY [2021]012), Guizhou Science and Technology Plan Project (Guizhou Science Support [2023] General 412).
Author Contributions: The authors confirm contribution to the paper as follows: study conception and design: Yongliang Yang, Linghua Xu; data collection: Maolin Luo; analysis and interpretation of results: Yongliang Yang, Min Cao; draft manuscript preparation: Yongliang Yang, Xiao Wang, Linghua Xu. All authors reviewed the results and approved the final version of the manuscript.
Availability of Data and Materials: The data that support the findings of this study are available from the corresponding author, Linghua Xu, upon reasonable request.
Conflicts of Interest: The authors declare that they have no conflicts of interest to report regarding the present study.
References
1. M. L. Luo, L. H. Xu, Y. L. Yang, M. Cao, and J. Yang, “Laboratory flame smoke detection based on an improved YOLOX algorithm,” Applied Sciences, vol. 12, no. 24, pp. 1–17, 2022. doi: 10.3390/app122412876. [Google Scholar] [CrossRef]
2. Ministry of Education of the People's Republic of China, Notice of the General Office of the Ministry of Education on the Issuance of Laboratory Safety Standards for Institutions of Higher Learning. Beijing, China, 2023. [Online]. Available: https://www.gov.cn/zhengce/zhengceku/2023-02/21/content_5742498.htm (accessed on 08/02/2023). [Google Scholar]
3. R. Barkan, D. Zohar, and I. Erev, “Accidents and decision making under uncertainty: A comparison of four models,” Organ. Behav. Hum. Decis. Process., vol. 74, no. 2, pp. 118–144, 1998. doi: 10.1006/obhd.1998.2772. [Google Scholar] [PubMed] [CrossRef]
4. R. Girshick, J. Donahue, T. Darrell, and J. malik, “Rich feature hierarchies for accurate object detection and semantic segmentation,” in Proc. IEEE Int. Conf. Comput. Vis. Pattern Recognit., Columbus, OH, USA, 2014, pp. 580–587. [Google Scholar]
5. R. Girshick, “Fast R-CNN,” in Proc. IEEE Int. Conf. Comput. Vis., New York, NY, USA, 2015, pp. 1440–1448. [Google Scholar]
6. S. Ren, K. He, R. Girshick, and J. Sun, “Faster R-CNN: Towards real-time object detection with region proposal networks,” Adv. Neural Inf. Process. Syst., vol. 39, no. 6, pp. 1137–1149, 2015. doi: 10.1109/TPAMI.2016.2577031. [Google Scholar] [PubMed] [CrossRef]
7. W. Liu et al., “SSD: Single shot multibox detector,” in European Conf. on Comput. Vis., Amsterdam, 2016, pp. 21–37. [Google Scholar]
8. M. Rashmi, T. S. Ashwin, and R. M. R. Guddeti, “Surveillance video analysis for student action recognition and localization inside computer laboratories of a smart campus,” Multimed. Tools Appl., vol. 80, no. 2, pp. 2907–2929, 2021. doi: 10.1007/s11042-020-09741-5. [Google Scholar] [CrossRef]
9. K. Y. Liu, “Patterns recognition of unsafe behavior in chemical laboratory based on C3D,” Cyber Security and Data Governance, vol. 41, no. 3, pp. 71–77, 2022 (In Chinese). doi: 10.19358/j.issn.2096-5133.2022.03.012. [Google Scholar] [CrossRef]
10. Z. B. Huang, “Patterns recognition of unsafe behavior in chemical laboratory based on temporal segment network,” (in ChineseIntell. Comput. Appl., vol. 12, no. 2, pp. 99–104, 2022. [Google Scholar]
11. Z. Cao, F. Mei, D. Zhang, B. Liu, Y. Wang and W. Hou, “Recognition and detection of persimmon in a natural environment based on an improved YOLOv5 model,” Electronics, vol. 12, no. 4, pp. 1–14, 2023. doi: 10.3390/electronics12040785. [Google Scholar] [CrossRef]
12. G. Yang et al., “Face mask recognition system with YOLOV5 based on image recognition,” in 2020 IEEE 6th Int. Conf. Comput. Commun., Chengdu, China, 2020, pp. 1398–1404. [Google Scholar]
13. N. Bodla, B. Singh, R. Chellappa, and L. S. Davis, “Soft-NMS: Improving object detection with one line of code,” in 2017 IEEE Int. Conf. Comput. Vis., Venice, VE, 2017, pp. 5562–5570. [Google Scholar]
14. Z. Hu and C. Xu, “Detection of underwater plastic waste based on improved YOLOv5n,” in Proc. ICFTIC, Qingdao, China, 2022, pp. 404–408. [Google Scholar]
15. J. X. Niu, S. K. Gu, J. M. Du, and Y. X. Hao, “Underwater waste recognition and localization based on improved YOLOv5,” Comput. Mater. Contin., vol. 76, no. 2, pp. 2015–2031, 2023. doi: 10.32604/cmc.2023.040489. [Google Scholar] [CrossRef]
16. W. Wu, X. L. Li, Z. H. Hu, and X. Z. Liu, “Ship detection and recognition based on improved YOLOv7,” Comput. Mater. Contin., vol. 76, no. 1, pp. 489–498, 2023. doi: 10.32604/cmc.2023.039929. [Google Scholar] [CrossRef]
17. C. Y. Wang, A. Bochkovskiy, and H. Y. M. Liao, “YOLOv7: Trainable bag-of-freebies sets new state-of-the art for real-time object detectors,” in Proc. of the IEEE/CVF Conf. on Comp. Vision and Pattern Rec. (CVPR), 2023, pp. 7464–7475. [Google Scholar]
18. S. Y. Wang, D. S. Wu, and X. Y. Zheng, “TBC-YOLOv7: A refined YOLOv7-based algorithm for tea bud grading detection,” Front. Plant Sci., vol. 14, no. 1, pp. 1–18, 2023. doi: 10.3389/fpls.2023.1223410. [Google Scholar] [PubMed] [CrossRef]
19. A. A. Khan, A. A. Laghari, P. Li, M. A. Dootio, and S. Karim, “The collaborative role of blockchain, artificial intelligence, and industrial internet of things in digitalization of small and medium-size enterprises,” Sci. Rep., vol. 13, no. 1, pp. 1–13, 2023. doi: 10.1038/s41598-023-28707-9. [Google Scholar] [PubMed] [CrossRef]
20. A. A. Khan, A. A. Laghari, Z. A. Shaikh, Z. D. Pikiewicz and S. Kot, “Internet of things (IoT) security with blockchain technology: A state-of-the-art review,” IEEE Access, vol. 10, no. 1, pp. 122679–122695, 2022. [Google Scholar]
21. J. F. Dai et al., “Deformable convolutional networks,” in 2017 IEEE Int. Conf. Comput. Vis., Venice, VE, Italy, 2017, pp. 764–773. [Google Scholar]
22. Z. H. Zheng et al., “Enhancing geometric factors in model learning and inference for object detection and instance segmentation,” IEEE Trans. Cybern., vol. 52, no. 8, pp. 8574–8586, 2022. doi: 10.1109/TCYB.2021.3095305. [Google Scholar] [PubMed] [CrossRef]
23. J. Ghosh, A. Tonoli, and N. Amati, “A deep learning based virtual sensor for vehicle sideslip angle estimation: Experimental results,” in SAE World Congress Experience, Detroit, MI, USA, pp. 1–8, 2018. [Google Scholar]
24. C. Y. Wang, H. Y. M. Liao, Y. H. Wu, P. Y. Chen, J. W. Hsieh and I. H. Yeh, “A new backbone that can enhance learning capability of CNN,” in Proc. CVPRW, Seattle, WA, USA, 2020, pp. 1571–1580. [Google Scholar]
25. S. Liu, Y. Wang, Q. Yu, H. Liu, and Z. Peng, “CEAM-YOLOv7: Improved YOLOv7 based on channel expansion and attention mechanism for driver distraction behavior detection,” IEEE Access, vol. 10, no. 1, pp. 129116–129124, 2022. doi: 10.1109/ACCESS.2022.3228331. [Google Scholar] [CrossRef]
26. S. J. Li, S. L. Wang, and P. Wang, “A small object detection algorithm for traffic signs based on improved YOLOv7,” Sensors, vol. 23, no. 16, pp. 1–22, 2023. doi: 10.3390/s23167145. [Google Scholar] [PubMed] [CrossRef]
27. Y. Ma, “Fine-grained image recognition based on deformable transformer and multi-scale attention,” M.S. thesis, Inner Mongolia Normal Univ, Inner Mongolia, China, 2023. [Google Scholar]
28. D. Zhang, Z. Zheng, M. Li, and R. Liu, “CSART: Channel and spatial attention-guided residual learning for real-time object tracking,” Neurocomputing, vol. 436, no. 14, pp. 260–272, 2021. doi: 10.1016/j.neucom.2020.11.046. [Google Scholar] [CrossRef]
29. Z. Qin, Q. Li, H. Li, X. Dong, and Z. Ren, “Advanced intersection over union loss for visual tracking,” in 2019 Chin. Autom. Congr., Hangzhou, China, 2019, pp. 5869–5873. [Google Scholar]
30. H. Rezatofighi, N. Tsoi, J. Gwak, A. Sadeghian, I. Reid and S. Savarese, “Generalized intersection over union: A metric and a loss for bounding box regression,” in 2019 IEEE/CVF Conf. Comput. Vis. Pattern Recognit., Long Beach, CA, USA, 2019, pp. 658–666. [Google Scholar]
31. Z. H. Zheng, P. Wang, W. Liu, J. Z. Li, R. G. Ye and D. W. Ren, “Distance-IoU loss: Faster and better learning for bounding box regression,” Artif. Intell., vol. 34, no. 7, pp. 12993–13000, 2020. [Google Scholar]
32. S. Woo, J. Park, J. Y. Lee, and I. S. Kweon, “CBAM: Convolutional block attention module,” in Proc. of the IEEE European Conf. Comput. Vis., Munich, Germany, 2018, pp. 3–19. [Google Scholar]
33. J. B. Wang, J. Wu, J. W. Wu, J. P. Wang, and J. Wang, “YOLOv7 optimization model based on attention mechanism applied in dense scenes,” Appl. Sci., vol. 13, no. 16, pp. 1–19, 2023. doi: 10.3390/app13169173. [Google Scholar] [CrossRef]
34. D. W. Zhang, Z. L. Zheng, T. X. Wang, and Y. R. He, “HROM: Learning high-resolution representation and object-aware masks for visual object tracking,” Sensors, vol. 20, no. 17, pp. 1–20, 2020. doi: 10.3390/s20174807. [Google Scholar] [PubMed] [CrossRef]
35. X. Wang, Q. Dong, and G. Y. Yang, “YOLOv5 improved by optimized CBAM for crop pest identification,”, Comput. Syst. Appl., vol. 32, no. 7, pp. 261–268, 2023 (In Chinese). doi: 10.15888/j.cnki.csa.009175. [Google Scholar] [CrossRef]
36. Q. L. Wang, B. G. Wu, P. F. Zhu, P. H. Li, W. M. Zuo and Q. H. Hu, “ECA-net: Efficient channel attention for deep convolutional neural networks,” in IEEE/CVF Conf. Comput. Vis. Pattern Recognit., Seattle, WA, USA, 2020, pp. 11531–11539. [Google Scholar]
37. M. H. Wang, Z. X. Wu, and Z. G. Zhou, “Fine-grained identification research of crop pests and diseases based on improved CBAM via Attention,” Trans. Chin. Soc. Agric. Mach., vol. 52, no. 4, pp. 239–247, 2021 (In Chinese). doi: 10.6041/j.issn.1000-1298.2021.04.025. [Google Scholar] [CrossRef]
38. Y. Wang, H. Wang, and Z. Xin, “Efficient detection model of steel strip surface defects based on YOLO-V7,” IEEE Access, vol. 10, pp. 133936–133944, 2022. doi: 10.1109/ACCESS.2022.3230894. [Google Scholar] [CrossRef]
39. H. Kuehne, H. Jhuang, E. Garrote, T. Poggio, and T. Sreer, “HMDB: A large video database for human motion recognition,” in Proc. of Int. Conf. Comput. Vis., Washington DC, USA, 2011, pp. 2556–2563. [Google Scholar]
40. I. Agtzidis, M. Startsev, and M. Dorr, “Two hours in Hollywood: A manually annotated ground truth data set of eye movements during movie clip watchin,” J. Eye Mov. Res., vol. 13, no. 4, pp. 1–12, 2020. [Google Scholar]
41. H. Zhao, H. Zhang, and Y. Zhao, “YOLOv7-sea: Object detection of maritime UAV images based on improved YOLOv7,” in 2023 IEEE/CVF Winter Conf. Appl. Comput. Vis. Workshops, Waikoloa, HI, USA, 2023, pp. 233–238. [Google Scholar]
42. Z. Ge, S. Liu, F. Wang, Z. Li, and J. Sun, “YOLOX: Exceeding YOLO series in 2021,” 2021. arXiv:2107.00843, 2021. [Google Scholar]
Cite This Article
 Copyright © 2024 The Author(s). Published by Tech Science Press.
This work is licensed under a Creative Commons Attribution 4.0 International License , which permits unrestricted use, distribution, and reproduction in any medium, provided the original work is properly cited.


 Submit a Paper
 Propose a Special lssue
 View Full Text
 Download PDF
 Downloads
 Citation Tools