
 Submit a Paper
 Propose a Special lssue
 Open Access
ARTICLE

Learning Epipolar Line Window Attention for Stereo Image Super-Resolution Reconstruction
School of Information Engineering, Southwest University of Science and Technology, Mianyang, 621010, China
* Corresponding Author: Hongying Zhang. Email:
(This article belongs to the Special Issue: Development and Industrial Application of AI Technologies)
Computers, Materials & Continua 2024, 78(2), 2847-2864. https://doi.org/10.32604/cmc.2024.047093
Received 24 October 2023; Accepted 26 December 2023; Issue published 27 February 2024
 View Full Text
 Download PDF
Abstract
Transformer-based stereo image super-resolution reconstruction (Stereo SR) methods have significantly improved image quality. However, existing methods have deficiencies in paying attention to detailed features and do not consider the offset of pixels along the epipolar lines in complementary views when integrating stereo information. To address these challenges, this paper introduces a novel epipolar line window attention stereo image super-resolution network (EWASSR). For detail feature restoration, we design a feature extractor based on Transformer and convolutional neural network (CNN), which consists of (shifted) window-based self-attention ((S)W-MSA) and feature distillation and enhancement blocks (FDEB). This combination effectively solves the problem of global image perception and local feature attention and captures more discriminative high-frequency features of the image. Furthermore, to address the problem of offset of complementary pixels in stereo images, we propose an epipolar line window attention (EWA) mechanism, which divides windows along the epipolar direction to promote efficient matching of shifted pixels, even in pixel smooth areas. More accurate pixel matching can be achieved using adjacent pixels in the window as a reference. Extensive experiments demonstrate that our EWASSR can reconstruct more realistic detailed features. Comparative quantitative results show that in the experimental results of our EWASSR on the Middlebury and Flickr1024 data sets for 2 × SR, compared with the recent network, the Peak signal-to-noise ratio (PSNR) increased by 0.37 dB and 0.34 dB, respectively.Keywords
Deep learning-based super-resolution reconstruction (SR) of stereo images is an important research direction in the field of computer vision, and its core idea is to utilize the information in multi-view images to infer high-resolution image information [1–3] acquire two low-resolution images using devices such as binocular cameras, then match and fuse these images to obtain high-resolution images from different viewpoints. Stereo SR has garnered increased attention in various disciplines, showcasing excellent results in competitions like the new trends in image restoration and enhancement (NTIRE) [4], demonstrating the potential of stereo correspondence information to improve SR performance. However, Stereo SR faces several challenges. Firstly, it must recover high-frequency details, including object edges and fine features, from low-resolution left and right-view images. Effectively recovering and enhancing these high-frequency features remains a major challenge. Secondly, there is the task of fusing left and right view information. Stereo SR requires the integration of information from both viewpoints to improve depth estimation accuracy, demanding an effective information fusion strategy to combine the data from both views and obtain better depth maps. Lastly, the models employed tend to have a large number of parameters. Stereo SR tasks typically necessitate deep neural network models for learning the mapping from low-resolution to high-resolution. Designing a Stereo SR model that is both efficient and lightweight is extremely challenging due to the complex structure of high-resolution depth images.
The issues above represent some of the key challenges in Stereo SR research. To restore more discriminative high-frequency features, Hui et al. [5] introduced perceptual techniques to enhance and improve the performance of super-resolution algorithms, making the reconstructed stereo images more suitable for human vision or computer vision systems, thus enhancing perceptual quality [6–8] employ non-autoregressive fusion network (NAFnet) denoising modules to handle noise interference in images, promoting the recovery of high-frequency features. To utilize complementary information between images, DASSR adopted a disparity-based domain adaptation approach to merge views, taking into consideration depth information for adapting to varying disparities. Dai et al. [9] introduced a feedback mechanism by transferring information extracted from super-resolution tasks into disparity estimation tasks, establishing a mutual feedback loop that enhances performance in both tasks. Software Architecture Evaluation Model (SAEM) [10] makes efficient use of information from both cross-view and intra-view perspectives to acquire cross-view information, thereby improving image SR performance [11–13] explored distillation, fusion, and feature enhancement to achieve model lightweight and efficiency, proposing an efficient separable distillation module for high-resolution feature restoration. References [14–16] transformed 3D or 4D cost volumes into disparity learning approaches, reducing significant computational costs. Despite substantial progress in previous research, a balance between long-range feature dependencies (perception) and local information attention remains essential for high-frequency feature recovery. Furthermore, when employing a disparity attention mechanism for complementary information fusion, particular attention should be paid to the upper and lower offsets of complementary information within the epipolar line range.
In response to the challenges posed by Stereo SR outlined above, this paper introduces a cross-view fusion attention network partitioned along the epipolar lines. First, to address issues regarding image perception and local feature attention, a Swin Transformer feature distillation and enhancement block (FDEB) Layer is introduced for global feature extraction and fine-grained local feature extraction, which utilizes a (shifted) window-based self-attention ((S)W-MSA) and a FDEB. Furthermore, adaptive overlapping window attention enhances long-range dependencies between (S)W-MSA feature pixels. Second, to effectively incorporate stereo correspondence information, we propose an epipolar line window attention (EWA) mechanism. This mechanism enables the network to learn the similarity between a pixel and the pixels within the window along its epipolar line. Moreover, partitioned window information contributes to improved pixel-matching accuracy in regions characterized by pixel smoothness. Comparative experiments on a stereo dataset show that our network has superior SR performance with fewer parameters. Our contributions can be summarized as follows:
(1) We propose the EWASSR network, which combines (S)W-MSA and FDEB to enhance the recovery of fine-grained details in Stereo SR. Experimental results demonstrate a significant improvement in SR performance with the introduction of FDEB.
(2) We introduce an EWA attention mechanism that partitions windows along the epipolar line to address pixel misalignment issues between stereo views, enabling more accurate pixel matching. Experimental results show that this model pays more attention to the discriminative features in the image after fusing stereo views through EWA.
(3)The proposed EWASSR achieves superior performance with fewer parameters than recent stereo SR methods.
With the development of deep neural networks, the single-image super-resolution (SISR) task based on deep learning has made significant progress [17], as shown in Fig. 1. Early SISR models [18–20] using deep learning employed multiple convolutional layers to learn image features, laying the foundation for subsequent research. Some networks [21–24] achieved better noise and artifact suppression through recursive learning. The introduction of residual networks addressed the problems of gradient vanishing and exploding during deep network training. Some networks [25–29] also utilized residual methods to deepen the depth of feature extraction, obtaining richer image semantic features. To facilitate the model’s focus on more important regions in the image, references [30,31] proposed integrating attention mechanisms into the SR model. Recently, Khan et al. [32] introduced a holistic attention network to address the issues of channel attention ignoring the relevance of feature layers and modeling layer dependencies. Jiang et al. [33] tackled the challenge of comparing SISR algorithms fairly by introducing a real-world dataset and proposing a new objective metric using the Karhunen-Loéve Transform. SR3 [34] employed denoising diffusion models for image-to-image translation, demonstrating excellent super-resolution performance across diverse tasks, including faces and natural images. Addressing the interaction issues between Transformer windows, Chen et al. [35] introduced a new hybrid attention Transformer (HAT), which aggregates information between overlapping cross windows. To address the lack of multi-scale information in shift windows, SwinFIR [36] used fast Fourier convolution to make the network focus on spatial and frequency domain information, further enhancing its ability to capture global information. SRFormer [37] addressed the issue of increased computational complexity with large windows in SwinIR that improves SR performance. Park et al. [38] designed the dilated window transformer for global feature extraction. To maintain model efficiency while focusing on details, Residual Feature Distillation Network (RFDN) [39] aggregated features of different scales and edges with high-frequency information through channel distillation and enhancement, also serving as the baseline for efficient SR channels in NTIRE, solving the issue of large parameterization in SR models. While SISR excels in multi-scale feature extraction and lightweight models, it is not directly applicable to recovering high-frequency features and fusing complementary information in stereo tasks.

Figure 1: Classification of image super-resolution reconstruction techniques
Stereo SR enhances image quality in visual tasks, contributing to advancements in computer vision, as illustrated in Fig. 1. Jeon et al. [2] aligned left and right pixels by imposing maximum disparity priors. Some networks [5,9,40,41] achieved pixel alignment by iteratively estimating disparities between images. To address the issue of uncontrollable disparity ranges, Wang et al. [42,43] proposed a Disparity Attention Mechanism (PAM), enabling the learning of similar information along the epipolar line. PAM employs a low-cost fusion of stereo views but lacks attention to image-specific information. Therefore, Song et al. [44] combined self-attention to focus on both image-specific and cross-view information along the epipolar line. Similarly, IMSSRnet [45] notably improved stereoscopic image super-resolution by leveraging complementary information, outperforming state-of-the-art methods with gradient and disparity losses. Based on this, CPASSRnet [46] achieved single-model super-resolution with multiple scale factors in both views, addressing challenges in stereo images such as large disparities and different epipolar lines. While PAM effectively integrates complementary information in stereo images, its asymmetry prevents the network from simultaneously obtaining SR images for the left and right views. To address this, Ying et al. [47] developed a universal stereo-view attention mechanism, demonstrating excellent SR performance when applied to the SISR task. To tackle occlusion issues between stereo images, inspired by PASSRnet [42], iPASSR [48] updated the valid mask design in PAM, effectively handling occluded view information. Accurate assessment of disparity information contributes to feature complementarity in stereo image pairs. LF-DGNet [49] introduced a disparity-guided feature modulation module, a multi-view feature recalibration module, and a disparity-guided network for light field spatial super-resolution. Building on this, some networks effectively fuse complementary information in stereo images and promote Stereo SR reconstruction tasks by designing cross-view attention. NAFSSR [6] achieved outstanding SR performance by combining the stereo cross attention module (SCAM) with the denoising non-autoregressive fusion block (NAFBlock). To cut down on computational expenses, Chen et al. [50] introduced the residual cross attention module (RCAM) for fusing view information. Ying et al. [10] utilized a cross-view fusion transformer for integrating cross-view information and an intra-view refinement transformer to refine intra-view features, maximizing the use of complementary information. Although these view attention mechanisms effectively address the epipolar pixel alignment issue, the alignment of pixels shifting along the epipolar line in stereo views also requires attention. Therefore, in this work, we designed an epipolar window attention to address pixel displacement in the fusion of complementary information in stereo views.
Given a pair of low-resolution images,

Figure 2: An overview of our EWASSR. “Conv” represents a 3 × 3 convolutional layer. “OCAB” in (b) is overlapping cross-attention block. Distilled in (d) consists of a 1 × 1 convolutional layer and GELU, and Enhanced consists of a 3 × 3 convolutional layer and GELU
Feature fusion consists of two stages. In the first stage, we employ an iterative feature fusion approach. Initially, the outputs of RSTFB are used as inputs for the epipolar line window attention (EWA), which is detailed in Section 3.4. EWA employs a novel attention network that partitions along the epipolar line windows, effectively fusing complementary information from the left and right views. Subsequently, the outputs of EWA are used as inputs for the next layer of RSTFB, which extracts semantic information from the preliminarily aligned disparity map. This process is iterated multiple times, progressively enhancing the network’s ability to learn features. In the second stage, we perform multi-level feature fusion. All the outputs of a series of EWAs from the first stage are used as inputs for the residual epipolar line window attention (REWA). This stage involves re-fusing the multi-level features, enhancing the representation capability of the disparity map features.
3.2 Residual Swin Transformer FDEB Block (RSTFB)
Given stereo low-resolution image inputs
where j represents the j-th RSTFB, we have defined j = 1, 2,..., 8. OCAB refers to the overlapping cross-attention block. Inspired by HAT, we use an overlap ratio r = 2/M to adapt to different overlapping areas of the windows. The size of the overlapping window M0 is obtained by increasing the length and width of the original window M by 1. This design ensures that overlapping pixels are constrained within an adaptive range, preventing them from growing indefinitely as the window size increases and thus avoiding redundant computation of interaction information in large windows. STFL consists of (S) W-MSA and FDEB operations. A detailed description of FDEB can be found in Section 3.3. Our EWASSR improves upon previous work by employing a more concise and efficient method of cascading feature extraction and fusion alternately, significantly reducing the number of model parameters compared to the previous approach of concatenating deep feature extraction modules in series.
3.3 Feature Distillation and Enhancement Block (FDEM)
FDEB is based on feature distillation network [12,39]. As shown in Fig. 2d. We first increase the dimension of the input feature channels to twice the original number of channels. The channel enhancement operation increases the focus on image edges or textures, enhancing the model’s ability to capture object motion trajectories and edge information. Channel distillation reduces the dimension of feature channels to half the number of enhanced channels, enabling the network to learn more discriminative features. Its purpose is to aid the network in better understanding the image content by transmitting clear image features. Given intermediate feature maps, the operations of FDEB are as follows:
where
3.4 Residual Epipolar Line Window Attention (REWA)
To utilize complementary information in the images, we designed the REWA operation, which aggregates fusion features at different levels by connecting several EWA modules in a residual manner. As shown in Fig. 2f, REWA connects multiple EWA modules using a residual approach to aggregate fusion features. While the PAM efficiently promotes the alignment of left and right views using epipolar geometry constraints in stereo vision, it is observed that corresponding pixels may appear at different positions along the epipolar line, as depicted in Fig. 3. Moreover, in regions with smooth pixels like the sky, where there are no clear reference points, the accuracy of the alignment operation can be affected. Fig. 4 illustrates a comparison between our EWA, self-attention [51], and PAM. Self-attention is a method for calculating the correlation between pixels in an image, which is used to learn the dependencies between pixels and address long-range dependencies and translational invariance issues in image tasks. PAM is based on self-attention and is used to learn the similarity relationships between stereo images, resulting in a disparity map that promotes better alignment between the left and right images. Inspired by self-attention and PAM, our EWA can concentrate on pixels within windows along the epipolar line, improving the accuracy of left and right view alignment. For areas with small pixel value fluctuations, EWA can effectively use neighboring pixels within the window as references, enhancing the efficiency of left and right view alignment. EWA, as shown in Fig. 5, first divides the input feature map into M1 × W windows, where M1 represents the window’s height, and following the principles of Swin Transformer window division, we set M1 = 6. W represents the original width of the feature map. The left and right view windows corresponding to the corresponding areas are then fed into the cross-view attention model (CAM), which is illustrated in Fig. 5a. CAM is based on self-attention and PAM, and it computes the similarity between the left and right stereo views using query and key sources that are not the same, fusing complementary information. Given input window features
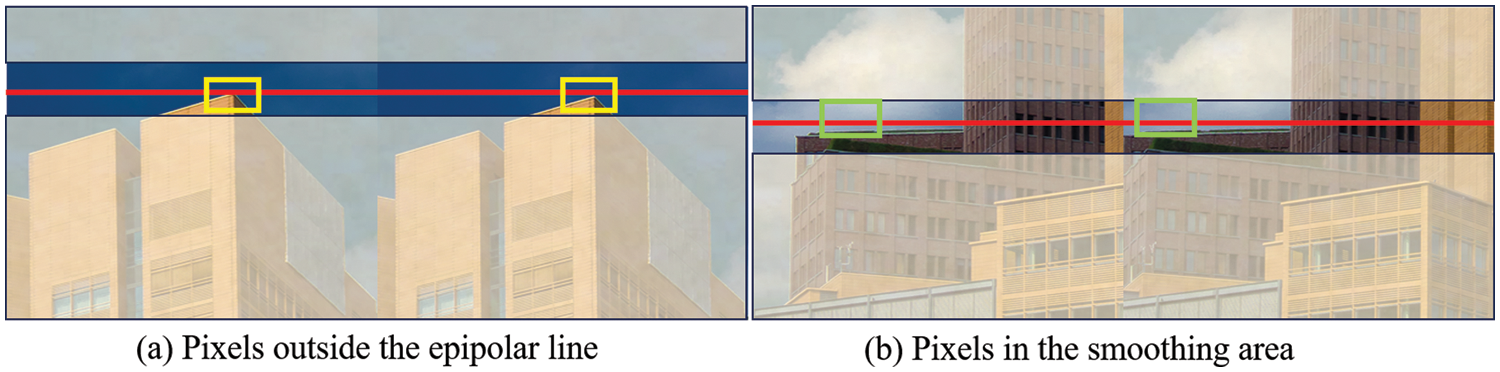
Figure 3: Relationship of pixels in epipolar line. (a) represents the case where pixels appear outside the epipolar line. (b) represents the case where features on the epipolar line are in the background region

Figure 4: Schematic of the epipolar line window. These arrows represent the similarity relationships between the blue pixels and other color pixels. Orange box represents epipolar line window

Figure 5: Epipolar line window attention. The blue rectangular box represents the partitioned window along the epipolar line, and the overlaid blue rectangular box represents the features fused by CAM along the width dimension of the image
Following [6,52], we propose CAM, which enables the network to learn the correspondence between stereo images. Since we have known from [6] that there is a mapping relationship between pixels, and via feature fusion in [52], we propose to fuse the features of the left and right images as:
Taking the left view fused feature as an example, where
In detail, as shown in Fig. 5a, in CAM we first calculate the dot product of all keys of the query and apply a softmax function to derive the weights of the values:
where
For better constraining the reconstruction relationship between high-resolution and low-resolution images, we optimize the parameters of EWASSR by mean square error (MSE) loss:
where
We followed [42,52] and used 800 stereo images from the training set of Flickr1024 and 60 stereo images from Middlebury as the training data. For test, we used 5 images from the Middlebury dataset, 20 images from the KITTI 2012 dataset and 20 images from the KITTI 2015 dataset as benchmark datasets. The test set images were obtained by bicubic downsampling. For validation, we used an additional 20 images from the KITTI 2012 dataset. Middlebury is used to evaluate disparities. KITTI includes vehicle and pedestrian images with various degrees of occlusion and truncation. Flickr1024 contains high-quality stereo images of multiple scene categories for super-resolution reconstruction. These real datasets provide a range of disparities and occlusions, better reflecting the challenges and issues encountered in practical super-resolution reconstruction scenarios for stereo images.
We cropped the LR and HR images to 30 × 90 patches with a step size of 20 [42,52]. These patches are randomly flipped to achieve data enhancement. Our EWASSR was implemented in Pytorch on a PC with an Nvidia RTX 4090 GPU. All models were optimized using the Adam method with β1 = 0.9, β2 = 0.999 and a batch size of 8. The initial learning rate was set to 2 × 10⁻⁴ and reduced to half after every 30 epochs. The training was stopped after 80 epochs since more epochs do not provide further consistent improvement. In our network model, the RSTFB number, EWA number, STFL number, window size, channel number and attention head number are generally set to 8, 8, 6, 6, 96 and 4, respectively. We use peak signal-to-noise ratio (PSNR) and structural similarity index measurement (SSIM) as the SR result evaluation metrics [7], because they can directly reflect the quality of the image by comparing the degree of difference between the original image and the processed image. We use the number of parameters and FLOPs as performance metrics for judging the model. The number of parameters reflects the complexity of the model, while FLOPs reflect the computational efficiency and speed of the model. The combination of the two can evaluate the performance of the model more comprehensively.
To demonstrate the choice of our network, we perform 4× scaling experiments on the KITTI2015 test set, where the experiments are illustrated in two parts: the feature extraction module and the feature fusion module.
4.2.1 Swin Transformer FDEB Layer
To demonstrate the effectiveness of our EWASSR with (S)W-MSA and FDEB, we introduced three variants. As shown in Table 1, Nr.1 represents the experimental results for our network, with the “Value” column showing the PSNR results compared to our EWASR as the baseline. First, to validate the effectiveness of introducing FDEB in STL, we removed FDEB in the baseline network, using only the Transformer-based structure for feature extraction. The results for Nr.2 confirm that removing FDEB resulted in a decrease in PSNR by 0.59 dB. This is because the feature extractor based on the Transformer does not pay enough attention to local details, resulting in incomplete high-frequency feature restoration. Then, following the reference [35], we replaced FDEB in the network with the channel attention block (CAB). However, the experimental results decreased to 26.54 dB. Finally, we replaced FDEB with NAFblock, and the results showed a PSNR reduction of 0.48 dB. The results for these three variants demonstrate the effectiveness of our chosen feature extraction module, achieving performance improvement while adding only a negligible number of parameters.

4.2.2 Residual Epipolar Line Window Attention
To effectively utilize complementary information in stereo images, we proposed a cross-view fusion attention network along the epipolar line partition. We designed four variants for experimentation. As shown in Table 2, first, we removed EWA from EWASSR, using a simple element-wise summation operation, resulting in a significant decrease in the PSNR value (decreased by 0.9 dB). The re-fusion of features from EWA outputs at different network depths allows for the integration of complementary information. We attempted to remove REWA, and the experimental results for Nr.3 showed that without secondary fusion, the network’s PSNR performance decreased to 26.73 dB. To demonstrate the effectiveness of EWA in partitioned window operations, we compared two disparity attention modules. First, we replaced our EWA with SCAM, and we found that the PSNR value of the network decreased by 0.34 dB. Next, we replaced EWA with ibPAM, and from Nr.5, despite an increase in network parameters, the PSNR did not improve and instead decreased by 0.54 dB. These series of experimental results confirm that partitioned window operations with geometric constraints improve the accuracy of complementary information in the fusion process.

Additionally, as shown in Fig. 6, we conducted a visual analysis of the intermediate features of EWA and SCAM. The figure shows the results of the “Middlebury-Motorcycle” for 4×. Blue to red represents the increasing attention of the network. We selected the more complex area of the engine part for comparison, and the red area of EWA is more abundant than SCAM. This is because EWA focuses on the features along the epipolar line window, making the feature area of interest more comprehensive. Experiments have shown that EWA exhibits higher attention in complex texture areas, which helps to recover high-frequency features of the image.

Figure 6: Feature images during feature fusion
4.3 Comparison to State-of-the-Arts
In this section, we compare EWASSR with various state-of-the-art methods, such as VDSR [53], RDN [54], RCAN [30], StereoSR [2], PASSRnet [42], iPASSR [48], SSRDE-FNet [9], and NAFSSR [6]. It is important to mention that all these methods are trained on identical datasets as ours.
As shown in Table 3, we compared our EWASSR with classical and advanced networks in Stereo SR tasks. The table indicates that EWASSR outperforms advanced networks in stereo super-resolution tasks. Analyzing the results from the four datasets, our network exhibits superior SR performance in three of them, except for the KITTI2012 dataset, where the improvement is less pronounced. Our network demonstrates significant performance improvements on the Middlebury and Flickr1024 test sets. Specifically, in the 2× experiments, compared to the representative network NAFFSSR-S, our network achieved an increase of 0.37 and 0.34 dB in PSNR, as well as SSIM improvements of 0.0025 and 0.0054 on the Middlebury and Flickr1024 test sets, respectively. In the 4× experiments, our network improved PSNR by 0.16 and 0.14 dB on these two datasets. It is worth noting that we chose NAFFSSR-S as a comparison network because its parameter count is in the same range as our network. In the results using only the left image as input, we observed that on the KITTI2012 test set, our network slightly lags NAFFSSR-S. This is due to the input being the same for the left and right images, meaning our EWA did not effectively utilize complementary information, resulting in similar performance to the non-partitioned disparity attention results.

As shown in Table 4, to analyze the model complexity, we selected the classical Stereo SR networks for comparison. The results in the table show that our network has the smallest number of parameters, but not the lowest computational effort, which is related to the depth of our network. Overall, we analyze that we have improved the SR performance by increasing only a small amount of computation while maintaining a better number of parameters.

We randomly selected a pair of stereo images from each of the four datasets as test data and presented the comparison results for 4× SR of the left and right images. In the results of Fig. 7, our EWASSR brings out the stereo contours of the folders and swords more effectively. In Fig. 8, none of the networks exhibit exceptional visual performance, mainly due to the presence of considerable noise in this test image. Upon close examination of the visual results, our network still outperforms the others. In Fig. 9, our EWASSR presents signs and zebra crossings that are closer to the ground truth (GT) images. As for building recovery, as shown in Fig. 10, EWASSR achieves the best visual performance.

Figure 7: “Middlebury-sword2” comparison of visualization results for 4× SR

Figure 8: “KITTI2012-013” comparison of visualization results for 4× SR

Figure 9: “KITTI2015-02” comparison of visualization results for 4× SR

Figure 10: “Flickr1024-023” comparison of visualization results for 4× SR
In this paper, we propose an attention network, named EWASSR, which partitions windows along the epipolar line to address the challenges of high-frequency feature reconstruction and complementary information fusion in Stereo SR tasks. The conclusions are summarized as follows:
(1) Designed the RSTFB hybrid feature extraction module, significantly enhancing the network’s ability to capture high-frequency features by establishing long-range dependencies between images. The effectiveness of our network in image SR performance has been demonstrated, with a 0.59 dB increase in PSNR after introducing the FDEB module, further confirming its outstanding performance.
(2) The EWA module has become a critical component of the network, enabling it to learn the similarity between points in one view and pixels within epipolar line window in another view. The key role of this module lies in effectively integrating complementary information from stereo images, enhancing the model’s understanding of image structure.
(3) The REWA module has made a significant contribution to the effective fusion of complementary disparity attention maps. It achieves this by performing a secondary fusion of the disparity maps obtained through EWA, integrating features from different levels and scales.
(4) In quantitative evaluations, when provided with left and right views as input, EWASSR outperforms previous methods across four publicly available datasets, showcasing its exceptional performance in SR and confirming its continuous improvement over existing methods.
(5) Qualitative evaluations highlight the efficiency of EWASSR in generating visual results similar to GT images. This capability underscores the practical value of the model in enhancing image quality.
The research demonstrates that our EWASSR achieves outstanding SR performance while maintaining a relatively low parameter count. However, during the experiments, we identified areas for improvement in our model. Specifically, insufficient attention to view-specific information led to suboptimal performance under single inputs. Additionally, the method may face limitations in scenarios with motion blur, such as in the KITTI dataset. Therefore, designing an efficient and high-performance Stereo SR network is a major challenge in the current field. Future research will focus on image super-resolution in complex environments, combining attention to image-specific information and noise reduction to further optimize the method for broader applications.
Acknowledgement: The authors would like to thank the editors and reviewers for their valuable work.
Funding Statement: This work was supported by Sichuan Science and Technology Program (2023YFG0262).
Author Contributions: The authors confirm contribution to the paper as follows: Study conception and design: Xue Li, Hongying Zhang; data collection: Zixun Ye, Xiaoru Huang; analysis and interpretation of results: Xue Li, Hongying Zhang; draft manuscript preparation: Xue Li, Zixun Ye, Xiaoru Huang. All authors reviewed the results and approved the final version of the manuscript.
Availability of Data and Materials: The data that support the findings of this study are available from the first author, Xue Li, upon reasonable request.
Conflicts of Interest: The authors declare that they have no conflicts of interest to report regarding the present study.
References
1. V. A. Bhavsar and A. N. Rajagopalan, “Resolution enhancement in multi-image stereo,” IEEE Trans. Pattern Anal. Mac. Intell., vol. 32, no. 9, pp. 1721–1728, 2010. doi: 10.1109/TPAMI.2010.90. [Google Scholar] [PubMed] [CrossRef]
2. D. S. Jeon, S. H. Baek, I. Choi, and M. H. Kim, “Enhancing the spatial resolution of stereo images using a parallax prior,” in Proc. Comput. Vis. Pattern Recognit. (CVPR), Salt Lake City, UT, USA, 2018, pp. 1721–1730. [Google Scholar]
3. J. Zou, Z. Li, Z. Guo, and D. Hong, “Super-resolution reconstruction of images based on microarray camera,” Comput. Mater. Continua, vol. 60, no. 1, pp. 163–177, 2019. doi: 10.32604/cmc.2019.05795. [Google Scholar] [CrossRef]
4. H. Sheng, S. Z. Wang, D. Yang, R. X. Cong, and Z. L. Cui, “Cross-view recurrence-based self-supervised super-resolution of light field,” IEEE Trans. Circ. Syst. Vid. Tech., vol. 33, no. 12, pp. 7252–7266, 2023. doi: 10.1109/TCSVT.2023.3278462. [Google Scholar] [CrossRef]
5. Z. Hui, J. Li, X. B. Gao, and X. M. Wang, “Progressive perception-oriented network for single image super-resolution,” Inform. Sci., vol. 546, pp. 769–786, 2021. doi: 10.1016/j.ins.2020.08.114. [Google Scholar] [CrossRef]
6. X. J. Chu, L. G. Chen, and W. Q. Yu, “NAFSSR: Stereo image super-resolution using NAFNet,” in Proc. Comput. Vis. Pattern Recognit. (CVPR), New Orleans, LA, USA, 2022, pp. 1239–1248. [Google Scholar]
7. X. Y. Zhu, K. H. Guo, H. Fang, L. Chen, S. Ren and B. Hu, “Cross view capture for stereo image super-resolution,” IEEE Trans. Multimed., vol. 546, pp. 3074–3086, 2021. doi: 10.1109/TMM.2021.3092571. [Google Scholar] [CrossRef]
8. J. X. Lin, L. Y. Yin, and Y. J. Wang, “Steformer: Efficient stereo image super-resolution with transformer,” IEEE Trans. Multimed., vol. 25, pp. 8396–8407, 2023. doi: 10.1109/TMM.2023.3236845. [Google Scholar] [CrossRef]
9. Q. Y. Dai, J. C. Li, Q. S. Yi, F. M. Fang, and G. X. Zhang, “Feedback network for mutually boosted stereo image super-resolution and disparity estimation,” in Proc. ACM Int. Conf. Multimed. (ACM MM), Bejing, China, 2021, pp. 1985–1993. [Google Scholar]
10. W. Y. Ying, T. Y. Dong, and S. T. Chen, “Accurate stereo image super-resolution using spatial-attention-enhance residual network,” Multimed. Tools Appl., vol. 10, no. 11, pp. 12117–12133, 2023. doi: 10.1007/s11042-022-13815-x. [Google Scholar] [CrossRef]
11. K. Jiang, Z. Y. Wang, P. Yi, J. J. Jiang, J. Xiao and Y. Yao, “Deep distillation recursive network for remote sensing imagery super-resolution,” Remote Sens., vol. 10, no. 11, pp. 1700–1722, 2018. [Google Scholar]
12. Z. Hui, X. B. Gao, and X. M. Wang, “Lightweight image super-resolution with feature enhancement residual network,” Neurocomputing, vol. 404, pp. 50–60, 2020. doi: 10.1016/j.neucom.2020.05.008. [Google Scholar] [CrossRef]
13. W. M. Yang, W. Wang, X. C. Zhang, S. F. Su, and Q. M. Liao, “Lightweight feature fusion network for single image super-resolution,” IEEE Signal Proc. Let., vol. 26, no. 4, pp. 538–542, 2019. doi: 10.1109/LSP.2018.2890770. [Google Scholar] [CrossRef]
14. X. Tan, C. M. Sun, X. Sirault, R. Furbank, and T. D. Pham, “Stereo matching using cost volume watershed and region merging,” Signal Proc.: Image Commun., vol. 29, no. 10, pp. 1232–1244, 2014. doi: 10.1016/j.image.2014.06.002. [Google Scholar] [CrossRef]
15. Z. F. Liang et al., “Stereo matching using multi-level cost volume and multi-scale feature constancy,” IEEE Trans. Pattern Anal. Mach. Intell., vol. 43, no. 1, pp. 300–315, 2019. doi: 10.1109/TPAMI.2019.2928550. [Google Scholar] [PubMed] [CrossRef]
16. J. Wan, H. Yin, and Z. H. Liu, “Multi-stage edge-guided stereo feature interaction network for stereoscopic image super-resolution,” IEEE Trans. Broadcast, vol. 69, no. 2, pp. 357–368, 2023. doi: 10.1109/TBC.2023.3264880. [Google Scholar] [CrossRef]
17. Z. H. Wan, C. Jia, and C. Steven, “Deep learning for image super-resolution: A survey,” IEEE Trans. Pattern Anal. Mach. Intell., vol. 43, no. 10, pp. 3365–3387, 2020. doi: 10.1109/TPAMI.2020.2982166. [Google Scholar] [PubMed] [CrossRef]
18. C. Dong, C. C. Loy, K. He, and X. Tang, “Image super-resolution using deep convolutional networks,” IEEE Trans. Pattern Anal. Mach. Intell., vol. 38, no. 2, pp. 295–307, 2015. doi: 10.1109/015.2439281. [Google Scholar] [CrossRef]
19. Z. D. Zhang, X. R. Wang, and C. K. Jung, “DCSR: Dilated convolutions for single image super-resolution,” IEEE Trans. Image Process., vol. 28, no. 4, pp. 1625–1635, 2018. doi: 10.1109/TIP.2018.2877483. [Google Scholar] [PubMed] [CrossRef]
20. Y. F. Wang, L. J. Wang, H. Y. Wang, and P. H. Li, “End-to-end image super-resolution via deep and shallow convolutional networks,” IEEE Access, vol. 7, pp. 31959–31970, 2019. doi: 10.1109/ACCESS.2019.2903582. [Google Scholar] [CrossRef]
21. X. Che and C. W. Sun, “Multiscale recursive feedback network for image super-resolution,” IEEE Access, vol. 10, pp. 6393–6406, 2022. doi: 10.1109/ACCESS.2022.3142510. [Google Scholar] [CrossRef]
22. C. Yang and G. M. Lu, “Deeply recursive low-and high-frequency fusing networks for single image super-resolution,” Sens., vol. 20, no. 24, pp. 7268–77285, 2020. doi: 10.3390/s20247268. [Google Scholar] [PubMed] [CrossRef]
23. W. H. Yang et al., “Deep edge guided recurrent residual learning for image super-resolution,” IEEE Trans. Image Process., vol. 26, no. 12, pp. 5895–5907, 2017. doi: 10.1109/TIP.2017.2750403. [Google Scholar] [PubMed] [CrossRef]
24. J. W. Xin, J. Li, X. R. Jiang, and N. N. Wang, “Wavelet-based dual recursive network for image super-resolution,” IEEE Trans. Neur. Netw. Learn. Syst., vol. 33, no. 2, pp. 707–720, 2020. doi: 10.1109/TNNLS.2020.3028688. [Google Scholar] [PubMed] [CrossRef]
25. S. Anwar and N. Barne, “Densely residual laplacian super-resolution,” IEEE Trans. Pattern Anal. Mach. Intell., vol. 44, no. 3, pp. 1192–1204, 2020. doi: 10.1109/TPAMI.2020.3021088. [Google Scholar] [PubMed] [CrossRef]
26. L. Sun, Z. B. Liu, X. Y. Sun, L. C. Liu, R. S. Lan and X. N. Luo, “Lightweight image super-resolution via weighted multi-scale residual network,” IEEE/CAA J. Autom. Sin., vol. 8, no. 7, pp. 1271–1280, 2021. doi: 10.1109/JAS.2021.1004009. [Google Scholar] [CrossRef]
27. H. Li and F. L. Cao, “Lightweight image super-resolution via weighted multi-scale residual network,” Neural Netw., vol. 13, pp. 84–95, 2020. doi: 10.1109/JAS.2021.1004009. [Google Scholar] [CrossRef]
28. J. C. Li, F. M. Fang, J. Q. Li, K. F. Mei, and G. X. Zhang, “MDCN: Multi-scale dense cross network for image super-resolution,” IEEE Trans. Circ. Syst. Vid. Technol., vol. 31, no. 7, pp. 2547–2561, 2020. doi: 10.1109/TCSVT.2020.3027732. [Google Scholar] [CrossRef]
29. K. Yang et al., “Residual feature attentional fusion network for lightweight chest CT image super-resolution,” Comput. Mater. Continua, vol. 75, no. 3, pp. 5159–5176, 2023. doi: 10.32604/cmc.2023.036401. [Google Scholar] [CrossRef]
30. Y. Zhang, K. Li, K. Li, L. Wang, B. Zhong and Y. Fu, “Image super-resolution using very deep residual channel attention networks,” in Proc. Eur. Conf. Comput. Vis. (ECCV), Munich, Germany, 2018,pp. 286–301. [Google Scholar]
31. E. M. Lu and X. X. Hu, “Image super-resolution via channel attention and spatial attention,” Appl. Intell., vol. 52, no. 2, pp. 2260–2268, 2022. doi: 10.1007/s10489-021-02464-6. [Google Scholar] [CrossRef]
32. S. Khan, M. Naseer, M. Hayat, S. W. Zamir, F. S. Khan and M. Shah, “Transformers in vision: A survey,” ACM Comput. Surv., vol. 54, no. 10s, pp. 1–41, 2022. doi: 10.1145/3505244. [Google Scholar] [CrossRef]
33. Q. P. Jiang et al., “Single image super-resolution quality assessment: A real-world dataset, subjective studies and an objective metric,” IEEE Trans. Image Proc., 2023, vol. 31, pp. 2279–2294, 2022. doi: 10.1109/TIP.2022.3154588. [Google Scholar] [PubMed] [CrossRef]
34. C. Saharia, J. Ho, W. Chan, T. Salimans, D. J. Fleet and M. Norouzi, “Image super-resolution via iterative refinement,” IEEE Trans. Pattern Anal. Mach. Intell., vol. 45, no. 4, pp. 4713–4726, 2023. doi: 10.1109/TPAMI.2022.3204461. [Google Scholar] [PubMed] [CrossRef]
35. X. Y. Chen, X. T. Wang, and J. T. Zhou, “Activating more pixels in image super-resolution transformer,” in Proc. Comput. Vis. Pattern Recognit. (CVPR), Vancouver, Canada, 2023, pp. 22367–22377. [Google Scholar]
36. A. M. Ali, B. Benjdira, A. Koubaa, W. El-Shafai, Z. Khan and B. Khan, “Vision transformers in image restoration: A survey,” Sens., vol. 23, no. 5, pp. 2385–2407, 2023. doi: 10.3390/s23052385. [Google Scholar] [PubMed] [CrossRef]
37. A. Mehri, P. Behjati, D. Carpio, S. Bai, and A. D. Sappa, “SRFormer: Efficient yet powerful transformer network for single image super resolution,” IEEE Access, vol. 11, pp. 121457–121469, 2023. doi: 10.1109/ACCESS.2023.3328229. [Google Scholar] [CrossRef]
38. S. Park and Y. S. Choi, “Image super-resolution using dilated window transformer,” IEEE Access, vol. 11, pp. 60028–60039, 2023. doi: 10.1109/ACCESS.2023.3284539. [Google Scholar] [CrossRef]
39. J. Liu, J. Tang, and G. S. Wu, “Residual feature distillation network for lightweight image super-resolution,” in Proc. Eur. Conf. Comput. Vis. (ECCV), Glasgow, UK, 2020, pp. 41–55. [Google Scholar]
40. X. Qiao, C. Y. Ge, and P. C. Deng, “Depth restoration in under-display time-of-flight imaging,” IEEE Trans. Pattern Anal. Mach. Intell., vol. 45, no. 5, pp. 5668–5683, 2022. doi: 10.1109/TPAMI.2022.3209905. [Google Scholar] [PubMed] [CrossRef]
41. T. Y. Zhang, Y. Gu, and X. L. Huang, “Disparity-constrained stereo endoscopic image super-resolution,” Int. J. Comput. Asst. Radiol. Surg., vol. 17, no. 5, pp. 867–875, 2022. doi: 10.1007/s11548-022-02611-5. [Google Scholar] [PubMed] [CrossRef]
42. L. G. Wang et al., “Learning parallax attention for stereo image super-resolution,” in Proc. Comput. Vis. Pattern Recognit. (CVPR), Long Beach, CA, USA, 2019, pp. 12250–12259. [Google Scholar]
43. L. G. Wang et al., “Parallax attention for unsupervised stereo correspondence learning,” IEEE Trans. Pattern Anal. Mach. Intell., vol. 44, no. 4, pp. 2108–2125, 2020. doi: 10.1109/TPAMI.2020.3026899. [Google Scholar] [PubMed] [CrossRef]
44. W. Song, S. Choi, S. Jeong, and K. Sohn, “Stereoscopic image super-resolution with stereo consistent feature,” in Proc. AAAI Conf. Artif. Intell., vol. 34, no. 7, pp. 12031–12038, 2020. doi: 10.1609/aaai.v34i07.6880. [Google Scholar] [CrossRef]
45. J. J. Lei et al., “Deep stereoscopic image super-resolution via interaction module,” IEEE Trans. Circ. Syst. Video Technol., vol. 31, no. 8, pp. 3051–3061, 2021. doi: 10.1109/TCSVT.2020.3037068. [Google Scholar] [CrossRef]
46. C. Q. Chen, C. M. Qing, X. M. Xu, and P. Dickinson, “Cross parallax attention network for stereo image super-resolution,” IEEE Trans. Multimed., vol. 2, pp. 202–216, 2021. doi: 10.1109/TMM.2021.3050092. [Google Scholar] [CrossRef]
47. X. Y. Ying, Y. Q. Wang, L. G. Wang, W. D. Sheng, A. Wei and Y. Guo, “A stereo attention module for stereo image super-resolution,” IEEE Signal Proc. Let., vol. 27, pp. 496–500, 2020. doi: 10.1109/LSP.2020.2973813. [Google Scholar] [CrossRef]
48. Y. Q. Wang, X. Y. Ying, L. G. Wang, and Y. G. Yang, “Symmetric parallax attention for stereo image super-resolution,” in Proc. Comput. Vis. Pattern Recognit. (CVPR), 2021, pp. 766–775. [Google Scholar]
49. G. S. Liu, H. J. Yue, Y. Kun, and J. Y. Yang, “Disparity-guided light field image super-resolution via feature modulation and recalibration,” IEEE Trans. Broadcast., vol. 69, no. 3, pp. 740–752, 2023. doi: 10.1109/TBC.2023.3284408. [Google Scholar] [CrossRef]
50. K. Chen, L. Y. Li, H. Liu, Y. Z. Li, C. L. Tang and J. Chen, “SwinFSR: Stereo image super-resolution using SwinIR and frequency domain knowledge,” in Proc. Comput. Vis. Pattern Recognit. (CVPR), Vancouver, Canada, 2023, pp. 1764–1774. [Google Scholar]
51. Y. Qu, R. K. Baghbaderani, H. Qi, and C. Kwan, “Unsupervised Pansharpening based on self-attention mechanism,” IEEE Trans. Geosci. Remote Sens., vol. 59, no. 4, pp. 3192–3208, 2021. doi: 10.1109/TGRS.2020.3009207. [Google Scholar] [CrossRef]
52. X. Li, H. Y. Zhang, L. P. Zhang, Z. X. Ye, J. T. Pu and M. Yuan, “Swin transformer-based cross-view attention network for stereo image super-resolution,” in Proc. Pattern Recognit. Artif. Intell. (PRAI), Haikou, China, 2021, pp. 654–659. [Google Scholar]
53. J. Kim, J. K. Lee, and K. M. Lee, “Accurate image super-resolution using very deep convolutional networks,” in Proc. Comput. Vis. Pattern Recognit. (CVPR), Las Vegas, NV, USA, 2016, pp. 1646–1654. [Google Scholar]
54. Y. L. Zhang, Y. P. Tian, Y. Kong, B. N. Zhong, and Y. Fu, “Residual dense network for image restoration,” Residual Dense Netw. Image Restor., vol. 43, no. 7, pp. 2480–2495, 2020. doi: 10.1109/PAMI.2020.2968521. [Google Scholar] [CrossRef]
Cite This Article
 Copyright © 2024 The Author(s). Published by Tech Science Press.
This work is licensed under a Creative Commons Attribution 4.0 International License , which permits unrestricted use, distribution, and reproduction in any medium, provided the original work is properly cited.
 Downloads
 Citation Tools