
 Submit a Paper
 Propose a Special lssue
 Open Access
REVIEW
Survey and Prospect for Applying Knowledge Graph in Enterprise Risk Management
1 School of Information and Control Engineering, Qingdao University of Technology, Qingdao, 266520, China
2 Department of Game Design, Uppsala University, Visby, 62167, Sweden
* Corresponding Author: Jinlong Wang. Email:
Computers, Materials & Continua 2024, 78(3), 3825-3865. https://doi.org/10.32604/cmc.2024.046851
Received 17 October 2023; Accepted 29 January 2024; Issue published 26 March 2024
 View Full Text
 Download PDF
Abstract
Enterprise risk management holds significant importance in fostering sustainable growth of businesses and in serving as a critical element for regulatory bodies to uphold market order. Amidst the challenges posed by intricate and unpredictable risk factors, knowledge graph technology is effectively driving risk management, leveraging its ability to associate and infer knowledge from diverse sources. This review aims to comprehensively summarize the construction techniques of enterprise risk knowledge graphs and their prominent applications across various business scenarios. Firstly, employing bibliometric methods, the aim is to uncover the developmental trends and current research hotspots within the domain of enterprise risk knowledge graphs. In the succeeding section, systematically delineate the technical methods for knowledge extraction and fusion in the standardized construction process of enterprise risk knowledge graphs. Objectively comparing and summarizing the strengths and weaknesses of each method, we provide recommendations for addressing the existing challenges in the construction process. Subsequently, categorizing the applied research of enterprise risk knowledge graphs based on research hotspots and risk category standards, and furnishing a detailed exposition on the applicability of technical routes and methods. Finally, the future research directions that still need to be explored in enterprise risk knowledge graphs were discussed, and relevant improvement suggestions were proposed. Practitioners and researchers can gain insights into the construction of technical theories and practical guidance of enterprise risk knowledge graphs based on this foundation.Keywords
In recent years, influenced by the fluctuations in the global economic situation, many industries have faced intensified competition and an unstable market environment, posing severe challenges to the operation and development of enterprises at all levels in China. With various uncertain risk factors emerging, enterprise managers and financial regulatory authorities must establish a sound enterprise risk management mechanism to safeguard stable operation and sustainable development. Enterprise risk management refers to the process in which enterprises use various scientific methods to investigate and identify sources of risks, evaluate and warn of unidentified risk sources, and handle risk events to achieve operational objectives [1]. From the perspective of risk nature, enterprise risks have diversified characteristics. Existing research commonly evaluates and measures enterprise risks from multiple dimensions, such as strategic risks, financial risks, market risks, operational risks, and legal risks [2–4], following the “Comprehensive Risk Management Guideline for Central Enterprises” issued by the State-owned Assets Supervision and Administration Commission of the State Council. The traditional model of enterprise risk analysis primarily relies on large-scale data collection and indicator statistics to analyze common characteristics of enterprise risks. The rapid development of information technology has led to fragmented risk information spreading across various corners of the Internet. The traditional “stacked type” data storage and management methods are unable to deeply explore the potential value contained in risk information or establish logical relationships between enterprise risk knowledge. As a result, the analysis and management of enterprise risks face the predicament of data barriers and information silos. Furthermore, the current methods of enterprise risk assessment mainly rely on economic indicators and risk trigger criteria set by experts in the field. This belongs to a risk analysis model oriented towards numerical results, lacking the analysis and deduction of the propagation context of risks. Consequently, it is challenging to promptly obtain accurate risk information and plan optimal risk response decisions in the face of rapidly changing and complex risk environments. As a branch of the new generation of artificial intelligence technologies, knowledge graphs [5], relying on their excellent knowledge association and reasoning capabilities, can effectively integrate multi-source heterogeneous data and help risk analysts capture enterprise risk signals from diversified information sources such as business operation information, credit records, financial announcements, and public sentiment news. Moreover, the topological and semantic associations inherent in knowledge graphs enable risk analysts to focus on the risk propagation process rather than just numerical results. By revealing the intersections of relationships such as supply, transactions, and cooperation between enterprises, it provides clues for analyzing the risks’ sources and potential impacts, making enterprise risk assessment and prediction interpretable.
Currently, many scholars have explored the application of knowledge graphs in the field of enterprise risk management and have achieved significant progress in intelligent tasks such as dynamic perception of enterprise risk, assessment of risk severity, and analysis of risk response decision-making. However, there is a lack of systematic analysis and summarization of the research on knowledge graphs in the field of enterprise risk management, and existing literature reviews on domain-specific knowledge graphs in the financial or risk domains do not align well with the inherent risk scenarios in enterprise risk management. This makes it difficult for researchers and practitioners to comprehend how to select suitable technologies for constructing enterprise risk knowledge graphs, as well as how to design knowledge graph-based risk reasoning methods for different risk requirement scenarios. Hence, we start by conducting a statistical analysis of the development trends and critical directions in the field of enterprise risk knowledge graphs using the CiteSpace tool. Later, this review highlights advanced technologies at different stages of enterprise risk knowledge graph construction, elaborating on their technical applicability and potential research directions. We then analyze cutting-edge application scenarios from the perspective of application scenarios based on the hot directions of enterprise risk knowledge graphs. Moreover, we delve into the opportunities and challenges within the field of enterprise risk, providing constructive recommendations in the hope of assisting researchers in the field.
2 Concept and Application Architecture of Knowledge Graph in Enterprise Risk Domain
The concept of a knowledge graph was initially positioned as a new-generation search engine that provides intelligent search services [6]. With continuous in-depth research on knowledge graphs, the academic community generally agrees that knowledge graphs are essentially large-scale semantic networks [7]. Triplets, which are stored as information in graph data structures, are the basic units that constitute a knowledge graph [8]. As an extension and evolution of the knowledge graph, the concept of Causal Graph was proposed at the China Computer Conference to describe the evolution laws of events [9]. It is essentially a knowledge graph that stores causal logical relationships. Enterprise risk knowledge graphs, relying on knowledge graphs, causal knowledge graphs, temporal knowledge graphs, and other derived forms, have gradually become an emerging medium for serving enterprise risk management. It is also an applied product that combines knowledge graph with the field of enterprise risk. By encapsulating the concept of knowledge graphs in the relevant domain, we define the enterprise risk knowledge graph as
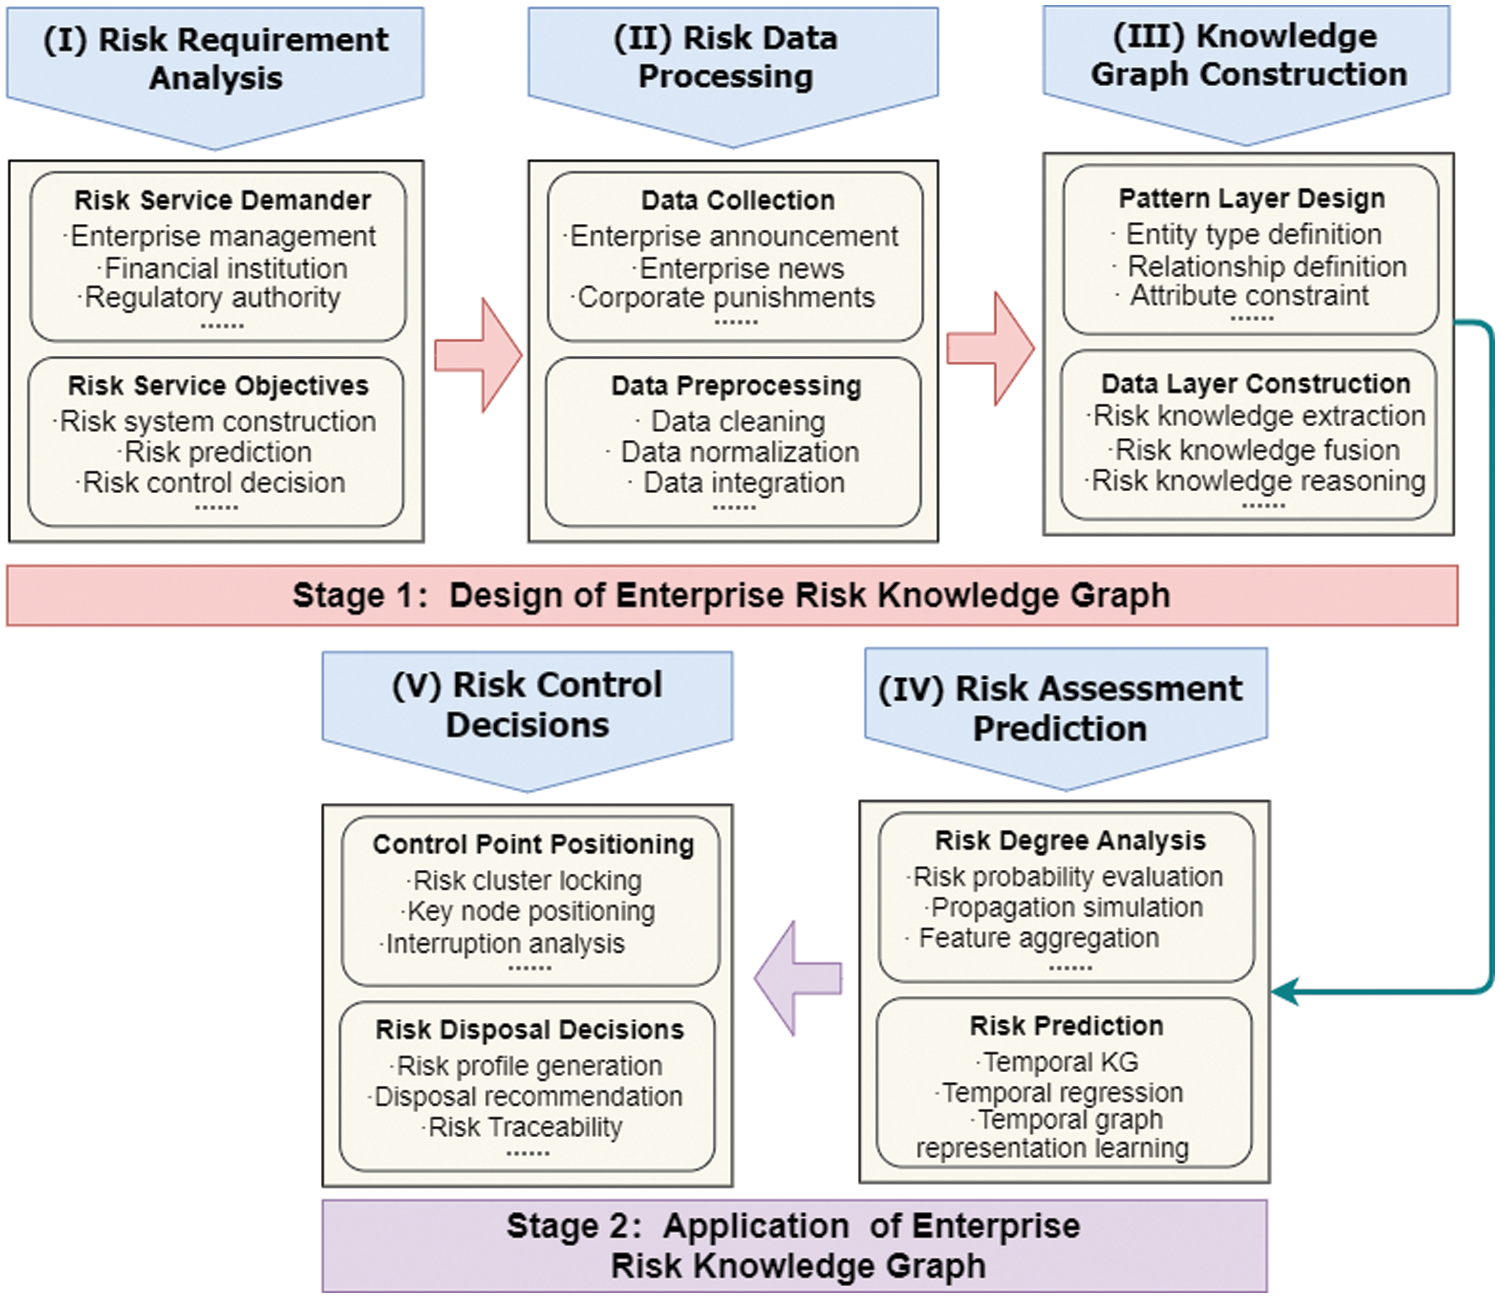
Figure 1: Design and application process of enterprise risk knowledge graph
3 Data Source and Statistical Analysis of Current Research Status
This section employs bibliometric analysis to reveal trends and key research directions in the development of the field of enterprise risk knowledge graphs.
3.1 Data Source and Development Trends
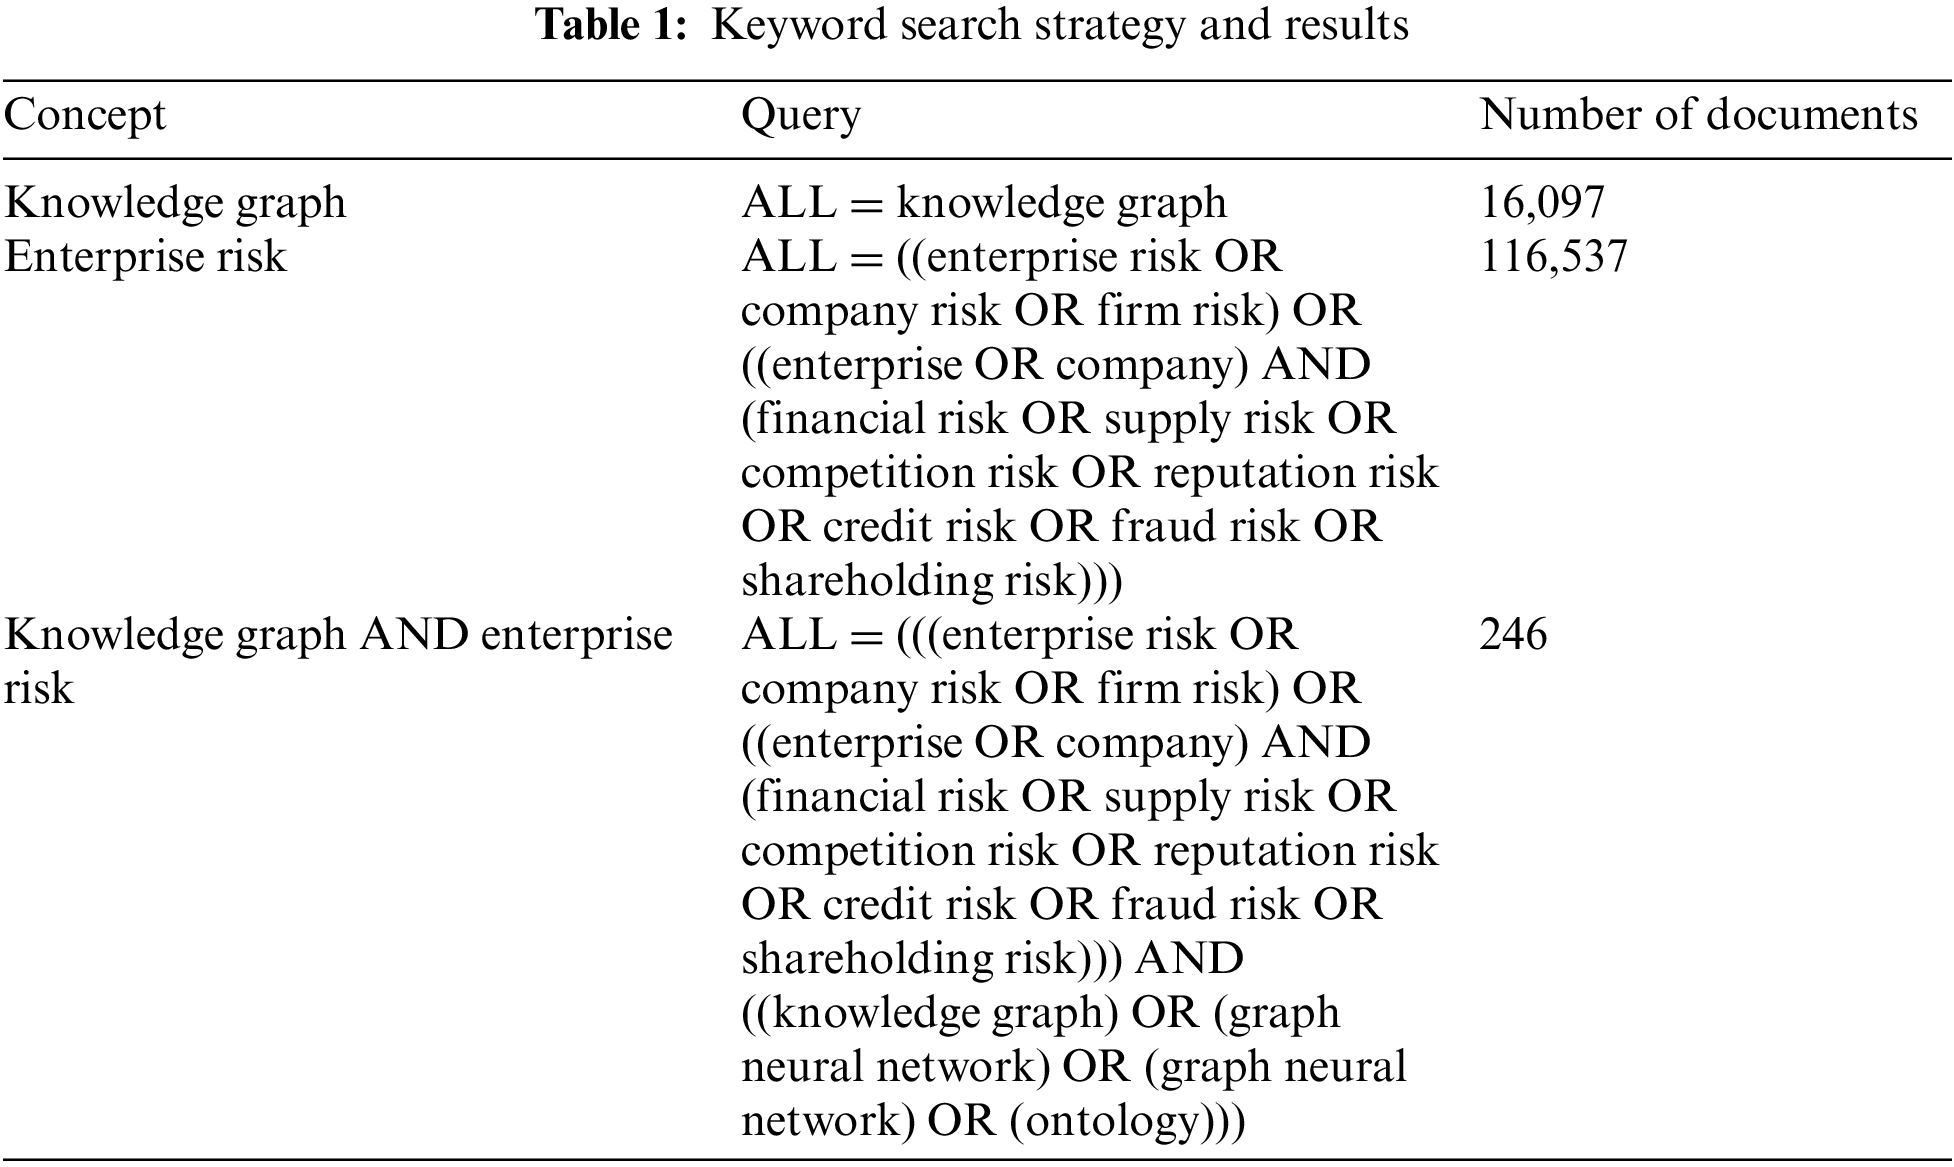
In this study, the Web of Science Core Collection was chosen as the data source for literature retrieval. The search was limited to journal articles, and the main concepts for the retrieval were knowledge graphs and enterprise risk. A specific keyword search strategy was employed, and the number of relevant pieces of literature is shown in Table 1. The retrieval was conducted until September 2023. The retrieved literature was carefully reviewed and assessed to determine its relevance, resulting in 246 retained English-language articles for statistical analysis.
Based on the trends exhibited in the cumulative annual publication counts of English literature as shown in Fig. 2, it is evident that there has been a consistent growth in the number of publications related to the knowledge graph topic over the years. However, the research on integrating knowledge graphs and the enterprise risk domain has gradually emerged in the past five years, showing a significant increase in the number of publications. Statistical data indicates that the highest annual publication count for relevant English literature reached more than 40 articles, highlighting the enthusiasm of experts and scholars in researching knowledge graphs in the field of enterprise risk and the acknowledgment of knowledge graphs’ role in advancing research in enterprise risk management.
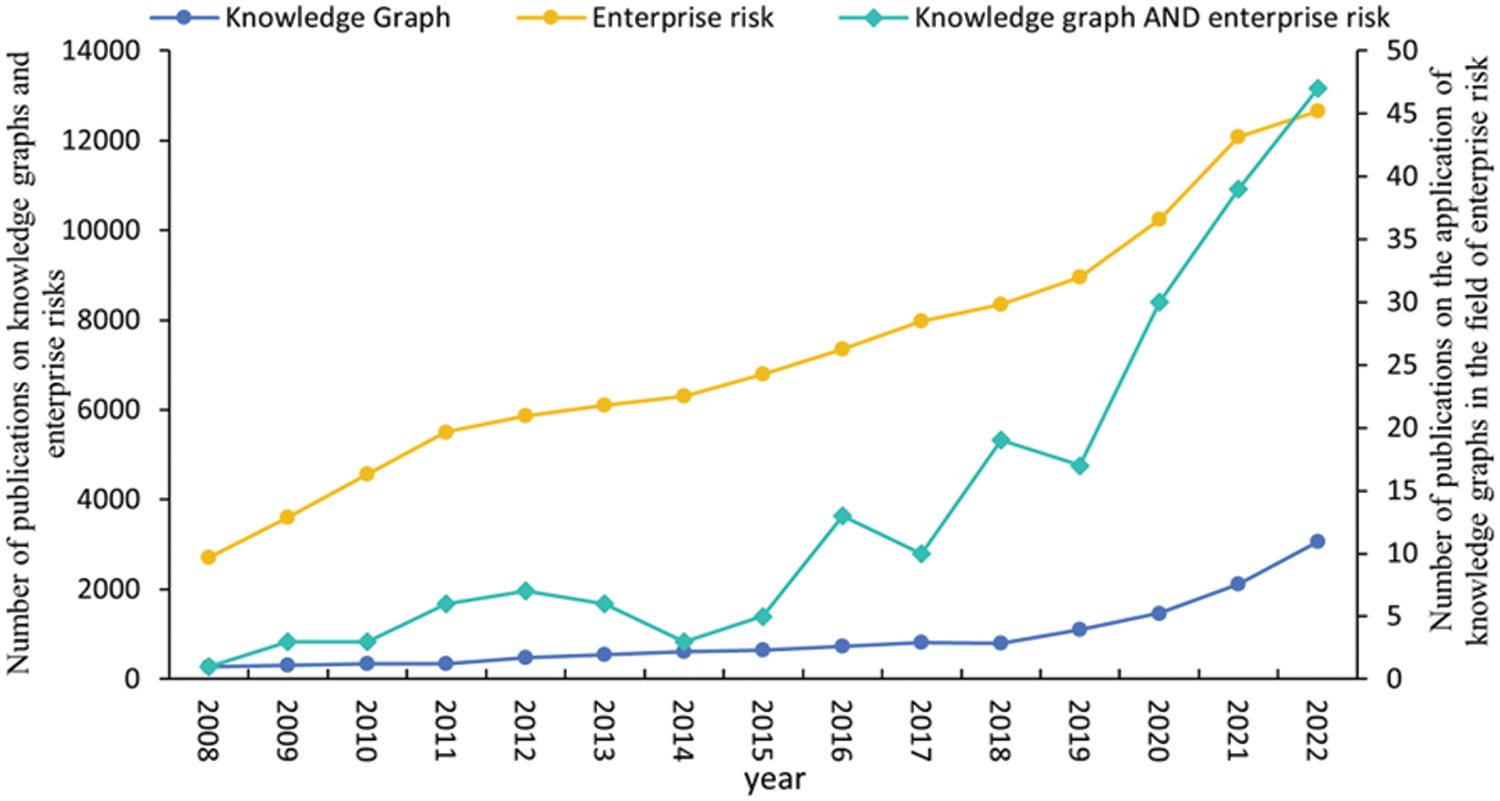
Figure 2: Changes in the number of publications in related fields
3.2 Analysis of Research Status
During the bibliometric analysis stage, this study conducted statistical analysis on 246 English papers after screening. Table 2 presents the top 10 journals in terms of publication volume in the field of integrating knowledge graph and enterprise risk.
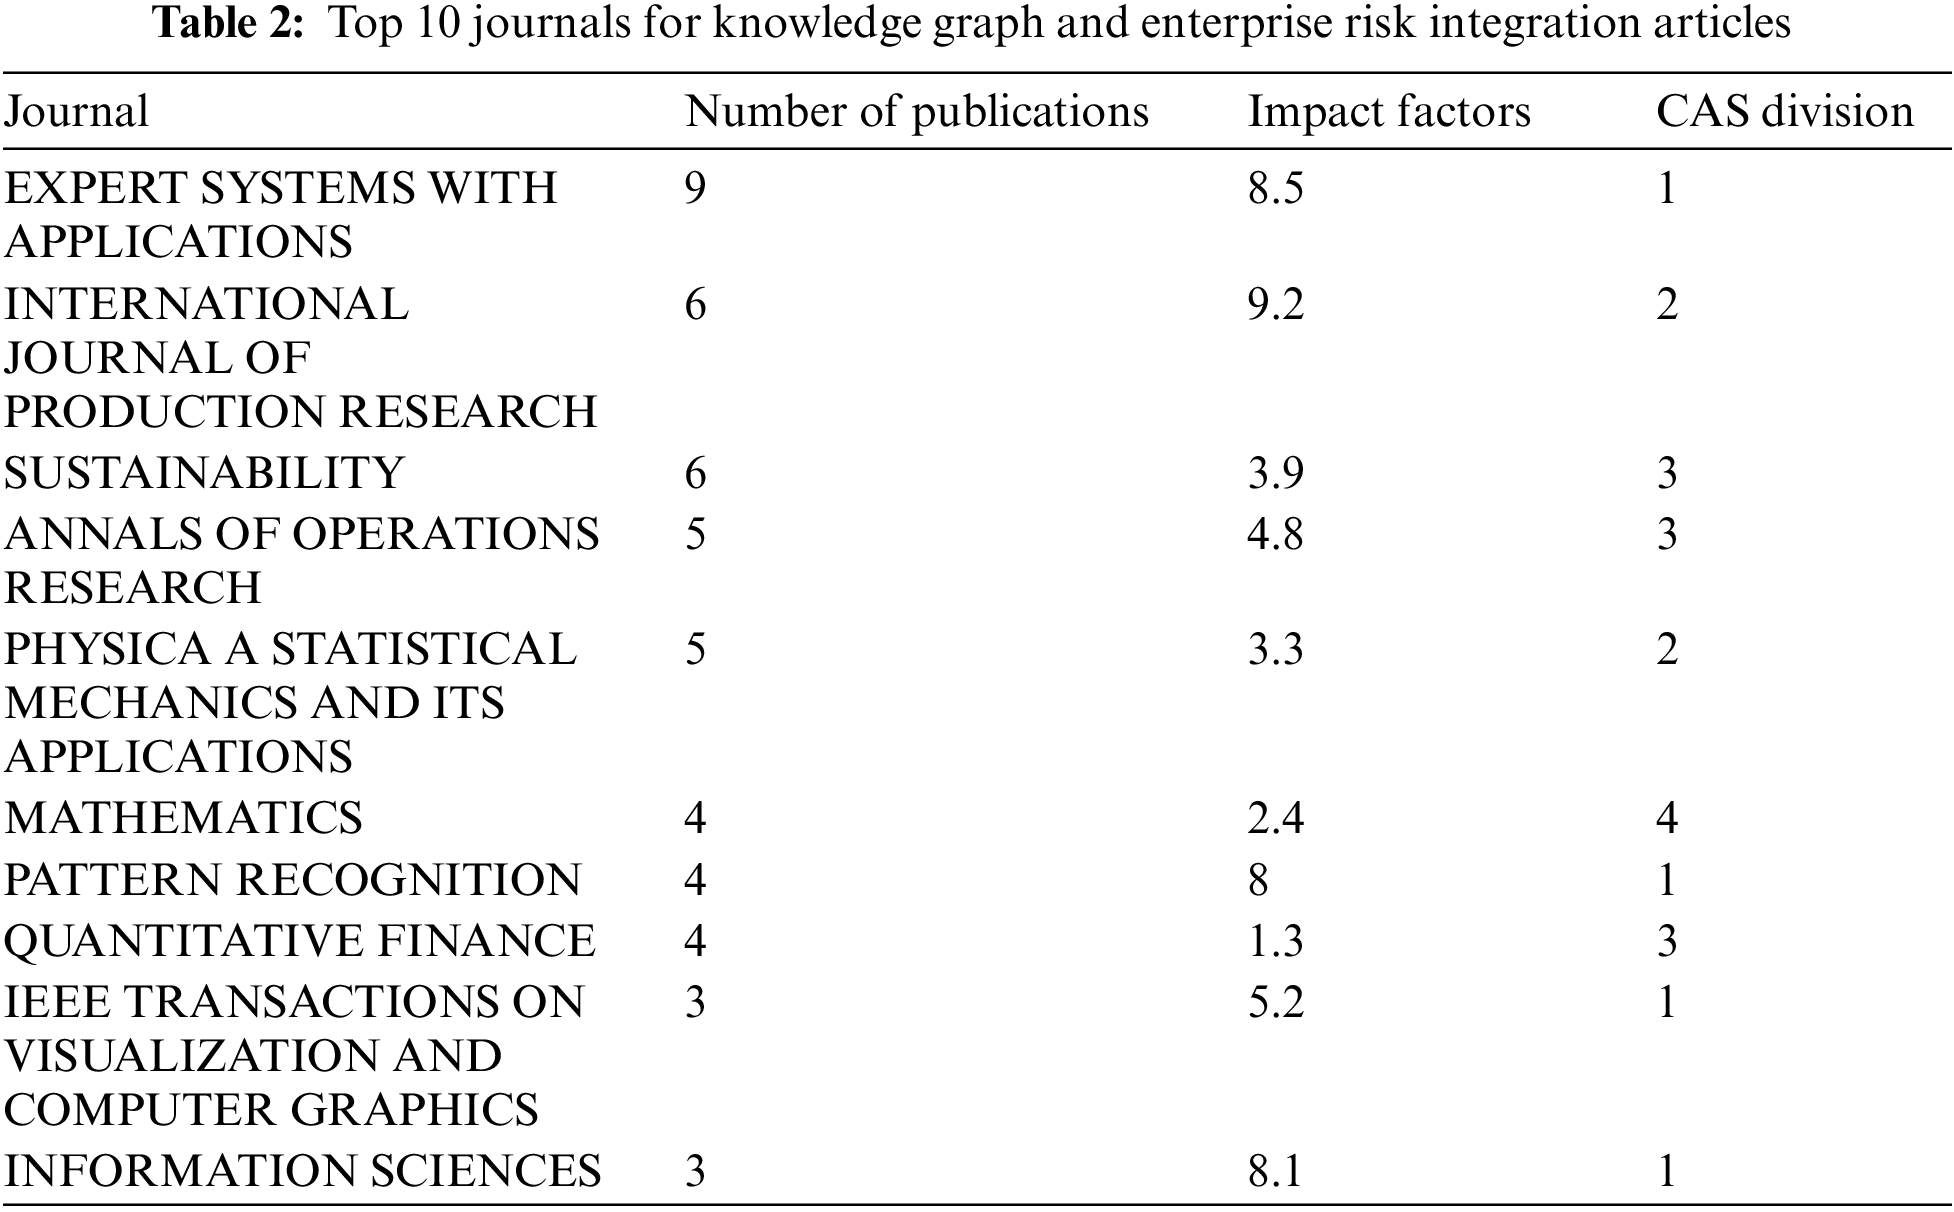
It can be observed that many studies related to knowledge graph in the field of enterprise risk have been accepted and published by journals with higher Chinese Academy of Sciences (CAS) ranking. The research on enterprise risk management using knowledge graphs as a medium has been extensively conducted in the academic community and has gained wide recognition.
Fig. 3 illustrates the distribution of published papers in different countries or regions. China, the United States, and the United Kingdom are the top three countries in terms of the scale of literature in the specific research field mentioned, and they stand out in terms of both publication and citation counts. Specifically, the number of citations for publications from China and the United States reached 518 and 1258, respectively, indicating a high level of technological advancement in research on the application of knowledge graph to enterprise risk.
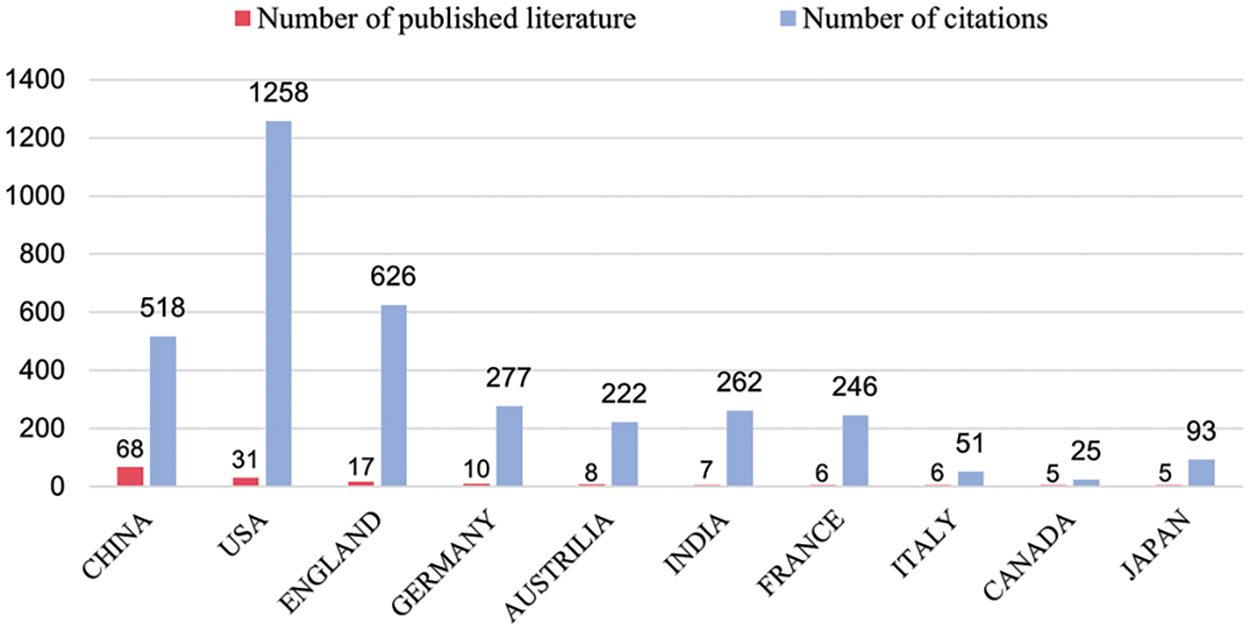
Figure 3: 10 countries or regions with the most published and cited relevant literature
3.2.2 Analysis of Key Research Directions
The literature data from the Web of Science database was inputted into the CiteSpace visualization tool to create a keyword co-occurrence network, which is a standard method for investigating research hotspots and trends. The keyword co-occurrence network helps reveal the knowledge structure underlying the research topic. Fig. 4 presents the keyword co-occurrence network of knowledge graph technology in enterprise risk. Internal nodes represent specific keywords, and the size of the nodes is proportional to the frequency of keyword occurrence. The thickness of the links between nodes represents the closeness of the association between the corresponding keywords. From the perspective of the evolution of keywords over time, this study assigned different colors to corresponding nodes based on the year of keyword emergence. Darker colors represent keywords that drew attention and discussion earlier, while lighter colors represent keywords that have received significant attention from researchers in recent years. Additionally, topic nodes with a purple outline have higher centrality and correspond to hot topics widely recognized by experts and scholars. Through the analysis of the development trends of research hotspots, it can be observed that topics such as corporate financial risk, supply risk, credit risk, fraud, and money laundering risk are the focus at the intersection of knowledge graph and enterprise risk. The related methods involve techniques such as deep learning, graph neural networks, and risk propagation analysis.
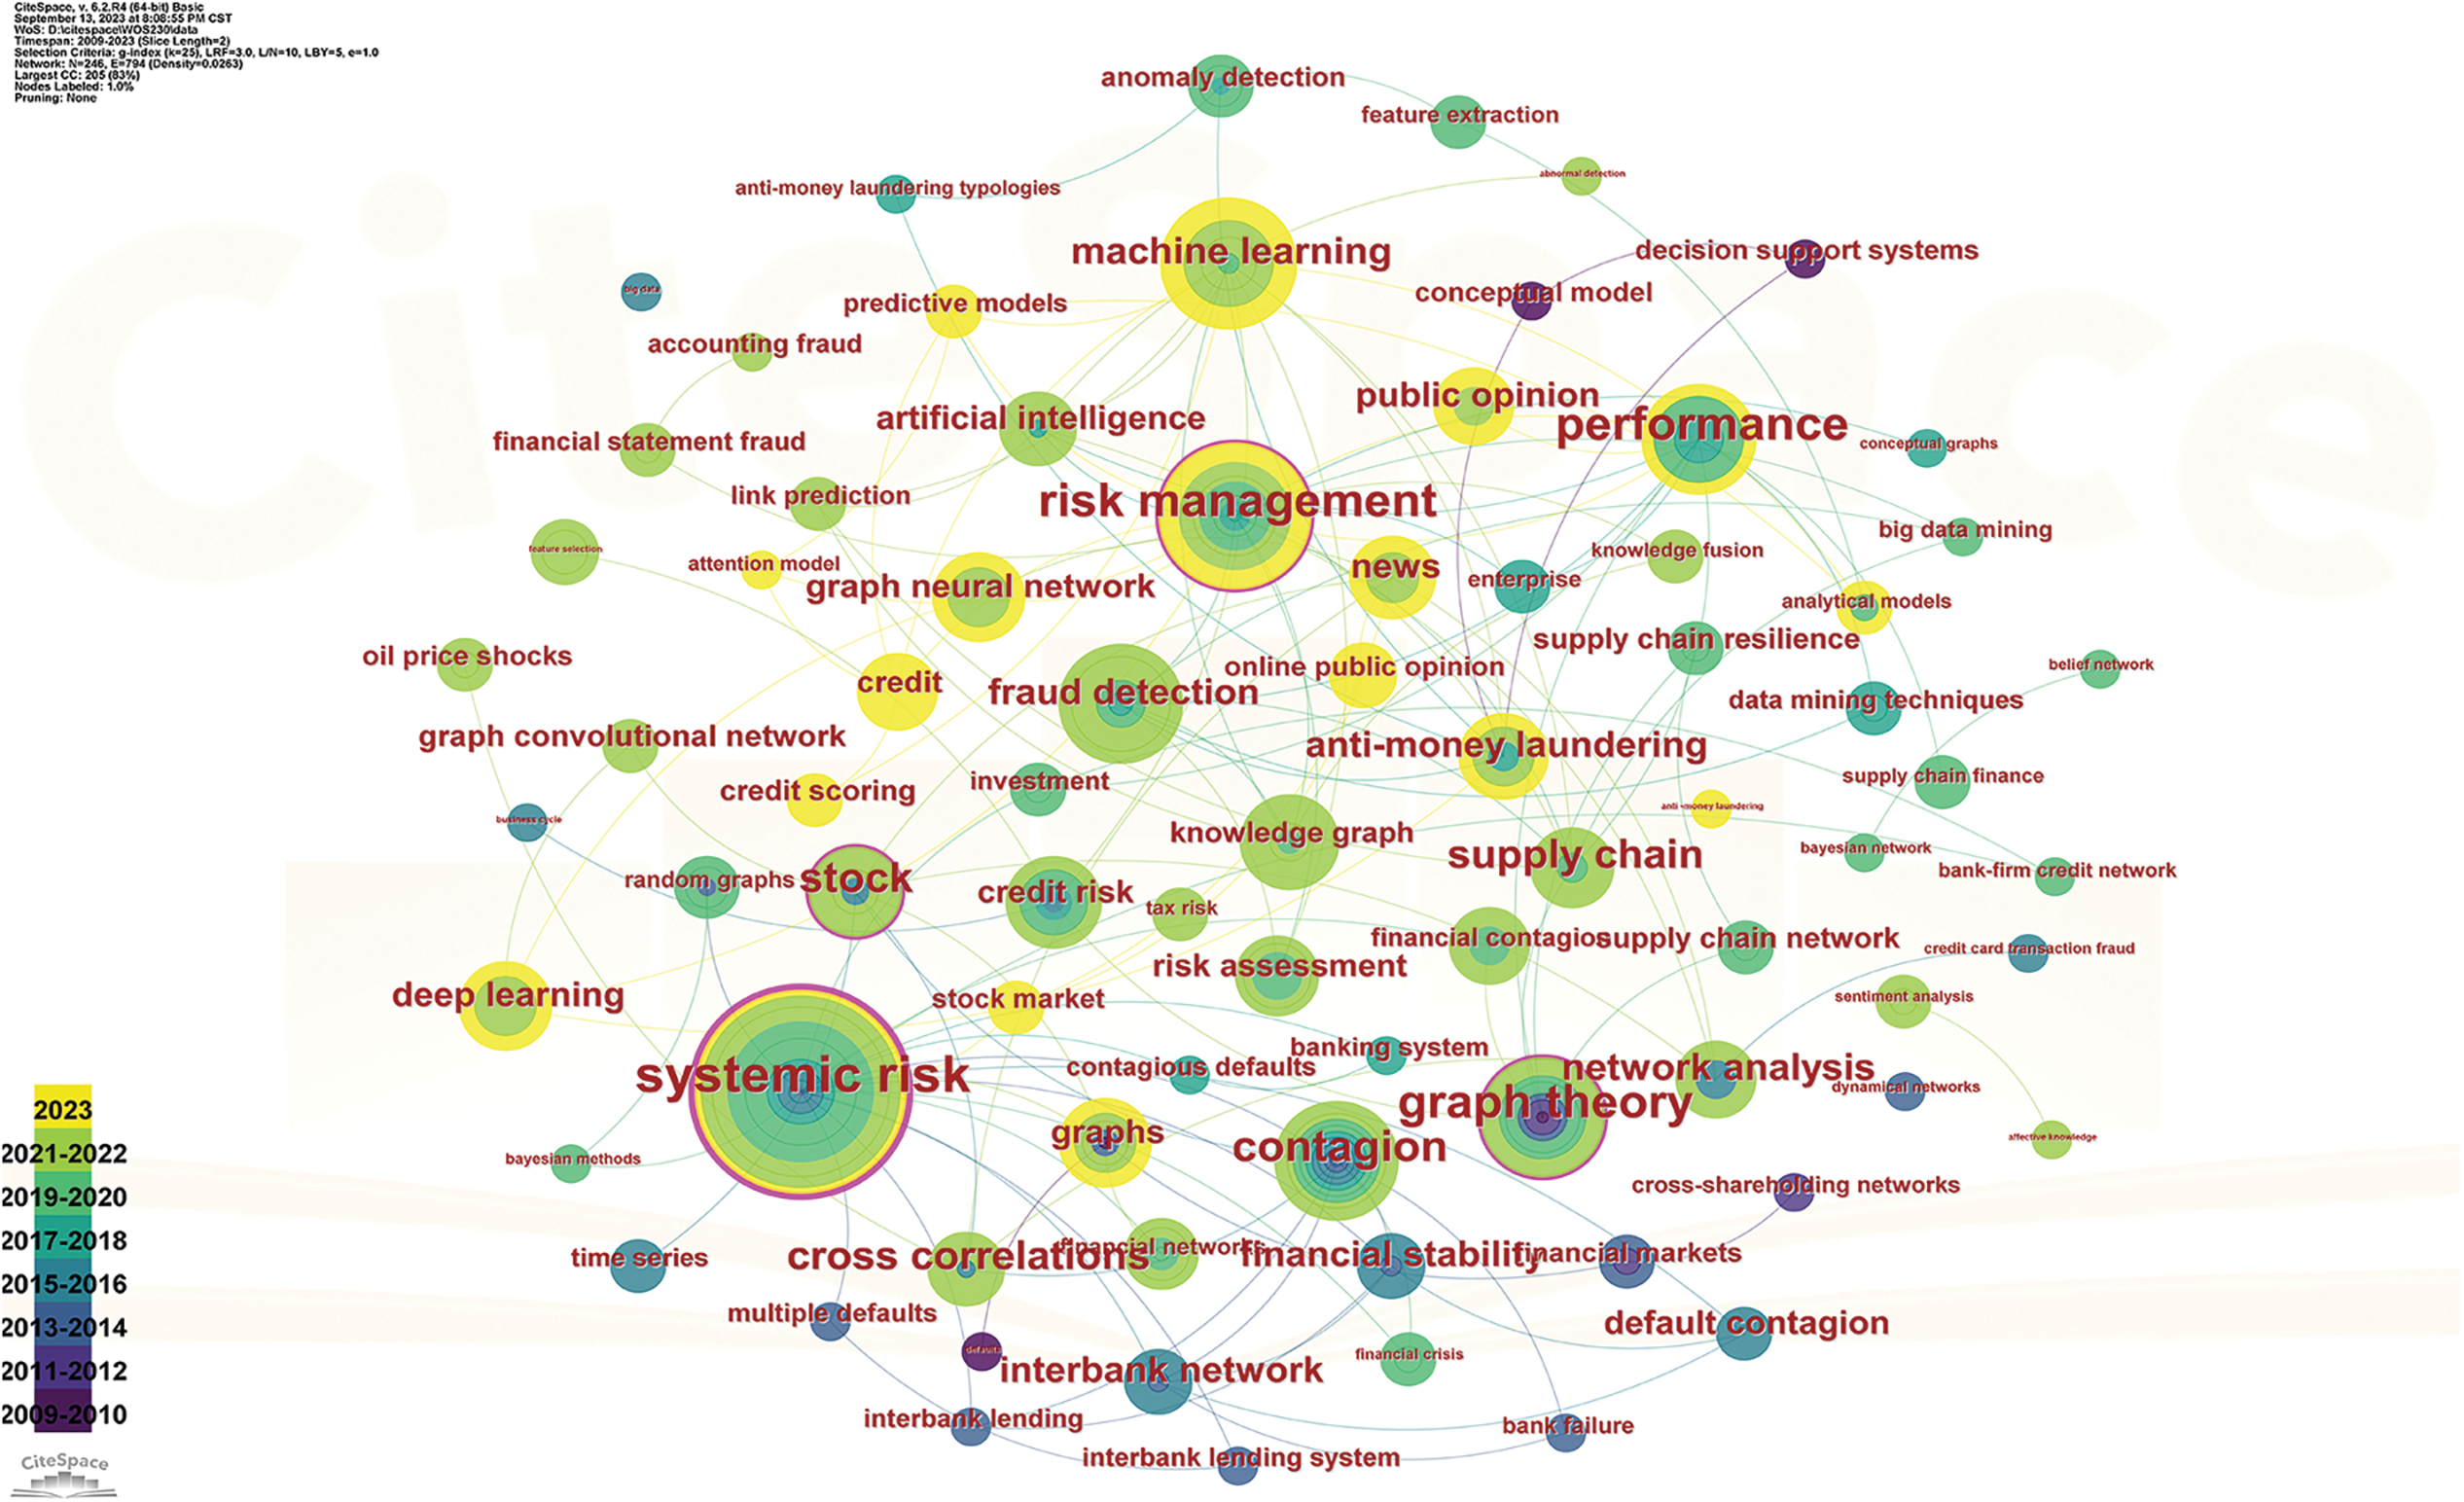
Figure 4: Knowledge graph and enterprise risk fusion keyword co-occurrence network
4 Design and Construction of Enterprise Risk Knowledge Graph
Focusing on enterprise risk management, the accuracy of risk identification and assessment requires fine-grained data granularity and comprehensive knowledge dimension in the enterprise risk knowledge graph. Therefore, it is more suitable to adopt a top-down approach to construct the knowledge graph, where domain experts pre-construct the ontology of the knowledge graph and then utilize pre-processed entities, relationships, and attribute information to complete the graph’s population and enrichment. The process of constructing the knowledge graph for the enterprise risk domain is illustrated in Fig. 5. Among them, risk knowledge extraction and fusion are the key steps in designing and building the knowledge graph. This chapter will focus on introducing the methods involved in constructing the enterprise risk knowledge graph, objectively and meticulously comparing the strengths and weaknesses of various technologies. The knowledge reasoning step is then connected to specific application services of the knowledge graph, which will be analyzed in detail in the subsequent chapters.
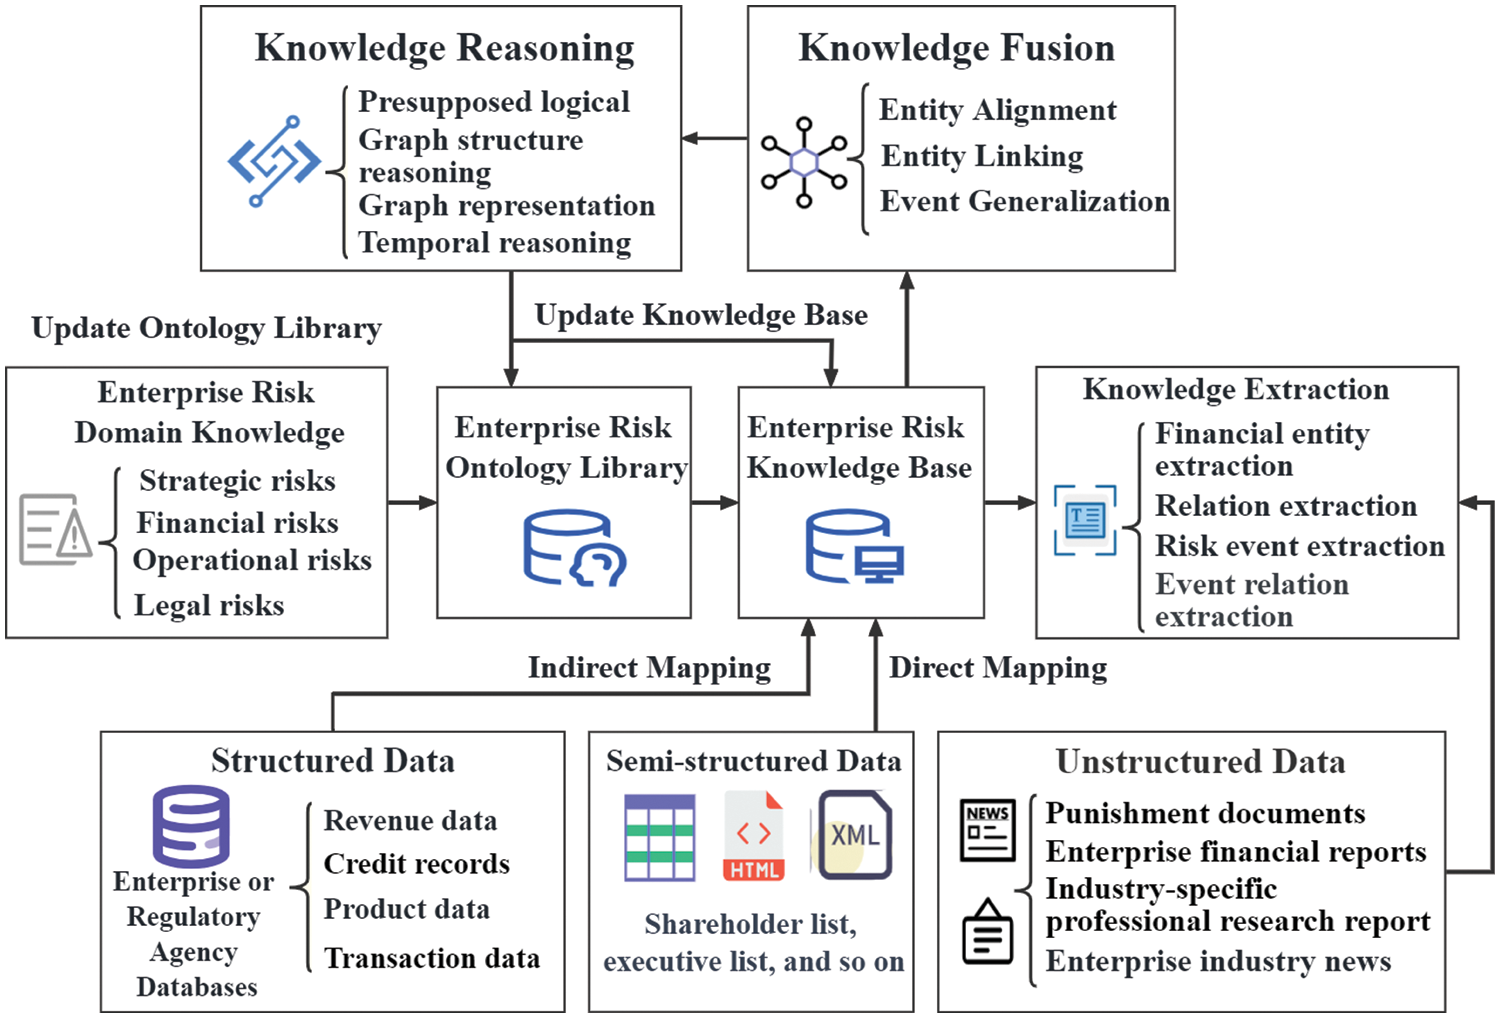
Figure 5: The process of constructing an enterprise risk knowledge graph
4.1 Knowledge Extraction in the Field of Enterprise Risk
Knowledge extraction in the field of enterprise risk is a primary step in constructing a risk knowledge graph, and the accuracy of extraction directly influences the application performance of the knowledge graph. Depending on the different objects of knowledge extraction, it mainly includes risk entity extraction, risk relationship extraction, and risk event extraction.
4.1.1 Metrics for Knowledge Extraction in the Enterprise Risk Domain
Centering on knowledge extraction in enterprise risk, the common evaluative approach involves the transformation of the knowledge extraction task into a binary classification. The objective is to ascertain whether the model can accurately extract corresponding risk entities or relations. Essentially, assessing the model’s extraction performance relies on evaluating the distribution of the contingency table, derived from the sampled values extracted by the model and the actual labels of the target samples [10]. To enhance model robustness, numerous researchers have incorporated negative examples by generating them through approaches, such as content removal or replacement in the text. Precision (PRE) focuses on the extraction performance of positive examples, while Accuracy (ACC) is an indicator designed to simultaneously evaluate the extraction performance of both positive and negative instances. Recall (REC) examines whether target entities or relationships are overlooked during extraction, functioning as a measure of sensitivity [11]. F1 score (F1) represents the harmonic mean of precision and recall, providing a comprehensive assessment of extraction performance. These metrics offer diverse perspectives and mutually complement each other in evaluating enterprise risk knowledge extraction. The specific calculation formulas are as follows:
where TP (True Positive) denotes the number of correctly extracted samples from the target category, TN (True Negative) represents the count of non-target category samples correctly classified as non-target samples. FP (False Positive) indicates the instances where non-target category samples are mistakenly extracted as target category samples, and FN (False Negative) signifies the cases where target category samples are erroneously extracted as non-target category samples.
4.1.2 Enterprise Risk Knowledge Extraction Datasets
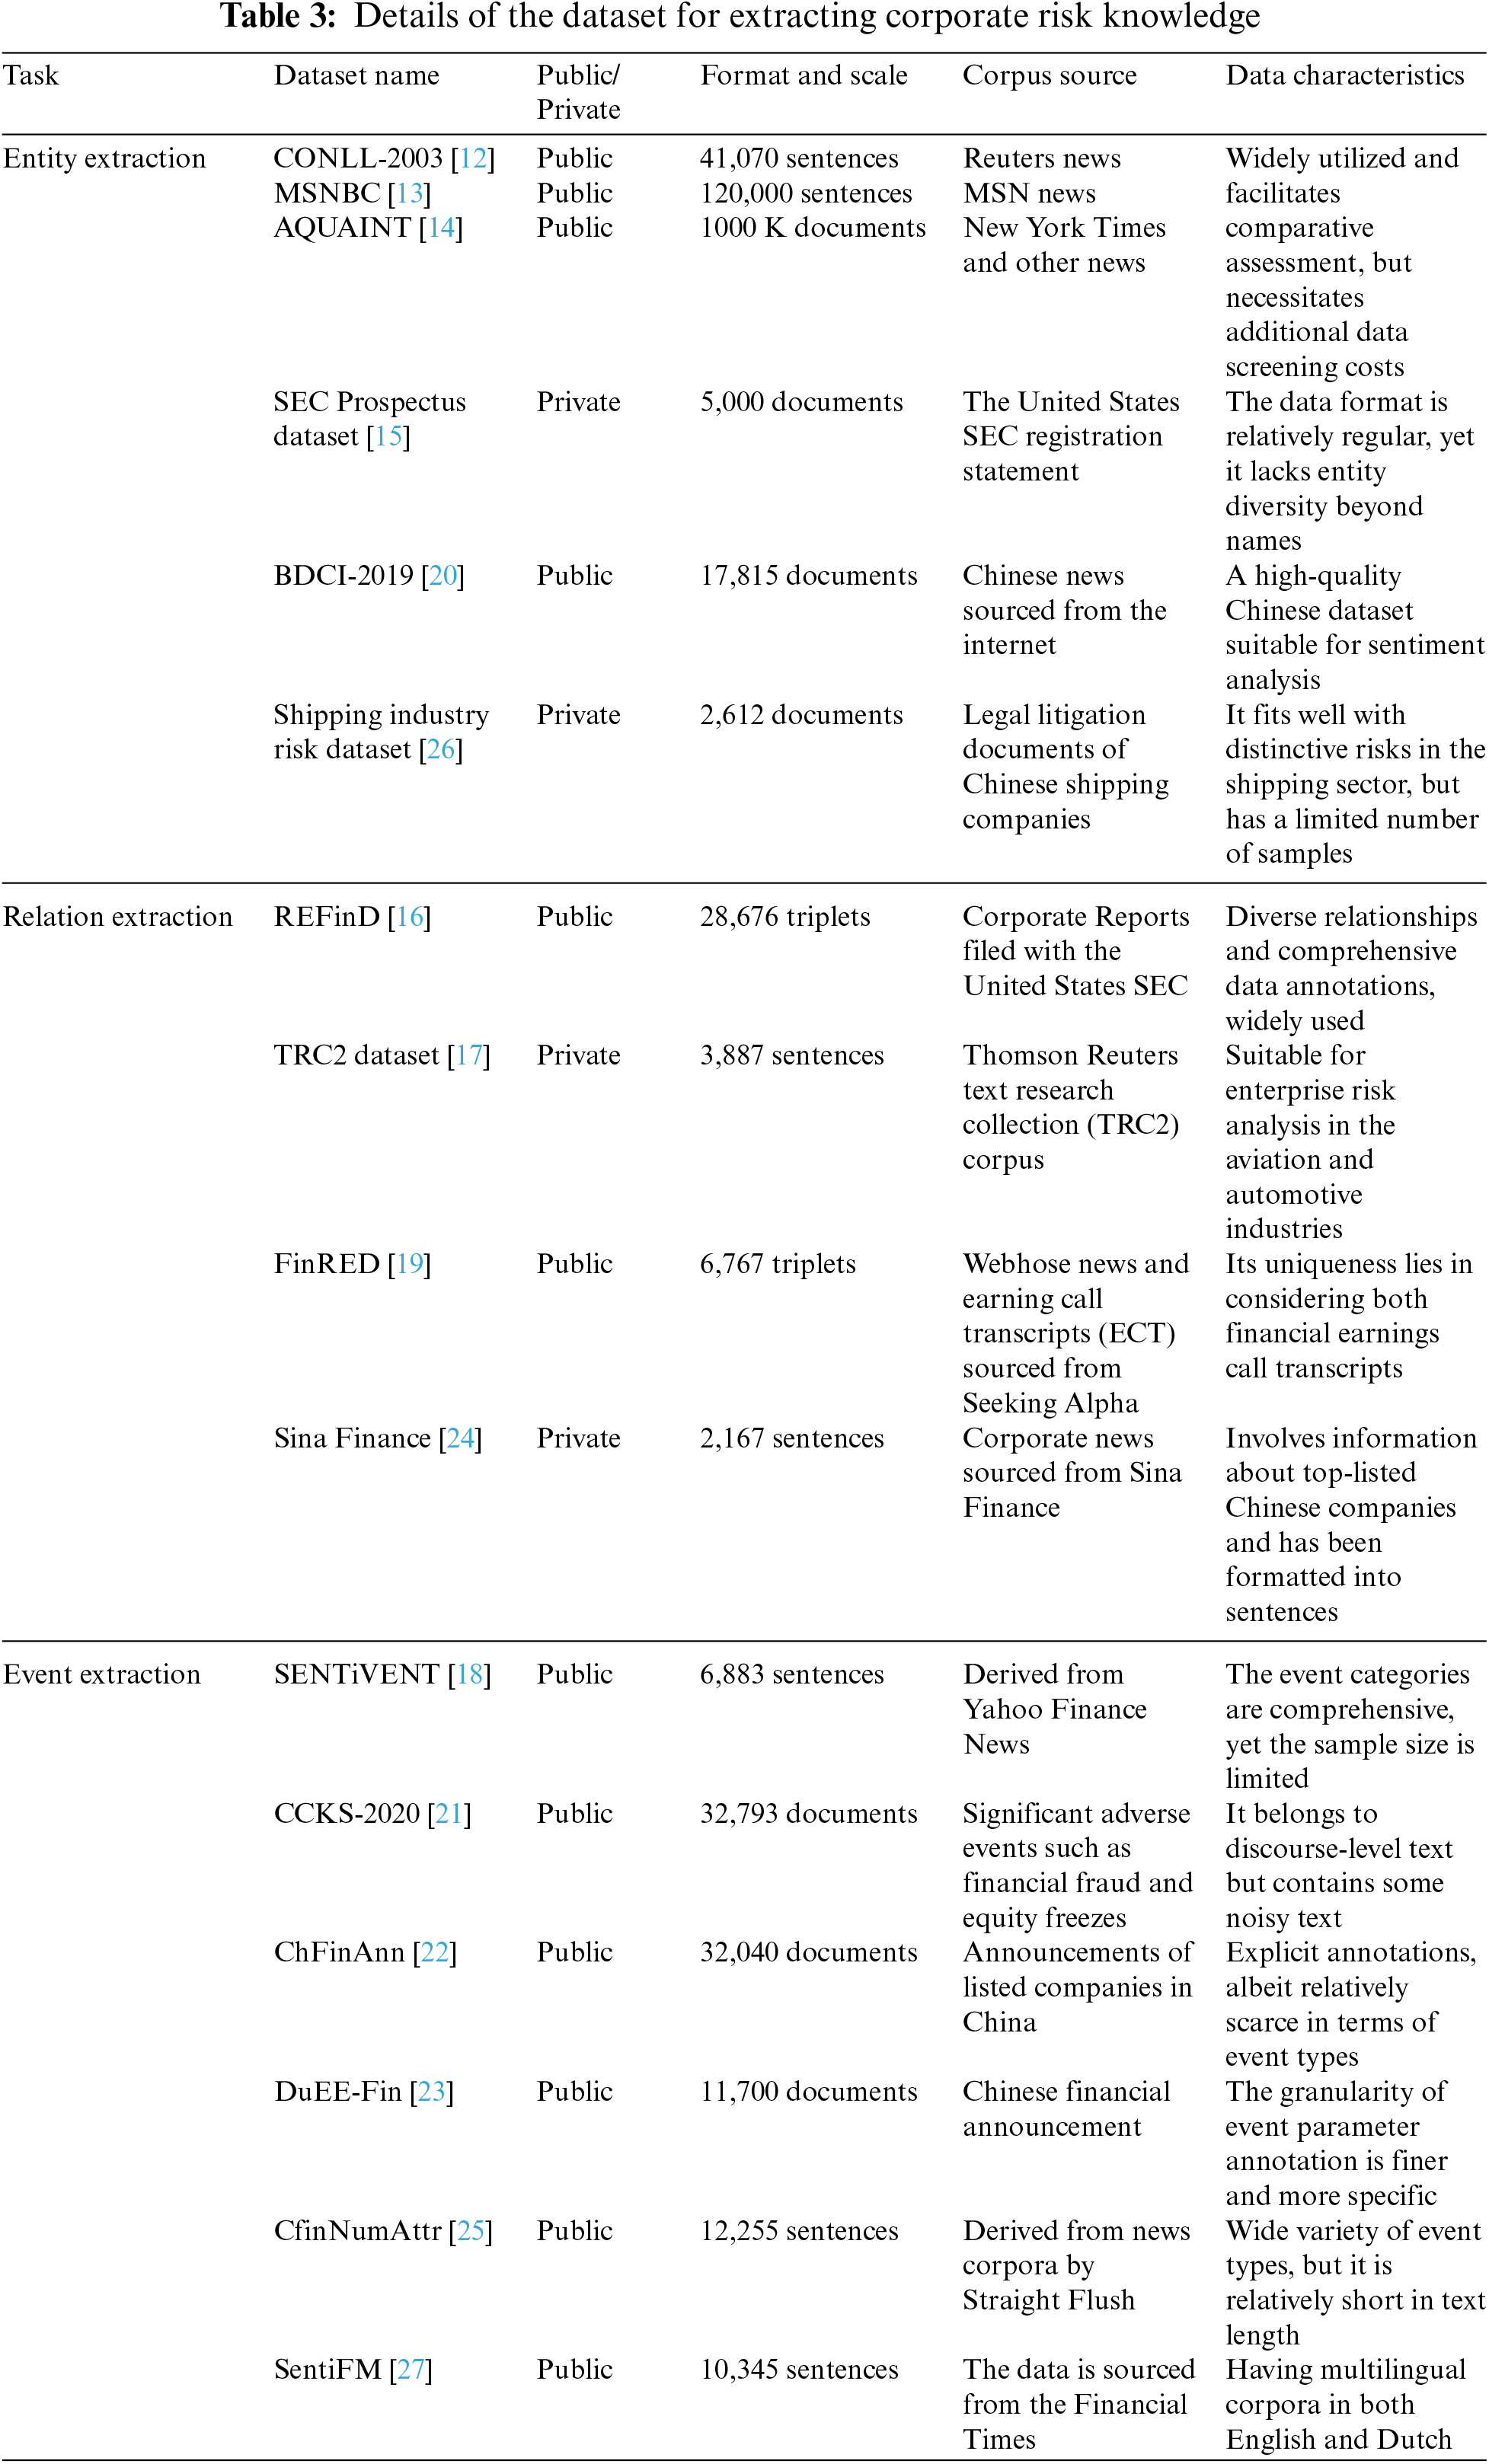
Knowledge extraction aims to extract information from different sources and structures of data. The demand for risk information determines the choice of the target dataset, while the quality and completeness of data in the database potentially impact the evaluation effectiveness of knowledge extraction tasks. During the period when specialized datasets in the field of enterprise risk were relatively scarce, many researchers extracted knowledge by selecting relevant information from large-scale news datasets such as CONLL2003 [12], MSNBC [13], AQUAINT [14], and others. However, due to the inclusion of redundant information unrelated to the enterprise risk domain in these general datasets, additional manual effort is required to eliminate irrelevant information before they can be used for enterprise risk knowledge extraction tasks. The United States Securities and Exchange Commission (SEC) regularly releases prospectuses, serving as a crucial data source for analyzing the risks of listed companies. It has been utilized by relevant scholars to construct datasets for entity extraction in enterprise risk [15,16]. News repositories such as Reuters and Yahoo Finance are also subjects of interest for many researchers. Building upon these sources, researchers have created English datasets for extracting relationships related to enterprise risk and extracting risk events [17,18]. In addition, Sharma et al. innovatively employed earning call transcripts (ECT) as a crucial data source for enterprise risk analysis, leading to the creation of the large-scale relation extraction English dataset, the financial relation extraction dataset (FinRED) [19].
In the realm of Chinese datasets, large-scale knowledge extraction competitions such as the big data and computing intelligence (BDCI) and the Chinese conference on knowledge graph and semantic (CCKS) have effectively propelled the development of research in related fields [20,21]. Simultaneously, annual reports of Chinese listed companies have become preferred data sources for researchers. Building upon this foundation, researchers have successively constructed the ChFinAnn dataset [22] and the DuEE-Fin event extraction dataset, containing over 81,000 event parameters and 92 event types [23]. Kong et al. [24] constructed an enterprise risk relationship extraction dataset from the financial corpus of Sina Finance News. Wu et al. [25] introduced the fine-grained financial event extraction dataset CfinNumAttr, which covers 35 categories of corporate-related events such as equity increase, loss, stock freeze, delisting, and lifting risk warnings. Moreover, specific industry risk datasets and datasets for minority languages have been consistently emerging [26,27]. We have summarized 16 representative datasets as shown in Table 3.
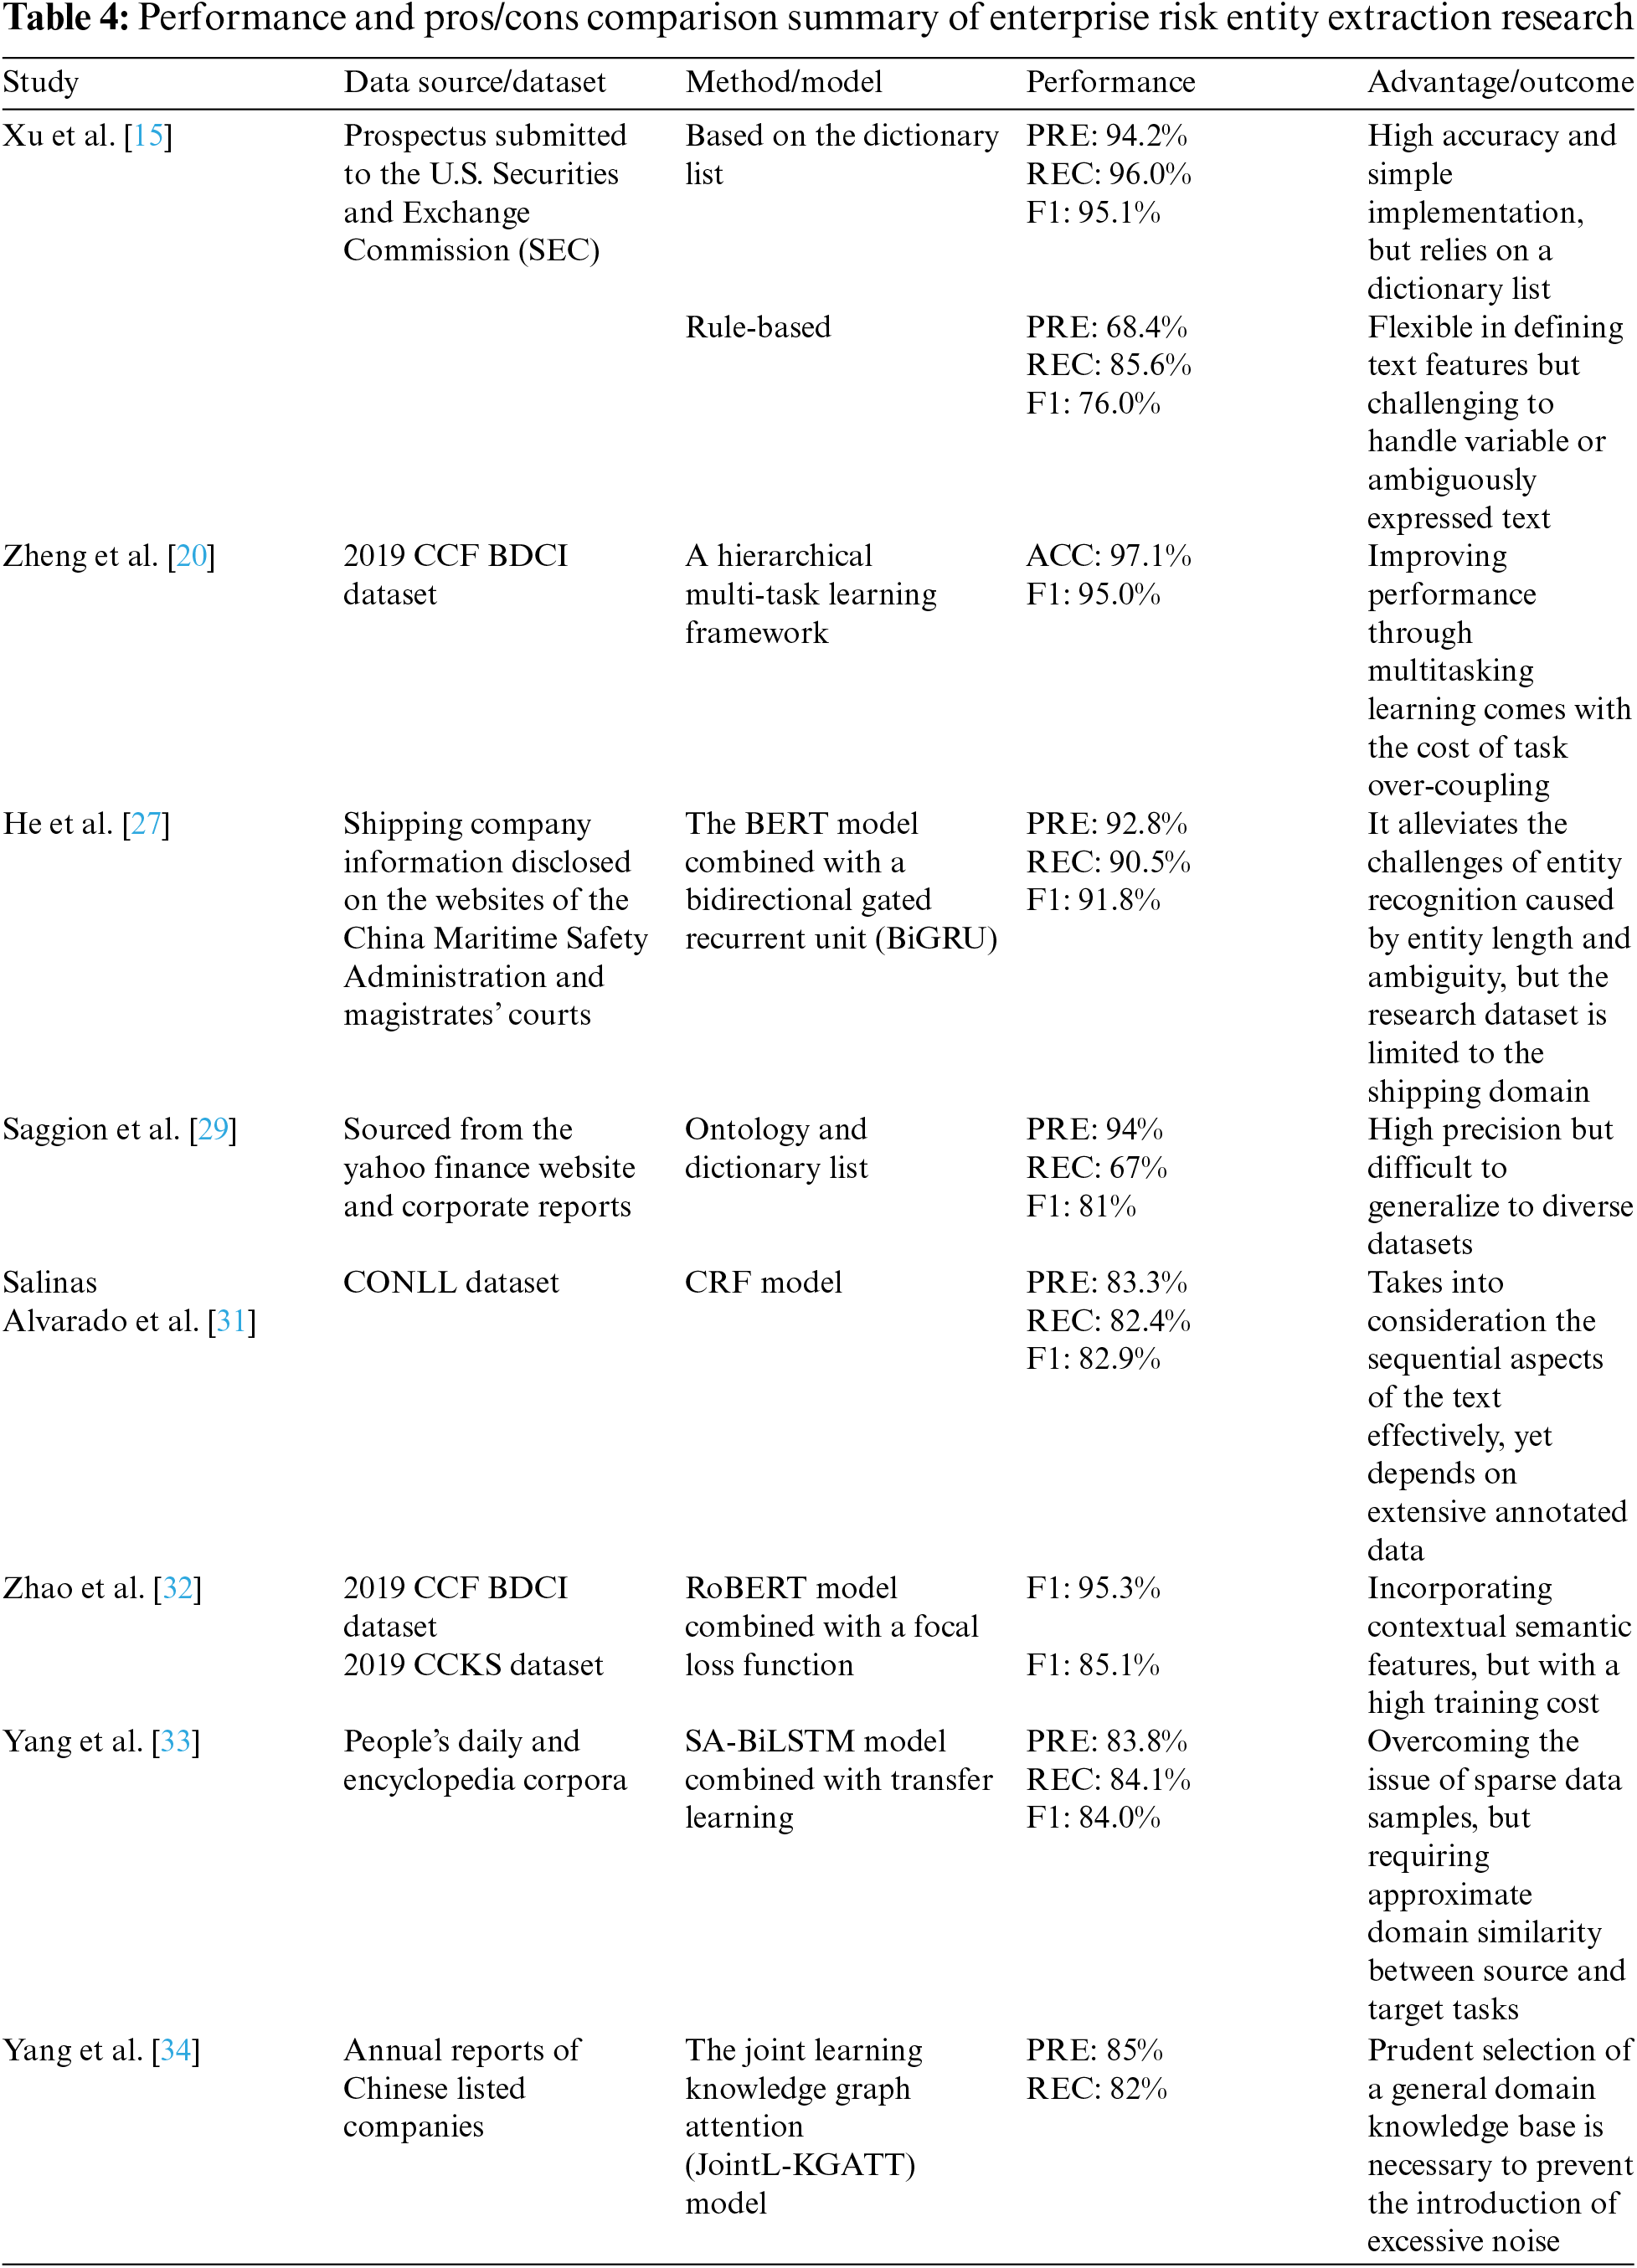
4.1.3 Entity Extraction in the Field of Enterprise Risk
Risk entity extraction, also known as Risk Named Entity Recognition (RNER), focuses on the field of enterprise risk. The entity categories are roughly divided into four types [28]: risk management organizational entities such as regulatory agencies and listed companies; risk management resource entities such as products and materials; event entities in negative news and public opinion texts; and risk scenario-related entities such as risk causes, risk consequences, and risk countermeasures. In the early stages of research, ontology-based approaches and statistical learning methods on large-scale risk domain corpora were the main patterns for financial entity extraction, laying the foundation for developing entity extraction research in related domains [15,29]. On this basis, the combination of the conditional random field (CRF) model and dictionary rules has also become a choice for scholars [30,31]. This approach is simple, efficient, and suitable for colloquial text corpora. However, constructing an ontology requires sufficient expert knowledge. The statistical learning-based entity extraction method also requires pre-processing feature engineering, which takes time and manpower, and the model performance is affected by the precision of feature identification. To avoid the tedious process of feature engineering, many scholars have focused on using deep learning models to extract enterprise risk entities. Zheng et al. [20] proposed an end-to-end multitask learning framework and tested entity extraction on a dataset of negative public sentiment in enterprises, achieving breakthroughs in financial entity extraction. The bidirectional encoder representations from transformers (BERT), as a representative pre-trained model, has significantly advanced the development of knowledge extraction. Using the same dataset, Zhao et al. [32] changed the entity extraction strategy by using the robustly optimized BERT approach (RoBERTa) to extract all entities in advance, and then matched the key entities sentence by sentence, improving the F1 value of the entity extraction task to 0.952. For example, some researchers have incorporated self-attention mechanisms into enterprise risk entity recognition models and proposed the self-attention bidirectional long short-term memory (SA-BiLSTM) entity extraction model to improve the extraction of easily confused entities such as abbreviated company names [33]. For the extraction of associated entities in specific industries, He et al. [27] considered word vector features, word length features, and part-of-speech features and combined them with contextual features to complete named entity recognition on a Chinese shipping company dataset, outperforming the performance of the baseline model in the general domain. To alleviate the problem of constructing large-scale domain feature sets in entity extraction tasks, Yang et al. [34] trained an attention mechanism model using high-quality entity examples and large-scale risk domain corpora, achieving high-precision extraction of financial entities such as enterprises under few-sample conditions. At present, numerous scholars are directing their research focus toward integrating neural networks with rule-based dictionaries [35] or incorporating diverse features such as character shapes and strokes to enhance the accuracy of entity extraction in enterprise risk [36]. As a catalyst for knowledge extraction, the adoption of large language models such as generative pre-trained Transformer (GPT) has demonstrated remarkable performance in enterprise entity extraction [37], capturing the attention of researchers from an academic perspective.
In general, rule-based risk entity extraction, while capable of achieving high performance with high-quality rules, faces challenges in generalizing fixed rules to new corpora. It is more suitable for small-scale risk entity extraction or extracting information from rule-based materials such as corporate forms and financial institution documents. We compare and summarize representative techniques for entity extraction, as illustrated in Table 4. Concerning entity extraction technologies based on machine learning and deep learning, there still exist vital issues that require focused attention. On the one hand, the phenomenon of nested entities in Chinese corpora is particularly pronounced in the corporate risk domain. Nested entities such as “listed company’s R&D department” or “the second quarter of 2017” are susceptible to extraction errors, highlighting the need to improve the ability to determine entity boundaries. Scholars have been addressing this challenge through techniques such as generative adversarial training [38] and transfer learning [39], which hold valuable reference significance. On the other hand, the diverse linguistic expressions for the same entity can impart distinct characteristics, providing a natural advantage in addressing the phenomenon of polysemy. Generating multilingual features for entity extraction corpora is not a difficult task, and previous studies have utilized multilingual generation to achieve the goal of data augmentation [40]. Multilingual data augmentation, by expanding the original sample dataset, emerges as an effective strategy for achieving semantic enhancement and improving extraction accuracy in the future.
4.1.4 Relation Extraction in the Field of Enterprise Risk
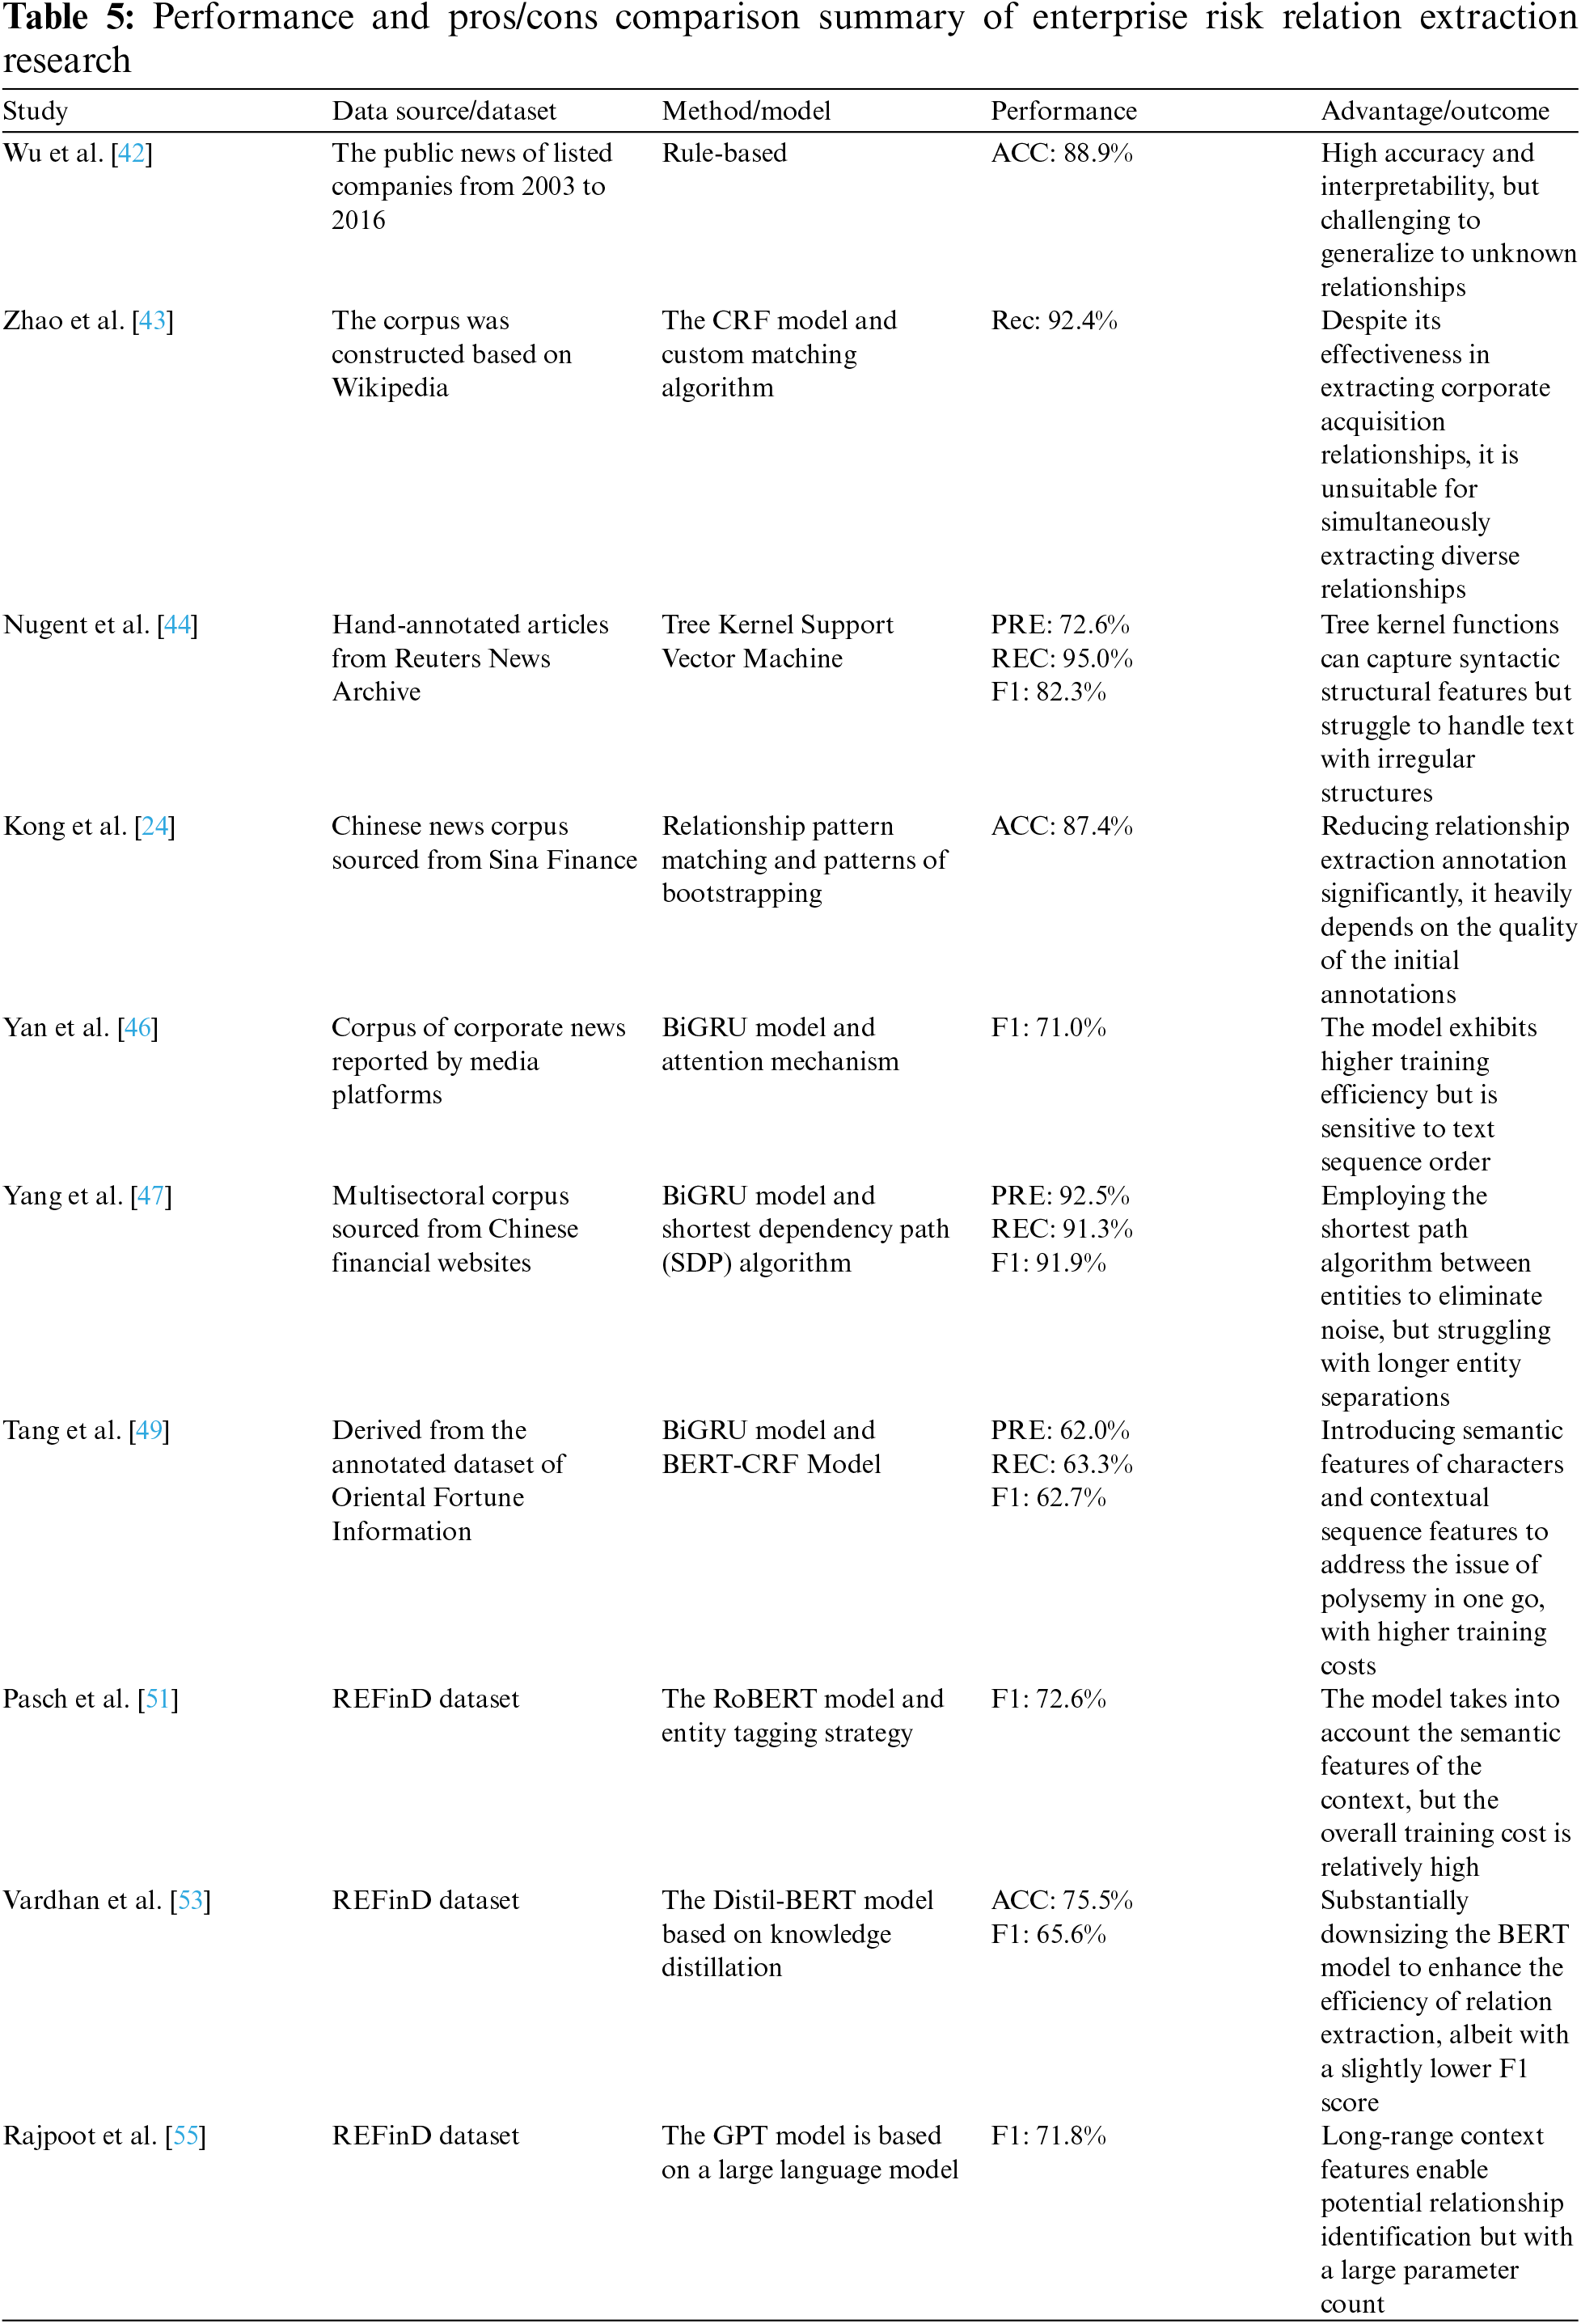
Risk relation extraction (RRE), as a downstream task of entity extraction, aims to determine and differentiate the relationships between entities. In the field of enterprise risk, early research often used template matching methods [41,42] or custom rule algorithms to extract relationships such as equity and investment between companies [43]. However, such methods are limited by the subjectivity of template rules and lack good generalizability. With the iteration of relation extraction techniques, research on machine learning-based enterprise risk relation extraction has been widely conducted. Financial news serves as the primary data source for enterprise risk relation extraction and has been used by many scholars for relation extraction research. Nugent et al. [44] collected the Reuters corporate news dataset and used an optimized support vector machine (SVM) model to extract enterprise risk relations. Kong et al. [24] introduced the Bootstrapping algorithm based on pattern matching to extract relationships such as corporate cooperation and affiliation of related individuals from Chinese financial news, significantly reducing the proportion of annotated financial risk source data. Deep learning to some extent enables the automation of the process of extracting and combining multidimensional features of enterprises, becoming the current mainstream approach for enterprise risk relation extraction. Wichmann et al. [17] focused on supply risk relations between companies. They used a bidirectional long short-term memory (BiLSTM) model to extract the ownership relations between companies and products and the supply relations between companies from news articles, thereby constructing a preliminary knowledge graph for supply risk assessment. Du et al. [45] incorporated the Simplified Graph Convolution Network (SGC) into the BiLSTM model, showcasing superior extraction performance in the product relationship corpus of manufacturing enterprises. Similarly, Yan et al. [46] used a bidirectional gated recurrent unit (BiGRU) to mine relationships between enterprise entities, considering both lexical and syntactic features. They achieved an F1 score of 0.71 on a manually annotated dataset of financial news. Building on this, researchers have combined the shortest dependency path (SDP) algorithm with the BiGRU model to reduce the impact of noisy data on extraction accuracy and successfully extract relationships between enterprises and customers on a custom financial news dataset, achieving an F1 score beyond 0.91 and demonstrating outstanding relation extraction capabilities [47]. Amid the surge in transfer learning and pre-trained models, Sun et al. [48] proposed a relation extraction model based on BERT and piecewise convolutional neural network (PCNN), exhibiting remarkable performance on a self-constructed financial report dataset. Tang et al. [49] designed a BERT-BiGRU joint entity-relation extraction model to handle overlapping relationships such as buying and selling, equity, cooperation, and punishment between companies in the same sentence. Hillebrand et al. [50] similarly proposed the joint extraction model, incorporating a recurrent neural network (RNN) pooling mechanism to achieve outstanding extraction performance on a German corporate financial dataset. To overcome the challenges of extracting cross-sentence relationships in discourse-level texts, many researchers have focused on entity features. Pasch et al. [51] incorporated entity connections introduced by prepositions as additional features in the relation extraction task. They designed corresponding deep-learning models to extract up to 21 common financial risk relations, such as stockholding and acquisition, achieving an F1 score of 0.726 on the REFinD public dataset [16]. Qiu et al. [52] conducted experiments on REFinD using the financial BERT (FinBERT) pre-trained models. The experimental results demonstrated that the latter model exhibited a slightly higher F1 performance by 0.02. Vardhan et al. [53] used modifiers to vary the entity labels, enhancing the discriminability of different relationship categories while assigning entity traits, leading to an improved F1 score of 0.75 on the same dataset. Mao et al. [54] leveraged knowledge graph representation for encoding textual structural information. They employed Graph Convolutional Networks (GCN) for embedding entity structures to enhance the performance of relation extraction. Currently, research on large language models (LLMs) has become a focus of academic attention. Rajpoot et al. [55] attempted to use a k-nearest neighbors (KNN) algorithm to retrieve the most similar annotated examples to the target samples. They combined it with LLMs such as GPT4.0 to achieve financial risk relation extraction under few-shot conditions, providing a compelling technical example for research on small-sample risk relation extraction.
We summarize the representative studies from the above research in Table 5, conducting a thorough analysis of the performance and applicability of various technologies. Despite ongoing efforts by researchers to generate datasets related to enterprise activities in multiple languages [56,57], the majority of these datasets are in English. The scarcity of diverse language datasets constrains the analysis and research on enterprise risk. Apart from dataset construction, implementing enhancement measures like joint embedding of sentence and relation features [58], contrastive learning frameworks [59], and generative models [60] is crucial for achieving zero-shot or few-shot relation extraction in enterprise risk. Moreover, the corporate risk domain involves numerous examples of n-ary relation extraction, such as the scenario where Supplier C simultaneously has supply relationships with both Company A and Company B. Looking ahead, transforming it into the reading comprehension task is a potential direction to enhance the performance of n-ary relation extraction in the field of enterprise risk analysis [61].
4.1.5 Event Extraction in the Field of Enterprise Risk
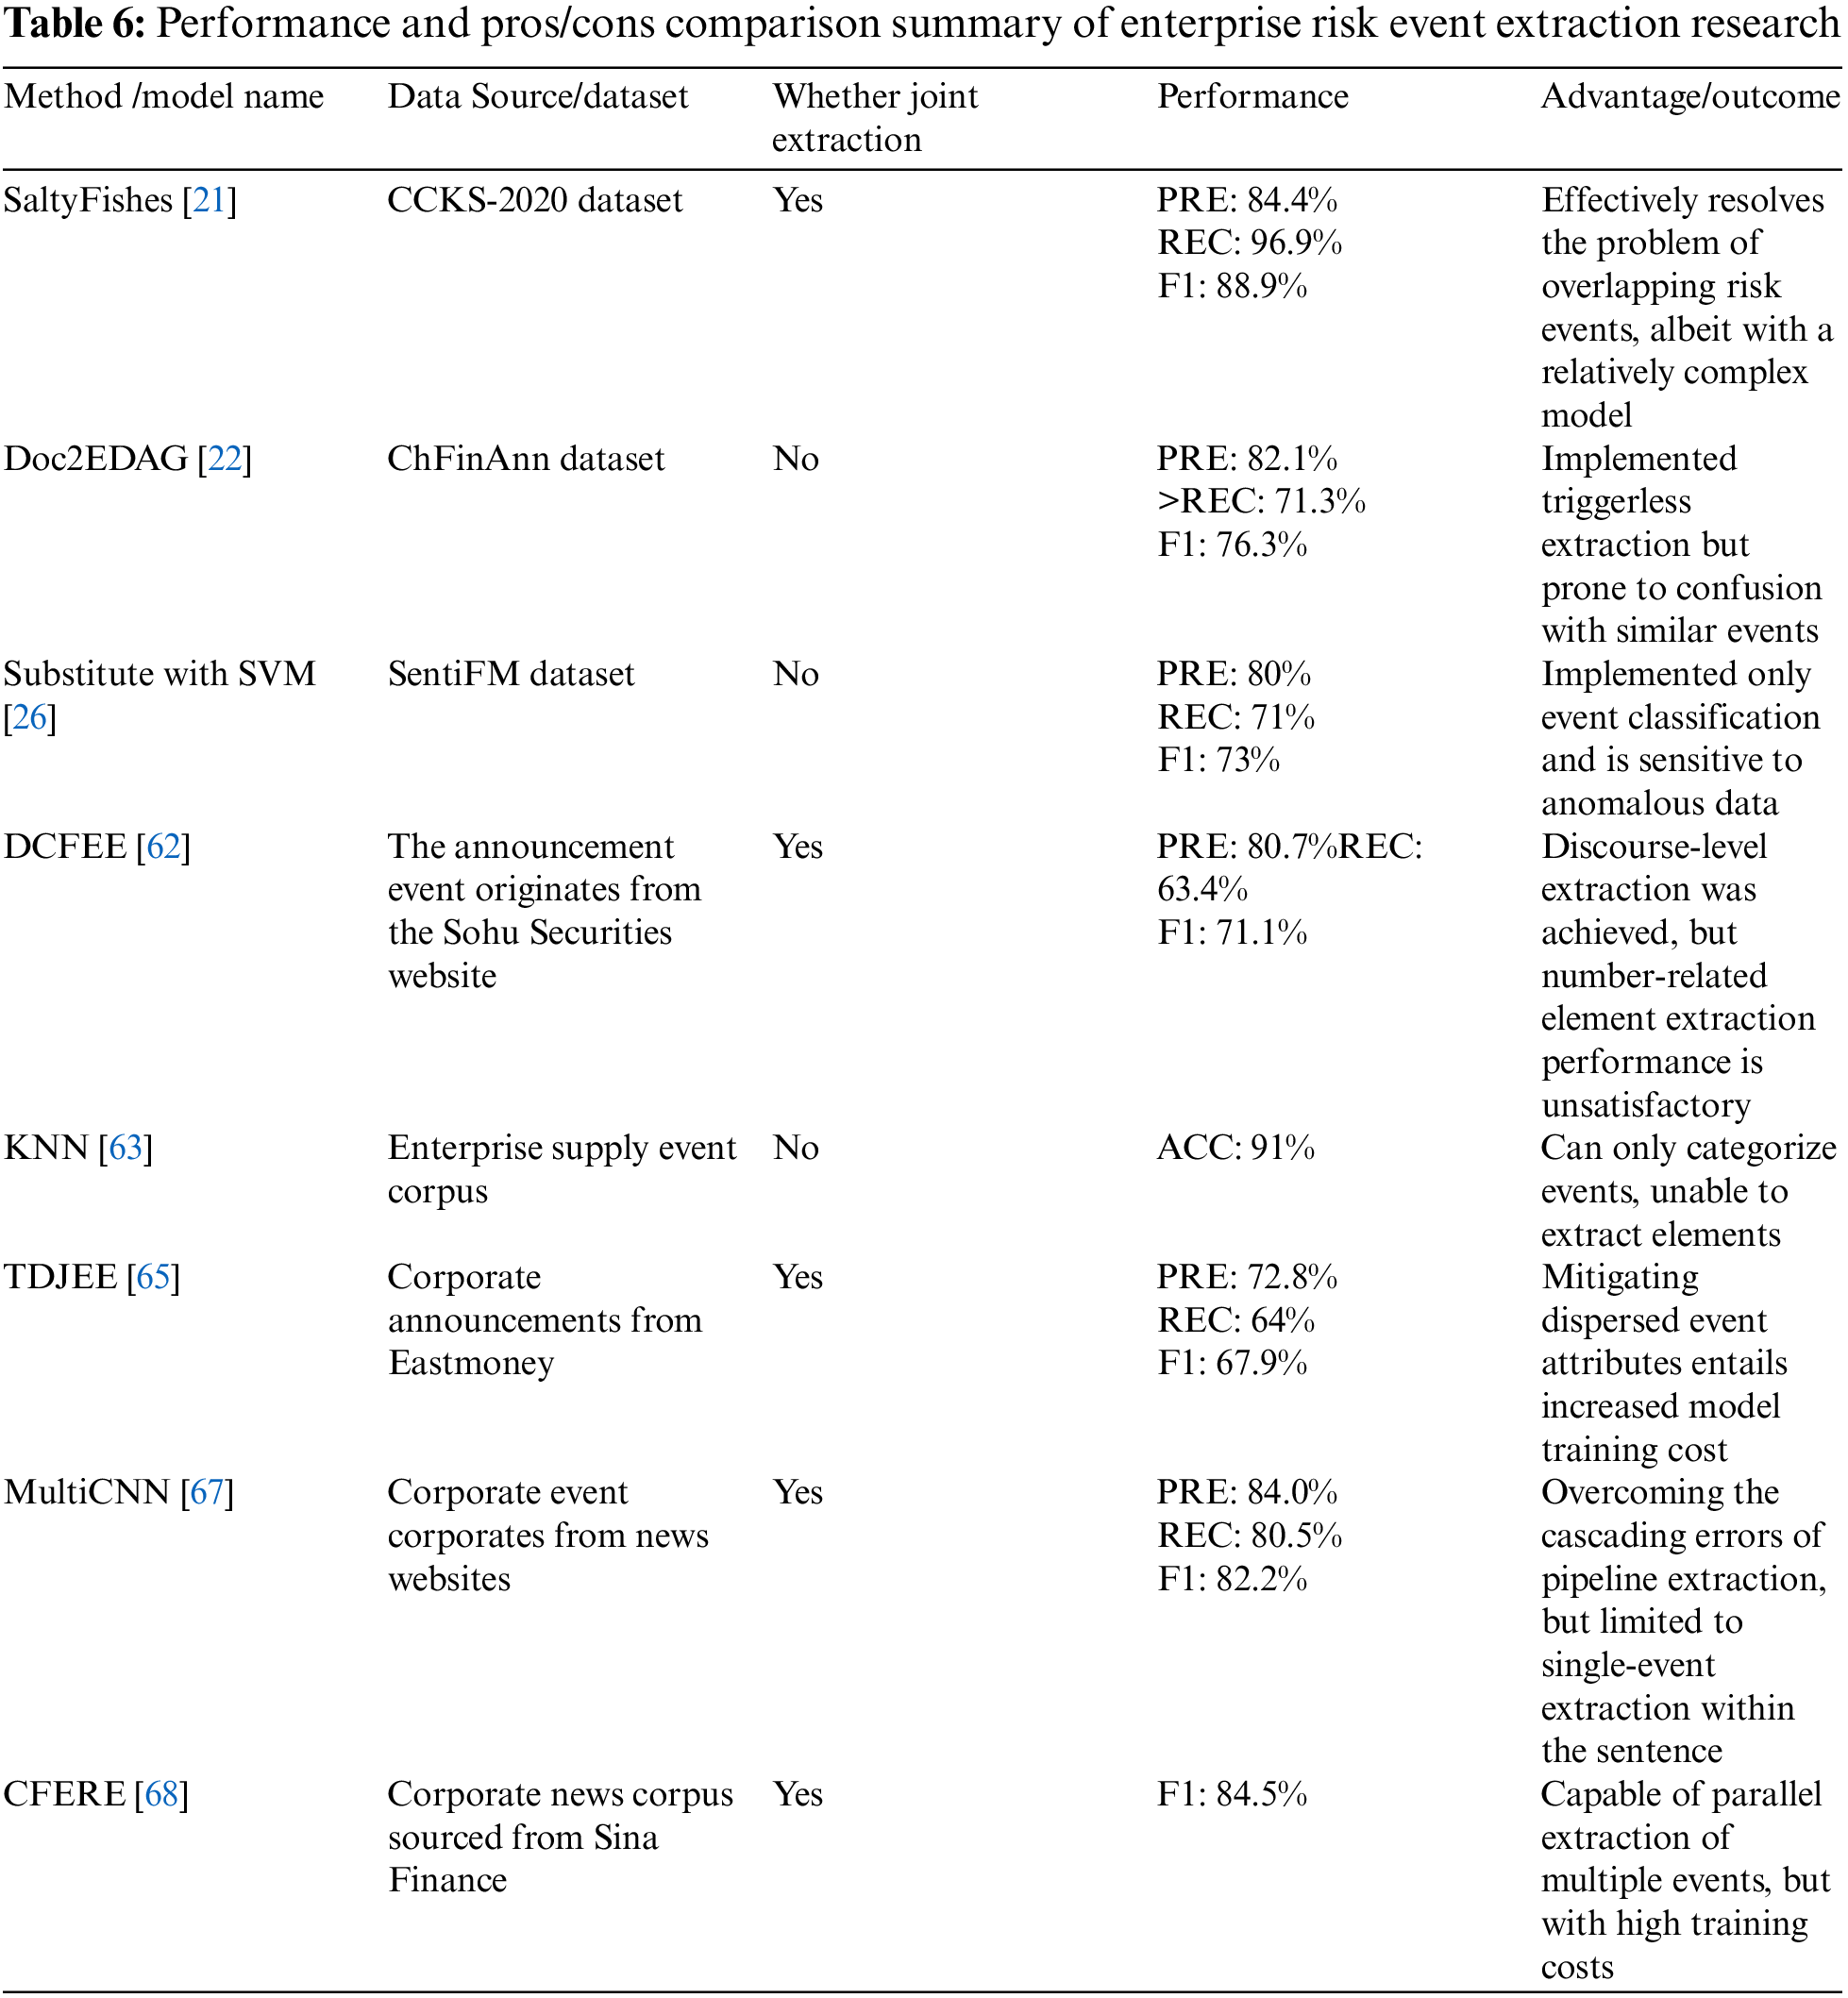
Building an enterprise knowledge graph that includes risk event entities requires accurate event extraction as a prerequisite. Risk event extraction (REE) essentially involves identifying event categories and extracting event elements from textual event descriptions [62]. It consists of two subtasks: trigger extraction and argument extraction. Event detection focuses on identifying event trigger words from event descriptions, while argument extraction aims to identify specific event attributes. In the initial stages of exploration, researchers employed rule templates or KNN similarity algorithms to categorize enterprise events and extract event elements [63]. However, these approaches overlooked the order and context of words, making them sensitive to noise and outliers. Subsequent researchers introduced kernel functions for extracting corporate state events [26], but the complexity of computations in high-dimensional space limited their suitability for large-scale datasets. To extract corporate risk events more efficiently, Liu et al. [64] proposed a hierarchical event extraction model based on self-attention to capture character-level semantic relations and document-level entity dependencies. This model successfully extracts common dynamic events in enterprises, such as financing, equity increase, and personnel changes. Zheng et al. [22] addressed the challenge of extracting target event elements scattered throughout different sections of paragraphs by abstracting event entities as directed acyclic graphs. They proposed an end-to-end chapter-level financial event extraction model called document-to-entity dependency analysis graph (Doc2EDAG), which outperforms previous models in event extraction accuracy. The cold-start problem refers to the lack of data in a specific domain, making it difficult to conduct effective research in related fields. Wang et al. [65] addressed the cold-start problem caused by the scarcity of high-quality risk event data by embedding contextual features of enterprise announcements using the Transformer-based document-level joint event extraction (TDJEE) model and leveraging distant supervision. Sheng et al. [21] proposed the SaltyFishes joint learning framework, which allows the sharing of parameters among event type recognition, event trigger word identification, and event element recognition modules. They extracted risk events under small-sample conditions using the CCKS-2020 financial activity dataset and effectively handled cases of overlapping event elements. To fundamentally alleviate the predicament of the lack of an event dataset in the corporate risk domain, Wu et al. [25] introduced the fine-grained financial event extraction dataset CfinNumAttr, which covers 35 categories of corporate-related events such as equity increase, loss, stock freeze, delisting, and lifting risk warnings. This dataset provides a large-scale and high-quality data contribution to research on enterprise risk event extraction. Jacobs et al. [18] constructed a large-scale English event extraction dataset called SENTiVENT based on corporate news reports. Scholars also built corporate event datasets through the annotation and reprocessing of open-source datasets [66]. Considering the phenomenon of error propagation between event detection and argument extraction, Li et al. [67] proposed a unified financial event extraction framework. The method utilizes the pre-trained BERT model and the multi-layer CNN (MultiCNN) architecture to hierarchically extract local windows and high-dimensional spatial semantic information, achieving risk event recognition and element extraction in parallel. They obtained an F1 score of 82.2% on a self-annotated Chinese financial event dataset. In the corporate risk domain, situations often arise where multiple events occur simultaneously within the same sentence. To address this, Wan et al. [68] devised the Chinese financial event relation extraction (CFERE) framework, which accomplishes event identification through core verb chains and integrates an event core feature embedding layer into the BERT model, enabling the parallel extraction of multiple events. Regarding the extraction of multiple events, a burgeoning approach to enhance performance involved pre-annotating and incorporating event chains into the training model [69].
Research on event extraction in enterprise risk is divided into pipeline extraction and joint extraction methods. Representative research summaries are compiled in Table 6. The pipeline extraction method involves event trigger word recognition and event argument extraction. In contrast, joint extraction effectively reduces error propagation between subtasks and has become the current mainstream approach. Extraction based on deep learning models is a hot research topic in this field, but its interpretability is relatively poor, limiting the development of enterprise risk analysis. Designing event extraction models that integrate symbolic knowledge with neural networks can effectively enhance the models’ interpretability and is a topic worth researching in the future. Furthermore, given that corpora in the field of enterprise risk typically consist of company announcements or news sentiment, document-level event extraction places higher demands on the complexity of deep learning models. The fusion of contextual paragraph features with event-specific thematic features in chapter-level event extraction, and the extraction of overlapping events are research directions that need to be considered.
4.2 Knowledge Fusion in the Field of Enterprise Risk
The field of enterprise risk involves complex and diverse information, and different sources and types of information may have biases and inconsistencies. Knowledge fusion can integrate information from diverse risk communication channels to reduce the uncertainty of heterogeneous knowledge in the enterprise risk domain. Specifically, Risk Entity Linking (REL) and Risk Entity Alignment (REA) are the main tasks of knowledge fusion in the field of enterprise risk.
4.2.1 Metrics for Knowledge Fusion in the Enterprise Risk Domain
For the entity alignment and entity linking tasks in the field of enterprise risk, in addition to fundamental evaluation metrics such as precision, recall, and F1 score, there have been studies employing mean reciprocal rank (MRR) and
By recording the model’s predicted results after entity alignment or linking, calculate the reciprocal rank of the true result in the predicted results as MRR. Here, Q represents the set of true results to be queried and
4.2.2 Entity Alignment and Entity Linking in the Enterprise Risk Domain
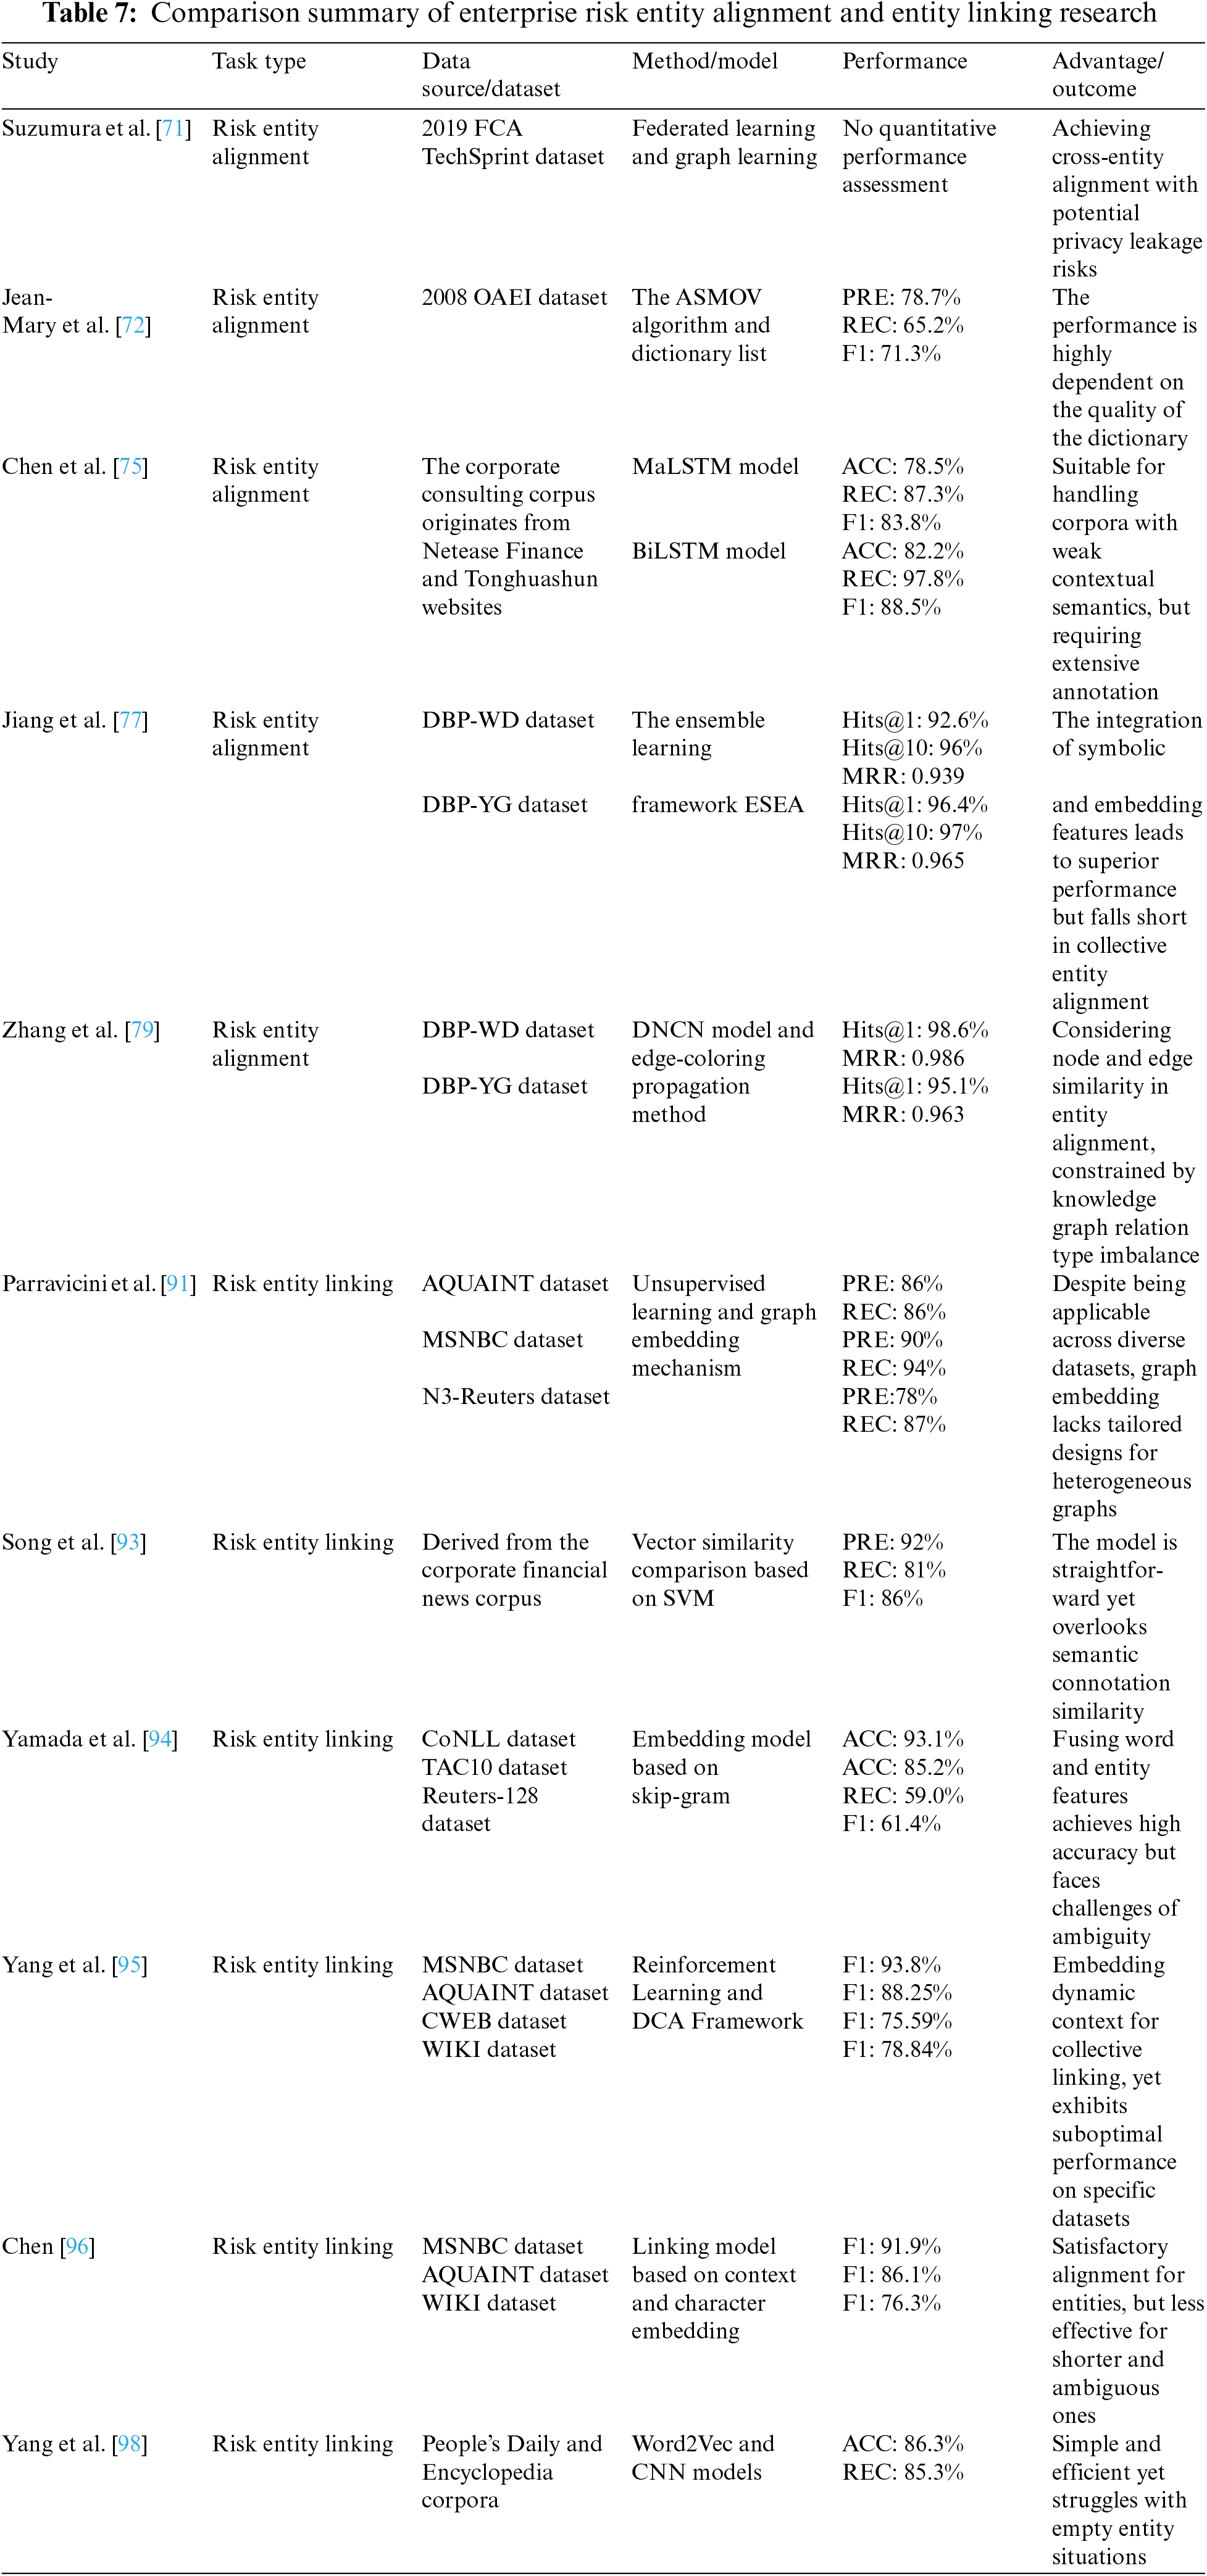
Risk entity alignment, also known as risk entity matching, refers to determining whether entities from different risk channels refer to the same object and merging risk entities that describe the same object. Traditional risk entity alignment can be categorized into two types: entity similarity-based calculation and relation-based inference [70]. When constructing a knowledge graph for financial crimes, Suzumura et al. [71] aligned and merged risk entities of companies based on the similarity of key attributes such as company name, registered address, and registration number. However, it is difficult to manually create templates that comprehensively cover entity matching in the target domain. Moreover, if there are input errors in string attribute information such as company or individual identifiers, it can lead to failed matches of entities for merging. Jean-Mary et al. [72] expanded the dimensions of similarity matching by introducing synonym dictionaries to assess similarity while adding semantic contradiction detection to improve the accuracy of entity alignment. To minimize the cost impact of introducing external dictionaries, Ziv et al. [73] proposed an algorithm for the automatic matching of enterprise names based on semantic features of synonymous words, eliminating the necessity of incorporating external information resources as auxiliary support. Compared to entity similarity-based calculation, the relation-based inference approach for entity alignment uses common similarity association between entities as the judgment criterion. Peng et al. [74] used the iterative alignment of highly similar entities and relations as training data, referencing the similarity of relational structures, and achieved excellent performance on large-scale open-source datasets containing financial document data, surpassing baseline models. The combination of knowledge graphs and deep learning complement each other, and emerging deep learning technologies have become a new choice for risk entity alignment. To address the issue of excessive reliance on similarity measurement functions in entity similarity-based calculation and relation-based inference, Chen et al. [75] proposed an enterprise risk domain entity alignment model based on Siamese neural networks. The model fully learns the character and semantic features of the target entity through BiLSTM models and computes the matching probability of target entities using cosine similarity. Kruse et al. [76] integrated a rule-matching mechanism into the BiLSTM model, and experimental results demonstrated that the combination of these two approaches significantly outperforms singular methods in aligning entities in the domain of corporate knowledge. Jiang et al. [77] incorporated vector embedding features representing characteristics of deep learning models with traditional entity character features and creatively proposed a hybrid entity alignment model combining relation vectors and basic character features. The aim was to further reduce entity alignment errors, achieving outstanding results on DBP-WD and DBP-YG financial datasets. The dataset has also been widely utilized by other scholars. For instance, Lu et al. [78] designed an alignment framework that integrates knowledge graph embedding and type-matching constraints, achieving notable results. Zhang et al. [79] introduced the edge-coloring algorithm to consider the similarity of entity neighborhood edges during alignment, further raising the MRR metric to above 0.9. In addition, there are many entities with fewer than two adjacent entities in the knowledge graph of the enterprise risk domain, referred to as long-tail entities [80]. Most entity alignment methods rely on the structural information of the knowledge graph, and the alignment performance for long-tail entities is poor due to structural sparsity. Employing entity name features as pre-training vectors opens up the potential to address the long-tail entity alignment bottleneck down the line [81].
Risk entity linking specifically refers to the process of matching entities extracted from the enterprise risk knowledge graph, such as companies, organizations, and risk events, with corresponding existing entities in knowledge bases to prevent inconsistencies in the data. The academic community generally agrees that the entity linking framework includes mention recognition and entity disambiguation [82]. Although experts and scholars have conducted numerous studies on general datasets derived from Wikipedia, DBpedia, and others, proposing entity linking models using different architectural patterns such as graph random walk [83], gradient boosting regression trees [84], multilayer neural network [85–87] and pattern of integrated knowledge structure [88], there is still a need for more in-depth research on entity linking in the field of enterprise risk. Several researchers used fuzzy matching to link different types of entities in the financial domain, such as risk companies, products, and associated individuals [89–91]. Unsupervised entity linking based on dictionary matching and similarity matching requires a high level of data standardization and is not suitable for describing more complex enterprise risk entities. With the popularization of machine learning techniques, researchers combined the similarity features of prior knowledge with SVM models to build enterprise risk knowledge graphs, but the accuracy is comparatively poor [92]. Song et al. [93] introduced proxy learning techniques to train a similarity classifier between candidate nodes and target entities, achieving high-precision alignment of enterprise and associated natural person entities. For the sake of comparability in experimental outcomes, numerous researchers have conducted entity-linking experiments related to enterprises on large-scale publicly available datasets. Yamada et al. [94] were pioneers in applying the skip-gram model to the CoNLL dataset for entity linking, achieving a remarkable accuracy exceeding 93%. Introducing the dynamic contextual augmentation (DCA) mechanism, Yang et al. [95] enhanced entity linking precision by accumulating entity features at various positions in the text. On extensive datasets like MSNBC and AQUAINT, which encompass industry-related news, they reported F1 scores of 93.8% and 88.2%, respectively. Chen et al. [96], similarly focused on multiple large-scale financial corpora such as MSNBC and CoNLL, integrated diverse contextual features into neural networks, demonstrating superior performance but facing challenges in linking shorter or more ambiguous entities. Ding et al. [97] proposed a novel end-to-end neural entity linking model called JEL. This model uses contextual information and margin loss to generate entity embedding features, achieving performance advantages over generic entity linking models on the JPMC-specific dataset. To address potential errors in entity linking caused by enterprise and job title aliases, Yang et al. [98] designed a supervised algorithm combining convolutional neural networks (CNN) and cosine similarity for linking, thereby constructing an enterprise risk knowledge graph. Experimental results showed that the designed entity linking model achieved excellent performance on the enterprise news and People’s Daily datasets. Overall, developing enterprise risk entity linking techniques under zero-shot and few-shot conditions is a direction that existing research urgently needs to focus on. It is also a fundamental approach to alleviating the data burden in related entity-linking tasks. Additionally, in the field of enterprise risk, there are often numerous informal short texts or semantically noisy texts. Typically, entity linking performance is poor, attributed to the upper limits of entity extraction constraining the performance of entity linking. Hence, the multi-task model for joint entity extraction and entity linking [99] can both avoid error propagation effects and be a suitable choice for enhancing entity linking performance under conditions of noisy text in the future. Table 7 summarizes representative research on entity alignment and entity linking.
5 The Frontier Application Direction of Knowledge Graph in the Field of Enterprise Risk
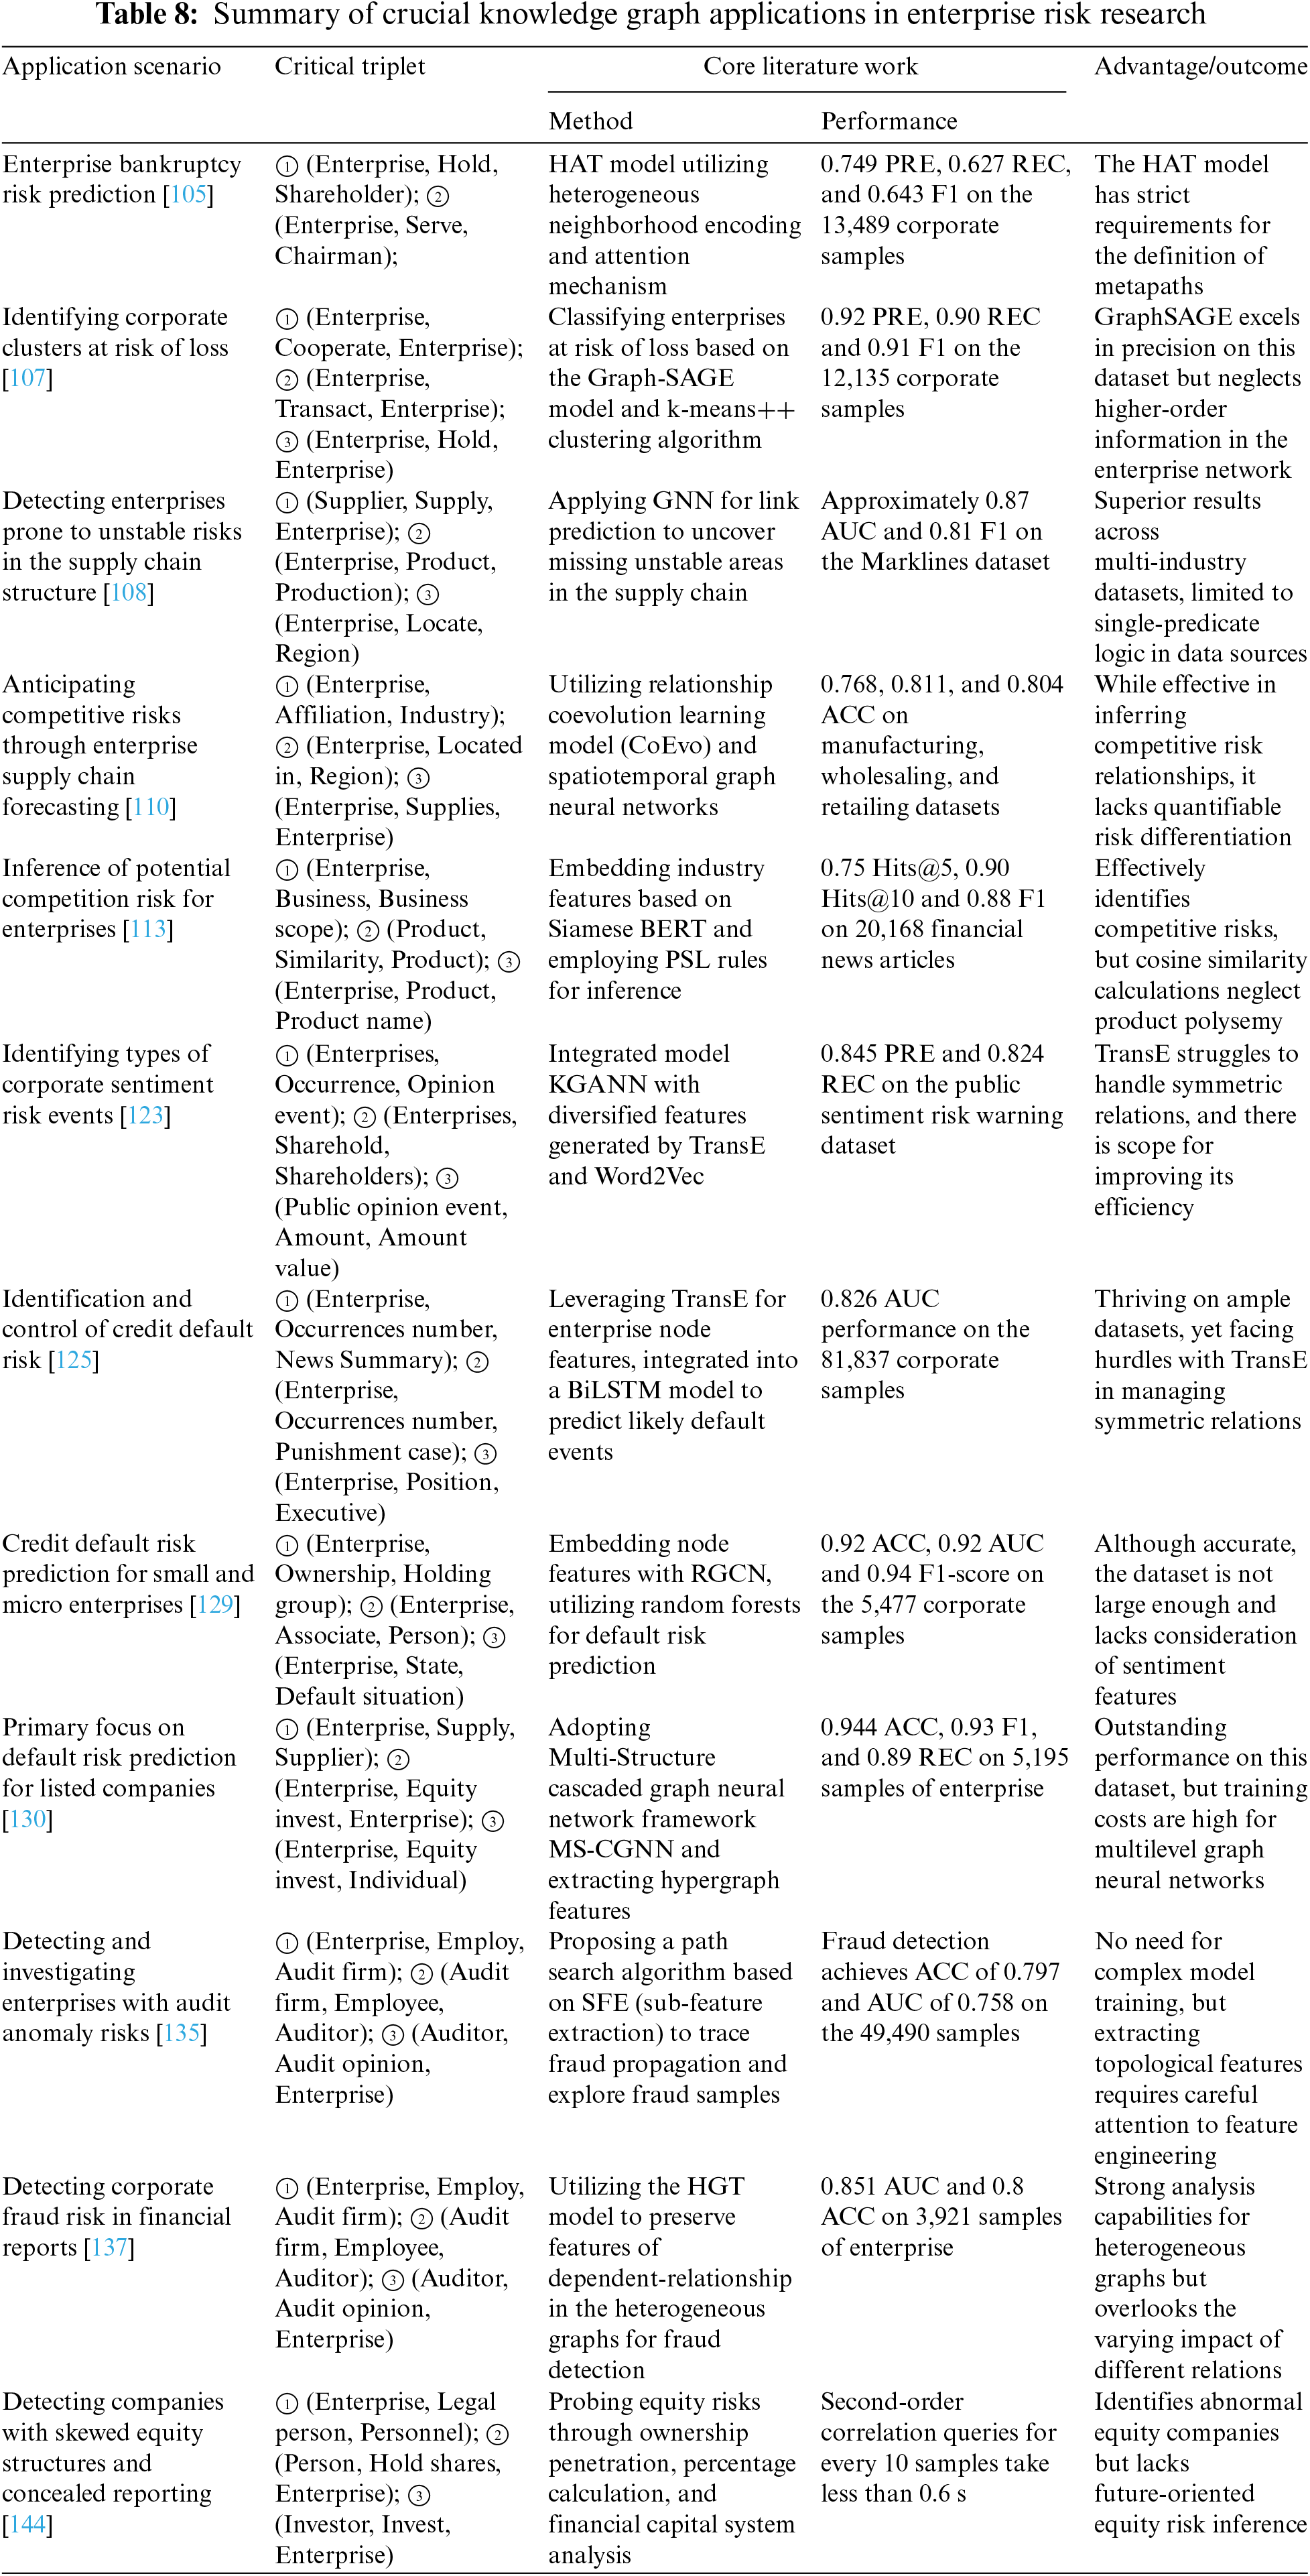
According to the division of responsibility subjects in enterprise risk management, the application of knowledge graph in enterprise risk covers two levels: internal risk control and external risk supervision. The keyword analysis of Chapter 3 reveals that research on internal control of risks is concentrated in the directions of financial, supply, and negative public opinion management. On the other hand, studies on external risk regulation focus on banking credit, fraud, and equity financing risks. The conceptual framework and application scenarios of inferential techniques in enterprise risk are illustrated in Fig. 6. This chapter takes the perspective of risk business scenarios to provide insight, allowing researchers to fully understand how the enterprise risk knowledge graph can unleash its potential for knowledge association and inference in diverse application directions. For the evaluation metrics of the knowledge graph in the task of enterprise risk management, in addition to the PRE, REC, and F1 metrics mentioned in Chapter 4, the AUC metric is also included, which is the area under the ROC curve [100]. We have compiled representative research for different business scenarios, as shown in Table 8.
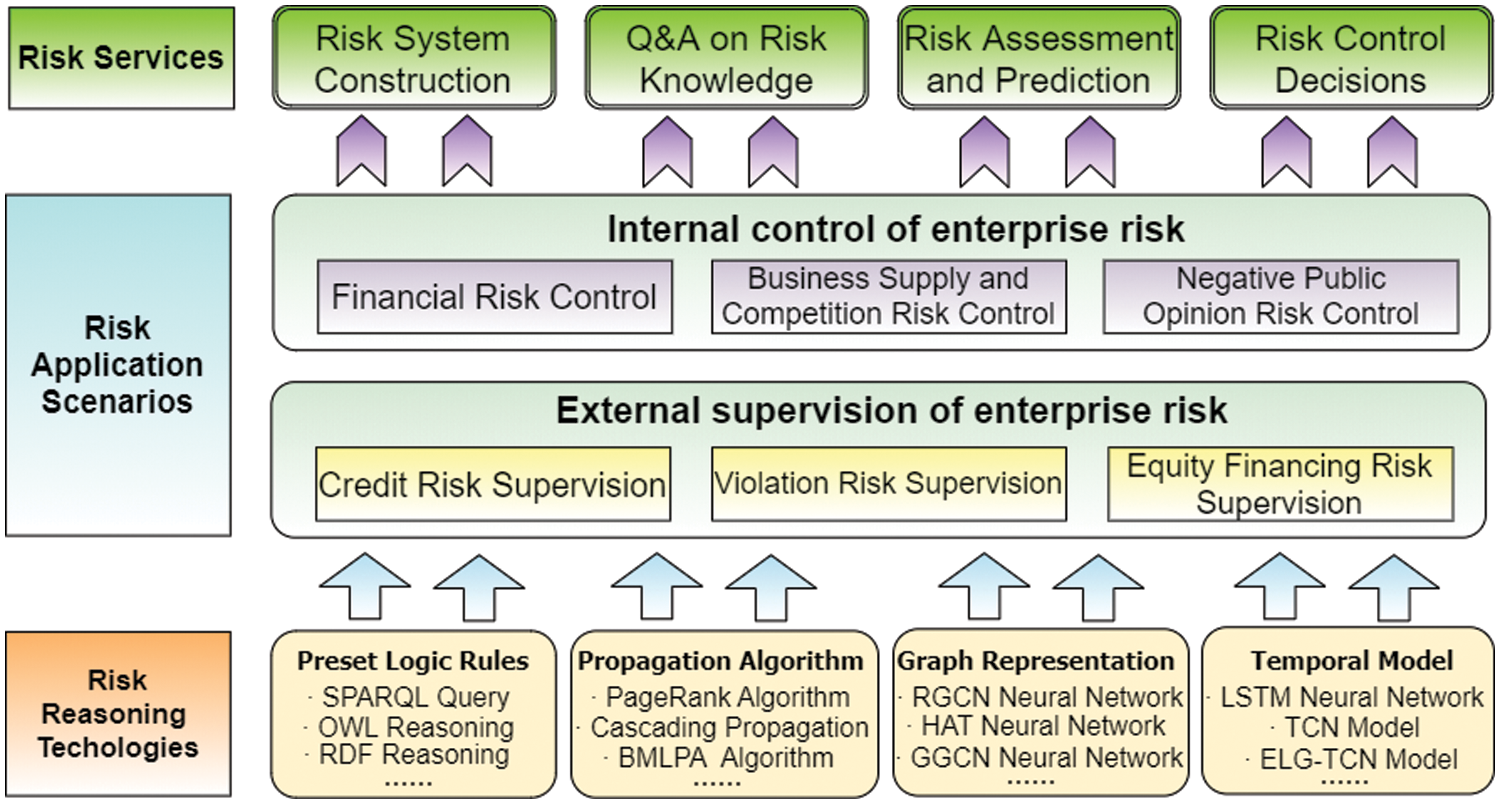
Figure 6: Enterprise risk knowledge graph reasoning technology and application scenarios
5.1 Internal Control for Enterprise Risk
Financial revenue is a prerequisite for the sustainable operation of an enterprise and provides a source of funding for its development. Financial risk refers to the problem of poor financial conditions and funding shortages that a company faces during a specific period [101]. In the management of financial risk, accounting professionals typically analyze it based on their professional experience. However, using fixed financial risk calculation formulas for a long time to evaluate a company’s financial status may result in a disconnect between risk measurement standards and the development of the socio-economic environment, raising doubts about the accuracy of financial risk assessment. The knowledge graph can be leveraged to predict a company’s revenue status using rich dynamic enterprise information. Nigam [102] inferred potential revenue risk events for subsidiary companies of conglomerates based on the knowledge graph. The risk level of different events and the risk interdependency between subsidiary companies were evaluated based on visualized risk cluster sizes. Zhang et al. [103] designed an algorithm for inter-node association rules, employing a recursive association search to uncover financial anomalies and already deregistered companies. In addition, many researchers have combined knowledge graphs with graph neural networks to optimize the encoding of multi-type nodes and relationship features from heterogeneous graph data sources. Yang et al. [104] employed news event vectors as embeddings for node vectors, constructing the Gated Graph Neural Network (GGCN) model to predict financial risk events such as suspension and restructuring, as well as shareholder reductions, achieving a precision exceeding 0.92. To comprehensively consider the impact of different types of relationships on financial risk, Zheng et al. [105] and Zhao et al. [106] respectively designed the heterogeneous graph attention network (HAT) and the hypergraph neural network (Hyper-GNN). These models enhance the initial graph neural network by incorporating the extraction of relationship features, leading to significant breakthroughs in predicting corporate bankruptcies. Zhu et al. [107] addressed the difficulty of financial risk assessment for accounting personnel in small and medium-sized enterprises with incomplete financial information. They constructed a knowledge graph encompassing various relations such as supply, transactions, and shareholding between small and medium-sized enterprises. They used the inductive graph representation model graph sample and aggregate (Graph-SAGE) to aggregate the financial feature information of related companies. Through clustering algorithms, they identified clusters of companies with revenue loss risk, demonstrating the application prospects of knowledge graphs in the financial risk assessment.
5.1.2 Business Supply and Competition Risk Control
The logistics responsible person’s illegal procurement, supplier dishonesty, substandard raw material quality, and other business supply risks have hidden dangers for the enterprise to suffer significant losses. Building a supply chain network through a knowledge graph can help enterprises detect and manage abnormal signs in the logistics supply process as soon as possible. Kosasih et al. [108] constructed a supply chain knowledge graph to connect discrete enterprises with product entities, to enhance the visibility of hidden risk associations in the supply chain. Researchers also used knowledge graphs to conduct risk analysis in the supply process, incorporating attributes such as allocation proportions of raw materials and the responsible department [109]. Li et al. [110] established a spatiotemporal knowledge graph for the geographic and supply-related associations in enterprises. They innovatively employed the relationship coevolution learning model co-evolution Learning (CoEvo) and spatiotemporal graph neural networks to identify weak links in supply stability among enterprises. Zhang et al. [111] used the method of setting central nodes to simulate trade associations between enterprises, and based on the balanced multi-label propagation algorithm (BMLPA) community detection algorithm to mine the trade chain of enterprises. On this basis, they analyzed the instability risk of the supply chain where the enterprise is located. In response to the problems exposed in the logistics process of enterprise business, Zhang et al. [112] incorporated business risk events into the knowledge graph based on node similarity matching, conducted a deep search on the correlation subgraph of business risk events, and analyzed the adverse consequences and control links caused by business operation risk factors such as project fund shortage, transportation material damage, and delayed delivery.
Due to the wide-ranging factors of market risk, market risk events in enterprises have the characteristics of being frequent and high-frequency compared to other risk categories. The involvement of a knowledge graph effectively compensates for the lack of market risk perception in product marketing personnel. Many researchers have focused on exploring market competition threats originating from the same industry. Qin et al. [113] designed an enterprise competition knowledge graph that includes product information, sales regions, and the scope of business operations. They used predicate logic rules to analyze the similarity between the scope of business operations, main products, and sales regions among enterprises. Based on probabilistic soft logic (PSL), they identified potential competitors that pose risks to the specified enterprise. Similarly, depicting the competitive image of enterprises in the industry and within the value chain using a knowledge graph has attracted strong interest from experts and scholars [114,115]. In addition, to help product marketing decision-makers avoid market volatility and user attrition risks caused by price imbalances, Ramzy et al. [116] used the semiconductor industry as an example. They designed a knowledge graph to obtain large-scale customer, product, and order-related information. This enabled them to employ a dynamic pricing method based on personalized customer and product delivery times, effectively preventing product price fluctuations caused by malicious bidding between product customers. As there is a potential correlation between supply and market risks and geographical space, exploring ways to enhance more advanced spatiotemporal knowledge graphs is warranted.
5.1.3 Negative Public Opinion Risk Control
Enterprise public opinion is an effective medium for reflecting corporate reputation and public perception. When faced with negative public opinion, if not appropriately handled by corporate public relations (PR) personnel, it can lead to brand and reputation crises. The amplification process of public opinion is driven by various external events, and within it, the risk behavior of enterprises has a crucial impact on the evolution of risks. Evaluating the sentiment of negative public opinions with sentiment analysis models and then aggregating enterprise-associated risk scores through the knowledge graph provides a straightforward approach to achieving risk assessment goals [117], albeit with the inherent subjectivity of scoring metrics. To reveal the evolution of public opinion events, existing research applies knowledge graphs to enterprise risk and public relations services, uncovering the negative elements of public opinion risks associated with enterprises [118]. Some studies incorporate static knowledge and causal logic into a dual-layer structured causal knowledge graph to analyze the evolution process of financial emergencies from the perspectives of event evolution and risk subject associations [119]. In addition, scholars have designed knowledge graphs to integrate the evolutionary development paths of enterprise public opinion events, and based on this, they have proposed systematic enterprise public opinion judgment systems [120]. Performing sequence analysis on risk sentiment data using models like GRU and Transformer, and integrating it with a knowledge graph to provide feedback on risk features to enterprise nodes, has also become a crucial approach in enterprise risk sentiment analysis, often reflected through declines in stock prices [121,122].
The evolution of risk events contains causal probabilities between event elements, which drive the future development trends of the events. Analyzing the causes and negative consequences of public opinion using the enterprise public opinion causal graph provides an example of applying a knowledge graph to identify public opinion risk in enterprises. Zhang et al. [123] focused on the embedding mechanism of graph neural networks and proposed the knowledge graph attention neural networks (KGANN) model, which is tailored to the structure of the knowledge graph. It significantly enhances the capability to identify public opinion risk for internet-related events. Furthermore, researchers have used knowledge graphs and graph propagation algorithms to analyze the common characteristics of negative public opinion spread from the perspective of risk propagation. They simulated the spreading process of negative public opinion among related enterprises after its outbreak and developed a public opinion risk early warning system to provide responsive public opinion emergency services. Nowadays, with the continuous development of causal graph technology, the ability to assess enterprise public opinion risk, supported by knowledge graphs, will gradually mature along with the iterations of event extraction and causal relation extraction technologies.
5.2 External Supervision for Enterprise Risk
The adverse effects of enterprise credit risk not only impact the companies themselves but also result in immeasurable losses for banking institutions. In recent years, many researchers have been dedicated to using knowledge graph technology to assist banking institutions in assessing the creditworthiness of enterprises and identifying credit risk. Beydoun et al. [124] designed an ontology automation construction tool for credit risk knowledge, continuously generating new ontology content through transfer learning, thus contributing to the progress of credit risk inference research. For example, Hong et al. [125] constructed a temporal knowledge graph of negative news and cases related to enterprises, added attention mechanisms to aggregate higher-order neighborhood node features, and predicted the probability of credit default risk for small and medium-sized enterprises. Yang et al. [126] relied on supply chain relationships among small and medium-sized enterprises to construct a spatiotemporal-aware graph neural network, revealing the transmission effects of credit default behavior among enterprises. Given that the credit risk of micro and small enterprises is particularly evident, it has become the focus of researchers and industry professionals. Research on credit risk management for micro and small enterprises, with knowledge graph as the core, continues to deepen, and many research achievements have emerged [127,128]. These studies collect data on credit delinquency of micro and small enterprises through channels such as Internet banking, incorporate credit attributes such as enterprise working capital, credit limits, and debt limits into a knowledge graph, and combine the extracted credit relationship graph features with basic credit indicators to enhance the discriminative ability of models for abnormal credit states. Leveraging heterogeneous graph networks within the framework of knowledge graph emerges as a potent approach for credit risk analysis. Mitra et al. [129] built upon traditional random forests, and amalgamated the heterogeneous topological features identified by the relational graph neural network (RGCN) for enterprise nodes, achieving an accuracy rate of 92%. Song et al. [130] encoded equity and supply chain information in matrices and embedded them into a hypergraph convolutional network, proposing the multi-structure cascade graph neural network (MS-CGNN) to enhance the prediction accuracy of corporate credit defaults. Wang et al. [131] focused on mining default behaviors related to bonds, extended the convolutional layers regarding the principles of the temporal convolutional network (TCN) and introduced a residual connection mechanism. This design, known as event logic graph temporal convolutional network (ELG-TCN), aimed to predict subsequent causal events in bond defaults while preventing the loss of early historical information during the transmission process. Alam et al. [132] formulated loan default risk prediction as a classification problem within the space of knowledge graph embeddings, using a hybrid approach of knowledge graph and machine learning that balances the accuracy and interpretability of enterprise loan default prediction. While credit risk prediction based on neural networks achieves high accuracy, it often lacks interpretability. Combining K-core analysis with graph propagation algorithms, Xue et al. [133] aimed to comprehensively explain the process of risk diffusion by simulating the trend of risk spreading, revealing the context of risk changes and their evolution. In addition to loan default behavior, fraudulent loan applications by enterprises also have a detrimental impact on banking institutions. The scalable information association capability of the knowledge graph aligns with the clustering of fraudulent credit enterprises, leading to the emergence of related research [134]. It is believed that incorporating community clustering algorithms into graph neural networks will gradually become the key technology for financial institutions to carry out enterprise credit risk supervision.
5.2.2 Major Violation Risk Supervision
Significant violations in enterprises include fraudulent activities, money laundering, tax violations, and audit fraud in their business operations. To gain illegal benefits, the methods of corporate financial fraud have become increasingly covert, and the continuous emergence of modern financial fraud techniques has made traditional anti-fraud measures increasingly unsustainable. Mao et al. [135] established an enterprise fund association graph using transaction amount, transaction quantity, and transaction category between enterprises. They mixed the topological characteristics of enterprise entities with financial indicator features as the data source for machine learning models. They verified that the topological attributes of enterprises embodied in the graph can effectively improve the identification accuracy of traditional machine learning models for financial fraud behavior. Wen et al. [136] focused the association perspective on the social intersection relationship among enterprises with familiar senior executives and generated a robust financial fraud detection model by comparing the performance differences of various machine learning classification methods. Li et al. [137] opted for the Heterogeneous Graph Transformer (HGT) model, tailored for heterogeneous graphs, over homogeneous graph neural networks. This shift was made with the intention of more effectively maintaining the dependency features between nodes and relationships, resulting in a fraud detection accuracy metric approaching 80%.
Compared to the aforementioned violations, fraud cases involving collusion between enterprises and auditing organizations are more covert, posing severe challenges to the investigation of audit fraud by judicial authorities. Wu et al. [138] designed an audit information knowledge graph based on real audit opinion reports of listed companies. They organically integrated the tripartite relationship between enterprises, auditing organizations, and auditors. Based on this, they proposed a knowledge graph inference framework using the semantic and functional equivalence (SFE) path search method. Starting from non-compliant enterprises and auditors, they simulated the spread of risks and verified through data analysis that auditors suspected of fraud were highly likely to continue working for fraudulent companies even after changing their job locations. In the case of tax violations, which account for a higher proportion of non-compliance behavior, it has also become a research hotspot for applying knowledge graphs to non-compliance risk areas. Zheng et al. [139] constructed an enterprise association graph based on media such as emails and legal entities and evaluated the probability of the first occurrence and repeated occurrence of tax violations in risky enterprises using probabilistic credibility indicators. Additionally, because implicated enterprises may not directly engage in fraudulent activities but are responsible for concealing illegal gains from fraud, identifying and investigating enterprise money laundering activities can be challenging. Researchers have started using knowledge graph technology to associate asset transfers and criminal activities between enterprises, to identify high-risk enterprises involved in abnormal asset transfers [140,141]. The integration of heterogeneous graph representation learning with multi-channel features has become a recent technological focus. Designing diverse graph feature learning mechanisms for legal risks such as corporate litigation and non-compliance, as well as inter-enterprise association information, may become an essential direction for further advances in applying knowledge graphs.
5.2.3 Supervision of Risks Related to Equity Financing
The complex relationships of cross-shareholdings, indirect shareholdings, and equity acquisitions between enterprises make it increasingly difficult for regulatory agencies to scrutinize corporate equity financing. In the early stages of knowledge graph development, many researchers utilized the multi-level knowledge association capabilities of knowledge graph to analyze corporate shareholding relationships and automate the discovery of risk pathways. Based on this, they built intelligent systems for retrieving and associating equity risk [142,143]. Researchers also performed in-depth equity risk analysis to precisely determine the ownership proportions among different enterprises and ensure control within manageable bounds. They introduced the Tarjan algorithm, based on depth-first traversal trees, to uncover the ultimate controllers of risky enterprises [144]. Taking equity controllers as initial nodes and backtracking through layers to deduce equity control pathways has become the primary approach to identifying the actual controllers of companies, laying the technical foundation for subsequent in-depth research. With the rise of temporal graph representation learning techniques, Yang et al. [98] constructed a dynamic graph of equity change, extracted domain event features of the target entities to be predicted using a multi-relational neighborhood aggregator. They employed a ResNet-based dynamic knowledge graph reasoning method to dynamically predict unknown risk events triggered by equity changes in enterprises. Bellomarini et al. [145] analyzed the risks of foreign acquisitions of corporate equity in different graph formations and evaluated the proportion of equity holdings that endangered companies need the government to increase, to protect strategic enterprise equity from foreign capital acquisitions. This has universal significance for the advancement of knowledge graph research in the field of corporate equity risk management. Indeed, substantial progress has been made in the analysis of equity association risks in past knowledge graph research. However, for such research to be widely implemented in intelligent regulatory platforms, there is a need to continuously iterate the efficiency of equity penetration and risk propagation algorithms to handle large clusters of equity associations, while considering fine-grained properties such as equity structure and quotas to enhance the evaluation level of equity association risks.
6 Opportunities and Challenges Faced by the Application of Knowledge Graph in the Field of Enterprise Risk
Knowledge graph technology has penetrated all aspects of enterprise risk management, but at the current stage, there are still many technical deficiencies and application challenges that need to be addressed. This section will focus on analyzing the problems faced by existing research and provide feasible suggestions for the following research direction.
6.1 The Extraction Method of Enterprise Risk Knowledge Needs Improvement
Risk knowledge extraction is a prerequisite for enterprise risk assessment and prediction work, but there is still room for improvement in terms of data annotation costs and extraction accuracy. At present, the mainstream knowledge extraction methods in enterprise risk rely on deep learning models, which require pre-labeling of corpus labels and constructing a dataset suitable for model training, and have high requirements for time and labor costs. Therefore, adopting transfer learning or semantic enhancement for low-resource knowledge extraction holds promise for the future. For instance, Dong et al. [146] employed label perception as auxiliary information to enrich the semantic richness of small-sample corpora, Singh et al. [147] applied large language models for cross-language transfer learning, and Hazem et al. [148] designed a transfer learning model that takes into account both cross-disciplinary and cross-language considerations. At the same time, there is an urgent need to establish a large-scale multilingual enterprise risk knowledge base to address resource scarcity issues. Secondly, the accuracy of extracting risk entities and relationships at the document level needs to be improved. Due to the flexibility of Chinese expression, much semantic information containing value is scattered in different paragraphs of the entire text, making it challenging to capture traditional risk knowledge extraction models. Recent research results demonstrate that employing heterogeneous graph attention to extract word-level, mention-level, and entity-level graphs can significantly enhance document-level knowledge extraction performance [149], offering a promising solution in enterprise risk. Events are the core driving force behind the evolution of enterprise risk, and event-based risk knowledge extraction methods have also fallen into technical bottlenecks. As the pressing issue in event extraction revolves around the challenge of overlapping events, the novel approach involves transforming event extraction into a grouping matching task [150]. This is accomplished by unraveling overlapping event trigger words and arguments, classifying them using a scoring mechanism, and then recombining them to create a comprehensive roster of events.
6.2 Exploring the Risk of Sudden Unexpected Events Needs to Be Expanded
The field of enterprise risk involves various risk categories, and knowledge graph technology has been applied to different risk domains. However, there are still some insufficiencies in exploring risks related to policy resistance, casualty accidents, force majeure risks caused by significant emergencies, financial exchange rate risks, and other sudden emergency risk factors. The relationships among companies, such as investments, trades, and competition, tend to remain stable over a certain period. Typically, even with changes in these relationships, the induced adverse effects remain within manageable bounds. However, risks generated by sudden emergency factors are closely related to dynamic events in society and involve various uncertainties, making it more demanding to grasp the patterns of their development. The multitude of external events and factors makes it more appropriate at this stage to focus on a detailed assessment of sudden risks through the analysis of the single dimension, rather than directly employing a knowledge graph for an all-encompassing analysis of business scenarios. Despite the scarcity of research on enterprise sudden risk management, particularly concerning policy resistance and casualty accident risks, valuable studies in these domains merit attention. Wang et al. [151] employed a knowledge graph to deduce the unforeseen risks faced by mobile payment enterprises, while Xia et al. [152] combined a knowledge graph with the policy sentiment analysis (PSA) model to analyze the impact risks of contingency environmental policies. Moreover, monitoring casualty risks in heavy industrial enterprises can involve spatial simulation analysis through remote sensing technology and three-dimensional geographic information systems [153]. The simulated graphical information is then transmitted for knowledge graph modeling, incorporating risk node mining using the graph convolutional network (GCN). By employing the above-mentioned methods, achieve early warning of sudden risk events and formulate contingency plans, gradually expanding the application scenarios of knowledge graph technology in sudden risk management for enterprises.
6.3 The Real-Time Performance of Enterprise Risk Prediction Needs to Be Strengthened
Enterprise risk is not static and will continue to develop over time. However, there is still room for deep exploration in applying knowledge graphs to temporal risk prediction-related technologies. Many researchers integrate time elements into the knowledge graph, forming a temporal knowledge graph with four tuples as the basic unit. Existing research usually uses graph embedding to quantify the semantic association features stored in the knowledge graph, completing the temporal knowledge graph inference for risk inference purposes, or integrating graph feature vectors into downstream deep learning models to complete risk prediction tasks. However, existing research has a relatively broad prediction range for risk-triggering time zones, failing to achieve refined risk time node prediction, and lacking consideration of the attenuation effect of risk level over time, resulting in the real-time enterprise risk prediction model incorporating artificial intelligence technologies such as knowledge graph not being widely used in the industry. Tense knowledge graph reasoning models such as time-guided recurrent graph network (TiRGN) [154] and relation-entity twin-interact aggregation (RETIA) [155] have emerged successively. The former enables dynamic modeling along a timeline by capturing historical factual features to learn representations of entities and relationships. The latter captures location-related constraints by modeling the structural information of hyperrelations and temporal dependencies. Modeling historical risk events within enterprises using time-series knowledge graph technologies such as TiRGN and RETIA, and subsequently predicting the temporal risk trends of enterprises, is a worthwhile and practical direction.
6.4 Enterprise Intelligent Risk Warning Platform Needs to Be Developed
Although there are currently pilot intelligent platforms and enterprise-level projects in enterprise risk management using knowledge graph technology, there are deficiencies in the completeness of platform functions, applicability in risk areas, and the scale of platform operations at multiple levels. The existing application projects that combine knowledge graphs with the field of enterprise risk are mainly aimed at banking institutions, providing identification and monitoring services for enterprise credit risks. Risk analysis platforms for internal financial risk warning, market risk monitoring, and negative public opinion management are usually limited to data collection and indicator analysis services or view knowledge graphs as visual analysis tools, rather than relying on the semantic and topological features of knowledge graph as the core to achieve prediction of unknown risk events and forward-looking knowledge deduction. Given the above issues, it is necessary to develop ontology construction tools similar to Learn2Construct [156] and build large-scale knowledge graph automatic reasoning models using a hierarchical architecture and an active recursive reasoning mechanism, akin to Vadalog [157]. Building upon this foundation, researchers and enterprise managers can enable the service platform to automatically construct risk ontologies and knowledge graphs based on risk requirements, facilitating real-time risk reasoning services. At the same time, it is necessary to accelerate the cultivation of high-level talents in the field of knowledge graph and assist enterprise managers in completing the full cycle risk management of risk identification, risk assessment, and risk control.
Enterprise risk management is a necessary link to ensure stable operation and sustainable development of enterprises. However, due to uncertainty factors such as the large scale of risk information, complex risk characteristics, and random and diverse risk evolution paths, traditional enterprise risk management methods are increasingly difficult to sustain. The knowledge graph has superior heterogeneous information processing capabilities, enabling structured storage and correlation inference of fragmented enterprise risk information. Researchers have widely applied knowledge graph technology to the field of enterprise risk management and achieved significant results in numerous risk management business scenarios. This review systematically compares and analyzes the construction techniques and challenges of enterprise risk knowledge graphs, while illustrating how knowledge graphs can be applied to enterprise risk management from the perspective of application scenarios. Furthermore, suggestions for improvement and measures are proposed to address the shortcomings in existing research. Addressing the low-resource challenges faced by risk knowledge extraction through the generative artificial intelligence technology, achieving real-time monitoring of enterprise risk factors through dynamic knowledge graphs, and integrating knowledge extraction with risk traceability to establish the systematic service for an intelligent system are areas that require further exploration in research. These aspects also outline the future research scope of our work.
Acknowledgement: All authors sincerely appreciate the organizations and institutions that provided resources for this research. Thanks to Qingdao University of Technology for providing research equipment. Gratitude to laboratory colleagues who assisted in this study.
Funding Statement: This research was supported by the Shandong Province Science and Technology Project (2023TSGC0509, 2022TSGC2234), Qingdao Science and Technology Plan Project (23-1-5-yqpy-2-qy).
Author Contributions: The authors confirm their contribution to the paper as follows: design research architecture and analyze technological advancements: P. Li, Q. Zhao; data collection and analysis: Y. Liu, C. Zhong; enhance the scientific rigor and readability of the review: J. Wang, Z. Lyu; draft manuscript preparation: P. Li, Q. Zhao. All authors reviewed the results and approved the final version of the manuscript.
Availability of Data and Materials: Not applicable.
Conflicts of Interest: The authors declare that they have no conflicts of interest to report regarding the present study.
References
1. H. Jankensgård, “A theory of enterprise risk management,” Corp. Gov-Int. J. Biss. Soc., vol. 19, no. 3, pp. 565–579, 2019. [Google Scholar]
2. A. R. Razali and I. M. Tahir, “Review of the literature on enterprise risk management,” Bus. Manag. Dynam., vol. 1, no. 5, pp. 8–16, 2011. [Google Scholar]
3. N. Ekwere, “Framework of effective risk management in small and medium enterprises (SMESsA literature review,” Bina. Ekonomi., vol. 1, no. 20, pp. 23–46, 2016. [Google Scholar]
4. J. Dvorsky, J. Belas, B. Gavurova, and T. Brabenec, “Business risk management in the context of small and medium-sized enterprises,” Econ. Res.-Ekon. Istraz., vol. 34, no. 1, pp. 1690–1708, 2021. [Google Scholar]
5. X. Zou, “A survey on application of knowledge graph,” in J. Phys. Conf. Ser., Singapore, 2020, pp. 12–16. [Google Scholar]
6. A. Singhal, “Introducing the knowledge graph: Things, not strings,” Official Google Blog, vol. 5, no. 16, pp. 3, 2012. [Google Scholar]
7. A. Hogan et al., “Knowledge graphs,” ACM Comput. Surv., vol. 54, no. 4, pp. 1–37, 2021. [Google Scholar]
8. D. Fensel et al., “Introduction: what is a knowledge graph?,” in Knowledge graphs: Methodology, Tools and Selected Use Cases. Cham: Springer, 2020, pp. 1–10. [Google Scholar]
9. S. P. Guan et al., “What is event knowledge graph: A survey,” IEEE Trans. Knowl. Data Eng., vol. 35, no. 7, pp. 7569–7589, 2022. [Google Scholar]
10. N. W. S. Wardhani, M. Y. Rochayani, A. Iriany, A. D. Sulistyono, and P. Lestantyo, “Cross-validation metrics for evaluating classification performance on imbalanced data,” in 2019 Int. Conf. on Computer, Control, Inform. Appl. (IC3INA), Tangerang, Indonesia, 2019, pp. 14–18. [Google Scholar]
11. S. He and X. Yang, “Federated learning-based financial risk early warning model for Baijiu enterprises,” Academic J. Manag. Soc. Sci., vol. 3, no. 3, pp. 133–138, 2023. doi: 10.54097/ajmss.v3i3.11096. [Google Scholar] [CrossRef]
12. E. F. Tjong Kim Sang and F. De Meulder, “Introduction to the CoNLL-2003 shared task: Language-independent named entity recognition,” in Proc. Seventh Conf. on Natural Lang. Learn. at HLT-NAACL, Edmonton, Canada, 2003, pp. 142–147. [Google Scholar]
13. M. Jalali, N. Mustapha, M. N. Sulaiman, and A. Mamat, “WebPUM: A Web-based recommendation system to predict user future movements,” Expert. Syst. Appl., vol. 37, no. 9, pp. 6201–6212, 2010. doi: 10.1016/j.eswa.2010.02.105. [Google Scholar] [CrossRef]
14. J. Foley, S. M. Sarwar, and J. Allan, “Named entity recognition with extremely limited data,” arXiv:1806.04411, 2018. [Google Scholar]
15. Z. Xu, D. Burdick, and L. Raschid, “Exploiting lists of names for named entity identification of financial institutions from unstructured documents,” arXiv:1602.04427, 2016. [Google Scholar]
16. S. Kaur et al., “REFinD: Relation extraction financial dataset,” arXiv:2305.18322, 2023. [Google Scholar]
17. P. Wichmann, A. Brintrup, S. Baker, P. Woodall, and D. McFarlane, “Extracting supply chain maps from news articles using deep neural networks,” Int. J. Prod. Res., vol. 58, no. 17, pp. 5320–5336, 2020. doi: 10.1080/00207543.2020.1720925. [Google Scholar] [CrossRef]
18. G. Jacobs and V. Hoste, “SENTiVENT: Enabling supervised information extraction of company-specific events in economic and financial news,” Lang. Resour. Eval., vol. 56, no. 1, pp. 225–257, 2022. doi: 10.1007/s10579-021-09562-4. [Google Scholar] [CrossRef]
19. S. Sharma et al., “FinRED: A dataset for relation extraction in financial domain,” in Companion Proc. Web Conf. 2022, Lyon, France, 2022, pp. 595–597. [Google Scholar]
20. X. Zheng, L. Li, and W. Zhang, “An end-to-end hierarchical multi-task learning framework of sentiment analysis and key entity identification for online financial texts,” in 2021 IEEE 24th Int. Conf. on Comput. Support. Co-op. Work in Design, Dalian, Liaoning, China, 2021, pp. 1245–1250. [Google Scholar]
21. J. Sheng et al., “A joint learning framework for the CCKS-2020 financial event extraction task,” Data Intell., vol. 3, no. 3, pp. 444–459, 2021. doi: 10.1162/dint_a_00098. [Google Scholar] [CrossRef]
22. S. Zheng, W. Cao, W. Xu, and J. Bian, “Doc2EDAG: An end-to-end document-level framework for Chinese financial event extraction,” arXiv:1904.07535, 2019. [Google Scholar]
23. C. Han, J. Zhang, X. Li, G. Xu, W. Peng and Z. Zeng, “DuEE-Fin: A large-scale dataset for document-level event extraction,” in CCF Int. Conf. on Natural Lang. Process. Chinese Comput., Guilin, Guangxi, China, 2022, pp. 172–183. [Google Scholar]
24. B. Kong, R. F. Xu, and D. Y. Wu, “Bootstrapping-based relation extraction in financial domain,” in 2015 Int. Conf. Mach. Learn. Cybern., Guangzhou, Guangdong, China, 2015, pp. 897–903. [Google Scholar]
25. M. Wu, M. Liu, L. Wang, and H. Hu, “A Chinese fine-grained financial event extraction dataset,” in Companion Proc. ACM Web Conf. 2023, Austin, Texas, USA, 2023, pp. 1229–1235. [Google Scholar]
26. L. He, S. Wang, and X. Cao, “Multi-feature fusion method for chinese shipping companies credit named entity recognition,” Appl. Sci., vol. 13, no. 9, pp. 5787, 2023. doi: 10.3390/app13095787. [Google Scholar] [CrossRef]
27. G. Jacobs, E. Lefever, and V. Hoste, “Economic event detection in company-specific news text,” in 1st Workshop on Econ. and Nat. Lang. Process. (ECONLP) at Meet. of the Assoc.-for-Comput.-Linguist. (ACL), Melbourne, Australia, 2018, pp. 1–10. [Google Scholar]
28. P. Bromiley, M. McShane, A. Nair, and E. Rustambekov, “Enterprise risk management: Review, critique, and research directions,” Long. Range. Plann., vol. 48, no. 4, pp. 265–276, 2015. doi: 10.1016/j.lrp.2014.07.005. [Google Scholar] [CrossRef]
29. H. Saggion, A. Funk, D. Maynard, and K. Bontcheva, “Ontology-based information extraction for business intelligence,” in The Semantic Web: 6th Int. Semantic Web Conf., 2nd Asian Semantic Web Conf., Berlin, Germany, 2007, pp. 843–856. [Google Scholar]
30. M. Loster, Z. Zuo, F. Naumann, O. Maspfuhl, and D. Thomas, “Improving company recognition from unstructured text by using dictionaries,” in Int. Conf. on Ext. Database Technol., Venice, Italy, 2017, pp. 610–619. [Google Scholar]
31. J. C. S. Alvarado, K. Verspoop, and T. Baldwin, “Domain adaption of named entity recognition to support credit risk assessment,” in Proc. Aust. Lang. Technol. Assoc. Workshop 2015, Melbourne, Victoria, Australia, 2015, pp. 84–90. [Google Scholar]
32. L. Zhao, L. Li, X. Zheng, and J. Zhang, “A BERT based sentiment analysis and key entity detection approach for online financial texts,” in 2021 IEEE 24th Int. Conf. on Computer Supported Cooperative Work in Design, Dalian, Liaoning, China, 2021, pp. 1233–1238. [Google Scholar]
33. B. Yang and Y. Liao, “Research on the construction and application of knowledge graph for enterprise dynamic risk,” J. Mod. Inf., vol. 41, no. 1, pp. 110–120, 2021. [Google Scholar]
34. M. F. Yang and B. Yang, “Research on entity relationship extraction in risk domain integrating mutual attention,” J. Chin. Comput. Syst., vol. 44, no. 5, pp. 991–1001, 2023. [Google Scholar]
35. T. Wang, R. Huang, N. Hu, H. Wang, and G. Chu, “Chinese named entity recognition method based on dictionary semantic knowledge enhancement,” IEICE Trans. Inf. Syst., vol. 106, no. 5, pp. 1010–1017, 2023. doi: 10.1587/transinf.2022EDP7168. [Google Scholar] [PubMed] [CrossRef]
36. R. Gu, T. Wang, J. Deng, and L. Cheng, “Improving Chinese named entity recognition by interactive fusion of contextual representation and glyph representation,” Appl. Sci., vol. 13, no. 7, pp. 4299, 2023. doi: 10.3390/app13074299. [Google Scholar] [CrossRef]
37. E. Covas, “Named entity recognition using GPT for identifying comparable companies,” arXiv:2307.07420, 2023. [Google Scholar]
38. P. Huang, X. Zhao, M. Hu, Y. Fang, X. Li and W. Xiao, “Extract-select: A span selection framework for nested named entity recognition with generative adversarial training,” in Findings of the Association for Computational Linguistics: ACL 2022, Dublin, Ireland, 2022, pp. 85–96. [Google Scholar]
39. A. Agrawal, S. Tripathi, M. Vardhan, V. Sihag, G. Choudhary and N. Dragoni, “BERT-based transfer-learning approach for nested named-entity recognition using joint labeling,” Appl. Sci., vol. 12, no. 3, pp. 976, 2022. doi: 10.3390/app12030976. [Google Scholar] [CrossRef]
40. L. Liu, B. Ding, L. Bing, S. Joty, L. Si and C. Miao, “MulDA: A multilingual data augmentation framework for low-resource cross-lingual NER,” in Proc. 59th Annu. Meet. of the Assoc. for Comput. Linguist. and the 11th Int. Joint Conf. on Nat. Lang. Process., vol. 1, 2021, pp. 5834–5846. [Google Scholar]
41. A. Auger and C. Barrière, “Pattern-based approaches to semantic relation extraction: A state-of-the-art,” Int. J. Theor. Appl. Issues. in Specialized. Commun., vol. 14, no. 1, pp. 1–19, 2008. [Google Scholar]
42. H. Wu, Q. Lei, X. Zhang, and Z. Luo, “Creating a large-scale financial news corpus for relation extraction,” in 2020 3rd Int. Conf. Artif. Intell. Big Data, Chengdu, Sichuan, China, 2020, pp. 259–263. [Google Scholar]
43. J. Zhao, J. Wang, J. Yang, and P. Jin, “Extracting Top-k company acquisition relations from the web,” Int. J. Semant. Web. Inf., vol. 13, no. 4, pp. 27–41, 2017. doi: 10.4018/IJSWIS.2017100102. [Google Scholar] [CrossRef]
44. T. Nugent and J. L. Leidner, “Risk mining: Company-risk identification from unstructured sources,” in 2016 IEEE 16th Int. Conf. on Data Mining Workshops, Barcelona, Catalonia, Spain, 2016, pp. 1308–1311. [Google Scholar]
45. K. Du, B. Yang, S. Wang, Y. Chang, S. Li and G. Yi, “Relation extraction for manufacturing knowledge graphs based on feature fusion of attention mechanism and graph convolution network,” Knowl.-Based Syst., vol. 255, no. 2, pp. 109703, 2022. doi: 10.1016/j.knosys.2022.109703. [Google Scholar] [CrossRef]
46. C. Yan, X. Fu, W. Wu, S. Lu, and J. Wu, “Neural network based relation extraction of enterprises in credit risk management,” in 2019 IEEE Int. Conf. on Big Data and Smart Computing, Kyoto, Japan, 2019, pp. 1–6. [Google Scholar]
47. N. Yang, D. Shi, and Y. Hua, “Bidirectional gated recurrent unit neural networks for relation extraction of Chinese enterprises,” in IEEE 4th Inform. Technol., Netw., Elect. Autom. Control Conf. (ITNEC), Chongqing, China, 2020, pp. 1539–1543. [Google Scholar]
48. T. Sun, “Relation extraction from financial reports,” M.S. thesis, Univ. of York, UK, 2022. [Google Scholar]
49. X. Tang and Z. Liu, “Research on text sequence tagging and joint extraction of entity and relation in financial field,” Inf. Sci., vol. 39, no. 5, pp. 3–11, 2021. [Google Scholar]
50. L. Hillebrand et al., “KPI-BERT: A joint named entity recognition and relation extraction model for financial reports,” in 2022 26th Int. Conf. Pattern Recognit. (ICPR), Montreal, QC, Canada, 2022, pp. 606–612. [Google Scholar]
51. S. Pasch and D. Petridis, “Ahead of the text: Leveraging entity preposition for financial relation extraction,” arXiv:2308.04534, 2023. [Google Scholar]
52. L. Qiu, B. Peng, Y. Y. Hsu, and E. Chersoni, “A simple approach to financial relation classification with pre-trained language models,” in The 4th Workshop on Knowledge Discovery from Unstructured Data in Financial Services, Taipei, Taiwan, 2023. [Google Scholar]
53. N. H. Vardhan and M. Chaudhary, “iMETRE: Incorporating markers of entity types for relation extraction,” arXiv:2307.00132, 2023. [Google Scholar]
54. N. Mao, W. Huang, and H. Zhong, “KGGCN: Knowledge-guided graph convolutional networks for distantly supervised relation extraction,” Appl. Sci., vol. 11, no. 16, pp. 7734, 2021. doi: 10.3390/app11167734. [Google Scholar] [CrossRef]
55. P. K. Rajpoot and A. Parikh, “GPT-FinRE: In-context learning for financial relation extraction using large language models,” arXiv:2306.17519, 2023. [Google Scholar]
56. H. Khaldi, F. Benamara, C. Pradel, and N. Aussenac-Gilles, “A closer look to your business network: Multitask relation extraction from economic and financial french content,” in The AAAI-22 Workshop on Knowledge Discovery from Unstructured Data in Financial Services, Vancouver, BC, Canada, 2022. [Google Scholar]
57. M. Had, F. Jungermann, and K. Morik, “Relation extraction for monitoring economic networks,” in Nat. Lang. Process. Inform. Syst.: 14th Int. Conf. Appl. Nat. Lang. Inform. Syst., NLDB 2009, Saarbrücken, Germany, 2010, pp. 103–114. [Google Scholar]
58. V. H. Tran, H. Ouchi, T. Watanabe, and Y. Matsumoto, “Improving discriminative learning for zero-shot relation extraction,” in Proc. 1st Workshop on Semiparametric Methods in NLP: Decoupling Logic from Knowledge, Dublin, Ireland, 2022, pp. 1–6. [Google Scholar]
59. S. Wang, B. Zhang, Y. Xu, Y. Wu, and B. Xiao, “RCL: Relation contrastive learning for zero-shot relation extraction,” in Findings Assoc. Comput. Linguist.: NAACL 2022, Seattle, USA, 2022, pp. 2456–2468. [Google Scholar]
60. C. Yuan, Q. Xie, and S. Ananiadou, “Zero-shot temporal relation extraction with chatGPT,” arXiv:2304.05454, 2023. [Google Scholar]
61. P. Ren et al., “Tuning N-ary relation extraction as Machine Reading Comprehension,” Neurocomputing, vol. 562, no. 18, pp. 126893, 2023. doi: 10.1016/j.neucom.2023.126893. [Google Scholar] [CrossRef]
62. H. Yang, Y. Chen, K. Liu, Y. Xiao, and J. Zhao, “DCFEE: A document-level chinese financial event extraction system based on automatically labeled training data,” in Proc. ACL 2018, Syst. Demon., Melbourne, Victoria, Australia, 2018, pp. 50–55. [Google Scholar]
63. I. Verma, L. Dey, R. S. Srinivasan, and L. Singh, “Event detection from business news,” in Pattern Recognit. Mach. Intell.: 6th Int. Conf., PReMI 2015, Warsaw, Poland, 2015, pp. 575–585. [Google Scholar]
64. Z. Liu, Y. Qian, T. Yi, and H. Lv, “Constructing knowledge graph for financial securities and discovering related stocks with knowledge association,” Data Anal. Knowl. Discov., vol. 6, no. 2/3, pp. 184–201, 2022. [Google Scholar]
65. P. Wang, Z. Deng, and R. Cui, “TDJEE: A document-level joint model for financial event extraction,” Electronics, vol. 10, no. 7, pp. 824, 2021. doi: 10.3390/electronics10070824. [Google Scholar] [CrossRef]
66. L. Ein-Dor et al., “Financial event extraction using wikipedia-based weak supervision,” in Proc. Second Workshop on Econ. and Nat. Lang. Process., Hong Kong, China, 2019, pp. 10–15. [Google Scholar]
67. X. H. Li, W. Cheng, X. Y. Tang, T. Yu, Z. Chen and T. Y. Qian, “A joint extraction method of financial events based on multi-layer convolutional neural networks,” Libr. Inf. Serv., vol. 65, no. 84, pp. 89–99, 2021 (In Chinese). [Google Scholar]
68. Q. Wan, C. Wan, K. Xiao, R. Hu, D. Liu and X. Liu, “CFERE: Multi-type Chinese financial event relation extraction,” Inform. Sci., vol. 630, no. 3, pp. 119–134, 2023. doi: 10.1016/j.ins.2023.01.143. [Google Scholar] [CrossRef]
69. Q. Xi et al., “EABERT: An event annotation enhanced BERT framework for event extraction,” Mob. Netw. Appl., vol. 9, no. 8, pp. 1–13, 2023. doi: 10.1007/s11036-023-02203-w. [Google Scholar] [CrossRef]
70. K. Zeng, C. Li, L. Hou, J. Li, and L. Feng, “A comprehensive survey of entity alignment for knowledge graphs,” AI Open, vol. 2, no. 6, pp. 1–13, 2021. doi: 10.1016/j.aiopen.2021.02.002. [Google Scholar] [CrossRef]
71. T. Suzumura et al., “Towards federated graph learning for collaborative financial crimes detection,” arXiv:1909.12946, 2019. [Google Scholar]
72. Y. R. Jean-Mary, E. P. Shironoshita, and M. R. Kabuka, “Ontology matching with semantic verification,” J. Web. Semant., vol. 7, no. 3, pp. 235–251, 2009. doi: 10.1016/j.websem.2009.04.001. [Google Scholar] [PubMed] [CrossRef]
73. R. Ziv, I. Gronau, and M. Fire, “CompanyName2Vec: Company entity matching based on job ads,” in 2022 IEEE 9th Int. Conf. Data Sci. Advanced Analyt. (DSAA), Shenzhen, China, 2022, pp. 1–10. [Google Scholar]
74. Y. Peng, J. Zhang, C. Zhou, and S. Meng, “Knowledge graph entity alignment using relation structural similarity,” J. Database Manag., vol. 33, no. 1, pp. 1–19, 2022. doi: 10.4018/JDM.305733. [Google Scholar] [CrossRef]
75. X. Chen and Y. Xiang, “Construction and application of enterprise risk knowledge graph,” Comput. Sci., vol. 47, no. 11, pp. 237–243, 2020. [Google Scholar]
76. F. Kruse, J. P. Awick, J. M. Gómez, and P. Loos, “Developing a legal form classification and extraction approach for company entity matching: Benchmark of rule-based and machine learning approaches,” in Bus. Inf. Syst., Hannover, Germany, 2021, pp. 13–26. [Google Scholar]
77. T. Jiang, C. Bu, Y. Zhu, and X. Wu, “Combining embedding-based and symbol-based methods for entity alignment,” Pattern Recognit., vol. 124, pp. 180433, 2022. doi: 10.1016/j.patcog.2021.108433. [Google Scholar] [CrossRef]
78. G. Lu, L. Zhang, M. Jin, P. Li, and X. Huang, “Entity alignment via knowledge embedding and type matching constraints for knowledge graph inference,” J. Amb. Intel. Hum. Comp., vol. 13, pp. 1–11, 2021. [Google Scholar]
79. Y. Zhang, Y. Li, X. Wei, Y. Yang, L. Liu and Y. L. Murphey, “Graph matching for knowledge graph alignment using edge-coloring propagation,” Pattern Recognit., vol. 144, no. 11, pp. 109851, 2023. doi: 10.1016/j.patcog.2023.109851. [Google Scholar] [CrossRef]
80. F. Ilievski, E. Hovy, P. Vossen, S. Schlobach, and Q. Xie, “The role of knowledge in determining identity of long-tail entities,” J. Web. Semant., vol. 61, pp. 100565, 2020. [Google Scholar]
81. X. Zhao, W. Zeng, and J. Tang, “Long-tail entity alignment,” Entity Alignment: Concepts, Recent Advances and Novel Approaches, pp. 161–184, 2023. [Google Scholar]
82. I. L. Oliveira, R. Fileto, R. Speck, L. P. F. Garica, D. Moussallem and J. Lehmann, “Towards holistic entity linking: Survey and directions,” Inform. Syst., vol. 95, no. 2, pp. 101624, 2021. doi: 10.1016/j.is.2020.101624. [Google Scholar] [CrossRef]
83. T. Tran, N. K. Tran, T. H. Asmelash, and R. Jäschke, “Semantic annotation for microblog topics using wikipedia temporal information,” in Proc. 2015 Conf. on Emp. Methods Nat. Lang. Process., Lisbon, Portugal, 2015, pp. 97–106. [Google Scholar]
84. S. Trani, C. Lucchese, R. Perego, D. E. Losada, D. Ceccarelli and S. Orlando, “SEL: A unified algorithm for salient entity linking,” Comput. Intell., vol. 34, no. 1, pp. 2–29, 2018. doi: 10.1111/coin.12147. [Google Scholar] [CrossRef]
85. Ö. Sevgili, A. Panchenko, and C. Biemann, “Improving neural entity disambiguation with graph embeddings,” in Proc. 57th Annu. Meet. of the Assoc. for Comput. Linguist.: Student Res. Workshop, Florence, Italy, 2019, pp. 315–322. [Google Scholar]
86. I. L. Oliveira, D. Moussallem, L. P. F. Garcia, and R. Fileto, “OPTIC: A deep neural network approach for entity linking using word and knowledge embeddings,” in 22nd Int. Conf. on Enterprise Information Systems, Prague, Czech Republic, 2020, pp. 315–326. [Google Scholar]
87. Y. Shi, R. Yang, C. Yin, Y. Lu, Y. Yang and Y. Tao, “Entity linking method for chinese short texts with multiple embedded representations,” Electronics, vol. 12, no. 12, pp. 2692, 2023. doi: 10.3390/electronics12122692. [Google Scholar] [CrossRef]
88. Q. Li et al., “Improving entity linking by introducing knowledge graph structure information,” Appl. Sci., vol. 12, no. 5, pp. 2702, 2022. doi: 10.3390/app12052702. [Google Scholar] [CrossRef]
89. A. Weichselbraun, D. Streiff, and A. Scharl, “Consolidating heterogeneous enterprise data for named entity linking and web intelligence,” Int. J. Artif. Intell. T., vol. 24, no. 2, pp. 1540008, 2015. doi: 10.1142/S0218213015400084. [Google Scholar] [CrossRef]
90. Q. Miao, Y. Meng, and B. Zhang, “Chinese enterprise knowledge graph construction based on linked data,” in Proc. 2015 IEEE 9th Int Conf. Semant. Comput., Anaheim, CA, USA, 2015, pp. 153–154. [Google Scholar]
91. A. Parravicini, R. Patra, D. B. Bartolini, and D. S. Marco, “Fast and accurate entity linking via graph embedding,” in Proc. 2nd Joint Int. Workshop on Graph Data Management Experiences & Systems (GRADES) and Network Data Analytics (NDA), Amsterdam, Netherlands, 2019, pp. 1–9. [Google Scholar]
92. R. Miao, X. Zhang, H. Yan, and C. Chen, “A dynamic financial knowledge graph based on reinforcement learning and transfer learning,” in 2019 IEEE Int. Conf. Big Data, Los Angeles, CA, USA, 2019, pp. 5370–5378. [Google Scholar]
93. D. Song et al., “Building and querying an enterprise knowledge graph,” IEEE Trans. Serv. Comput., vol. 12, no. 3, pp. 356–369, 2017. doi: 10.1109/TSC.2017.2711600. [Google Scholar] [CrossRef]
94. I. Yamada, H. Shindo, H. Takeda, and Y. Takefuji, “Joint learning of the embedding of words and entities for named entity disambiguation,” in Proc. 20th SIGNLL Conf. Comput. Natural Lang. Learn., Berlin, Germany, 2016, pp. 250–259. [Google Scholar]
95. X. Yang et al., “Learning dynamic context augmentation for global entity linking,” in Proc. 2019 Conf. on Empirical Methods Natural Lang. Process. and the 9th Int. Joint Conf. Natural Lang. Process. (EMNLP-IJCNLP), Hong Kong, China, 2019, pp. 271–281. [Google Scholar]
96. Z. Chen, I. S. Möller, and L. Hennig, “Neural entity linking for company names,” M.S. thesis, TU, Berlin, Germany, 2019. [Google Scholar]
97. W. Ding, V. K. Chaudhri, N. Chittar, and C. Chen, “JEL: Applying end-to-end neural entity linking in JPMorgan chase,” in Proc. AAAI Conf. Artif. Intell., Los Angeles, CA, USA, 2021, pp. 15301–15308. [Google Scholar]
98. B. Yang and Y. Liao, “Research on enterprise risk knowledge graph based on multi-source data fusion,” Neural. Comput. Appl., vol. 34, no. 4, pp. 2569–2582, 2022. doi: 10.1007/s00521-021-05985-w. [Google Scholar] [CrossRef]
99. P. H. Martins, Z. Marinho, and A. F. T. Martins, “Joint learning of named entity recognition and entity linking,” in Proc. 57th Annual Meeting of the Association for Computational Linguistics:Student Research Workshop, Florence, Italy, 2019, pp. 190–196. [Google Scholar]
100. C. Ferri, J. Hernández-Orallo, and P. A. Flach, “A coherent interpretation of AUC as a measure of aggregated classification performance,” in Proc. 28th Int. Conf. Conf. Mach. Learn. (ICML–11), Bellevue, Washington, USA, 2011, pp. 657–664. [Google Scholar]
101. F. Fang, “A study of financial risks of listed manufacturing companies in China,” J. Financ. Risk. Manag., vol. 5, no. 4, pp. 229–245, 2016. doi: 10.4236/jfrm.2016.54022. [Google Scholar] [CrossRef]
102. N. Nigam, “Uncovering potential losses using knowledge graph embeddings and link prediction,” M.S. thesis, The Entrepreneurial University, Germany, 2022. [Google Scholar]
103. J. Zhang and Z. Song, “Research on knowledge graph for quantification of relationship between enterprises and recognition of potential risks,” in 2019 4th IEEE Int. Conf. Cybernet. (Cybconf), Beijing, China, 2019, pp. 1–5. [Google Scholar]
104. Y. Yang, Z. Wei, Q. Chen, and L. Wu, “Using external knowledge for financial event prediction based on graph neural networks,” in Proc. 28th ACM International Conf. Inf. Knowl. Manag., Birmingham, UK, 2019, pp. 2161–2164. [Google Scholar]
105. Y. Zheng, V. C. S. Lee, Z. Wu, and S. Pan, “Heterogeneous graph attention network for small and medium-sized enterprises bankruptcy prediction,” in Pacific-Asia Conf. on Knowl. Discovery Data Min., New York, NY, USA, 2021, pp. 140–151. [Google Scholar]
106. Y. Zhao et al., “Combining intra-risk and contagion risk for enterprise bankruptcy prediction using graph neural networks,” arXiv:2202.03874, 2022. [Google Scholar]
107. K. Zhu, Y. Xie, W. Wang, and G. Yan, “A method of evaluation for small and medium-sized enterprises,” in 2022 14th Int. Conf. Mach. Learn. Comput., Guangzhou, Guangdong, China, 2022, pp. 358–367. [Google Scholar]
108. E. E. Kosasih, F. Margaroli, S. Gelli, A. Aziz, N. Wildgoose and A. Brintrup, “Towards knowledge graph reasoning for supply chain risk management using graph neural networks,” Int. J. Prod. Res., no. 6, pp. 1–17, 2022. doi: 10.1080/00207543.2022.2100841. [Google Scholar] [CrossRef]
109. L. van Boxtel, “Supporting decision making in a complex supply chain environment using a virtual knowledge graph,” M.S. thesis, Eindhoven Univ. of Technology, Netherlands, 2020. [Google Scholar]
110. Y. Li et al., “Learning joint relational co-evolution in spatial-temporal knowledge graph for SMEs supply chain prediction,” in Proc. 29th ACM SIGKDD Conf. Conf. on Knowl. Discovery Data Min., New York, NY, USA, 2023, pp. 4426–4436. [Google Scholar]
111. W. Zhang, Y. Liu, L. Jiang, N. Shah, X. Fei and H. Cai, “The construction of a domain knowledge graph and its application in supply chain risk analysis,” in Advances in E-Bus Eng. Ubiquitous Comput., Shanghai, China, 2019, pp. 464–478. [Google Scholar]
112. Q. Zhang and W. Mu, “Research on search method of knowledge graph of supply chain risk based on cascading effect,” in 2021 3rd Int. Conf. Manag. Sci. Ind. Eng., Osaka, Japan, 2021, pp. 111–119. [Google Scholar]
113. W. Qin, X. Luo, and H. Wang, “Implicit business competitor inference using heterogeneous knowledge graph,” in 2021 IEEE Int. Conf. Big Knowl. (ICBK), Auckland, New Zealand, 2021, pp. 198–205. [Google Scholar]
114. Y. Zhang et al., “Company competition graph,” arXiv:2304.00323, 2023. [Google Scholar]
115. J. Li, Y. Sun, C. Li, Y. Hu, and C. Wang, “Industry chain graph building based on text semantic association mining,” in 2021 Int. Joint Conf. Neural Netw. (IJCNN), Shenzhen, China, 2021, pp. 1–8. [Google Scholar]
116. N. Ramzy, S. Auer, J. Chamanara, and H. Ehm, “KnowGraph-PM: A knowledge graph based pricing model for semiconductor supply chains,” in Int. Conf. Intell. Sci., 2021, pp. 61–75. [Google Scholar]
117. P. Luo, J. Chen, and J. Li, “Enterprise big data management based on knowledge graph,” in 2021 4th Int. Conf. Comput. and Big Data, Wuhan, Hubei, China, 2021, pp. 54–59. [Google Scholar]
118. Z. Ye and S. Ding, “Research on enterprise risk prediction path based on knowledge graph,” in 2023 3rd Int. Conf. Edu. Inform. Manag. Service Sci. (EIMSS 2023), Qingdao, Shandong, China, 2023, pp. 692–701. [Google Scholar]
119. Z. Liu, X. Zeng, and Z. Zhang, “Research on construction and analysis of financial emergencies knowledge graph with event logical for emergency management,” J. Inf. Res. Manage., vol. 12, no. 3, pp. 137–151, 2022. [Google Scholar]
120. Y. Song, “Construction of event knowledge graph based on semantic analysis,” Teh. Vjesn., vol. 28, no. 5, pp. 1640–1646, 2021. [Google Scholar]
121. J. Liu, Z. Lu, and W. Du, “Combining enterprise knowledge graph and news sentiment analysis for stock price prediction,” in Hawaii Int. Conf. Syst. Sci. 2019 (HICSS-52), Grand, Wailea, Hawaii, USA, 2019. [Google Scholar]
122. A. B. Altuner and Z. H. Kilimci, “A novel deep reinforcement learning based stock price prediction using knowledge graph and community aware sentiments,” Turk. J. Electr. Eng. Comp. Sci., vol. 30, no. 4, pp. 1506–1524, 2022. [Google Scholar]
123. Z. Zhang, Z. Liu, and F. Ma, “Enterprise risk identification for internet public opinion events—Based on KGANN model,” Front. Sci. Technol. Eng. Manag., vol. 41, no. 1, pp. 65–73, 2022. [Google Scholar]
124. G. Beydoun, H. Suryanto, C. Guan, and A. Guan, “Unlocking knowledge graphs (KG) potentials in support of credit risk assessment,” in Australasian Conf. on Inform. Syst., Wellington, New Zealand, 2020. [Google Scholar]
125. C. Hong, M. Tan, S. Wang, J. Wang, M. Li and J. Qiu, “Small and medium-sized enterprises credit risk assessment based on temporal knowledge graphs,” in 2021 IEEE 20th Int. Conf. Cogn. Inform. & Cogn. Comput. (ICCI* CC), Banff, AB, Canada, 2021, pp. 166–172. [Google Scholar]
126. S. Yang et al., “Financial risk analysis for SMEs with graph-based supply chain mining,” in Proc. Twenty-Ninth Int. Conf. on Int. Joint Conf. Artif. Intell., Yokohama, Japan, 2021, pp. 4661–4667. [Google Scholar]
127. C. Ma, H. Sun, S. Wang, S. Lu, and J. Li, “Bond default prediction based on deep learning and knowledge graph technology,” IEEE Access, vol. 9, pp. 12750–12761, 2021. [Google Scholar]
128. Y. Li, Z. Zhu, X. Guo, S. Li, Y. Yang and Y. Zhao, “HGV4Risk: Hierarchical global view-guided sequence representation learning for risk prediction,” Acm. Trans. Knowl. Discov. D., vol. 18, no. 1, pp. 1–21, 2023. [Google Scholar]
129. R. Mitra, A. Dongre, P. Dangare, A. Goswami, and M. K. Tiwari, “Knowledge graph driven credit risk assessment for micro, small and medium-sized enterprises,” Int. J. Prod. Res., vol. 9, no. 6, pp. 1–17, 2023. doi: 10.1080/00207543.2023.2257807. [Google Scholar] [CrossRef]
130. L. Song, H. Li, Y. Tan, Z. Li, and X. Shang, “Enhancing enterprise credit risk assessment with cascaded multi-level graph representation learning,” Neural Netw., vol. 169, no. 2, pp. 475–484, 2023. doi: 10.1016/j.neunet.2023.10.050. [Google Scholar] [PubMed] [CrossRef]
131. Y. Wang, J. Wang, J. Shang, Z. Chen, X. Ding and H. Wang, “Learning event logic graph knowledge for credit risk forecast,” in Softw. Eng. Knowl. Eng, USA, 2023. [Google Scholar]
132. M. N. Alam and M. M. Ali, “Loan default risk prediction using knowledge graph,” in 2022 14th Int. Conf. Knowl. Smart Technol. (KST), Thailand, 2022, pp. 34–39. [Google Scholar]
133. C. Xue, “The application of knowledge graph technology in commercial bank customer association risk early warning system,” in 2020 5th Int. Conf. Mech. Control Comput. Eng. (ICMCCE), Harbin, Heilongjiang, China, 2020, pp. 1083–1086. [Google Scholar]
134. Q. Zhan and H. Yin, “A loan application fraud detection method based on knowledge graph and neural network,” in Proc. 2nd Int. Conf. on Innov. Artif. Intell., Shanghai, China, 2018, pp. 111–115. [Google Scholar]
135. X. Mao, H. Sun, X. Zhu, and J. Li, “Financial fraud detection using the related-party transaction knowledge graph,” Procedia. Comput. Sci., vol. 199, no. 2, pp. 733–740, 2022. doi: 10.1016/j.procs.2022.01.091. [Google Scholar] [CrossRef]
136. S. Wen, J. Li, X. Zhu, and M. Liu, “Analysis of financial fraud based on manager knowledge graph,” Procedia. Comput. Sci., vol. 199, no. 2, pp. 773–779, 2022. doi: 10.1016/j.procs.2022.01.096. [Google Scholar] [CrossRef]
137. J. Li, Y. Chang, Y. Wang, and X. Zhu, “Tracking down financial statement fraud by analyzing the supplier-customer relationship network,” Comput. Ind. Eng., vol. 178, no. 1, pp. 109118, 2023. doi: 10.1016/j.cie.2023.109118. [Google Scholar] [CrossRef]
138. H. Wu, Y. Chang, J. Li, and X. Zhu, “Financial fraud risk analysis based on audit information knowledge graph,” Procedia. Comput. Sci., vol. 199, no. 2, pp. 780–787, 2022. doi: 10.1016/j.procs.2022.01.097. [Google Scholar] [CrossRef]
139. J. Zheng and Y. Li, “Machine learning model of tax arrears prediction based on knowledge graph,” Electron. Res. Arch., vol. 31, no. 7, pp. 4057–4076, 2023. doi: 10.3934/era.2023206. [Google Scholar] [CrossRef]
140. M. Y. Day, “Artificial intelligence for knowledge graphs of cryptocurrency anti-money laundering in fintech,” in Proc. 2021 IEEE/ACM Int. Conf. Advan. Soc. Netw. Anal. Min., New York, NY, USA, 2021, pp. 439–446. [Google Scholar]
141. E. Laurenza, L. Bellomarini, and E. Sallinger, “Rule-based anti-money laundering in financial intelligence units: Experience and vision,” in Proc. 4th Int. Joint Conf. Rules Reasoning, Oslo, Norway, 2020, pp. 102–122. [Google Scholar]
142. T. Ruan, L. Xue, H. Wang, F. Hu, L. Zhao and J. Ding, “Building and exploring an enterprise knowledge graph for investment analysis,” in The Semantic Web-ISWC 2016: 15th Int. Semantic Web Conf., Kobe, Japan, 2016, pp. 418–436. [Google Scholar]
143. X. Ouyang, L. Hong, and L. Zhang, “Query associations over big financial knowledge graph,” in Big Scientif. Data Manag.: First Int. Conf., Beijing, China, 2019, pp. 199–211. [Google Scholar]
144. H. K. Lv, L. Hong, and F. C. Ma, “Constructing knowledge graph for financial equities,” Data Anal. Knowl. Discov., vol. 4, no. 5, pp. 27–37, 2020. [Google Scholar]
145. L. Bellomarini et al., “Reasoning on company takeovers during the COVID-19 crisis with knowledge graphs,” in RuleML+RR (Supplement), Leuven, Belgium, 2020, pp. 145–146. [Google Scholar]
146. M. Dong, C. Pan, and Z. Luo, “MapRE: An effective semantic mapping approach for low-resource relation extraction,” in Proc. 2021 Conf. on Emp. Methods in Natural Lang. Process., 2021, pp. 2694–2704. [Google Scholar]
147. B. Singh, P. Kandru, A. Sharma, and V. Varma, “Massively multilingual language models for cross lingual fact extraction from low resource indian languages,” arXiv:2302.04790, 2023. [Google Scholar]
148. A. Hazem, M. Bouhandi, F. Boudin, and B. Daille, “Cross-lingual and cross-domain transfer learning for automatic term extraction from low resource data,” in Proc. Thirteenth Lang. Resour. Eval. Conf., Marseille, France, 2022, pp. 648–662. [Google Scholar]
149. N. Wang, T. Chen, C. Ren, and H. Wang, “Document-level relation extraction with multi-layer heterogeneous graph attention network,” Eng. Appl. Artif. Intel., vol. 123, no. 4, pp. 106212, 2023. doi: 10.1016/j.engappai.2023.106212. [Google Scholar] [CrossRef]
150. Z. Jiang and F. Kong, “PairEE: A novel pairing-scoring approach for better overlapping event extraction,” in Int. Conf. on Artif. Neural Netw., Heraklion, Greece, 2023, pp. 128–139. [Google Scholar]
151. X. Wang, L. Meng, X. Wang, and Q. Wang, “The construction of environmental-policy-enterprise knowledge graph based on PTA model and PSA model,” Resour. Conserv. Recycl. Adv., vol. 12, pp. 200057, 2021. [Google Scholar]
152. H. Xia, Y. Wang, J. Gauthier, and J. Z. Zhang, “Knowledge graph of mobile payment platforms based on deep learning: Risk analysis and policy implications,” Expert. Syst. Appl., vol. 208, pp. 118143, 2022. [Google Scholar]
153. J. Lai et al., “Visual supervision of large-scope heat source factories based on knowledge graph,” T. Gis., vol. 27, no. 2, pp. 408–424, 2023. [Google Scholar]
154. Y. Li, S. Sun, and J. Zhao, “TiRGN: Time-guided recurrent graph network with local-global historical patterns for temporal knowledge graph reasoning,” in Proc. Thirty-First Int. Joint Conf. Artif. Intell., IJCAI 2022, Vienna, Austria, 2022, pp. 2152–2158. [Google Scholar]
155. K. Liu, F. Zhao, G. Xu, X. Wang, and H. Jin, “RETIA: Relation-entity twin-interact aggregation for temporal knowledge graph extrapolation,” in IEEE Int. Conf. Data Eng., Anaheim, USA, 2023. [Google Scholar]
156. A. Khemiri, A. Drissi, A. Tissaoui, S. Sassi, and R. Chbeir, “Learn2Construct: An automatic ontology construction based on LDA from texual data,” in Proc. 13th Int. Conf. Manag. Digital EcoSyst., New York, NY, USA, 2021, pp. 49–56. [Google Scholar]
157. L. Bellomarini, D. Benedetto, G. Gottlob, and E. Sallinger, “Vadalog: A modern architecture for automated reasoning with large knowledge graphs,” Inform. Syst., vol. 105, pp. 101528, 2022. [Google Scholar]
Cite This Article
 Copyright © 2024 The Author(s). Published by Tech Science Press.
This work is licensed under a Creative Commons Attribution 4.0 International License , which permits unrestricted use, distribution, and reproduction in any medium, provided the original work is properly cited.
 Downloads
 Citation Tools