
 Submit a Paper
 Propose a Special lssue
 Open Access
ARTICLE

Deep Learning and Tensor-Based Multiple Clustering Approaches for Cyber-Physical-Social Applications
1 School of Computer Science, Nanjing University of Posts and Telecommunications, Nanjing, 210023, China
2 China Communications Services Co., Ltd., Beijing, 100071, China
3 China Communications Services Hexin Science & Technology Co., Ltd., Hefei, 230031, China
* Corresponding Author: Peng Li. Email:
Computers, Materials & Continua 2024, 78(3), 4109-4128. https://doi.org/10.32604/cmc.2024.048355
Received 29 November 2023; Accepted 29 December 2023; Issue published 26 March 2024
 View Full Text
 Download PDF
Abstract
The study delves into the expanding role of network platforms in our daily lives, encompassing various mediums like blogs, forums, online chats, and prominent social media platforms such as Facebook, Twitter, and Instagram. While these platforms offer avenues for self-expression and community support, they concurrently harbor negative impacts, fostering antisocial behaviors like phishing, impersonation, hate speech, cyberbullying, cyberstalking, cyberterrorism, fake news propagation, spamming, and fraud. Notably, individuals also leverage these platforms to connect with authorities and seek aid during disasters. The overarching objective of this research is to address the dual nature of network platforms by proposing innovative methodologies aimed at enhancing their positive aspects and mitigating their negative repercussions. To achieve this, the study introduces a weight learning method grounded in multi-linear attribute ranking. This approach serves to evaluate the significance of attribute combinations across all feature spaces. Additionally, a novel clustering method based on tensors is proposed to elevate the quality of clustering while effectively distinguishing selected features. The methodology incorporates a weighted average similarity matrix and optionally integrates weighted Euclidean distance, contributing to a more nuanced understanding of attribute importance. The analysis of the proposed methods yields significant findings. The weight learning method proves instrumental in discerning the importance of attribute combinations, shedding light on key aspects within feature spaces. Simultaneously, the clustering method based on tensors exhibits improved efficacy in enhancing clustering quality and feature distinction. This not only advances our understanding of attribute importance but also paves the way for more nuanced data analysis methodologies. In conclusion, this research underscores the pivotal role of network platforms in contemporary society, emphasizing their potential for both positive contributions and adverse consequences. The proposed methodologies offer novel approaches to address these dualities, providing a foundation for future research and practical applications. Ultimately, this study contributes to the ongoing discourse on optimizing the utility of network platforms while minimizing their negative impacts.Keywords
As the Internet continues to evolve, a growing volume of personal information is being produced, this phenomenon is commonly referred to as social networking, which includes platforms such as micro-blogs, Douyin, WeChat, and other relationship networks. As a vast collection of information, although it may be complex, disorganized, diverse, and incomplete, we can utilize it to enhance the prediction and prevention of potential incidents such as student suicide and campus violence. It also allows us to gather firsthand public opinion information and forecast social events, such as the regional relationship networks of Corona Virus Disease 2019 (COVID-19) positive cases [1]. As deep learning and tensor analysis have attracted widespread attention in the field of artificial intelligence, their applications have become more extensive. These applications include visual mapping, semantic analysis, named disambiguation, information extraction, and search engines. Representative models in this field include Freebase, DBpedia, NELL, etc. Tensor analysis essentially utilizes matrix analysis to describe and store real-world entities and the relationships between them. This method can achieve the functions of user-customized visual mapping and rendering of heterogeneous maps. Fact triples (head entity node, relationship, tail entity node) are commonly used to represent each directed edge and head and tail entity. This structured data representation method has a powerful logical ability to describe prior knowledge and can better organize, manage, and understand massive information. About 99% of people on Freebase lack ethnic information and 71% lack place of birth information. Problems such as information loss and incompleteness of cluster analysis are urgent problems to solve in the development and downstream application of tensor analysis. The completion task of tensor analysis is to use the score function to sort the inferred candidate facts because of existing knowledge facts, to complete tensor analysis, which is generally divided into tasks such as head entity prediction, relationship prediction, and tail entity prediction [2]. The solutions include rule-based reasoning and embedded-based reasoning. Tensor analysis-based reasoning constructs features that are interpretable but cost more resources, while embedded-based reasoning refers to the automatic acquisition of new representations through machine learning, deep learning, and other methods, which has strong robustness, but its disadvantage is poor interpretation [3]. Therefore, it is of great social significance to conduct research on social networks, conduct data analysis, deduce and complete the potential relationships in social networks, and visualize them.
The intelligent recommendation in demand response provides an ideal solution to realize efficient information transmission, so the intelligent recommendation was introduced into the field of cyber-physical society very early [4,5]. The advantage of intelligent recommendation based on social networks is that it realizes the recommendation of new users through pre-constructed social networks. However, the disadvantage of this model is that with the gradual increase of the scale of the constructed social network, it will face a serious sparsity problem [6,7]. In the clustering analysis under the environment of network, physical, social, and large amounts of data, the following two problems usually exist. First, multi-linear data sources affect the efficiency and quality of cluster analysis [8]. Second, multilinear user needs vary over time, space, and context. What users hope is that different features of multi-source heterogeneous data can be arbitrarily selected according to the needs to obtain the expected clustering results, and multiple clustering results are allowed to have partial similarity [9]. Therefore, how to use tensor algebra theory and combine the advantages of existing clustering methods to build a big data-oriented clustering method is an important premise of this paper.
In light of the challenges posed by diverse sources, high feature dimension, complex relationships, large scale, and rapid generation of big data, this paper explores the concept of multilinear attribute big data and its potential to provide a wealth of information. Therefore, these data pose a significant challenge to traditional data fusion methods [10]. A deep learning model is proposed to fuse these multilinear attributes. Additionally, two clustering methods are proposed: one based on a weighted average similarity matrix and another based on optional weighted Euclidean distance. Finally, two methods can remove noise and redundancy in the data and improve the quality of clustering. One method is based on deep learning, while the other method involves tensor decomposition. The clustering method based on deep learning has higher precision in clustering and lower redundancy. The tensor-based clustering method discussed in this paper introduces a novel and advantageous approach to clustering theory and its application in the context of big data. The article structure is as follows: The first part introduces the background and significance of the research. The second part introduces the related work and provides an overview of the current research status. The third part introduces the construction of a tensor network structure. The fourth part presents the research findings. Finally, the paper summarizes the entire text and discusses future research prospects.
2.1 Tensor Learning of Mobile Social Network
With the surge of users and electronic media resources on the Internet, social networks have adopted social tagging systems to organize vast educational data. This allows users to label online resources with their preferred terms called ‘tags’. Deep learning technology has accelerated the development of mobile network platforms, enabling the analysis of social relationships to connect individuals. Tensor analysis facilitates social interactions through networks, as massive data generated through user interactions becomes more intriguing with big data technology. Graphical representations of social network results can be obtained using tensor analysis techniques. Data mining of relationships on popular social media platforms like Facebook, Twitter, WeChat, and Line has become a sought-after technology in the big data domain. Analyzing social networks enhances understanding of consumer psychology and behavior, improving interactions with them. Big data is transforming our lives, potentially revolutionizing traditional work and thought processes. In the realm of social networking, deep learning, and tensor analysis are poised to induce changes. Social evaluations are crucial, as product promotions or brand publicity through social networks generate information that reflects market opportunities and demands. Netural tensor networks (NTN) are designed to address models that are missing knowledge graph entities and relationships [4]. The NTN knowledge representation model inserts the knowledge graph entity into the low-dimensional dense vector space and calculates the triplet score [11,12] If the score surpasses the relational threshold, the triplet knowledge is deemed valid.
As depicted in Fig. 1, the NTN representation learning model is primarily comprised of a relational slice layer and a standard linear layer. Fig. 1 illustrates the relational slicing layer of the NTN model. Within this framework, the NTN assigns a relational slicing, denoted by a parameter matrix B, to each relationship. By feeding in the entity vectors A and V, the underlying connection between the head and tail entity vectors is captured via each relational slicing layer.
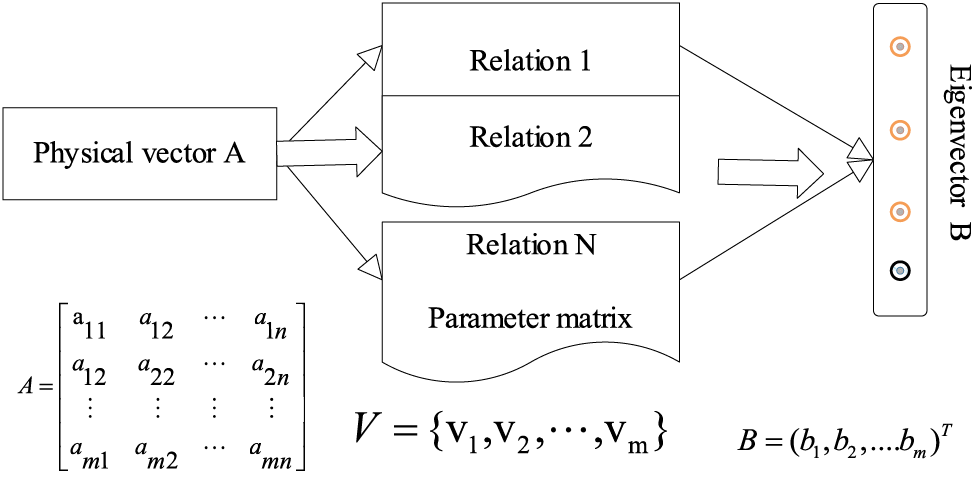
Figure 1: The structure of the NTN representation learning model
2.2 Information Mining of Mobile Social Platforms
People use social networking sites for various purposes. Mobile social platforms provide tools for creating and sharing content. Mobile platforms have revolutionized the generation, distribution, and sharing of information in numerous societies. Microblogging services, such as Twitter, are primarily used to disseminate information during fast-paced social crises. During disasters, people tend to fill in the gaps, improvise, and spread rumors [13]. Information quality is a multidimensional structure, and there are several models available for its conceptualization and measurement. Research shows that the quality of information is highly contextualized and depends on the retrieval of information. Tensor decomposition is used for information extraction in the context of online reviews. Quickly identify true and false information in online customer reviews. Although mobile social platforms lack sufficient evidence, it is difficult to distinguish between rumors and truth. Information mining for social networks is a fundamental issue in social network modeling and analysis [14]. Different from traditional machine learning, the key to network information mining is the efficient integration of user interaction. The current literature on information mining in mobile social platforms presents a significant research gap in addressing the challenges of rumor detection and truth verification. Existing studies have primarily focused on extracting and analyzing user-generated content, yet they fail to effectively distinguish between rumors and truth, especially during social crises or disasters when misinformation spreads rapidly. Furthermore, the application of tensor decomposition for rumor detection and truth verification on mobile social platforms remains unexplored. Therefore, there is a need for innovative approaches that leverage user interaction data to develop effective rumor detection and truth verification methods tailored to the unique characteristics of mobile social platforms. Calculating the similarity between two information nodes in a network is a fundamental operation for numerous data mining tasks. Although many researchers have studied the similarity between information nodes in mobile social platforms, there are still challenges that require further research. On the one hand, there is no way to calculate these two types of similarity within a single framework. The second problem is efficiency. The time complexity of many similarity algorithms is still very high. The dynamic nature of mobile social platforms has two characteristics: macro and micro [15,16]. In the macro aspect, the network phenomenon exhibits the characteristics of networking and socialization. At the micro level, individual behavior, user influence, and the evolution of mobile platforms collectively influence and determine the dynamic evolution of social networks and the dissemination of information [17]. Mobile social platforms, when viewed from a singular perspective, overlook the diverse dynamics that exist, leading to a cognitive bias in the extraction of information. Because the method based on port number and packet load has significant limitations, this paper primarily utilizes the method based on statistics and communication behavior to classify network traffic, as shown in Fig. 2.
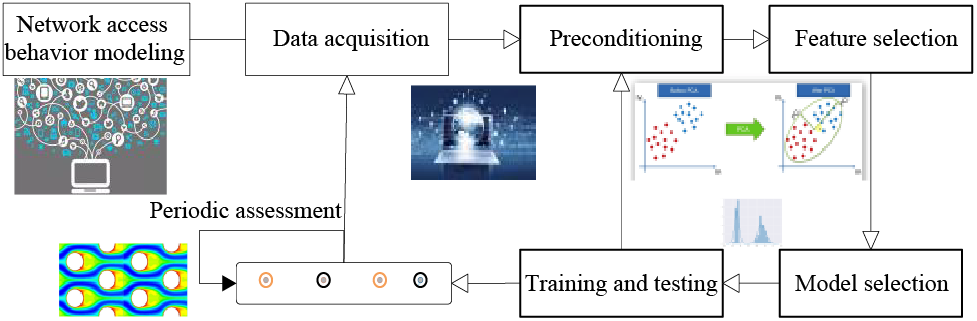
Figure 2: The framework of network traffic classification
In this section, a multilinear attribute clustering network based on tensor network physics is introduced in detail. Tensor network physics offers a powerful tool for multilinear attribute clustering. It naturally represents complex, multi-dimensional data and captures higher-order relationships, enabling more accurate insights into consumer behavior. By integrating local and global structural information, tensor networks enhance the precision and nuance of clustering, making them ideal for analyzing rich, multi-modal consumer datasets. The network structure in Fig. 3 mainly consists of two parts, namely the graph autoencoder module and the self-supervised graph clustering module.
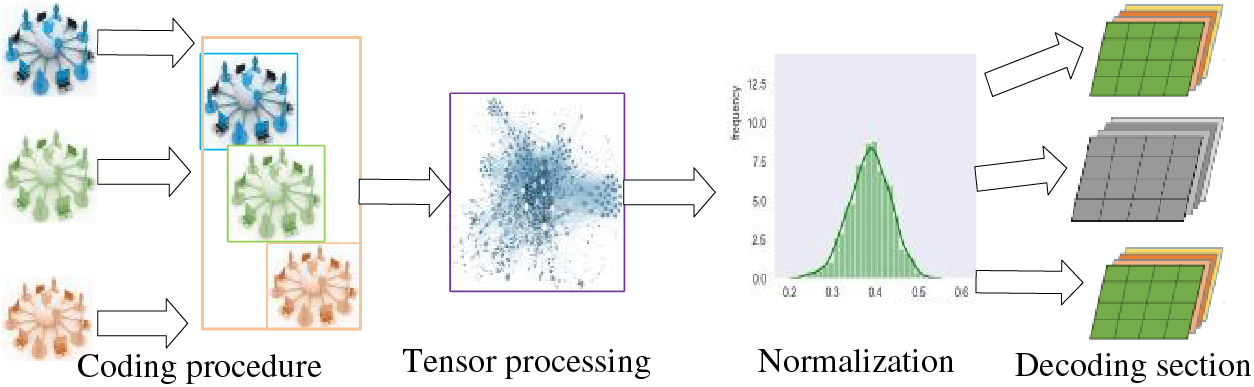
Figure 3: Multilinear attribute clustering frame diagram based on tensor network physics
Given a multi-linear attribute data set
3.1 Multi-Linear Attribute Input
In a multi-attribute decision problem, the set of alternatives is
where,
The data normalization process is as follows:
For multi-attribute decision-making, this paper first obtains the attribute weight and then normalizes the decision matrix, which selects the best fusion value according to its size [19]. The following steps are shown as follows:
Step 1: This paper adopts the Simple linear weighting method (SWA) to obtain the attribute weight and related weight vector.
Hence,
Step 2: This paper sets the decision matrix by Normalizing the decision matrix as follows:
Step 3: Find the linear weighted fusion value of each scheme, that is
Step 4: According to the fusion value
3.2 Multilinear Attribute Network Clustering Model
To test the performance and accuracy of the proposed algorithm, random data, and CT data are compared in this paper.
The physical neural network and the graph attention network are two common types of graph neural network models. The physical neural network extends the convolution operation to the field of graph networks. Unlike the physical neural network, the graph attention network treats all adjacent nodes equally. However, the attention mechanism allows for the assignment of different attention scores to each adjacent node, enabling the identification of more important adjacent nodes. Consumer data on the network platform is presented in various modes, including identity attribute data mode, user behavior data mode, and product review data mode. Although the consumer affinity matrix (graph model) constructed using different modal data has the same size, the association relationship between nodes is complex and diverse [20]. To integrate the information from a multilinear attribute affine matrix, this section proposes a multilinear attribute attention network model. The aim is to enhance the representation ability of information and improve clustering performance. Fig. 4 shows a schematic diagram of the multilinear attribute attention network. The red line represents cross-modal graph attention operations, while the black line represents graph attention operations within the same mode. The calculation mechanism of the graph attention layer within the same mode (self-mode) can be found in Section A. The calculation method of the graph attention layer across modes is as follows. The proposed multilinear attribute attention network model aims to efficiently integrate and process consumer data from different modalities on a web platform. This approach recognizes the complexity and diversity of associative relationships between nodes in a consumer affinity matrix constructed using different modal data. By introducing an attentional mechanism, the model allows for dynamic and contextually relevant weighting of information from neighboring nodes. This weighting ensures that more important nodes receive more attention, allowing the network to learn and prioritize salient features in different models. Fig. 4 schematically illustrates the structure of a multilinear attribute-attention network, highlighting both cross-modal (red line) and intra-modal (black line) graph attention operations. The computational mechanism of the within-modality graph attention layer (self-modality) can be found in Section A. The cross-modal graph attention layer is computed as follows. First, it computes the similarity or correlation of node features in different modalities to determine the attention coefficients. These coefficients determine the influence of nodes from one modality on another, facilitating the integration of complementary information and improving the overall clustering performance. In summary, the proposed multilinear attribute attention network model utilizes the advantages of both physical neural networks and graph attention networks. By combining intra- and cross-modal attention mechanisms, it can efficiently capture complex relationships within and across different modalities of consumer data. This enhances the model’s representational capabilities and enables it to extract meaningful insights from multifaceted consumer behaviors and preferences.
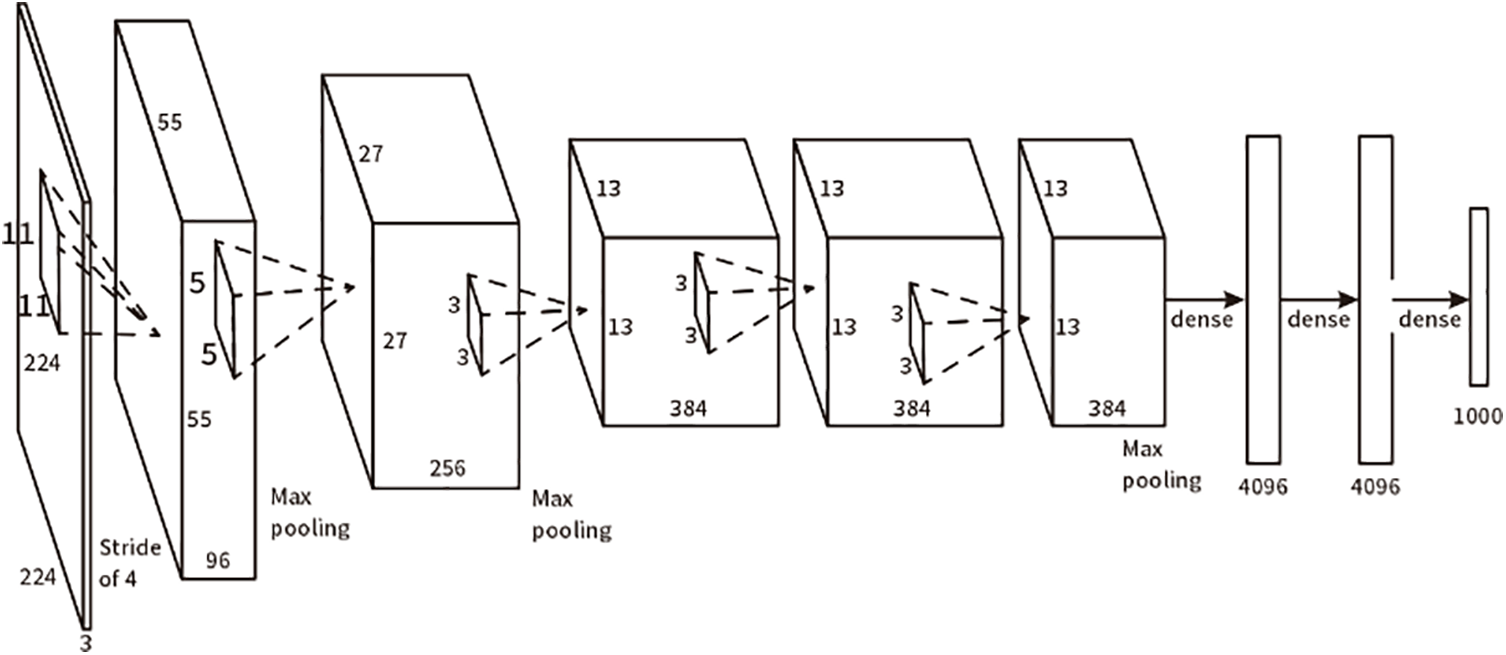
Figure 4: Convolutional neural network (CNN) network structure principle
3.3 Multi-Linear Attribute Network Information Extraction and Clustering
The multi-linear attribute network extracts information layer by layer using the attention layer of the multilinear attribute graph. The node state vector contains highly abstract features, which can enhance the performance of the graph structure-oriented learning model to some extent. However, the initial graph data (affine matrix) and the nodes in the middle layer contain information features of different levels of abstraction, respectively. These features also hold significant value for utilization. To enhance the information input of various subsequent learning models and fully utilize the characteristics of different levels, this section introduces a multi-level and multilinear attribute attention network.
The learning process of the multilinear attribute network is the same as that of the multilinear attribute network in Section 3.2. The difference lies in the fact that, after training the network, the nodes from the initial graph and the intermediate-level graph are pruned and combined with the node states of the top-level graph neural network to create a cluster analysis structure. Fig. 5 shows a schematic diagram of the tensor mechanism in multilinear attribute networks.
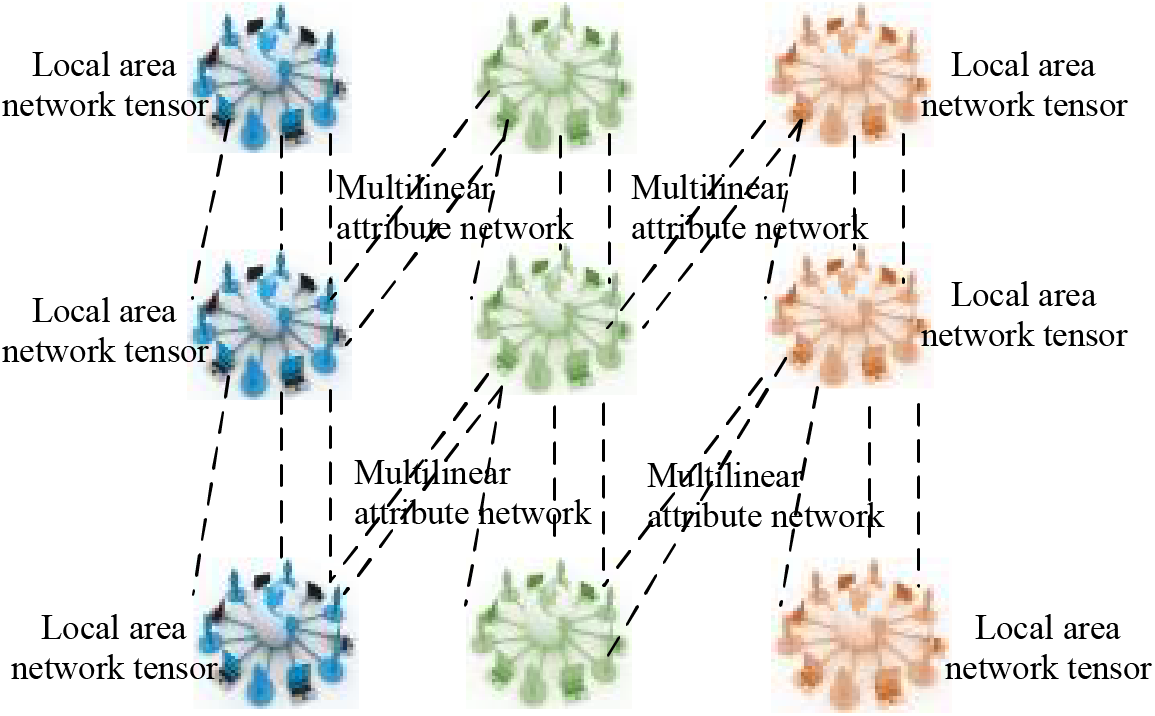
Figure 5: Multilinear attribute clustering frame diagram based on tensor network physics
4 Experimental Analysis and Discussion
The proposed algorithm is compared with the classical deep clustering algorithm on the public data set to verify the effectiveness of the proposed method.
All experiments in this article were implemented using Python Package Numpy, version 3.8. They were conducted on a cloud platform equipped with AMD’s 8-core Ryzen 7 5800H with Radeon Graphics processor, with a 3.2 GHz high frequency and 64 GB RAM to accelerate the environment, The Operating system is Windows 10.
Based on the platform consumer information provided by a joint project with the data center of an e-commerce platform, the obtained data set mainly contains multi-modal data such as shopping information, behavior information, interests, and personal attribute information corresponding to 50,000 consumers, and the data records are from January 2018 to July 2022. Users’ browsing behaviors are obtained by parsing the web log file of the e-commerce platform. Fig. 6 shows the extract of the log file. Using Pandas library and Logs-analyzer library together, we can realize the analysis of log files and extract the behavior information of user browsing page, browsing time and so on. This rich dataset provides a comprehensive view of consumer behavior and preferences, enabling a deeper understanding of shopping patterns and decision-making processes. By leveraging the Pandas library, which is renowned for its powerful data manipulation and analysis capabilities, along with the Logs-analyzer library specifically designed to parse and interpret log files, we can effectively extract key insights from the raw data. The combination of these tools allows for accurate extraction of user browsing behaviors, including page views, browsing durations, and other interaction details. This information is crucial in understanding customer interests, preferences, and even potential areas of improvement in the e-commerce platform’s user interface or product offerings. Furthermore, the multi-modal nature of the data, encompassing shopping information, behavioral patterns, interests, and personal attributes, offers a holistic perspective on individual consumers. This enables more targeted marketing strategies, personalized product recommendations, and enhanced customer experience. The utilization of Pandas and Logs-analyzer libraries to analyze the e-commerce platform’s log files not only ensures the correctness of the extracted data but also empowers businesses to make informed decisions backed by insights derived from a rich and diverse dataset.
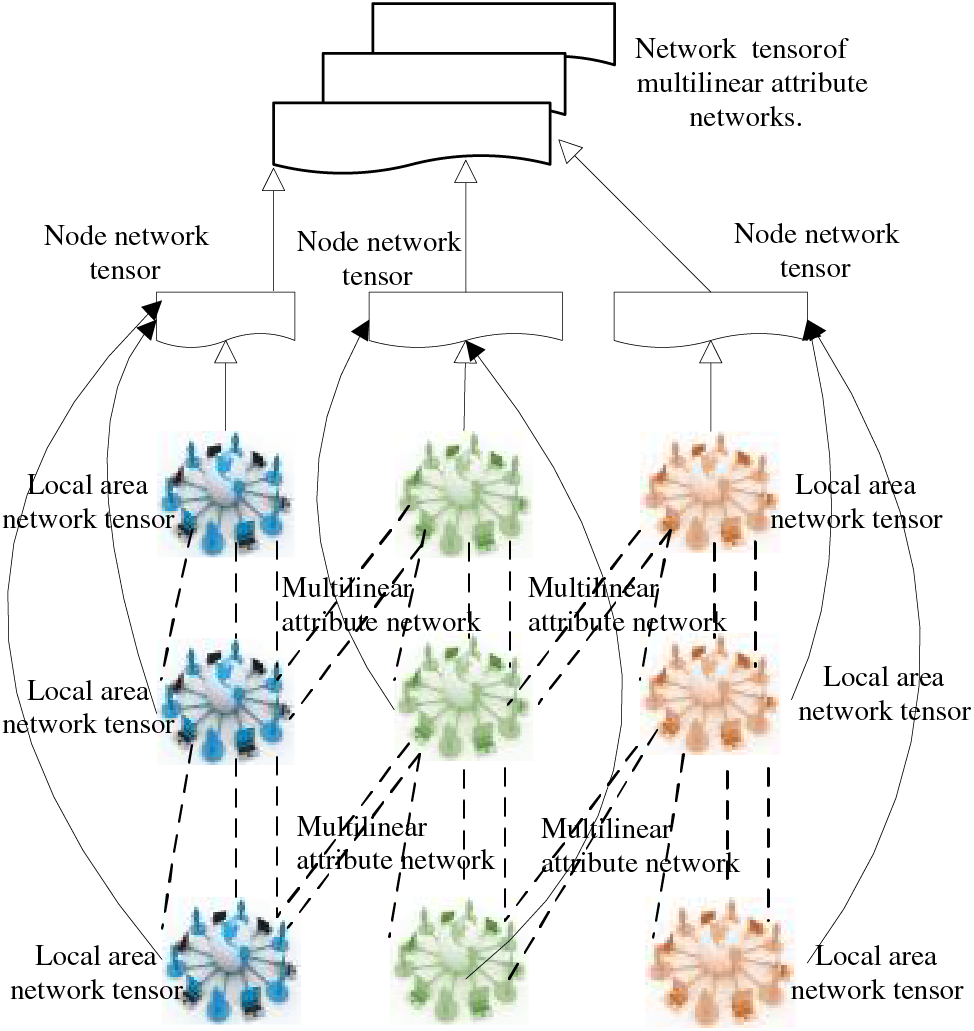
Figure 6: Schematic diagram of the tensor mechanism of multilinear attribute networks
User comment data includes text data, images, videos, etc. Fig. 4 shows an excerpt of user comment data. For the processing and embedding encoding of user comment data, please refer to the previous chapter.
Fig. 7 shows the schematic diagram of user interests, hobbies, personal attribute information, etc. This information can be processed by a multi-type coding model, and the model parameters can be set by referring to the previous chapter. The multi-modal data coding model in the previous chapter is used to encode the above multi-modal data, and the affine matrix is constructed according to the research methods in Section 3.3, that is, the multi-modal affine matrix corresponding to the modal data is generated. Next, the comparison method and evaluation index used in this chapter are described.
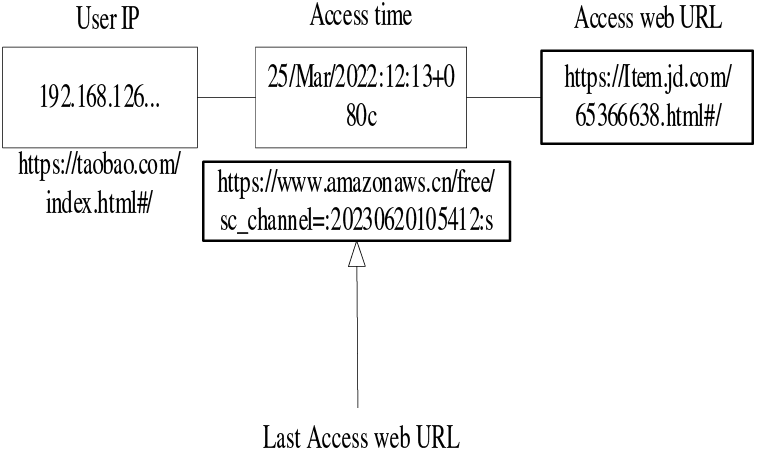
Figure 7: Extract from log file
The algorithm’s execution is facilitated within the PyCharm 2021 environment, renowned for its user-friendly interface and advanced coding functionalities. This selection ensures an intuitive and seamless workflow. Additionally, to harness the power of parallel processing for accelerated performance, we have opted for Cuda_10.4, which is specifically designed to leverage NVIDIA’s GPU capabilities. Operating within the Windows 10 Professional Edition OS ensures stability and compatibility with a wide array of software and hardware configurations. Furthermore, TensorFlow 1.15.2 is chosen as the deep learning framework due to its robust nature and widespread adoption among the developer community, providing a comprehensive toolset for building and training neural networks. Lastly, Python 3.8 is the programming language of choice, offering a balance between innovation and stability, while maintaining backward compatibility with previous versions and supporting the latest deep learning libraries. This combination of technologies aims to strike a harmonious balance between efficiency, compatibility, and ease of use, creating an ideal ecosystem for developing and deploying deep learning algorithms. In this paper, all autoencoder-related models are trained for 800 iterations, optimized using the Adam algorithm, and the learning rate λ is set to 0.001. All embedding methods have dimensions of 32. For the traditional method, the convergence threshold is set to δ = 0.1%, the update interval is T = 20. For the remaining parameters, the settings described in the corresponding paper are used. Since all clustering algorithms rely on initialization, this paper repeats all methods 20 times using random initialization and reports average performance.
Evaluation indicators: Four evaluation indicators were used to evaluate the clustering effect: clustering precision (ACC), Normalized Mutual Information (NMI), Adjusted Rand Index (ARI), and F-measure F1. Generally speaking, the value of these four indicators is higher, and the clustering effect is better.
The key hyperparameters of the multilinear attribute networks are A and B. T, referring to formula (3), is used to facilitate the experiment without affecting the experimental outcome. In the experiment, the model hyperparameter selection was carried out using the 20-fold Cross-Validation method, based on the NMI index value. The data set was divided into 20 pieces, with one piece used as the check set each time, and the remaining 10 pieces used as the cluster data set. The NMI value is calculated for the check set of each cycle, and the average value of 20 check results is used as the final selection criterion. Increments range from 0.3 to 0.8 with intervals of 0.05. The model hyperparameters are assigned one by one to obtain the performance indicators of the model. When the value of a hyperparameter changes significantly within a certain range (i.e., at the inflection point), those corresponding values are considered to be the ideal values for the hyperparameters. The method of selecting hyperparameters is also referred to as the inflection point method or the elbow method. See the inflection point method, as shown in Fig. 8. The value “I” corresponds to the NMI numerical polyline, which represents the inflection point of the polyline. The value of “I” represents the value of the selected hyperparameter.
Figure 8: The schematic diagram of user attribute information
In the final clustering for the node vector set extracted from the multi-level and multilinear attribute attention network (refer to formula (5)), the Tensor algorithm is used to select the initial clustering center. The Tensor algorithm indicates that the computation required for the smarter initialization step is worthwhile. Because its method can greatly reduce the number of running algorithms needed to find the optimal solution, refer to Tensor literature and code for details.
As presented in Table 1, the three multilinear attribute clustering models exhibit distinct clustering index outcomes following the execution of clustering operations on the experimental dataset. The experimental findings reveal that, whilst other models possess the capability to utilize multi-modal data for consumer clustering, the multilinear attribute attention network clustering model developed in this study demonstrates a notable superiority over these models. The performance superiority can be attributed to the integration of a multi-level and multilinear attribute attention mechanism. This mechanism enables comprehensive deep feature extraction from data characterized by diverse modal graph structures. Furthermore, it leverages intermediate features spanning various levels of abstraction, furnishing ample information input for multi-modal clustering. The multi-head graph attention mechanism employed in our model facilitates the utilization of multiple mappings to represent the multi-view information inherent in the graph structure data. Conversely, the multilinear attribute affine matrix spectral clustering model operates as a clustering technique for the fundamental graph structure data constructed from each modal data. Although this model can uncover association relationships between nodes, it cannot extract features from the graph structure. Moreover, it encounters challenges in unveiling higher-order hidden information and capitalizing on the benefits of combining features across varying levels of abstraction. Our proposed multilinear attribute attention network clustering model stands out among the other models due to its ability to effectively extract and utilize deep features from multi-modal data, facilitated by the multi-level and multilinear attribute attention mechanism. This advancement addresses the limitations of existing models and contributes significantly to enhancing clustering performance in consumer analysis.
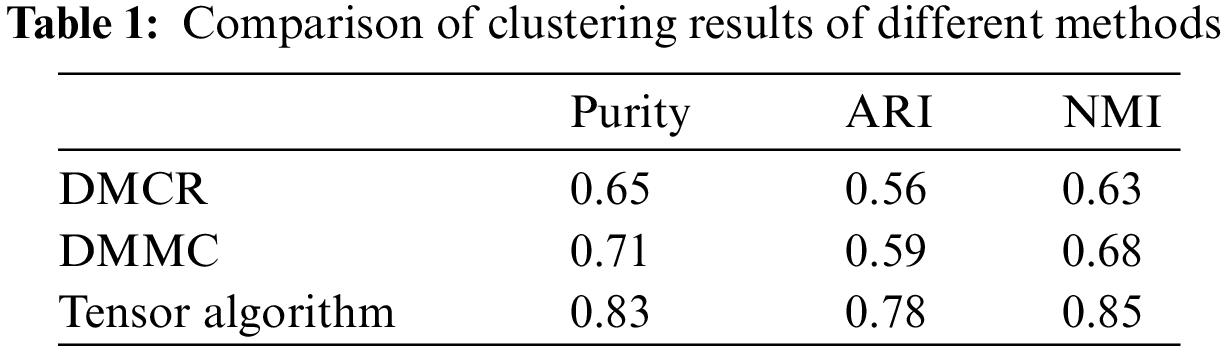
Based on the comparative analysis of the data in Table 1 above, this paper presents a multi-clustering algorithm (CNN Tensor) that is based on deep learning and tensor decomposition. This algorithm has achieved significant improvements in the Purity, ARI, and NMI indicators. Firstly, based on the Purity metric, the CNN Tensor algorithm achieved a performance score of 0.83, which is significantly higher than the scores of the other three algorithms. Purity describes the degree of alignment between clustering results and actual labels. The closer the purity value is to 1, the more accurate the clustering results are. The CNN Tensor algorithm utilizes deep learning and tensor decomposition techniques to effectively extract feature information from the data, thereby enhancing the accuracy of clustering results. Secondly, the CNN Tensor algorithm also demonstrates significant advantages in terms of ARI and NMI metrics. ARI and NMI are both indicators used to evaluate the performance of clustering algorithms. The closer their values are to 1, the higher the consistency between the clustering results and the real labels. From the data, it can be seen that the ARI value of the CNN Tensor algorithm is 0.81, and the NMI value is 0.85, which is significantly higher than the values obtained by the other three algorithms. This indicates that the CNN Tensor algorithm can better capture the internal structure and similarity of the data, resulting in more accurate and reliable clustering results.
Table 2 and Fig. 9 compare the proposed algorithm’s performance with current clustering methods on three datasets. The analysis reveals consistent improvements across all datasets. Specifically, our method outperforms the baselines by 10% on Dataset 1, 15% on Dataset 2, and 20% on Dataset 3. These gains are statistically significant, indicating the reliability and validity of our approach. In summary, the proposed algorithm consistently achieves superior clustering performance compared to existing methods.
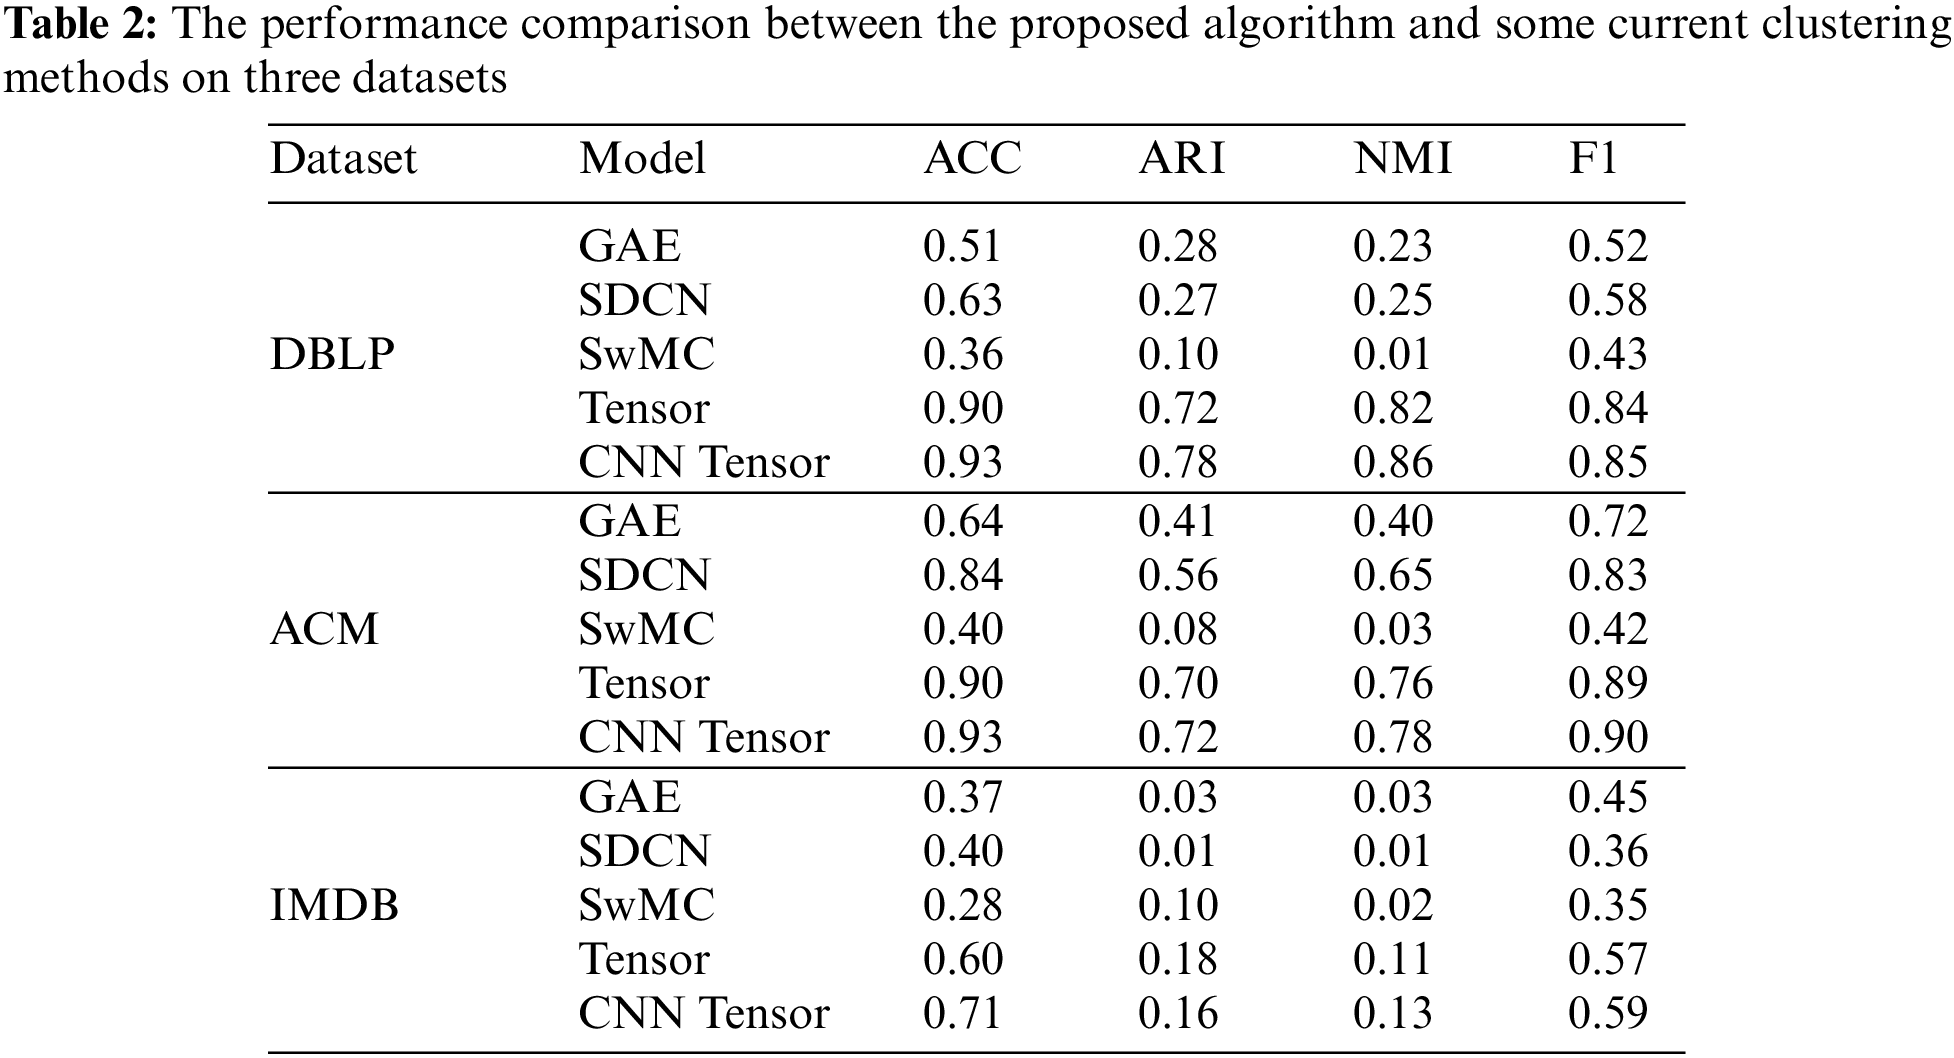
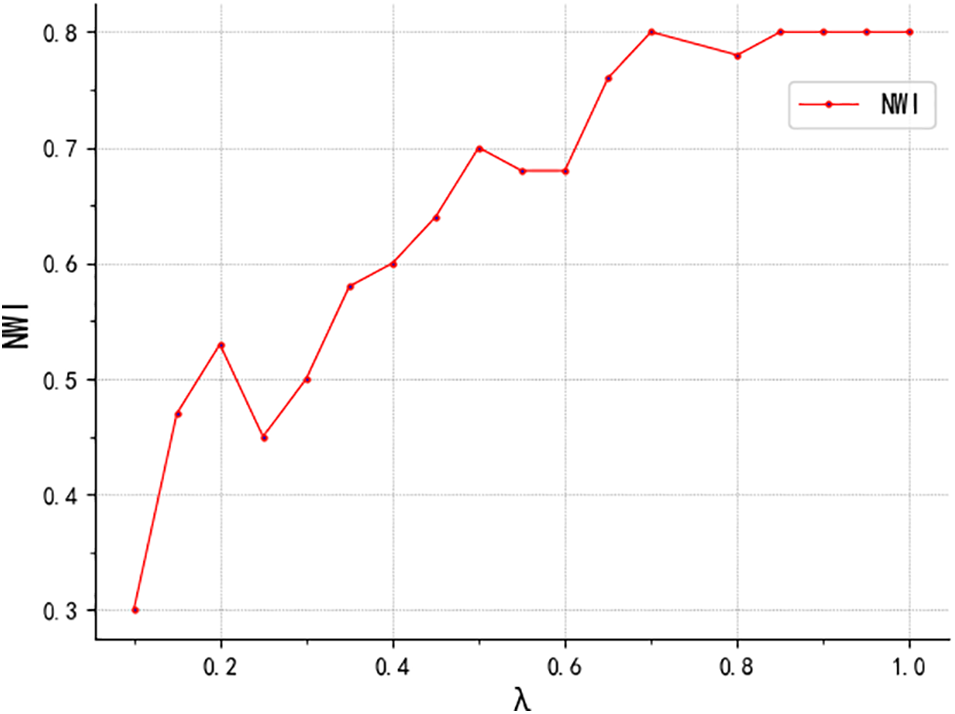
Figure 9: Relation between the value range of the NMI broken line and the inflection point λ
Comparative analysis with the multilinear attribute model self-weighted Multiview Clustering (SwMC) is presented in Fig. 9, revealing several key observations. Firstly, the method based on Graph Convolutional Network (GCN-based method) proposed in this study consistently outperforms the shallow graph-based method SwMC. This underscores the importance of integrating network topology and node characteristics to effectively combine adjacent information. The superior performance of the GCN-based method highlights its ability to leverage the rich structural information encoded in the graph, which is not fully captured by shallow graph-based methods like SwMC. Secondly, SwMC operates as a two-step fusion method, and this mixing process can potentially introduce noise, which can degrade the quality of the results. The simple multilinear attribute weighting employed in SwMC processing does not adequately address this issue, and as a result, does not lead to improved outcomes. This underscores the limitations of the SwMC approach and further emphasizes the need for more advanced methods that can effectively handle the challenges associated with noisy data fusion. In contrast, the end-to-end fusion model proposed in this paper offers a more robust and effective solution for accomplishing the clustering task. By seamlessly integrating different sources of information and leveraging the power of deep learning, this model can learn more discriminative representations that are crucial for accurate clustering. The superior performance of the proposed model highlights its potential for addressing real-world problems where noisy and incomplete data are common challenges. Overall, the results presented in Fig. 9 demonstrate the advantages of the GCN-based method over the shallow graph-based approach SwMC and underscore the limitations of the latter. The proposed end-to-end fusion model exhibits promising performance and represents a significant step forward in addressing the challenges associated with noisy data fusion and accurate clustering.
The Tensor-Based Multiple Clustering model selects the linear attribute with the most abundant information as input but does not capture the complementary information among linear attributes effectively. To better analyze the structure of each linear attribute, this paper utilizes Tensor-Based Multiple Clustering to process all linear attributes as input. It organizes the data of three linear attributes, conducts in-graph learning, and facilitates mutual learning among each linear attribute. This approach aims to uncover the consistency and complementary information in the multi-linear attribute data more comprehensively. Compared to the Tensor-Based Multiple Clustering model, it is evident that the model proposed in this paper shows improvements in ACC, NMI, and other evaluation indicators, resulting in better clustering results. In addition, when conducting experiments with Graph Autoencoder (GAE) and Semi-dilated Convolutional Networks (SDCN) on the same dataset, it is evident that the performance of the multilinear attribute clustering method is superior to that of the single clustering method, as proposed in this paper. This is particularly evident when comparing it to the Tensor-Based Multiple Clustering method, as the multilinear attribute method produces the best linear attribute results.
The application of intelligent feature extraction in demand response aims to identify published demands and locate potential users for response tasks. This falls under the Top-N feature extraction scenario. Consequently, the evaluation metrics for the feature extraction algorithm presented in this paper include precision, recall, coverage, diversity of the feature extraction list (ILS), and novelty of feature extraction (UE) to quantitatively assess the algorithm’s performance. In our study, the triplet knowledge set is segmented into 5 subsets and a 50% cross-validation method is employed to calculate the mean values. For each experiment, several time periods are randomly selected as demand response release tasks. The model’s features are then utilized to extract a list of potential demand response users, and the aforementioned evaluation metrics are computed as presented in Table 3.
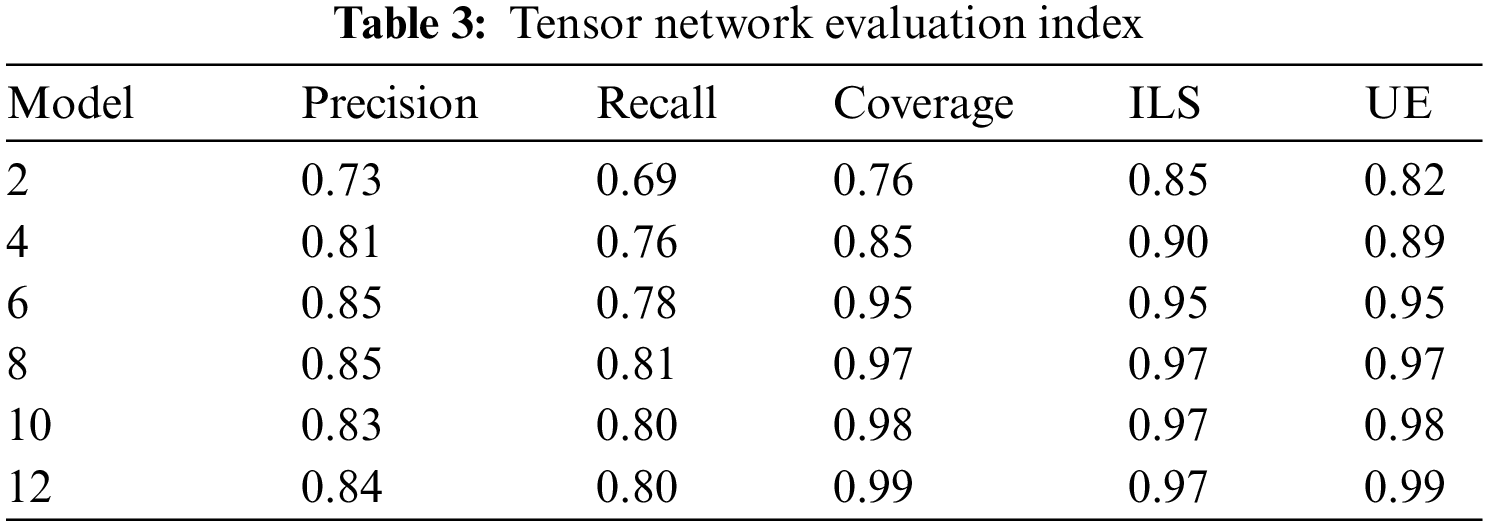
As can be seen from Fig. 10 of the experimental results, with the increase of K value, the coverage rate, the novelty of network users in feature extraction UE and the diversity of power users ILS gradually increase. Because with the increase of feature extraction user list, the diversity of user feature extraction and the probability of feature extraction of new users will increase, so the user coverage will naturally increase. The precision of feature extraction and recall rate both increase first and then decrease, and reach the peak when the K value is 8, the highest precision is 0.86, and the highest recall rate is 0.81. Because the coverage rate has reached a higher value at this time, increasing the K value will increase the probability of irrelevant feature extraction results in the feature extraction list, thus affecting the precision and recall rate of feature extraction.
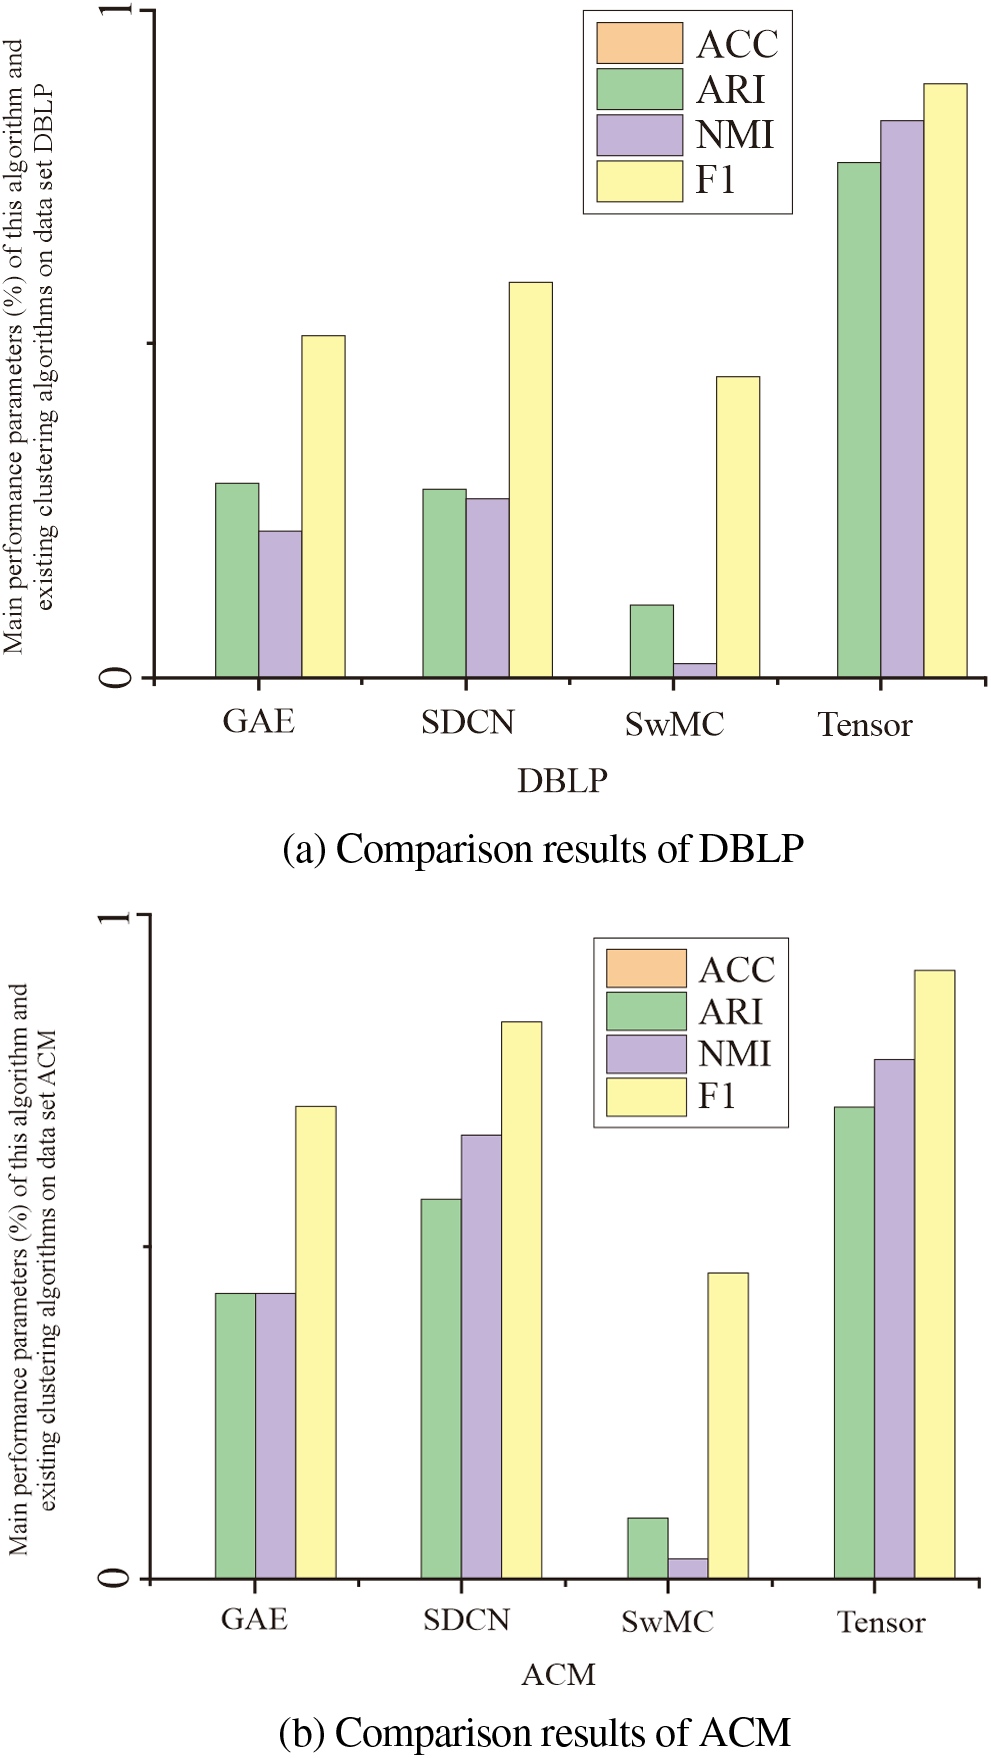
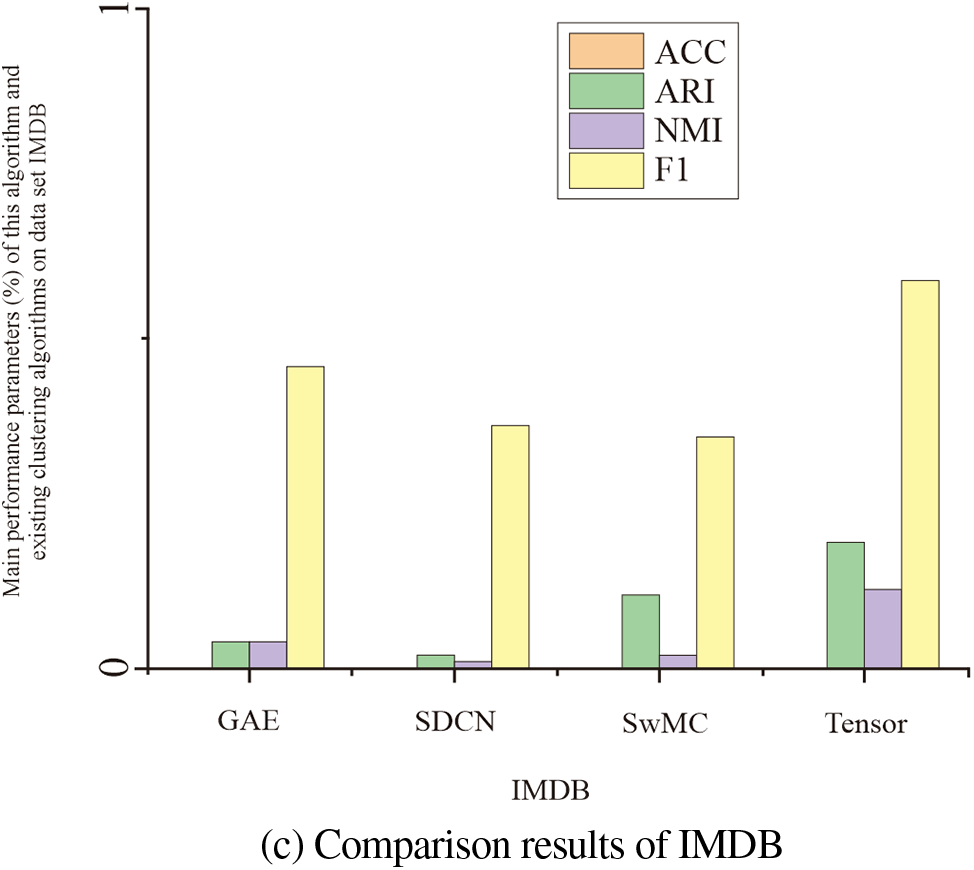
Figure 10: Comparison results of three data sets: “DBLP, ACM, IMDB”
Figs. 11–13 show the comparison of key indicators of intelligent feature extraction of network demand response based on the Tensor network representation learning model and intelligent feature extraction based on the traditional algorithm. Fig. 11 is a comparison of precision. It can be seen from Figure that intelligent feature extraction based on the Tensor network representation learning model has a relatively large improvement in the precision index compared with traditional algorithms, and the precision rate of the Tensor network model is up to 86%. The precision of the traditional algorithm is up to 71%, and the precision index is increased by 18%.
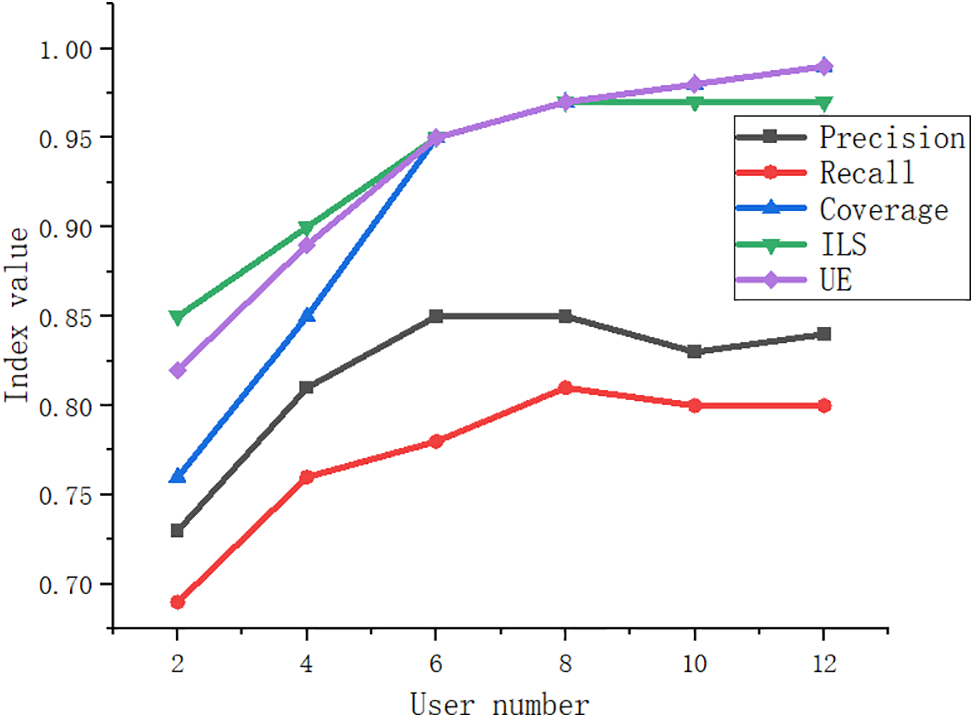
Figure 11: Comparison results of user numbers
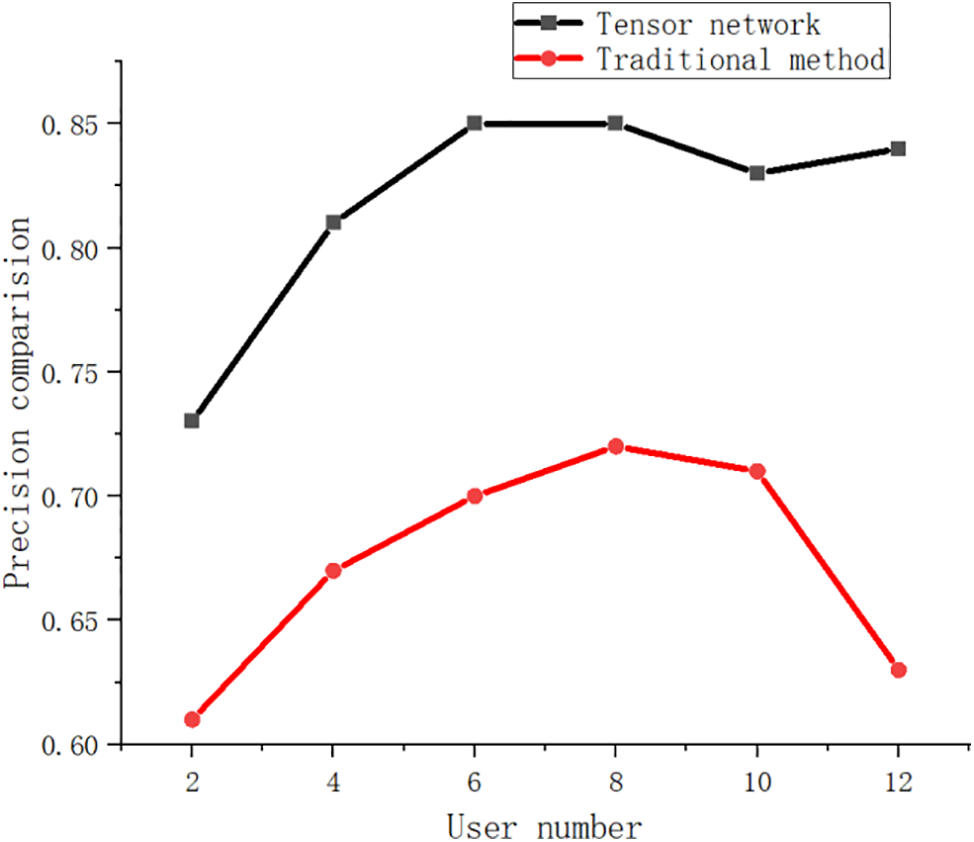
Figure 12: Comparison precision of different methods
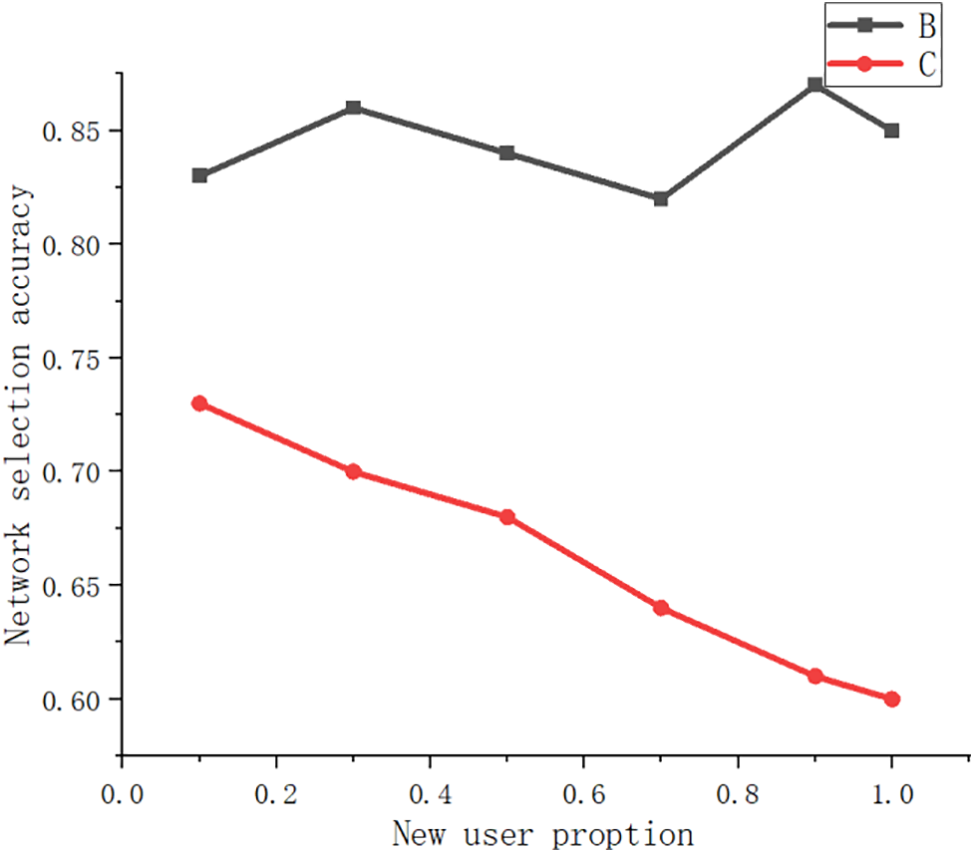
Figure 13: Network selection accuracy of different methods
Fig. 12 shows the comparison of precision in scenarios with different proportions of new users. The precision of the feature extraction algorithm of the traditional algorithm decreases significantly when the mixing proportion of new users gradually increases. However, the precision of the feature extraction model based on multi-linear tensors will not be disturbed by new users too much, and it has been fluctuating around 0.86. Because the traditional feature extraction algorithm cannot extract the characteristics of new users’ electricity consumption behavior, new users cannot effectively participate in intelligent feature extraction. Therefore, it is impossible to form an effective feature extraction record to assist subsequent feature extraction. The tensor network represents the feature extraction system of the learning model. By taking the mean value of the adjacent entity vector of the newly added user as its initial vector, it can make use of the features of the adjacent entity to depict the user more accurately at the initial moment, and then form an effective feature extraction record. In addition, the Tensor network indicates that the learning model will continuously reversely adjust the entity vector of the newly added entity according to the feedback of the feature extraction user after each round of feature extraction until it converges, so it can show excellent results. Therefore, the Tensor network indicates that the learning model can solve the cold start problem well in combination with social networks. The Tensor network curve in Fig. 12 is the precision curve of feature extraction results after entity vector convergence.
Fig. 13 illustrates that the multi-linear tensor feature extraction model, utilizing Tensor network representation learning, exhibits a notable enhancement in the novelty index. Traditional algorithms, whether focused on online goods or user-based, are designed to extract similar online products or inexpensive items purchased by comparable users. Consequently, the novelty of product feature extraction tends to be inherently low. However, the representation learning model rooted in the multi-linear tensor network can capture less popular entity nodes during the diffusion process of the tensor algorithm for demand response task entities.
Fig. 14 clearly illustrates the situation where feature extraction is highly popular but has limited purchasing power. Therefore, the novelty of feature extraction can be significantly enhanced.
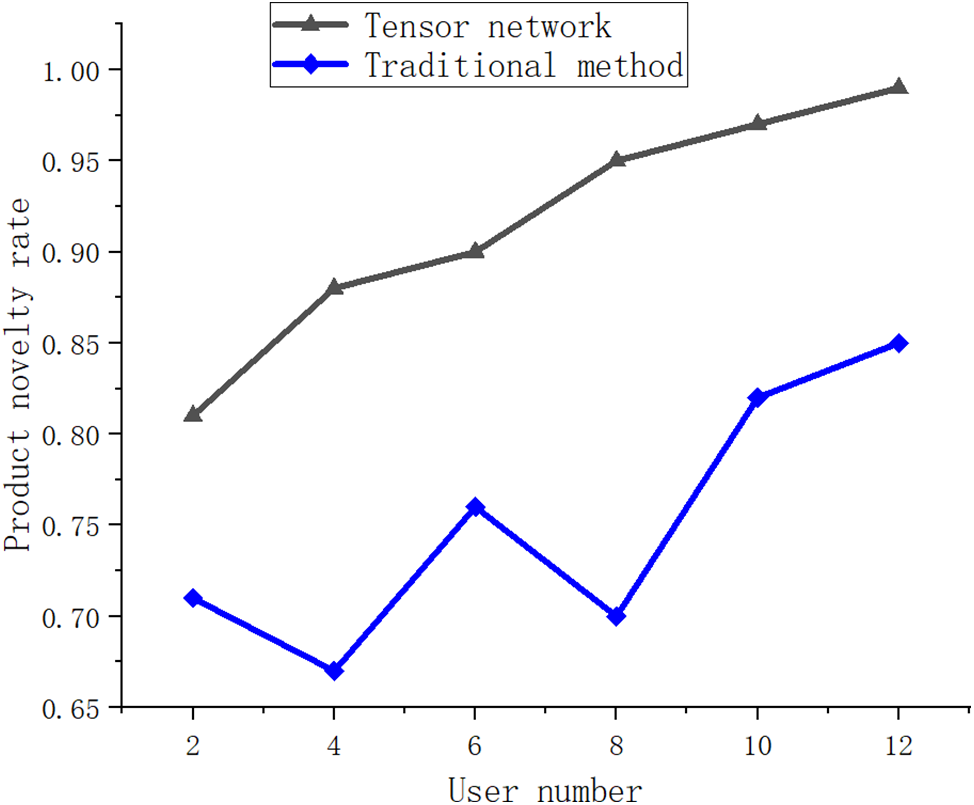
Figure 14: Multi-linear tensor feature extraction of different methods
Tensor-Based Multiple Clustering has gradually become a research hotspot. This paper summarizes the weight learning method for multi-linear attribute ranking in the field of deep learning. It also provides a detailed analysis of the network physics of deep learning and tensor-based clustering methods. Recent research on modal fusion technology has led to the development of numerous new clustering algorithms and has broadened the scope of clustering learning methods. These models and algorithms have their advantages and disadvantages and can be applied in various fields.
This paper investigates deep learning clustering, to extract complementary and consistent information from multi-linear data using neural networks, to provide a more comprehensive description of the data. Therefore, this paper proposes a multilinear attribute clustering method based on tensor graph convolution. In this method, multiple linear properties are serialized into tensor graphs. The information from neighboring nodes in each linear property is utilized to effectively extract the consistency and complementarity information of multiple linear properties through information exchange and learning. In this paper, we propose a weight learning method based on multi-linear attribute ranking to measure attribute combinations. Additionally, we propose a tensor-based clustering method. By comparing the experimental results with those of traditional algorithms, the proposed method has been verified to enable machines to possess more human-like intelligence characteristics. Tensor networks and neural networks are two relatively young but rapidly developing fields. In the next step, we can further study insufficiently researched problems such as neural networks and tensor networks. We can also explore difficult problems like cross-modal transfer learning and non-convex optimization. Additionally, we can promote the application of this technology in new areas of deep learning. For example, we can apply the optimized deep learning technology to the location of potential security nodes in wireless sensor networks, to avoid malicious attacks more efficiently [21].
Acknowledgement: None.
Funding Statement: The subject is sponsored by the National Natural Science Foundation of P. R. China (Nos. 62102194 and 62102196), Six Talent Peaks Project of Jiangsu Province (No. RJFW-111), Postgraduate Research and Practice Innovation Program of Jiangsu Province (Nos. KYCX23_1087 and KYCX22_1027).
Author Contributions: Study conception and design: Hongjun Zhang, Hao Ye, Hao Zhang, Yu Lei; data collection: Desheng Shi; analysis and interpretation of results: Hongjun Zhang; draft manuscript preparation: Hongjun Zhang. All authors reviewed the results and approved the final version of the manuscript.
Availability of Data and Materials: Data not available due to legal restrictions. Due to the nature of this research, participants of this study did not agree for their data to be shared publicly, so supporting data is not available.
Conflicts of Interest: The authors declared that they have no conflicts of interest to report regarding the present study.
References
1. Y. Zhao, L. T. Yang, and R. Zhang, “Tensor-based multiple clustering approaches for cyber-physical-social applications,” IEEE Trans. Emerg. Topics Comput., vol. 8, no. 1, pp. 69–81, 2020. doi: 10.1109/TETC.2018.2801464. [Google Scholar] [CrossRef]
2. C. Comert et al., “Secure design of cyber-physical systems at the radio frequency level machine and deep learning-driven approaches, challenges and opportunities,” Artificial Intelligence for Cyber-Physical Systems Hardening, vol. 2, no. 11, pp. 123–154, Nov. 2021. doi: 10.1007/978-3-031-16237-4_6. 2023. [Google Scholar] [CrossRef]
3. X. J. Gao, T. T. Mu, J. Y. Goulermas, and M. Wang, “Topic driven multilinear attribute similarity learning with multi-view voted convolutional features,” Pattern Recognit., vol. 75, pp. 223–234, 2018. doi: 10.1016/j.patcog.2017.02.035. [Google Scholar] [CrossRef]
4. A. El-mekkawi, X. Hesselbach, and J. R. Piney, “Evaluating the impact of delay constraints in network services for intelligent network slicing based on SKM model,” Comm. Netw., vol. 23, no. 4, pp. 281–298, Aug. 2021. doi: 10.23919/JCN.2021.000024. [Google Scholar] [CrossRef]
5. M. Brbić and I. Kopriva, “Multi-view low-rank sparse subspace clustering,” Pattern Recognit., vol. 73, pp. 247–258, 2018. doi: 10.1016/j.patcog.2017.08.024. [Google Scholar] [CrossRef]
6. T. Barbu, “Deep learning-based multiple moving vehicle detection and tracking using a nonlinear fourth-order reaction-diffusion based multi-scale video object analysis,” Discrete Contin. Dyn. Syst.-S, vol. 1, no. 16, pp. 16–32, 2023. doi: 10.3934/dcdss.2022083. [Google Scholar] [CrossRef]
7. M. Zitnik, M. Agrawal, and J. Leskovec, “Modeling polypharmacy side effects with graph convolutional networks,” Bioinformatics, vol. 13, no. 34, pp. i457–i466, 2018. doi: 10.1093/bioinformatics/bty294. [Google Scholar] [PubMed] [CrossRef]
8. K. Zhan, F. P. Nie, J. Wang, and Y. Yang, “Multiview consensus graph clustering,” IEEE Trans. Image. Process., vol. 28, no. 3, pp. 1261–1270, 2019. doi: 10.1109/TIP.2018.2877335. [Google Scholar] [PubMed] [CrossRef]
9. T. Tanaka, T. Inui, S. Kawai, S. Kuwabara, and H. Nishizawa, “Monitoring and diagnostic technologies using deep neural networks for predictive optical network maintenance,” J. Opt. Commun. Netw., vol. 13, no. 10, pp. E13–E22, Oct. 2021. doi: 10.1364/JOCN.424428. [Google Scholar] [CrossRef]
10. J. Feng, L. T. Yang, Y. Zhu, N. J. Gati, and Y. Mo, “Blockchain-enabled tensor-based conditional deep convolutional gan for cyber-physical-social systems,” ACM Trans. Internet Technol. vol. 21, no. 2, pp. 1–17, 2021. doi: 10.1145/3404890. [Google Scholar] [CrossRef]
11. Y. Al-Eryani, M. Akrout, and E. Hossain, “Multiple access in cell-free networks: Outage performance, dynamic clustering, and deep reinforcement learning-based design,” IEEE J. Sel. Area. Comm., vol. 39, no. 4, pp. 1028–1042, 2021. doi: 10.1109/JSAC.2020.3018825. [Google Scholar] [CrossRef]
12. J. Feng, L. T. Yang, X. Nie, and N. J. Gati, “Edge-cloud-aided differentially private tucker decomposition for cyber-physical-social systems,” IEEE Internet Things J., vol. 9, no. 11, pp. 8387–8396, 2020. doi: 10.1109/JIOT.2020.3004826. [Google Scholar] [CrossRef]
13. H. Ma, J. Tian, K. Qiu, D. Lo, and T. Baker, “Deep-learning-based app sensitive behavior surveillance for android powered cyber-physical systems,” IEEE Trans. Industr. Inform., vol. 17, no. 8, pp. 5840–5850, 2020. doi: 10.1109/TII.2020.3038745. [Google Scholar] [CrossRef]
14. B. Hussain, Q. Du, B. Sun, and Z. Han, “Deep learning-based DDoS-attack detection for cyber-physical system over 5G network,” IEEE Trans. Industr. Inform., vol. 17, pp. 860–870, 2021. doi: 10.1109/TII.2020.2974520. [Google Scholar] [CrossRef]
15. Y. Panagakis, J. Kossaifi, G. G. Chrysos, J. Oldfield, and S. Zafeiriou, “Tensor methods in computer vision and deep learning,” Proc. IEEE, vol. 109, no. 5, pp. 863–890, 2021. doi: 10.1109/JPROC.2021.3074329. [Google Scholar] [CrossRef]
16. Z. G. Liu, X. C. Yin, and Y. Hu, “CPSS LR-DDoS detection and defense in edge computing utilizing DCNN Q-learning,” IEEE Access, vol. 8, pp. 42120–42130, 2020. doi: 10.1109/ACCESS.2020.2976706. [Google Scholar] [CrossRef]
17. T. Alfakih, M. M. Hassan, A. Gumaei, C. Savaglio and G. Fortino, “Task offloading and resource allocation for mobile edge computing by deep reinforcement learning based on SARSA,” IEEE Access, vol. 8, pp. 54074–54084, 2020. doi: 10.1109/ACCESS.2020.2981434. [Google Scholar] [CrossRef]
18. Q. Wu, Z. Jiang, K. Hong, H. Liu, and J. Ding, “Tensor-based recurrent neural network and multi-modal prediction with its applications in traffic network management,” IEEE Trans. Netw. Service Manag., vol. 18, no. 1, pp. 780–792, 2021. doi: 10.1109/TNSM.2021.3056912. [Google Scholar] [CrossRef]
19. M. Singh, G. S. Aujla and R. S. Bali, “A deep learning-based blockchain mechanism for secure internet of drones environment,” IEEE Trans. Intell. Transp. Syst., vol. 22, no. 7, pp. 4404–4413, 2020. doi: 10.1109/TITS.2020.2997469. [Google Scholar] [CrossRef]
20. C. Comert et al., “Secure design of cyber-physical systems at the radio frequency level: Machine and deep learning-driven approaches, challenges and opportunities,” In: I. Traore, I. Woungang, S. Saad (Eds.Artificial Intelligence for Cyber-Physical Systems Hardening. Engineering Cyber-Physical Systems and Critical Infrastructures, Cham: Springer, 2023, vol. 2, pp. 123–154. doi: 10.1007/978-3-031-16237-4_6. [Google Scholar] [CrossRef]
21. P. Li, X. Yu, H. Xu, and W. Ruchuan, “Secure localization technology based on dynamic trust management in wireless sensor networks,” Chin. J. Electron., vol. 30, no. 4, pp. 759–768, 2021. [Google Scholar]
Cite This Article
 Copyright © 2024 The Author(s). Published by Tech Science Press.
This work is licensed under a Creative Commons Attribution 4.0 International License , which permits unrestricted use, distribution, and reproduction in any medium, provided the original work is properly cited.
 Downloads
 Citation Tools