
 Submit a Paper
 Propose a Special lssue
 Open Access
ARTICLE

Intelligent Design of High Strength and High Conductivity Copper Alloys Using Machine Learning Assisted by Genetic Algorithm
1 Metallurgical & Materials Engineering Department, Indian Institute of Technology, Kharagpur, West Bengal, 721302, India
2 Computer Science & Engineering Department, Indian Institute of Technology, Kharagpur, West Bengal, 721302, India
3 Vice Chancellor Office, Birla Institute of Technology (BIT) Mesra, Ranchi, Jharkhand, 835215, India
* Corresponding Author: Indranil Manna. Email:
Computers, Materials & Continua 2024, 79(1), 1727-1755. https://doi.org/10.32604/cmc.2024.042752
Received 10 June 2023; Accepted 28 October 2023; Issue published 25 April 2024
 View Full Text
 Download PDF
Abstract
Metallic alloys for a given application are usually designed to achieve the desired properties by devising experiments based on experience, thermodynamic and kinetic principles, and various modeling and simulation exercises. However, the influence of process parameters and material properties is often non-linear and non-colligative. In recent years, machine learning (ML) has emerged as a promising tool to deal with the complex interrelation between composition, properties, and process parameters to facilitate accelerated discovery and development of new alloys and functionalities. In this study, we adopt an ML-based approach, coupled with genetic algorithm (GA) principles, to design novel copper alloys for achieving seemingly contradictory targets of high strength and high electrical conductivity. Initially, we establish a correlation between the alloy composition (binary to multi-component) and the target properties, namely, electrical conductivity and mechanical strength. Catboost, an ML model coupled with GA, was used for this task. The accuracy of the model was above 93.5%. Next, for obtaining the optimized compositions the outputs from the initial model were refined by combining the concepts of data augmentation and Pareto front. Finally, the ultimate objective of predicting the target composition that would deliver the desired range of properties was achieved by developing an advanced ML model through data segregation and data augmentation. To examine the reliability of this model, results were rigorously compared and verified using several independent data reported in the literature. This comparison substantiates that the results predicted by our model regarding the variation of conductivity and evolution of microstructure and mechanical properties with composition are in good agreement with the reports published in the literature.Graphic Abstract
Keywords
Supplementary Material
Supplementary Material FileApplications in fields such as electrical contacts, switches, switchgear, connectors, electrodes, relays, and circuit breakers necessitate an amalgamation of exceptionally elevated electrical conductivity, and robust mechanical strength, while also incorporating resistance to wear and oxidation [1]. For example, lead frames of integrated circuits require a material having an electrical conductivity of more than 50% IACS (International Annealed Copper Standard) and tensile strength above 800 MPa [2]. Similarly, contact wires for high-speed trains require a material having an electrical conductivity of more than 60% IACS and strength above 500 MPa [2,3]. In general, high-conductivity metals find widespread applications in automobiles, manufacturing units, electrical machines, aircraft, military hardware, and energy generation units. Copper offers the second highest electrical conductivity (or second lowest electrical resistivity of 16.78 nΩ·m at 20°C) and is frequently employed as a conductive medium for wiring and windings, within electrical machinery, electronic circuitry, power generation, transmission, distribution systems for telecommunication networks and an array of diverse electrical apparatus and functionalities [4,5]. However, pure copper is highly ductile and suffers easy wear, oxidation, fatigue, and creep damage. Thus, a series of binary/multicomponent copper alloys have been developed (e.g., Cu-Mg [3], Cu-Cr-Zr [4], Cu-Ni-Si [5,6], Cu-Ni-Si-Cr [7], Cu-Zr [8], Cu-Sn-Zn [9], Cu-Ni-Zn [10], Cu-Be [11], Cu-Cr [12], Cu-Fe-P [13,14], etc.) for various conductor applications that derive mechanical strength from strain, solid solution, precipitation or dispersion hardening while offering an optimum combination of electrical conductivity and mechanical strength. The intrinsic correlation between electrical conductivity and mechanical reinforcement, employing one of the aforementioned mechanisms, typically manifests as a reciprocal phenomenon. This duality arises due to the introduction of structural imperfections, like solute atoms, dislocations, and grain/phase boundaries, or the incorporation of precipitates, dispersoids, and emergent phases. These structural irregularities serve as focal points for both electron scattering, leading to a substantial diminution in electrical conductivity, and stress concentration regions, contributing to heightened mechanical robustness [15,16]. Thus, increasing mechanical strength and wear resistance without deteriorating electrical conductivity is a major challenge.
Besides very high electrical and thermal conductivity, copper is widely available, non-hazardous, easy to manufacture, and offers excellent ductility, malleability, corrosion resistance and scope for tailoring its mechanical properties. Therefore, copper-based metallic alloys appear as an ideal choice for obtaining the most optimized combination of electrical and mechanical properties. Many studies in the past have pursued this objective and reported interesting results and theories [2,17,18]. Numerous alloying elements have been explored (e.g., Cr, Zr, Ni, Si, Mg, Zn, Sn, Ti, Al, Co) through various processing routes [13,19–23] and both adverse and favorable effects on electrical conductivity and mechanical strength have been reported [19,20,24–28]. Strengthening has been attempted through strategies of stacking fault energy modulation [29], precipitate hardening [17,26,30], grain refinement [12], nano-twin formation [8], etc. Most of these studies were experimental in nature and hence, were time-consuming and expensive [7,13,14,23,31–36].
In general, designing and predicting the properties of an alloy is of paramount interest in material science and engineering for accelerating materials discovery, at an affordable time and cost [15,37]. Predicting the structural properties of a given alloy through the experimental route requires an understanding of the complex physical interaction of atoms/ions/molecules subjected to mechanical activation, dislocation dynamics through strain fields, and intricate precipitate-matrix interface evolution in course of thermal/thermo-mechanical processing. Machine learning is recognized as a robust technique to correlate complex non-linear interrelations feasibly and effectively [30,38–41]. Therefore, it has found its way in accelerating materials design and development as it can bypass the complex intermediate pathway and can directly learn the non-linear correlation between composition and properties [30,42–44]. ML has successfully showcased its strength in numerous research areas like the development of low-cost, low-modulus bone-like material [38], optimization of processing route for advanced inorganic materials (MoS2) [45], property enhancement for carbon quantum dots [38], the discovery of new materials (metallic glasses [45], high entropy alloys [46–50] shape memory alloys [51]). In the recent past, attempts have been made to synthesize the high-strength conductor using ML [50,52]. Wang et al. [10] laid the stepping stone by effectively designing the complex high-performance copper alloy using a property-oriented ML design system. Pan et al. [26] synthesized high-performance Cu-Ni-Co-Si alloy by optimizing the composition and explained the relation between the process parameters and microstructure including phase evolution. Zhang et al. [18] designed a high-performance Cu-1.3Ni-1.4Co-0.56Si-0.03Mg alloy by combining ML with a key screening factor and Bayesian optimization. Ozerdem et al. [9] employed a multi-layer artificial neural network to predict the mechanical properties (yield strength, tensile strength, and elongation) of the Cu-Sn-Pb-Zn-Ni system.
It is known that ML approaches rely on several hyper-parameters, which require tuning to ensure the accuracy of prediction. In this context, genetic algorithm-based optimization is considered to be a powerful technique for obtaining the global optimum. GA adopts population-based methods, unlike commonly used conventional gradient optimization techniques which are prone to coincide with the local optima. GA represents a robust metaheuristic optimization technique adept at optimizing multi-dimensional features [39], well-suited for tackling intricate nonlinear and nonconvex problems [47]. GA offers several advantages compared to conventional optimization algorithms, notably its adaptability to various optimization scenarios and potential for parallelization [53]. In this study, a particularly real-coded GA routine has been utilized. It employs continuous numerical representations to efficiently explore solution spaces, enabling optimization for complex real-world problems with diverse variables. Through the utilization of real number encodings, this algorithm presents a versatile optimization approach that proves highly effective for tasks such as fine-tuning parameters in ML and addressing complexities in engineering design. However, certain considerations warrant attention, including the meticulous formulation of the fitness function, determination of the population size, selection of critical parameters such as mutation and crossover rates, and the selection criteria of the new population [53]. Its versatile applicability spans diverse domains, including graph coloring, pattern recognition, travelling salesman problems, and efficient design of airfoils [53], etc. Various researchers have utilized ML-assisted GA in various applications like the accelerated discovery of nanostructured alloy [39], designing of new molecules with valid chemical molecular structure [54], prediction of atmospheric corrosion depth of steel and zinc [54], designing of new medium carbon steel by predicting mechanical properties from its composition and heat treatment [55] and prediction of elevated temperature constitutive flow behavior of 42CrMo steel [45].
The present study aims to utilize ML as a guiding tool to design novel copper alloys with optimized composition and desired set of properties for specific applications. Here we have built robust ML models coupled with GA-based optimization to predict the mechanical (hardness and ultimate tensile strength) and electrical (electrical conductivity) properties from composition while overcoming the trade-off between mechanical and electrical properties. Next, to realize the challenging task of composition-to-property prediction, it is first important to develop a model that can directly map and correlate the chosen composition to the corresponding properties with high precision. Here the challenge arises from the increased dimensionality of output (composition) hyperspace while attempting to converge and predict the optimum alloy composition with limited data. This problem has been successfully resolved in this work by adopting a novel composition-design technique, and an appropriate combination of data segregation and data augmentation by ML. Eventually, this model, which was built to meet the previous objectives, further enabled us to predict the stoichiometry of the precipitate and gather insights on the prevailing degree of precipitation and solid solution in the system. To validate the efficacy of the model, results were rigorously verified with the relevant experimental results reported in the literature. Approximately 40 new sets of data points generated by the present model were validated through careful comparison and found to be in close agreement with the experimental values with an error limit of less than 7%.
The database was meticulously curated through a manual process involving the aggregation of data from an extensive array of over 150 distinct scientific publications. This comprehensive endeavor resulted in the assembly of a dataset comprising more than 500 individual data points as shown in Fig. 1. It is known that both electrical and mechanical properties of an alloy depend on heat treatment parameters and vary in the opposite manner with time and temperature. Therefore, optimal combinations of electrical conductivity and mechanical properties (in terms of ultimate tensile strength, UTS, or hardness in Vickers scale, Hv) of the alloys were extracted from the kinetic (time-temperature-extent of transformation) plots for the concerned heat treatment. Consequently, when a machine learning model is built on this data, it should predict the optimized properties for the new alloy system. The database used in this study contains 13 alloying elements, 2 dispersoids and porosity as input fields and electrical conductivity and ultimate tensile strength as output fields. Both the maximum and minimum values of every field are provided in Table 1. Data has been collected both for powder metallurgy and casting routes of alloy synthesis; hence a porosity field was added to the database so that the ML model can recognize the data as per the processing route. For the HV-UTS model, a new database was generated using the previous database by selecting only those compositions for which both HV and UTS values were available. In this way, a total of 117 data points were obtained to generate the HV-UTS database.

Figure 1: Database of electrical conductivity and ultimate tensile strength creating the property-space from the randomly selected binary and multi-components alloys for the present optimization study with Cu-base alloys

3 Machine Learning Design and Development
ML is considered a universal function because of its ability to excellently fit and predict non-linear data. It has evolved as a very powerful guiding tool for accelerated materials discovery. Fig. 2a shows the versatility and robustness of this pathway over other conventional and non-conventional routes. It acts like an over-bridge that directly combines the input fields to the desired output properties, bypassing the difficulties of extensive experiments, complexities of intricate simulations and the need for rigorous parametric and empirical studies. In addition, its inherent time efficiency, cost-effectiveness, and high accuracy have overcome the limitations of the conventional materials design approaches and thereby, serve as a proof-of-concept for developing new high-performance alloys. Fig. 2b highlights the advantages and disadvantages of using ML in contrast to the other approaches, providing a ranking based on various descriptors. In this study, the focus is on designing new high-conductivity and high-strength copper alloy-based electrical conductors by ML and GA.

Figure 2: (a) Machine learning serves as a high-throughput screening instrument for materials discovery, effectively circumventing limitations inherent in conventional methods such as experimental trials, computational simulations, and parametric analyses and (b) systematically outlines the advantages and disadvantages associated with various approaches, while employing a quantifiable ranking methodology. This approach substantiates the relative position of ML within the spectrum of methodologies, grounded in efficiency and performance criteria
Different ML models capture different patterns of data with different degrees of accuracy. Hence, a series of models like the support vector machine (SVM) [56], decision trees [57], random forest [58], XGBoost [59,60], Catboost [61], artificial neural network (ANN) [62], LightGBM [63] and gradient-boost regressor [64] have been trained on the dataset. The corresponding accuracies are detailed in Table S1. Among these, the Catboost model [51] outperforms all its counterparts, while the XGBoost [59,60], ANN and random forest [48] approaches have performed well and provided acceptable accuracies. In pursuit of the primary objective—forecasting composition-to-property relationships—”Model 1” is conceived. This framework integrates the Catboost ML model with a Genetic Algorithm (GA). The GA enhances Catboost-based predictions by iteratively refining hyperparameters (detailed in Table 2). The Catboost ML algorithm is rooted in robust gradient-descent tree boosting and relies on tree structures. Among various hyper-parameters, depth, learning rate, iterations, l2 leaf reg, border count, and thread count prove to be the most effective parameters in this study for optimization considering both temporal and computational constraints. GA is a well-established evolutionary technique that has been employed in the present optimization exercise. GA comprises distinct stages of initial population, fitness evaluation, selection, crossover, and mutation. Our GA exercise employs an initial population of 60, terminating after 125 iterations with the crossover probability set at 0.95, mutation at 0.1 and error function at mean absolute error (MAE). These choices drive iterative refinement, yielding optimized hyperparameters and minimizing prediction errors. Since experiments include a great deal of research time and cost, a stacking model (Model 2) was developed before going to experimentation to cross-validate the results of Model 1 as they are in general considered to be decently stable over the domain. Model 2, developed by stacking together the ANN, Xgboost, Catboost and random forest, was threaded by a support vector machine meta-model. To confront the objective of inverse design of property-to-composition prediction, first data augmentation was conducted with the help of Model 1 and then suitable models were developed on top of it for different alloying systems.
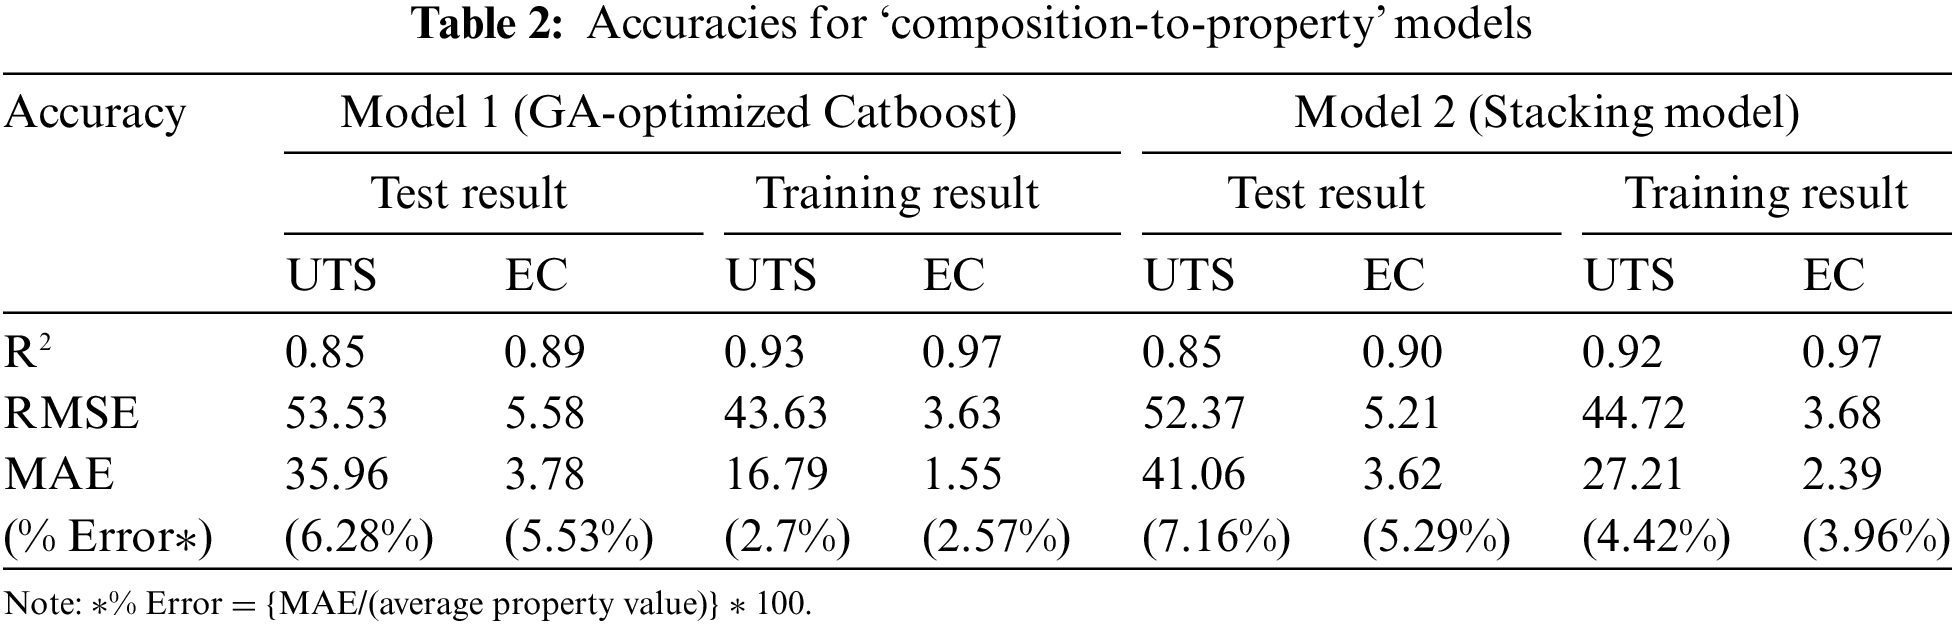
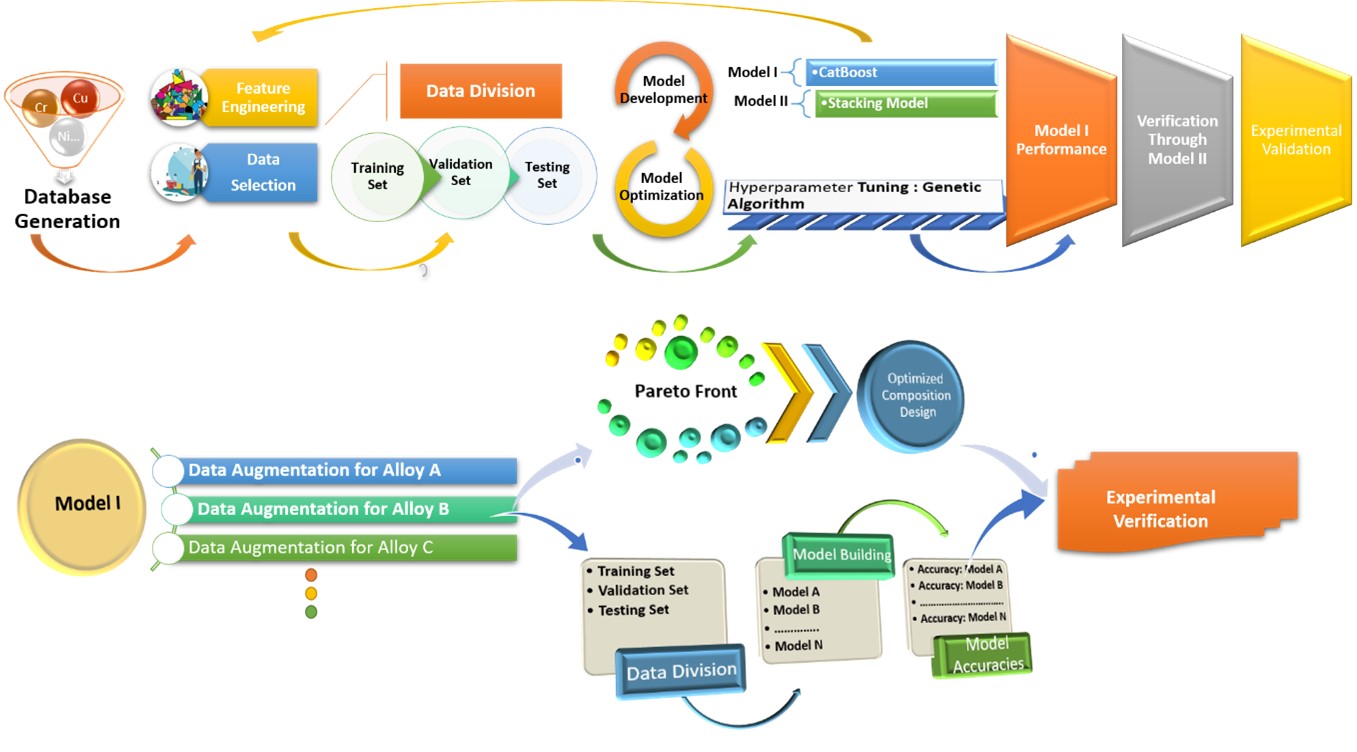
Fig. 3 illustrates the workflow of the procedure adopted to realize the aimed objectives. Initially, data cleaning and feature selection were done recursively to enhance the model accuracy. Then, two robust ML models were developed: Model 1 and Model 2. Model 1 was designed for composition-to-property prediction while Model 2 was developed for double checking the Model 1 predictions, i.e., increasing the prediction reliability and screening efficiency by parallel application of both models together. At this stage, grid-optimization was employed to obtain the best performance of Model 2 through hyper-parameter tuning, following which, cyclical feedback was sent back to the feature engineering and data selection section to further refine the data and accuracy at this stage to improve its overall efficiency. After optimizing this feedback loop, GA was employed on the validation set for tuning the ML model hyper-parameters. Here, GA is used to precisely reach the optimal position which is not possible for grid-optimization techniques out of a large number of Catboost hyper-parameters. To tackle subsequent objectives of property-to-composition prediction and obtaining the optimized copper alloy compositions, data augmentation becomes crucial as different ML models require a training set and the data from the database may not be sufficient to train the model reliably. Therefore, data was firstly augmented by varying the alloying composition in small increments for every alloy system separately. This procedure culminated in the creation of over 4 million compositions collectively, with Model 1 efficiently assessing the respective properties in a high-throughput fashion. Now to achieve the second objective of exploring the potency of the new copper alloy, all data points were plotted as scatterplots to determine the Pareto front representing the optimized compositions–this will be discussed later.

Figure 3: Flow chart showing the logical sequence for model development and materials selection
In the third objective, we need to find the optimized composition of conventional and non-conventional alloys. Firstly, using a defining criterion (DC) (explained in Section 4.3.2), the data is divided into two groups. To obtain the optimized composition, we use a procedure similar to the one used for the second objective. The next objective is the reverse design of the property-to-composition model. For a given property requirement, one can achieve that objective through various alloying compositions. Thus, the alloy system was fixed; then the data was augmented corresponding to that alloy, and finally, a suitable ML model was deployed on top of it for property-to-composition prediction. For the last objective of precipitate stoichiometry prediction, we use the fact that electrical conductivity is an extremely sensitive property concerning the extent of solid solution and precipitation in the system. Therefore, precipitate stoichiometry is obtained by plotting the electrical conductivity against the atomic ratio of alloying elements.
Hv, UTS and EC, apart from wear resistance are the three extremely crucial properties of copper alloys for electrical contact applications. Fig. 4 shows the variation of Hv as a function of UTS for several Cu-alloys. Obtained through a standard regression analysis, Fig. 4 suggests that a linear relationship exists between these two important mechanical properties for the entire series of Cu-alloys covered in this analysis. For ascertaining the overall accuracy of the model, enhancing the reliability of predictions and mitigating potential biases, the training and testing steps were iterated 10 times. Every time, the dataset was divided into 10 subsets, with one distinct part designated for testing, while the remaining nine subsets were employed for training purposes. This strategy of distributed utilization of the dataset was adopted based on the fact that the available dataset size was just 117 data points for UHM. Allocating a larger proportion (90%) for training and a smaller fraction for testing (10%) and then averaging this process over 10 iterations ensured stable, reliable, and better predictive accuracy of the model. In the end, we calculate the mean of the ten accuracy values to get an overall acceptable accuracy value or mean absolute error of the model. The correlation between UTS and Hv is determined by the model with high accuracy (R2 value: 0.98, MAE value: 9.38 HV) to arrive at the following equation:

Figure 4: Variation of Vickers hardness as a function of ultimate tensile strength for copper-based alloys. Here, individual data points represent the relationship between these two independent mechanical properties for the selected alloy compositions and red line marks the best linear regression fit for all the data points
4.2 Composition-to-Property Prediction
As already stated, Model 1 follows GA-optimized Catboost-based ML protocol to correlate the Cu-alloy composition (input) with mechanical (UTS) and electrical (EC) properties (outputs) of the same alloys. Real coded GA exercise was used to improve the accuracy of Model 1 over that of the default Catboost model, leading to a reduced strength and conductivity MAE bar from 43.01 MPa and 3.86% IACS to 35.96 MPa and 3.78% IACS, respectively. Model 2 is a stacking ensemble model which gives a similar accuracy as that of Model 1 as shown in Table 2. The significant performance and precision of this model are due to the simultaneous contribution of multiple optimization exercises based on ANN, random forest, Catboost and Xgboost models. Initially, these four stacking models were trained, and they performed predictions on the test data, which constituted the metadata. Subsequently, the metadata was threaded by a support vector machine (SVM) meta-model to perform the final prediction of the concerned properties.
Figs. 5 and 6 illustrate the efficacy of the present models in understanding the composition-property correlation in copper alloys. The discontinuous or broken blue line is the linear regression fit (y = x line), which signifies the ideal prediction, i.e., the predicted trend exactly matches the experimental results. The deviation from this line implies the extent of error associated with an individual predicted data point. Similarly, the points lying above and below the ideal fit (y = x line) imply over and under-prediction by the model, respectively. The continuous and thicker bold lines (red and yellow) represent the best-fit line for the predicted set of data points. The difference between the broken and continuous lines in Figs. 5 and 6 shows the deviation of slope between the concerned sets of average trend and hence, signifies the degree of error.

Figure 5: Training exercise for establishing the relationship between the predicted and experimental data concerning (a) electrical conductivity (EC) and (b) ultimate tensile strength (UTS) and determining the accuracy of the Model 1 based test results in terms of output data of predicted results as a function of experimental data concerning (c) EC and (d) UTS of the selected set of Cu-alloys, respectively. The broken blue line signifies the ideal predictions, the accompanying red line represents the best-fit line for the predictions made on the training set, and the yellow line indicates the best fit line for the predictions made on testing set by Model 1. The violin plots (in the inset) show probability distribution curve outside the boundary between predicted and experimental values

Figure 6: Training and refining exercise for establishing the relationship between the predicted and experimental data concerning (a) electrical conductivity (EC) and (b) ultimate tensile strength (UTS), and the accuracy of the Model 2 based test results in terms of output data of predicted results as a function of experimental data concerning (c) EC and (d) UTS of the selected set of Cu-alloys, respectively. The broken blue line signifies the ideal predictions, the accompanying red line represents the best fit line for the predictions made on training set, and the yellow line indicates the best fit line for the predictions made on the testing set by Model 2. The violin plots (in the inset) show probability distribution curve outside the boundary between predicted and experimental values
The inset for each of the plots in Figs. 5 and 6 presents the so-called violin plots in which the central gray region is the box plot and the outside-colored region indicates the population density. Furthermore, the inside central white spot is the median, the thicker grey region is the interquartile region, and the thin gray line represents the rest of the distribution. On each side of the gray line is a kernel density estimation showing the distribution of the data. Wider sections of the violin plot represent a higher probability, i.e., more members of the population would take that given value. Conversely, the skinnier sections represent a lower probability. Violin plots in Figs. 5 and 6 are built up on the difference between predicted and experimental data and indicate that a significantly thicker portion exists near zero that decreases on moving away from this central spot. This fading trend with distance substantiates that the models are effective and work well in predicting the properties and avoiding or minimizing the noise.
It is interesting to note that Model 1 is more accurate in the higher strength-vs.-conductivity domain as shown in Figs. 5c and 5d, which is our area of interest for designing high-strength Cu-based conductors and contacts. It is also evident from Figs. 5d and 6d that the predicted results on UTS from Model 1 are more accurate than those obtained from Model 2 because the test line is nearer to the ideal line and the violin plot is more concentrated near zero. Similarly, Figs. 5c and 6c indicate that Model 2 is slightly better in predicting EC values which are qualitatively given in Table 2. The prediction of Model 1 has been thoroughly verified by suitable comparison with relevant data from several published literatures which are unutilized by the model during training and is presented in Table 3 and Table S2. Results are found in close agreement with the available data with errors of less than 7% and 6% for UTS and EC, respectively.

4.3 Optimal Composition Design
4.3.1 Analyzing the Potency of New Systems
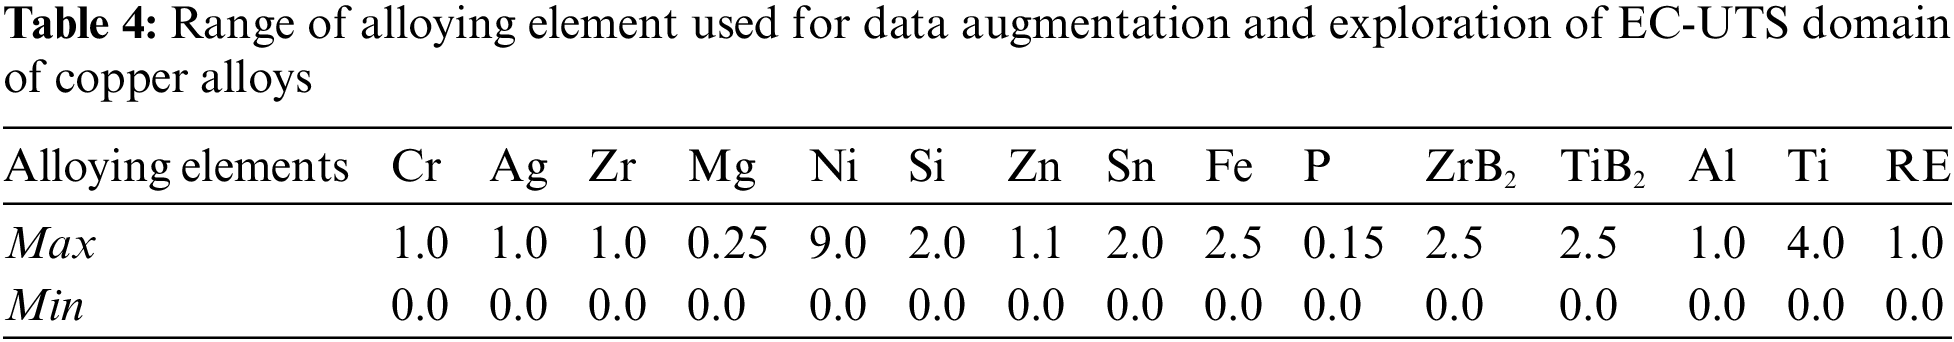
There are many Cu-alloys which have never been explored experimentally. To pursue such a possibility, a database has been developed by gathering a substantial amount of useful data on Cu-alloys through numerous research papers, books, patents, etc. After this exercise, any Cu-alloy which is missing in the dataset is categorized as an unexplored alloy. To explore the potency of these new alloys/systems, a Pareto front has been generated with respect to its electrical and mechanical properties. Various new alloys are identified and plotted in the property space as shown in Fig. 7 where the top right corner, called the Pareto front is the region of interest as it represents the desired combination of high mechanical strength and high electrical conductivity. Each entry in this Pareto front is non-dominant to one another. Here, instead of using some objective optimization function, best-optimized compositions were manually extracted from the Pareto front composition by leveraging the background of applications. By observing the Pareto front, it is found that Zr and Cr are two excellent candidate elements that provide an excellent combination of electrical conductivity and mechanical strength. Ni and Si increase the strength significantly without much deterioration of electrical conductivity. P is used as the refining agent to rule out the impurities from the system which recovers some of the electrical conductivity. If elements like Mg, Ni, Cr, Si and P are present together, it may result in precipitation due to limited solubility, leading to a better electrical-mechanical property trade-off. Sn and Zn increase the stacking fault energy of the copper alloys [10], resulting in enhanced mechanical strength but lowering of electrical conductivity. Again, by analyzing the Pareto fronts of various alloys, Cu-Ni-P is found to be a possible system combining both good strength and conductivity properties. Similarly, Fig. 7 indicates that Cu-Cr-Zr-ZrB2, Cu-Mg-Si-P and Cu-Zr-Fe are alloys that may offer good strength and very high conductivity, Cu-Zr-Ni and Cu-Cr-Zr-Mg-Ni are likely to be of high strength and good conductivity, Cu-Zr-Zn-Sn and Cu-Zr-Zn may combine good strength and high conductivity, Cu-Cr-Zr-Zn-Sn is expected to manifest high strength and high conductivity, Cu-Cr-Zr-Mg-Ni-Si may offer very high strength and good conductivity, Cu-Cr-Zr-Ni-Si-P and Cu-Ni-Si-Fe-P are potential alloys with very high strength and high conductivity, provided these alloys bear the composition as listed in Table 4. Finally, by leveraging the understanding of application requirements, the best compositions of these new alloys are manually chosen from the non-dominant dataset created for the Pareto front and summarized in Table 5.


Figure 7: Variation of electrical conductivity as a function of ultimate tensile strength with blue data points showing the composition scatter points in the property space, red star data points indicating the non-dominant compositions and the yellow line representing the Pareto front for (a) Cu-Zr-Ni, (b) Cu-Ni-P, (c) Cu-Zr-Zn, (d) Cu-Zr-Zn-Sn, (e) Cu-Cr-Zr-Mg-Ni, (f) Cu-Cr-Zr-Mg- Ni-Si, (g) Cu-Cr-Zr-Ni-Si-P, (h) Cu-Ni-Si-Fe-P, (i) Cu-Cr-Zr-Zn-Sn and (j) Cu-Cr-Zr-Ni-Si-P alloy systems, respectively
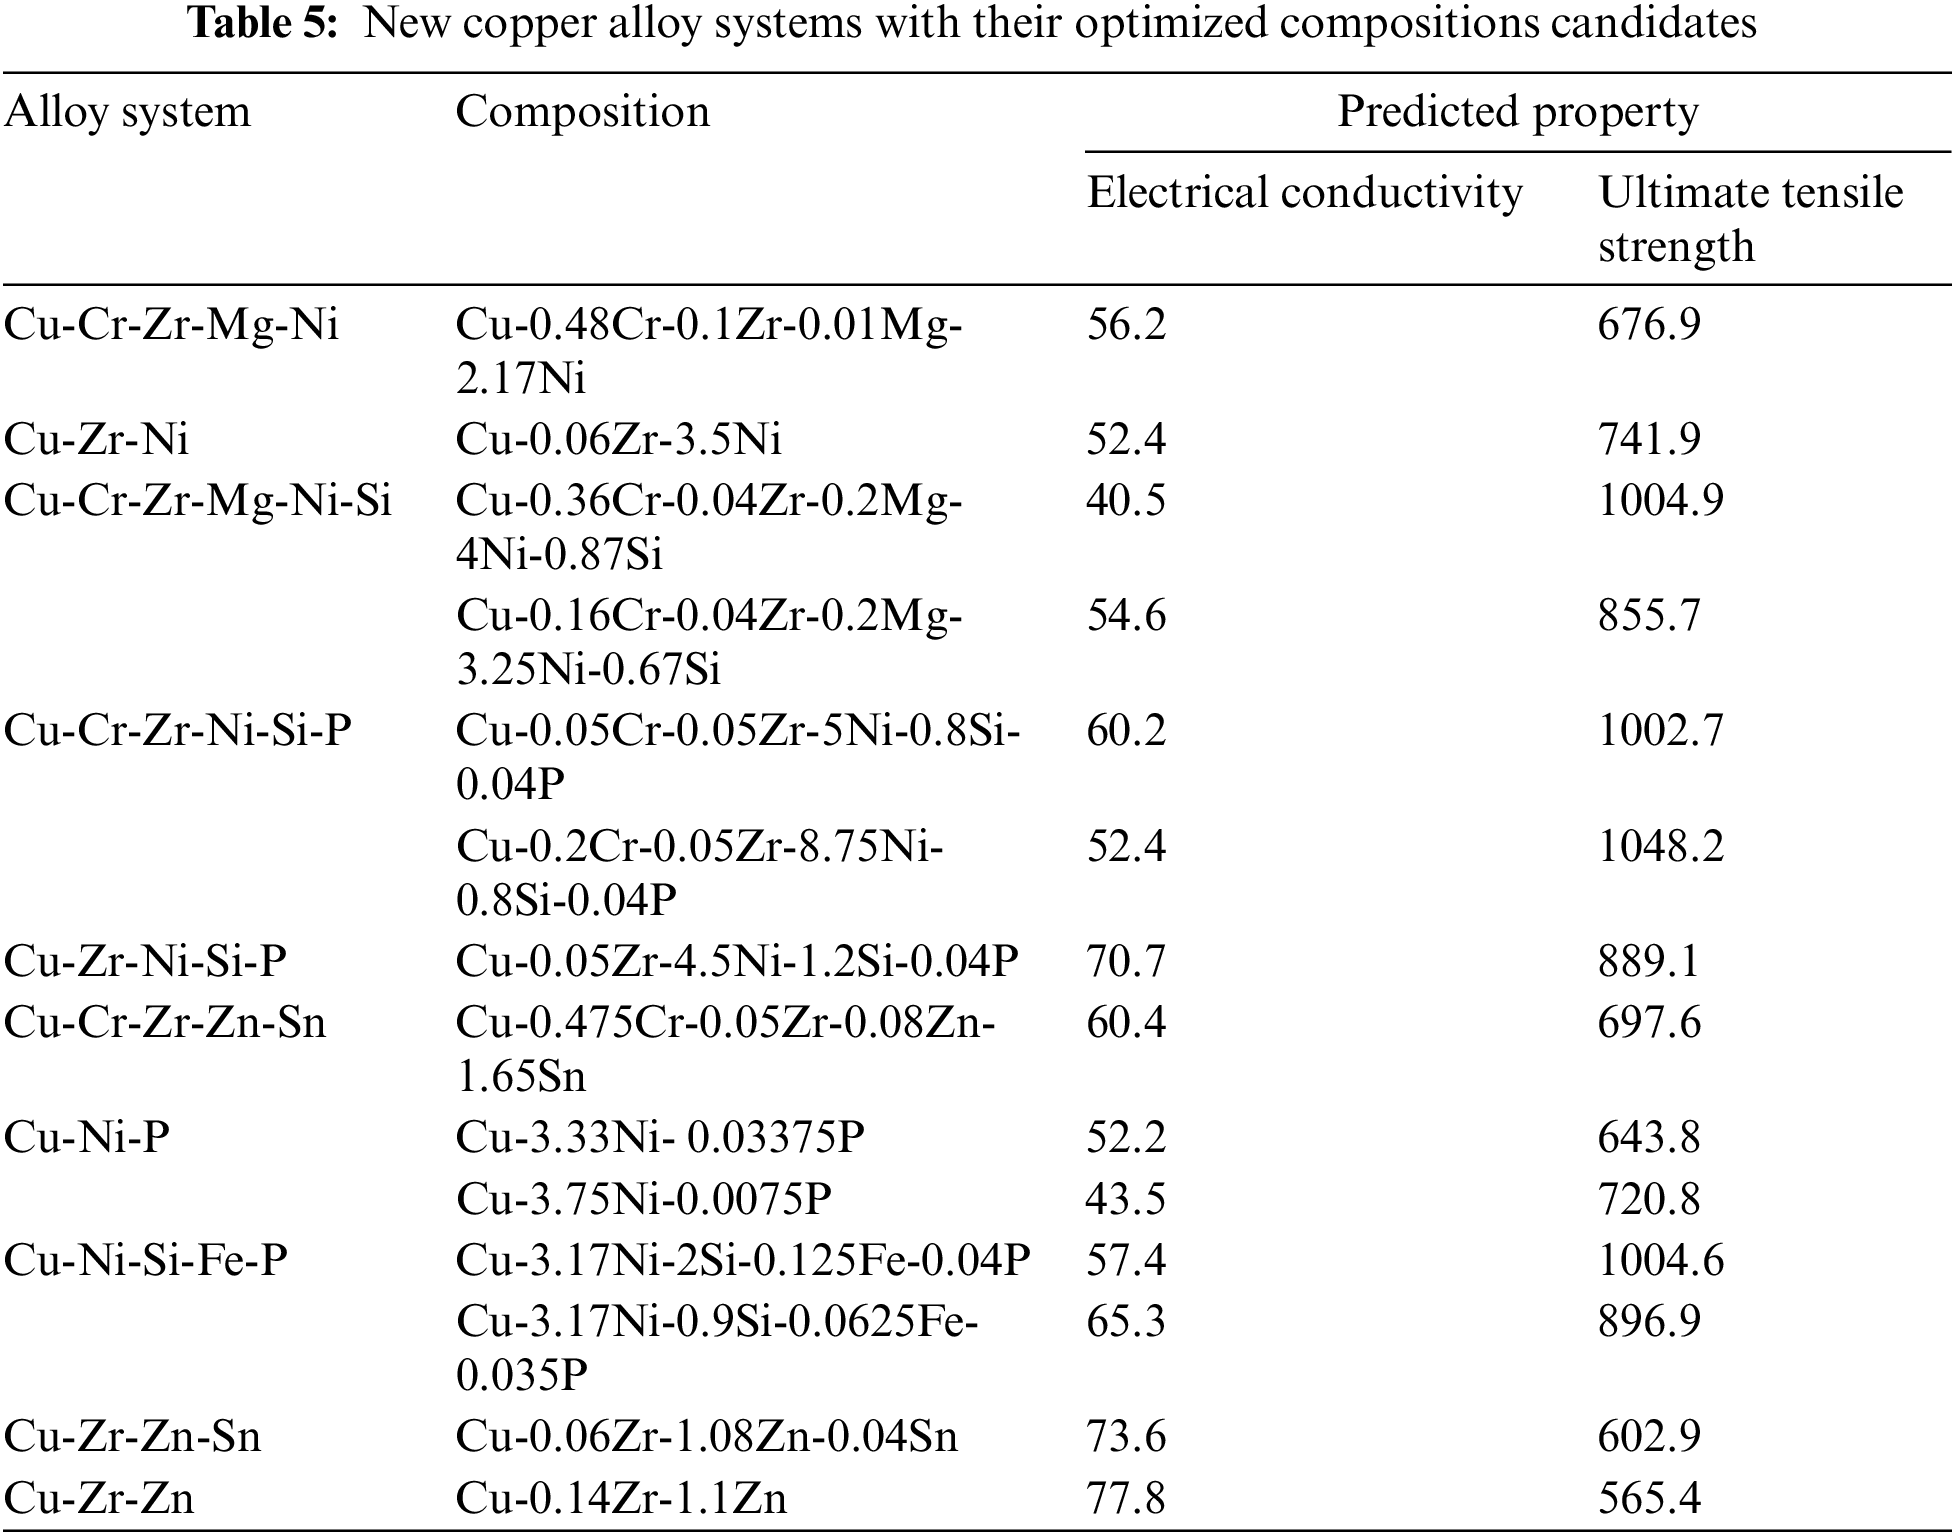
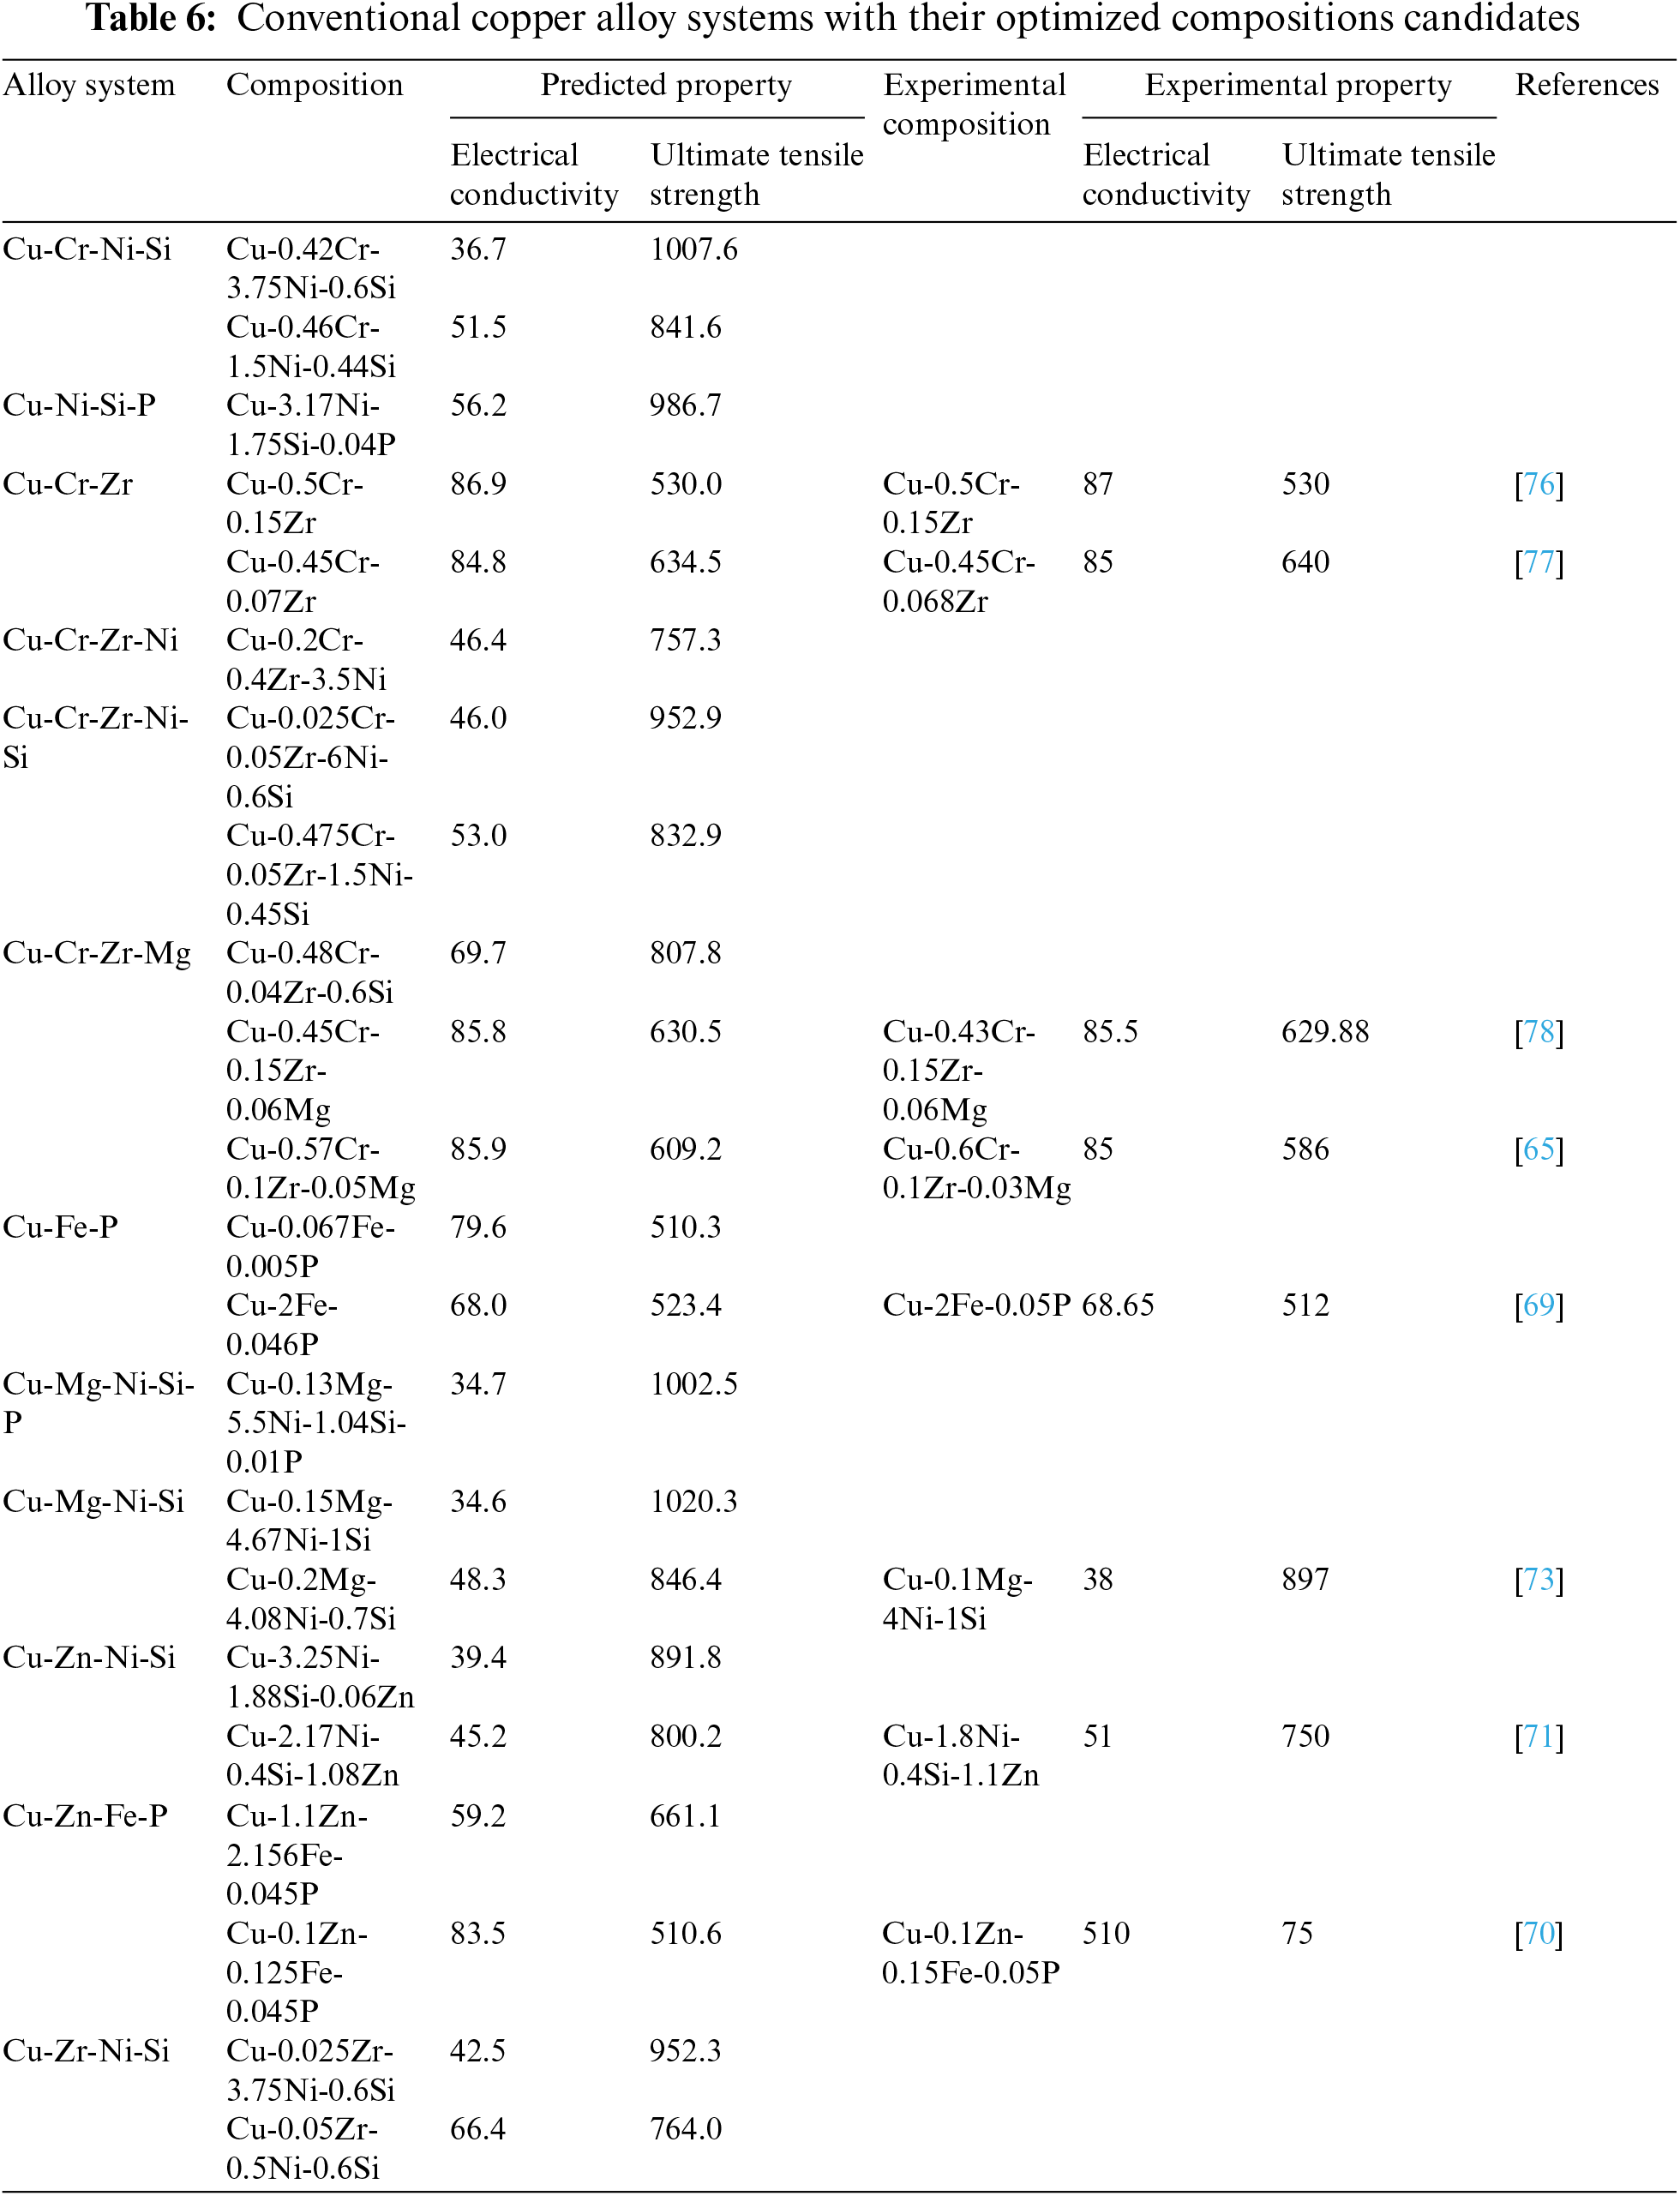
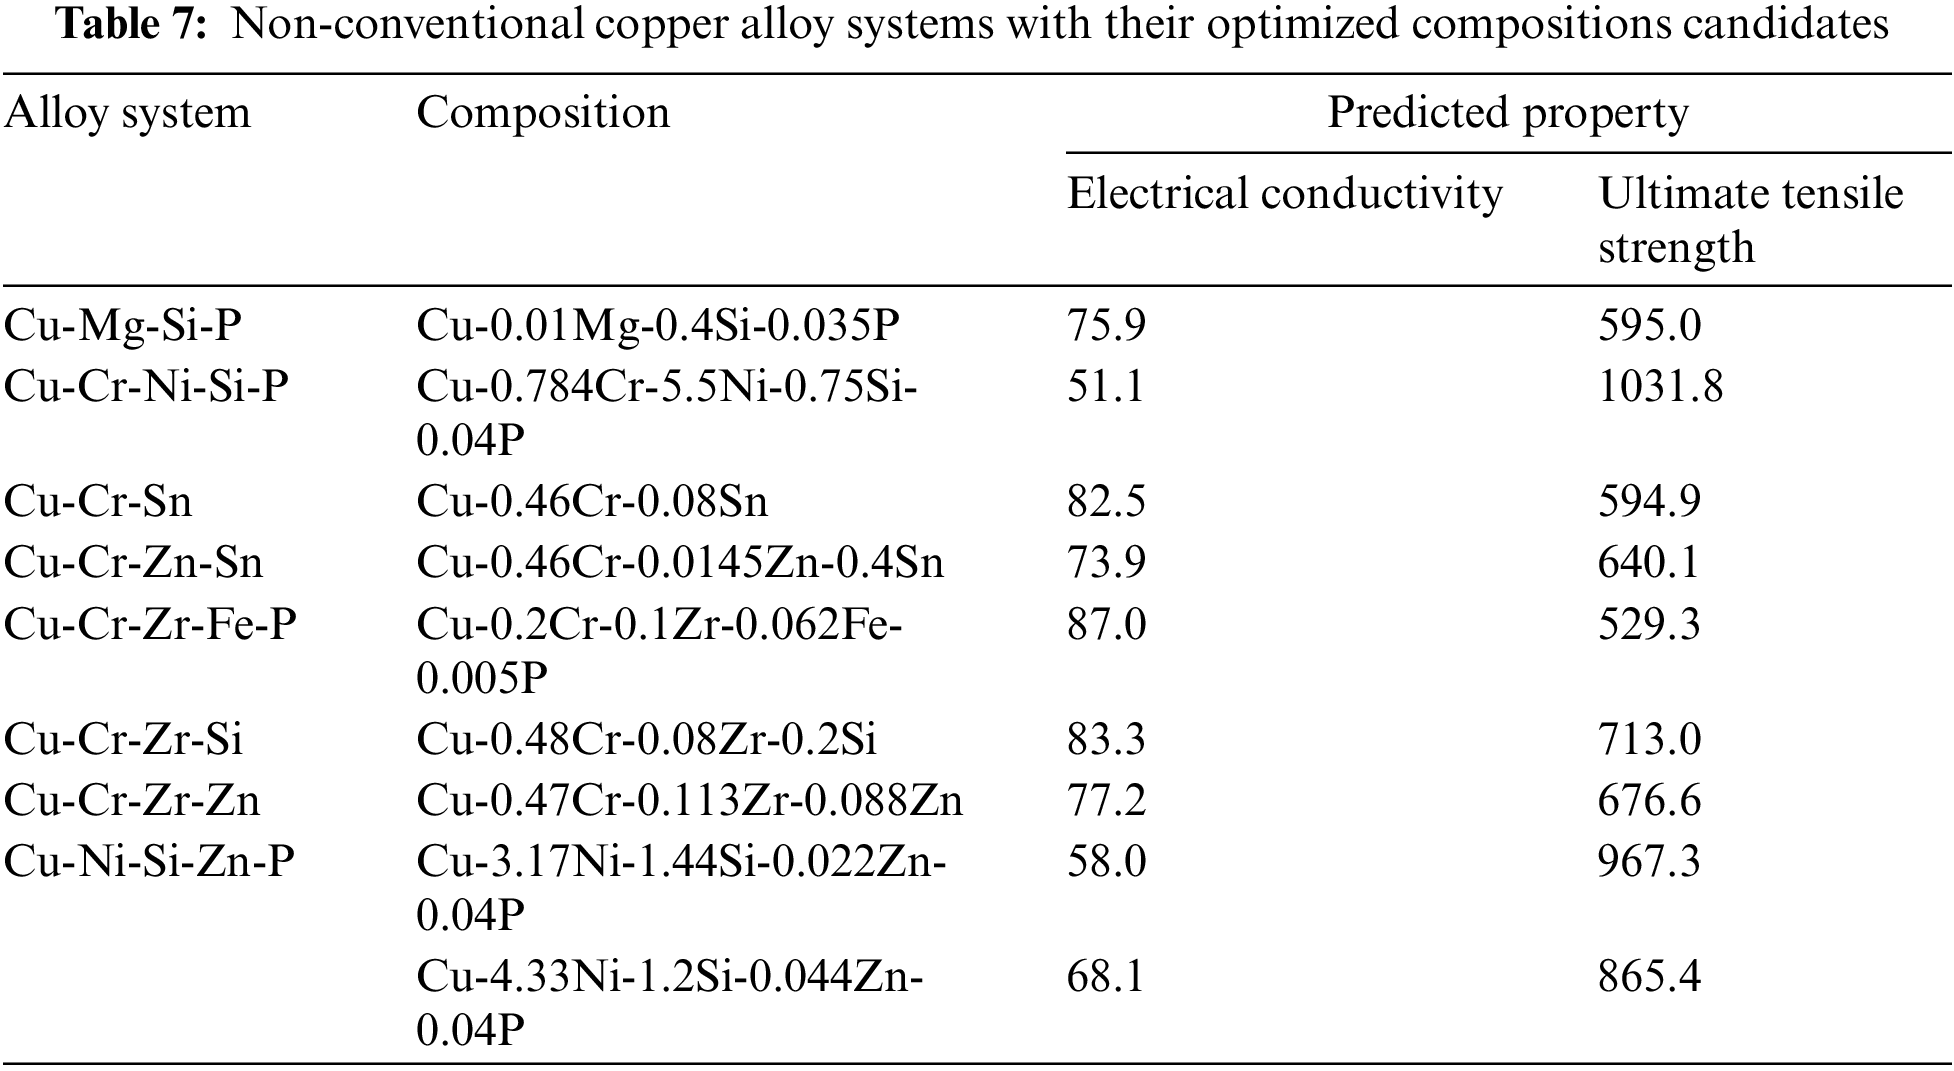
In Table 6, the alloys with composition Cu-0.5Cr-0.15Zr, Cu-0.45Cr-0.07Zr, Cu-0.45Cr-0.15Zr-0.06Mg, Cu-0.57Cr-0.1Zr-0.05Mg, Cu-2Fe-0.046P, Cu-0.2Mg-4.08Ni-0.7Si, Cu-2.17Ni-0.4Si-1.08Zn and Cu-0.1Zn-0.125Fe-0.045P are close to the actual compositions of the respective alloys, prepared and subjected to experimental measurement of properties relevant to this study, namely, Cu-0.5Cr-0.15Zr [76], Cu-0.45Cr-0.068Zr [77], Cu-0.43Cr-0.15Zr-0.06Mg [78], Cu-0.6Cr-0.1Zr-0.03Mg [65], Cu-2Fe-0.05P [79], Cu-0.1Mg-4Ni-1Si [73], Cu-1.8Ni-0.4Si-1.1Zn [71] and Cu-0.1Zn-0.15Fe-0.05P [70]. It is interesting to note that the electrical conductivity and mechanical strength of the latter set of experimentally prepared alloys closely match with less than 2% error with the properties predicted in the present model. In Table 7, Cu-0.46Cr-0.088Sn (EC: 82.5% IACS and UTS: 594.9 MPa) can be mapped by individually examining the effect of Cr and Sn through Cu-0.45Cr (EC: 86% IACS and UTS: 580 MPa) [80] and Cu-0.1Cr-0.1Sn (EC: 90% IACS and UTS: 561 MPa) [68] with less than 10% expected error in property. The first alloy from Table 5, i.e., Cu-0.48Cr-0.1Zr-0.01Mg-2.17Ni is very close to the one reported in the literature with a composition of Cu-0.5Cr-0.15Zr (EC: 87% IACS; UTS: 530 MPa) [76]. The supplement of 2.17%Ni addition in the latter alloy is believed to improve the strength but reduce the conductivity to eventually bring the concerned electrical and mechanical properties closer to their predicted values.
4.3.2 Optimized Composition of Conventional and Non-Conventional Alloys
To differentiate between conventional (more likely to succeed) and non-conventional (not yet explored or proven) alloys, we define those alloys coinciding with less than 1% of the data points in the entire dataspace to be non-conventional systems, while the ones enjoying more than or equal to 1% coincidence with the data points to be conventional alloys in this study. The true potential of these systems is ascertained by optimizing their composition. The actual proportion of elements in each alloy was varied in fine step sizes and thereby, millions of compositions for every Cu-alloy system were generated and their properties were obtained through Model 1.
Then all these compositions were scanned, and every non-dominant composition was plotted forming the Pareto front in the property space of UTS and EC in Fig. 8 to identify the best composition and summarized in Tables 6 and 7 for the so-called conventional and non-conventional alloys, respectively. Many optimized compositions mentioned in these tables are also verified by rigorous comparison with the data reported in the literatures having precisely the same or nearby composition. The Pareto front of these alloys has proved to be a powerful tool for obtaining optimized composition and choosing a potential Cu-alloy for a particular application with the desired set of properties.

Figure 8: Pareto front (optimum variation of electrical conductivity as a function of ultimate tensile strength) for (a) and (b) various conventional or standard Cu-alloys, and (c) and (d) the same for various non-conventional or hypothetical Cu-alloys considered in this study
4.3.3 Property-to-Composition Prediction
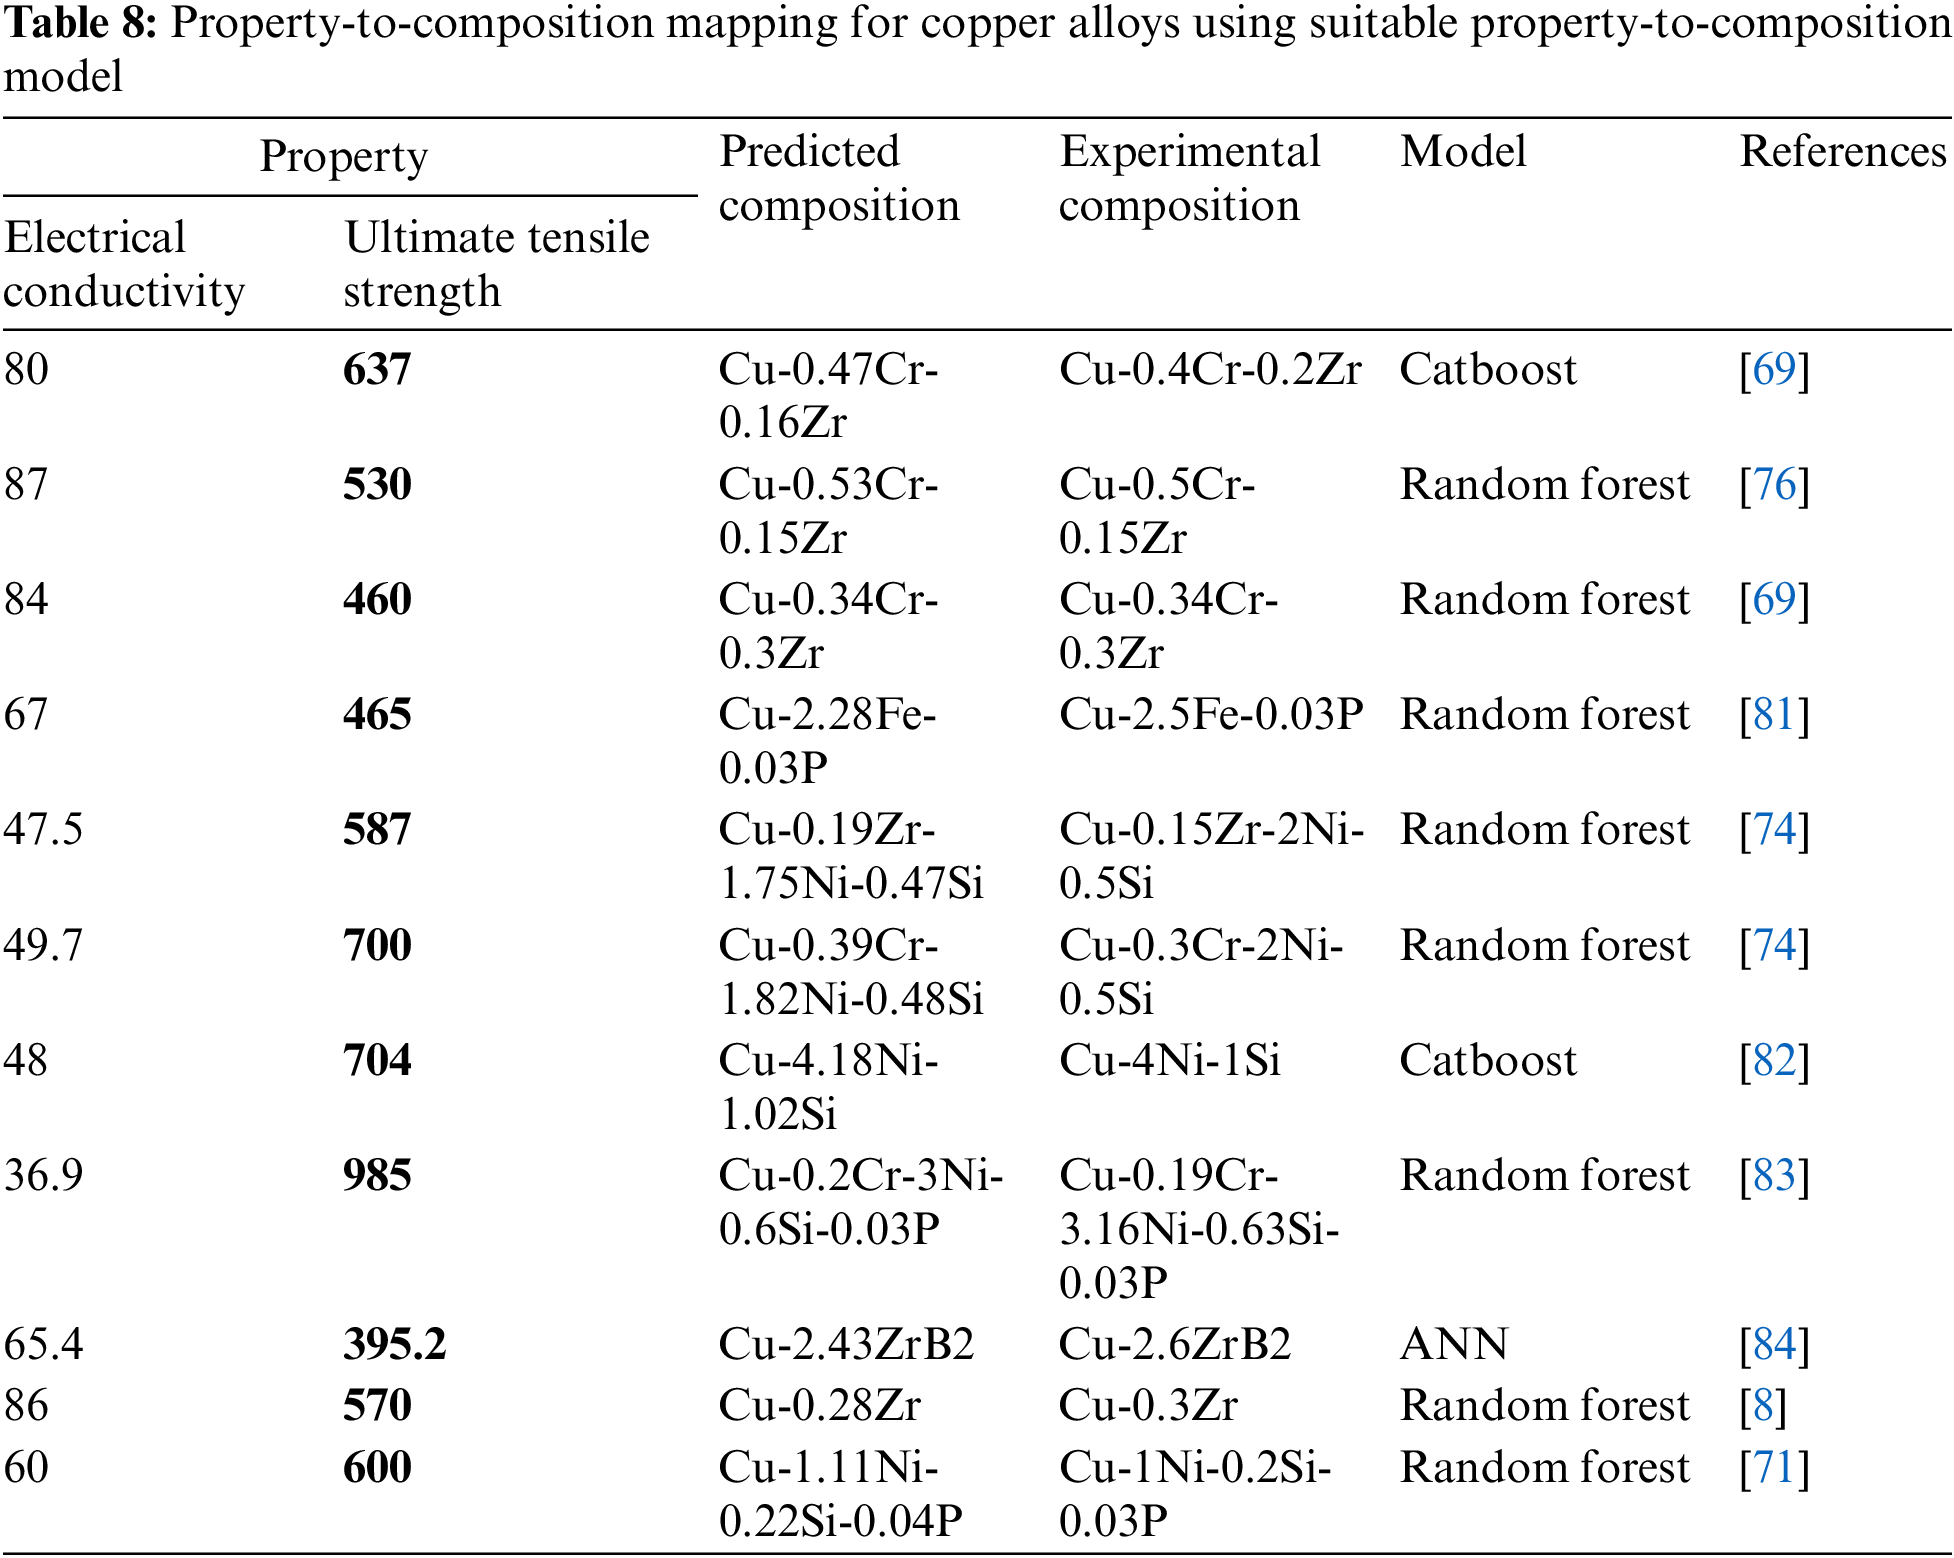
To explore other possibilities or approaches to composition design or alloy selection, a separate model has been developed to select the target alloy composition for the desired set of properties. To serve this objective, the model needs to map and convert low-dimension input into high-dimension output, which is very difficult for the model to learn with a limited number of available data points, which in turn, may lead to inaccuracy in the result or selection. This problem has largely been overcome by using data augmentation techniques with good accuracy using supplementary data. Since a given broad set of electrical and mechanical properties can be achieved via multiple Cu-alloy systems (i.e., there is no unique system), the supplementary data augments multiple candidate alloy systems separately using Model 1. Without data augmentation, accuracy (R2 value) remained consistently below 0.5 for all chosen alloy systems. However, upon integrating data augmentation, accuracy significantly surpassed 0.8 for each constituent within every alloying system, as presented in Table S3. Thus, these newly generated datasets were coupled with suitable ML model for property-to-composition prediction. Several of the predicted alloy compositions using these models, presented in Table 8, are in close agreement with the composition of the experimentally prepared alloys and their relevant properties.
4.3.4 Precipitate Prediction and Solid Solution Analysis
As already stated, the scattering of electrons by solute atoms leads to an increase in resistivity or decrease in electrical conductivity of the solvent matrix or lattice. Obviously, the electrical conductivity of a solid will usually be inversely related to the amount of dissolved alloying elements or solute atoms. More so, this conductivity locally may manifest a strong dependence on the position of the respective solute atoms in the lattice. This is obvious because no two elements with different atomic numbers carry an identical number of electrons and hence, the atomic diameter. That is why, each solute atom in its nearest vicinity creates an expanding (compressive) or collapsing (tensile) strain field around it due to the atomic size mismatch with respect to the concerned solvent or matrix atom. Moreover, local electron density around the solute may change in the case of non-metallic solids with a finite band gap between conduction and valence bands. Thus, the strain field around a solute atom leads to greater electron scattering than what is experienced either in pure solvent lattice or in the case when the solute atoms manage to escape from the matrix in the form of a precipitate phase, coherent or incoherent with the matrix. Therefore, an increase in solute content in the matrix should decrease electrical conductivity. Subsequent precipitation on exceeding the solubility limit should increase the electrical conductivity of the solid as compared to the alloy that could hold the entire amount of solute dissolved in the matrix until its solubility limit.
ML does not directly account for the governing mechanism, physical principles, heat treatment history and processing stages. Nonetheless, ML is a very powerful technique for learning highly complex non-linear interrelations. Therefore, the domain knowledge must be incorporated with model outcomes to extract and interpret the relevant results. Figs. 9a–9c precisely confirm this theory at various levels of doping or alloying of the concerned principal alloying or solute element for the selected set of Cu-alloys enjoying mechanical strengthening primarily due to precipitation of intermetallic phases based on the atomic ratio of: (a) Ni:Si, (b) Cr:Si, and (c) Ni:Sn, respectively. The lines representing the three levels of principal alloying addition (2, 4 and 5 at. %) in the selected set of alloys lying systematically one above the other in Fig. 9 demonstrate that electrical conductivity is inversely related to alloy composition or more precisely, the degree of solute (2, 4 and 5 at. %) added and dissolved in the alloy. Furthermore, the precisely identical variation of slope of these lines for each of these alloys as a function of the volume fraction of concerned precipitates (Ni-Si, Cr-Si and Ni-Sn) in each alloy system at all levels of initial solute addition (2, 4 and 5 at. %) further substantiates the theory of dependence of electrical conductivity on solute content or microstructure (relative volume fraction of phases in an alloy or phase aggregate) principally arising out of the strain due to solvent-solute size mismatch. The marginal deviation in the trend of the curves in Fig. 9 can be attributed to some error associated with the model or primary data set.

Figure 9: Variation of electrical conductivity as a function of the atomic ratio (of 2%, 4% and 5%) between the respective principal elements, namely, (a) Ni:Si, (b) Cr:Si, and (c) Ni:Sn constituting the key intermetallic precipitate phases and providing the main source of strengthening in selected Cu-alloy systems
In the end, an attempt has been made to predict the precipitate stoichiometry (a property very sensitive to material conditions) by taking advantage of electrical conductivity, being a very sensitive property to material conditions. The sharp changes or kinks in the conductivity vs. solute ratios in Fig. 9 coincide with the corresponding phase boundary between the phase fields with solid solution without and with precipitates with specific stoichiometry, typical of the intermetallic phases or compounds with fixed stoichiometry, unlike the solid solution with continuously varying solute content. In other words, the formation of such an intermetallic phase or compound should account for the sharp change in electrical conductivity across the composition limit or boundary between the existence of solid solution and the evolution of precipitation of phases with fixed stoichiometry due to a sharp decrease in the degree of electron scattering in the matrix. It is, for this reason, electrical conductivity is considered an appropriate tool or property to determine the solvus point or line of a solid alloy.
In Figs. 9a–9c, three different lines demarcate different alloying levels (2, 4, 5 at. %). The same line shows different atomic ratios of solute elements while maintaining the same total alloying content. Fig. 9a shows the variation of electrical conductivity with the atomic ratio of Ni:Si. When Ni:Si increases from 0 to 2, the electrical conductivity increases continuously, touching the maxima at the Ni:Si value of 2. This is because more and more Si from the solid solution comes out with some Ni as a precipitate. For Ni:Si > 2 electrical conductivity decreases because solute ratios (Ni:Si) are no more in perfect precipitate stoichiometry and extra Ni goes into the solid solution. Therefore, the peak at atomic ratio 2 signifies the precipitation of Ni2Si in the system, aligning with existing literature findings [85,86]. Similarly, Figs. 9b and 9c show the variation of electrical conductivity with the atomic ratio of Cr:Si and Ni:Sn, respectively. When the Cr:Si and Ni:Sn atomic ratio increases from 0 to 3, electrical conductivity continuously rises because of some precipitation of Cr-Si and Ni-Sn. But after 3, electrical conductivity stops increasing and therefore, this point of optima at 3 signifies the respective precipitation of Cr3Si and Ni3Sn in the system, which is in good agreement with the precipitate stoichiometry reported in the available literatures [85,87].
Figs. 10a–10c show the variation of electrical conductivity and ultimate tensile strength with the amount of Ni, Si and Zn present in the concerned alloys. All these elements have one common feature-they all form solid solution with copper in the chosen range (shown in Table 4). This is in contrast with the trend revealed in Fig. 9 where systems reach the solubility limit and undergo precipitation. One more noticeable difference between Figs. 9 and 10 is that the precipitation demarcates or coincides with the rise in electrical conductivity while the same trend is absent in the case of systems showing existence of only solid solution. As we have already pointed out, in the case of solid solution alloys, continuous increase in strain field due to increase in the alloying element concentration causes a higher degree of scattering of the electron flow, which poses an impediment to the dislocation gliding, and hence, there is continuous decrease of electrical conductivity and increase in ultimate tensile strength. Thus, this correlation presented in Fig. 10 can provide qualitative insight into the phases forming in the system when the concerned principal alloying element is more than the solubility limit.

Figure 10: Variation of electrical conductivity (blue line) and ultimate tensile strength (orange line) as a function of the weight percent of the principal alloying elements of (a) Ni, (b) Si, and (c) Zn in selected Cu-alloys
In summary, this study showcases the successful application of the machine learning principles for designing copper alloys with an optimum combination of mechanical strength and electrical conductivity, for copper conductors and switch gear applications. To achieve a high success rate for composition-to-property prediction, we developed a genetic algorithm-assisted Catboost machine-learning model with more than 93% accuracy. This model is very promising as it is able to foretell the optimized property combination for the given composition of copper alloy. The results predicted by the present model were thoroughly verified through careful comparison with nearly 40 sets of relevant experimental data reported in the literature; these 40 data points were not used in training or developing this model. Subsequently, several new high-performance conventional and non-conventional copper alloys were proposed by coupling the concept of data augmentation and Pareto front refinement that could offer excellent combination of strength and conductivity as follows: Cu-0.05Cr-0.05Zr-5Ni-0.8Si-0.04P (1002 MPa, 60.2% IACS), Cu-0.42Cr-3.0Ni-0.55Si (919 MPa, 45% IACS), Cu-3.17Ni-1.44Si-0.022Zn-0.04P (967 MPa, 58% IACS), and Cu-3.17Ni-1.75Si-0.04P (987 MPa, 56.2% IACS)). Further, to enhance the ease and pace of alloy design, property-to-composition models were also developed with high accuracy using data augmentation and data segregation. In addition, Model 2 was successfully employed for predicting the evolution of expected precipitates like Cr3Si, Ni2Si and Ni3Sn from a given alloy.
This study further demonstrates that machine learning methods can serve as a proof-of-concept for designing not only high-performance copper alloys but can also provide a generic foundation for the development of any high-performance metallic alloys. However, the accuracy and comprehensiveness of the machine learning model can be further enhanced by incorporating the process, thermal and other parameters as input which in turn can provide better insight into the overall performance of the alloys, including defining the underlying mechanism and microstructural evolution.
Acknowledgement: The authors are thankful for the supercomputing facility (Param Shakti) provided by IIT Kharagpur, established under the National Supercomputing Mission of the Government of India. One of the authors (I.M.) would like to acknowledge partial financial support from DST-Sponsored Projects ‘JCP’ and ‘DGL’, the Ministry of Education-Supported SPARC Scheme Project ‘LSL_SKI’, and ISRO Sponsored Project ‘ONC’.
Funding Statement: The authors received no specific funding for this study.
Author Contributions: Study conception and design: P. Khandelwal, Harshit, I. Manna; data collection: P. Khandelwal; analysis of results: P. Khandelwal, Harshit; interpretation of results: P. Khandelwal, Harshit, I. Manna; draft manuscript preparation: P. Khandelwal, Harshit, I. Manna. All authors reviewed the results and approved the final version of the manuscript.
Availability of Data and Materials: The database is available in the supplementary material.
Conflicts of Interest: The authors declare that they have no known competing financial interests or personal relationships that could have appeared to influence the work reported in this paper.
Supplementary Materials: The supplementary material is available online at https://doi.org/10.32604/cmc.2024.042752.
References
1. Y. Pan et al., “Fabrication, mechanical properties and electrical conductivity of Al2O3 reinforced Cu/CNTs composites,” J. Alloy. Compd., vol. 782, pp. 1015–1023, 2019. [Google Scholar]
2. C. Zou et al., “Effect of La addition on the particle characteristics, mechanical and electrical properties of in situ Cu-TiB2 composites,” J. Alloy. Compd., vol. 687, pp. 312–319, 2016. [Google Scholar]
3. C. Zhu et al., “Effect of ECAP combined cold working on mechanical properties and electrical conductivity of conform-produced Cu-Mg alloys,” J. Alloy. Compd., vol. 582, pp. 135–140, 2014. [Google Scholar]
4. X. F. Li, A. P. Dong, L. T. Wang, Z. Yu, and L. Meng, “Thermal stability of heavily drawn Cu-0.4 wt.%Cr-0.12 wt.%Zr-0.02 wt.%Si-0.05 wt.%Mg,” J. Alloy. Compd., vol. 509, pp. 4092–4097, 2011. [Google Scholar]
5. A. Y. Khereddine et al., “Microstructures and textures of a Cu-Ni-Si alloy processed by high-pressure torsion,” J. Alloy. Compd., vol. 574, pp. 361–367, 2013. [Google Scholar]
6. J. H. Ahn et al., “Simple optimization for strength and conductivity of Cu-Ni-Si alloy with discontinuous precipitation,” Mater. Charact., vol. 184, pp. 111605, 2022. doi: 10.1016/j.matchar.2021.111605. [Google Scholar] [CrossRef]
7. C. W. Lu, H. S. Wang, H. G. Chen, J. J. Wu, and M. F. Chiang, “Effects of heat treatment and Nd: YAG laser repair welding parameters on the microstructure and properties of a Cu-Ni–Si-Cr mold alloy,” Mater. Sci. Eng. A, vol. 799, pp. 140342, 2021. [Google Scholar]
8. C. Zou et al., “A nano-micro dual-scale particulate-reinforced copper matrix composite with high strength, high electrical conductivity and superior wear resistance,” RSC Adv., vol. 8, no. 54, pp. 30777–30782, 2018. doi: 10.1039/C8RA06020G. [Google Scholar] [PubMed] [CrossRef]
9. M. S. Ozerdem and S. Kolukisa, “Artificial neural network approach to predict the mechanical properties of Cu-Sn-Pb-Zn-Ni cast alloys,” Mater. Des., vol. 30, no. 3, pp. 764–769, 2009. doi: 10.1016/j.matdes.2008.05.019. [Google Scholar] [CrossRef]
10. C. Wang, H. Fu, L. Jiang, D. Xue, and J. Xie, “A property-oriented design strategy for high performance copper alloys via machine learning,” npj Comput. Mater., vol. 5, no. 1, pp. 87, 2019. doi: 10.1038/s41524-019-0227-7. [Google Scholar] [CrossRef]
11. J. C. Pang, Q. Q. Duan, S. D. Wu, S. X. Li, and Z. F. Zhang, “Fatigue strengths of Cu-Be alloy with high tensile strengths,” Scripta Mater., vol. 63, no. 11, pp. 1085–1088, 2010. doi: 10.1016/j.scriptamat.2010.08.009. [Google Scholar] [CrossRef]
12. S. V. Dobatkin, J. Gubicza, D. V. Shangina, N. R. Bochvar, and N. Y. Tabachkova, “High strength and good electrical conductivity in Cu-Cr alloys processed by severe plastic deformation,” Mater. Lett., vol. 153, no. 8, pp. 5–9, 2015. doi: 10.1016/j.matlet.2015.03.144. [Google Scholar] [CrossRef]
13. Y. Jia, Y. Pang, J. Yi, Q. Lei, Z. Li and Z. Xiao, “Effects of pre-aging on microstructure and properties of Cu-Ni-Si alloys,” J. Alloy. Compd., vol. 942, pp. 169033, 2023. doi: 10.1016/j.jallcom.2023.169033. [Google Scholar] [CrossRef]
14. W. Liao, H. Qiang, W. Song, Y. Hu, and C. Zhang, “Effect and mechanism of room temperature rolling, cryogenic rolling and heat treatment on mechanical properties and electrical conductivity of Cu-Ni-Si alloy with continuous directional solidification,” J. Alloy. Compd., vol. 949, no. 4, pp. 169748, 2023. doi: 10.1016/j.jallcom.2023.169748. [Google Scholar] [CrossRef]
15. C. T. Wu et al., “Machine learning recommends affordable new Ti alloy with bone-like modulus,” Mater. Today, vol. 34, pp. 41–50, 2020. doi: 10.1016/j.mattod.2019.08.008. [Google Scholar] [CrossRef]
16. J. Feng, S. Liang, K. Song, X. Guo, and Y. Zhou, “Micro-nano dual-scale particle-reinforced TiB2/Cu-0.5Cr composites prepared by vacuum arc melting,” J. Mater. Eng. Perform., vol. 29, no. 5, pp. 3353–3360, 2020. doi: 10.1007/s11665-020-04850-6. [Google Scholar] [CrossRef]
17. J. Yi et al., “Precipitation behavior of Cu-3.0Ni-0.72Si alloy,” Acta Mater., vol. 166, no. 1, pp. 261–270, 2019. doi: 10.1016/j.actamat.2018.12.047. [Google Scholar] [CrossRef]
18. H. Zhang, H. Fu, S. Zhu, W. Yong, and J. Xie, “Machine learning assisted composition effective design for precipitation strengthened copper alloys,” Acta Mater., vol. 215, pp. 117118, 2021. doi: 10.1016/j.actamat.2021.117118. [Google Scholar] [CrossRef]
19. E. A. Choi et al., “Enhancement of strength and electrical conductivity for hypo-eutectic Cu-12Ag alloy,” J. Alloy. Compd., vol. 931, pp. 167506, 2023. doi: 10.1016/j.jallcom.2022.167506. [Google Scholar] [CrossRef]
20. Z. Lai, K. Peng, B. Gao, Y. Mai, and X. Jie, “Achieving high strength and high electrical conductivity in Cu-Cr-Zr alloy by modifying shear banding during rolling,” J. Alloy. Compd., vol. 958, pp. 170402, 2023. doi: 10.1016/j.jallcom.2023.170402. [Google Scholar] [CrossRef]
21. L. Huang et al., “Relationship between microstructure and properties of high-strength Cu-Ti-Cr alloys during aging,” J. Alloy. Compd., vol. 942, no. 3, pp. 168865, 2023. doi: 10.1016/j.jallcom.2023.168865. [Google Scholar] [CrossRef]
22. J. Kang et al., “Discontinuous precipitation in a Cu-10Ni-1Si alloy with ultra-high strength, high shock absorption, and good stress relaxation resistance,” J. Alloy. Compd., vol. 934, pp. 167676, 2023. doi: 10.1016/j.jallcom.2022.167676. [Google Scholar] [CrossRef]
23. M. Zhou et al., “Enhanced mechanical properties and high electrical conductivity of copper alloy via dual-nanoprecipitation,” Mater. Charact., vol. 195, no. 5, pp. 112494, 2023. doi: 10.1016/j.matchar.2022.112494. [Google Scholar] [CrossRef]
24. B. Xie, Q. Fang, J. Li, and P. K. Liaw, “Predicting the optimum compositions of high-performance Cu-Zn alloys via machine learning,” J. Mater. Res., vol. 35, no. 20, pp. 2709–2717, 2020. doi: 10.1557/jmr.2020.258. [Google Scholar] [CrossRef]
25. Z. H. Deng et al., “Machine-learning-assisted prediction of the mechanical properties of Cu-Al alloy,” Int. J. Miner., Metall. Mater., vol. 27, no. 3, pp. 362–373, 2020. doi: 10.1007/s12613-019-1894-6. [Google Scholar] [CrossRef]
26. S. Pan et al., “Accelerated discovery of high-performance Cu-Ni-Co-Si alloys through machine learning,” Mater. Des., vol. 209, no. 4, pp. 109929, 2021. doi: 10.1016/j.matdes.2021.109929. [Google Scholar] [CrossRef]
27. Q. Zhao, H. Yang, J. Liu, H. Zhou, H. Wang and W. Yang, “Machine learning-assisted discovery of strong and conductive Cu alloys: Data mining from discarded experiments and physical features,” Mater. Des., vol. 197, no. 2, pp. 109248, 2021. doi: 10.1016/j.matdes.2020.109248. [Google Scholar] [CrossRef]
28. S. Pan et al., “Customized development of promising Cu-Cr-Ni-Co-Si alloys enabled by integrated machine learning and characterization,” Acta Mater., vol. 243, no. 1, pp. 118484, 2023. doi: 10.1016/j.actamat.2022.118484. [Google Scholar] [CrossRef]
29. M. Azimi and G. H. Akbari, “Development of nano-structure Cu-Zr alloys by the mechanical alloying process,” J. Alloy. Compd., vol. 509, no. 1, pp. 27–32, 2011. doi: 10.1016/j.jallcom.2010.08.071. [Google Scholar] [CrossRef]
30. C. Wen et al., “Machine learning assisted design of high entropy alloys with desired property,” Acta Mater., vol. 170, pp. 109–117, 2019. doi: 10.1016/j.actamat.2019.03.010. [Google Scholar] [CrossRef]
31. S. Zhang, H. Zhu, L. Zhang, W. Zhang, H. Yang and X. Zeng, “Microstructure and properties of high strength and high conductivity Cu-Cr alloy components fabricated by high power selective laser melting,” Mater. Lett., vol. 237, pp. 306–309, 2019. doi: 10.1016/j.matlet.2018.11.118. [Google Scholar] [CrossRef]
32. D. P. Lu, J. Wang, W. J. Zeng, Y. Liu, L. Lu and B. D. Sun, “Study on high-strength and high-conductivity Cu-Fe–P alloys,” Mater. Sci. Eng. A., vol. 421, pp. 254–259, 2006. [Google Scholar]
33. Y. Zhou et al., “Effect of annealing temperature on dual-structure coexisting precipitates in Cu-2.18Fe-0.03P alloy and softening mechanism at high temperature,” J. Mater. Sci., vol. 57, no. 44, pp. 1–18, 2022. doi: 10.1007/s10853-022-07910-5. [Google Scholar] [CrossRef]
34. S. Zhang, H. Zhu, L. Zhang, W. Zhang, H. Yang and X. Zeng, “Microstructure and properties of high strength and high conductivity Cu-Cr alloy components fabricated by high power selective laser melting,” Mater. Lett., vol. 237, pp. 306–309, 2019. [Google Scholar]
35. Z. Zhang et al., “Achieving high strength and high conductivity of Cu-6 wt%Ag sheets by controlling the aging cooling rate,” Mater., vol. 16, no. 10, pp. 3632, 2023. [Google Scholar]
36. B. Zhang, S. Zhang, H. Yang, D. Peng, Y. Wang and H. Zhu, “Investigating the influence of the scanning rotation angle on the microstructure and properties of LPBFed CuCr0.8 alloy,” J. Manuf. Process., vol. 84, pp. 1150–1161, 2022. [Google Scholar]
37. W. Lu, R. Xiao, J. Yang, H. Li, and W. Zhang, “Data mining-aided materials discovery and optimization,” J. Materiomics, vol. 3, pp. 191–201, 2017. [Google Scholar]
38. B. Tang et al., “Machine learning-guided synthesis of advanced inorganic materials,” Mater. Today, vol. 41, pp. 72–80, 2020. [Google Scholar]
39. P. C. Jennings, S. Lysgaard, J. S. Hummelshøj, T. Vegge, and T. Bligaard, “Genetic algorithms for computational materials discovery accelerated by machine learning,” npj Comput. Mater., vol. 5, no. 1, pp. 46, 2019. doi: 10.1038/s41524-019-0181-4. [Google Scholar] [CrossRef]
40. J. W. Lee, W. B. Park, B. Do Lee, S. Kim, N. H. Goo and K. S. Sohn, “Dirty engineering data-driven inverse prediction machine learning model,” Sci. Rep., vol. 10, no. 1, pp. 20443, 2020. doi: 10.1038/s41598-020-77575-0. [Google Scholar] [PubMed] [CrossRef]
41. J. Schmidt, M. R. G. Marques, S. Botti, and M. A. L. Marques, “Recent advances and applications of machine learning in solid-state materials science,” npj Comput. Mater., vol. 5, no. 1, pp. 83, 2019. doi: 10.1038/s41524-019-0221-0. [Google Scholar] [CrossRef]
42. G. Zhiyu, F. Zhao, S. Gao, and T. Xia, “Machine learning prediction of hardness in solid solution high entropy alloys,” Mater. Today Commun., vol. 37, pp. 107102, 2023. doi: 10.1016/j.mtcomm.2023.107102. [Google Scholar] [CrossRef]
43. A. Debnath and W. F. Reinhart, “Investigating representation schemes for surrogate modeling of high entropy alloys,” Comput. Mater. Sci., vol. 230, pp. 112460, 2023. doi: 10.1016/j.commatsci.2023.112460. [Google Scholar] [CrossRef]
44. C. Yang, C. Ren, Y. Jia, G. Wang, M. Li and W. Lu, “A machine learning-based alloy design system to facilitate the rational design of high entropy alloys with enhanced hardness,” Acta Mater., vol. 222, pp. 117431, 2021. doi: 10.1016/j.actamat.2021.117431. [Google Scholar] [CrossRef]
45. F. Ren et al., “Accelerated discovery of metallic glasses through iteration of machine learning and high-throughput experiments,” Sci. Adv., vol. 4, no. 4, pp. 2337, 2018. doi: 10.1126/sciadv.aaq1566. [Google Scholar] [PubMed] [CrossRef]
46. X. Huang, C. Jin, C. Zhang, H. Zhang, and H. Fu, “Machine learning assisted modelling and design of solid solution hardened high entropy alloys,” Mater. Des., vol. 211, no. 20, pp. 110177, 2021. doi: 10.1016/j.matdes.2021.110177. [Google Scholar] [CrossRef]
47. S. Li, S. Li, D. Liu, R. Zou, and Z. Yang, “Hardness prediction of high entropy alloys with machine learning and material descriptors selection by improved genetic algorithm,” Comput. Mater. Sci., vol. 205, no. 7715, pp. 111185, 2022. doi: 10.1016/j.commatsci.2022.111185. [Google Scholar] [CrossRef]
48. U. Bhandari, M. R. Rafi, C. Zhang, and S. Yang, “Yield strength prediction of high-entropy alloys using machine learning,” Mater. Today Commun., vol. 26, no. 5, pp. 101871, 2021. doi: 10.1016/j.mtcomm.2020.101871. [Google Scholar] [CrossRef]
49. Y. V. Krishna, U. K. Jaiswal, and R. M. Rahul, “Machine learning approach to predict new multiphase high entropy alloys,” Scr. Mater., vol. 197, pp. 113804, 2021. doi: 10.1016/j.scriptamat.2021.113804. [Google Scholar] [CrossRef]
50. T. Zheng et al., “Tailoring nanoprecipitates for ultra-strong high-entropy alloys via machine learning and prestrain aging,” J. Mater. Sci. Technol., vol. 69, no. 6430, pp. 156–167, 2021. doi: 10.1016/j.jmst.2020.07.009. [Google Scholar] [CrossRef]
51. D. Xue, P. V. Balachandran, J. Hogden, J. Theiler, D. Xue and T. Lookman, “Accelerated search for materials with targeted properties by adaptive design,” Nat. Commun., vol. 7, no. 1, pp. 1–9, 2016. doi: 10.1038/ncomms11241. [Google Scholar] [PubMed] [CrossRef]
52. H. Zhang et al., “Dramatically enhanced combination of ultimate tensile strength and electric conductivity of alloys via machine learning screening,” Acta Mater., vol. 200, pp. 803–810, 2020. doi: 10.1016/j.actamat.2020.09.068. [Google Scholar] [CrossRef]
53. V. Soni, A. Sharma, and V. Singh, “A critical review on nature inspired optimization algorithms,” IOP Conf. Ser.: Mater. Sci. Eng., vol. 1099, no. 1, pp. 012055, 2021. doi: 10.1088/1757-899X/1099/1/012055. [Google Scholar] [CrossRef]
54. S. F. Fang, M. P. Wang, W. H. Qi, and F. Zheng, “Hybrid genetic algorithms and support vector regression in forecasting atmospheric corrosion of metallic materials,” Comput. Mater. Sci., vol. 44, no. 2, pp. 647–655, 2008. doi: 10.1016/j.commatsci.2008.05.010. [Google Scholar] [CrossRef]
55. N. S. Reddy, J. Krishnaiah, H. B. Young, and J. S. Lee, “Design of medium carbon steels by computational intelligence techniques,” Comput. Mater. Sci., vol. 101, pp. 120–126, 2015. doi: 10.1016/j.commatsci.2015.01.031. [Google Scholar] [CrossRef]
56. C. Cortes and V. Vapnik, “Support-vector networks,” Mach. Learn., vol. 20, no. 3, pp. 273–297, 1995. doi: 10.1007/BF00994018. [Google Scholar] [CrossRef]
57. X. Wu et al., “Top 10 algorithms in data mining,” Knowl. Inf. Syst., vol. 14, no. 1, pp. 1–37, 2008. doi: 10.1007/s10115-007-0114-2. [Google Scholar] [CrossRef]
58. L. Breiman, “Random forests,” Mach. Learn., vol. 45, no. 1, pp. 5–32, 2001. doi: 10.1023/A:1010933404324. [Google Scholar] [CrossRef]
59. T. Chen and C. Guestrin, “XGBoost: A scalable tree boosting system,” in Proc. ACM SIGKDD Int. Conf. Knowl. Discov. Data Mining, Assoc. Comput. Mach., 2016, pp. 785–794. [Google Scholar]
60. Y. Q. Qin, Design, Preparation and Properties of High Strength and High Conductivity Cu-Cr-Zr Alloy. Hefei Univ. of Technology, Hefei, China, 2013. [Google Scholar]
61. L. Prokhorenkova, G. Gusev, A. Vorobev, A. V. Dorogush, and A. Gulin, “CatBoost: Unbiased boosting with categorical features,” 2023. Accessed: May 01, 2023 [Online]. Available: https://github.com/catboost/catboost [Google Scholar]
62. W. S. McCulloch and W. Pitts, “A logical calculus of the ideas immanent in nervous activity,” Bull. Math. Biophys., vol. 5, no. 4, pp. 115–133, 1943. doi: 10.1007/BF02478259. [Google Scholar] [CrossRef]
63. G. Ke et al., “LightGBM: A highly efficient gradient boosting decision tree,” Adv. Neural Inf. Process. Syst., vol. 30, pp. 3146–3154, 2017. [Google Scholar]
64. J. H. Friedman, “Greedy function approximation: A gradient boosting machine,” Ann. Stat., pp. 1189–1232, 2001. doi: 10.1214/aos/1013203451. [Google Scholar] [CrossRef]
65. S. Mu, New Technology and Theoretical Study on the Preparation of High Strength and High Conductivity Cu-Cr-Zr Alloys. Central South University, Changsha, China, 2008. [Google Scholar]
66. S. Jia et al., “A kind of high-performance copper-based alloy material and preparation method thereof,” Henan Univ. of Science and Technology, Luoyang, China, 2009 (In Chinese). [Google Scholar]
67. H. Guojie et al., “CuCrZr alloy with high strength and high conductivity, and preparation and processing method thereof,” Beijing General Research Institute for Non Ferrous Metals, Beijing, China, 2012 (In Chinese). [Google Scholar]
68. X. Zhan, Thermo-Dynamic Calculation and Experimental Research on Non-Vacuum Melting of Cu-Cr-Zr Alloy. Jiangxi University of Science and Technology, Ganzhou, China, 2009. [Google Scholar]
69. L. Peng, Study on Microstructure Evolution of Cu-Cr-Zr System Alloys and Interaction Mechanism between Alloying Elements. General Research Institute for Nonferrous Metals, Beijing, China, 2014. [Google Scholar]
70. H. Zhang, Study on High Temperature hot Deformation Behavior of Cu-Fe-P. Central South Univ., Changsha, China, 2004. [Google Scholar]
71. Y. Zhang, M. Lu, and Y. Hu, “Development and study of Cu-Ni-Si alloy for lead frame,” Shanghai Nonferrous Metals, vol. 4, pp. 177–182, 2014. [Google Scholar]
72. W. Zhu et al., “Integrated circuit lead frame copper strip and preparation method thereof,” Guizhou GAOKE COPPER Industry Co., Ltd., Guiyang, China, 2008 (In Chinese). [Google Scholar]
73. Z. Pan, M. Wang, and Z. Li, “Effect of trace elements on properties of Cu-Ni-Si alloy,” Mater. Review, vol. 21, pp. 86–89, 2007. [Google Scholar]
74. W. Wang et al., “Effects of Cr and Zr additions on microstructure and properties of Cu-Ni-Si alloys,” Mater. Sci. Eng. A, vol. 673, pp. 378–390, 2016. doi: 10.1016/j.msea.2016.07.021. [Google Scholar] [CrossRef]
75. C. Yang, C. Xiang, K. Aaron, X. Cao, G. Mu and Y. Tang, “High temperature copper alloy for lead frame and its making process,” China Nonferrous Metals Processing Technology Co. Ltd., Suzhou, China, 2009 (In Chinese). [Google Scholar]
76. C. Watanabe, R. Monzen, and K. Tazaki, “Mechanical properties of Cu-Cr system alloys with and without Zr and Ag,” J. Mater. Sci., vol. 43, no. 3, pp. 813–819, 2008. doi: 10.1007/s10853-007-2159-8. [Google Scholar] [CrossRef]
77. H. Wang, Investigation on Preparation, Microstructures and Properties of High Strength High Conductivity Copper Alloys. Southeast Univ., Jiangsu, China, 2010. [Google Scholar]
78. F. Lu, Study on Properties of Cu-Cr-Zr-Mg Alloys under Different Two-stage Aging Systems. Jiangxi Univ. of Science and Technology, Ganzhou, China, 2009. [Google Scholar]
79. Q. Dong, “Effects of two step aging on the microstructures and properties of Cu-Fe-P alloy,” Heat Treat. Met., vol. 30, pp. 182–184, 2005. [Google Scholar]
80. H. G. Wang, Investigation on Preparation, Microstructures and Properties of High Strength High Conductivity Copper Alloys. Southeast Univ., Jiangsu, China, 2010. [Google Scholar]
81. D. F. Wang, B. X. Kang, and B. H. Tian, “Effect of aging treatment on microhardness and electrical conductivity of Cu-Fe-P alloy,” J. Luoyang Inst. Technol., vol. 3, pp. 10–12, 2002. [Google Scholar]
82. D. Li et al., “Minor-alloyed Cu-Ni-Si alloys with high hardness and electric conductivity designed by a cluster formula approach,” Prog. Nat. Sci.: Mater. Int., vol. 27, no. 4, pp. 467–473, 2017. doi: 10.1016/j.pnsc.2017.06.006. [Google Scholar] [CrossRef]
83. L. Wang, Y. Sun, and X. Fu, “Microstructure and properties of Cu-Ni-Si based alloys for lead frame,” J. Southeast Univ. (Natural Science Edition), vol. 35, pp. 729–732, 2005. [Google Scholar]
84. X. Fan, X. Huang, Q. Liu, H. Ding, H. Wang and C. Hao, “The microstructures and properties of in-situ ZrB2 reinforced Cu matrix composites,” Results Phys., vol. 14, pp. 102494, 2019. doi: 10.1016/j.rinp.2019.102494. [Google Scholar] [CrossRef]
85. X. Meng, G. Xie, W. Xue, Y. Fu, R. Wang and X. Liu, “The precipitation behavior of a Cu-Ni-Si alloy with Cr addition prepared by heating-cooling combined mold (HCCM) continuous casting,” Mater., vol. 15, no. 13, pp. 4521, 2022. doi: 10.3390/ma15134521. [Google Scholar] [PubMed] [CrossRef]
86. W. Liao, Y. Hu, and Q. Liu, “High strength and high electrical conductivity C70250 copper alloy with fibrous structure reinforced by high density, multi-scale nano-precipitates and dislocation,” Mater. Sci. Eng.: A, vol. 846, no. 3, pp. 143283, 2022. doi: 10.1016/j.msea.2022.143283. [Google Scholar] [CrossRef]
87. Y. Jiang, Z. Li, Z. Xiao, Y. Xing, Y. Zhang and M. Fang, “Microstructure and properties of a Cu-Ni-Sn alloy treated by two-stage thermomechanical processing,” J. Miner., Met. Mater. Soc., vol. 71, no. 8, pp. 2734–2741, 2019. doi: 10.1007/s11837-019-03606-5. [Google Scholar] [CrossRef]
Cite This Article
 Copyright © 2024 The Author(s). Published by Tech Science Press.
This work is licensed under a Creative Commons Attribution 4.0 International License , which permits unrestricted use, distribution, and reproduction in any medium, provided the original work is properly cited.
 Downloads
 Citation Tools