
 Submit a Paper
 Propose a Special lssue
 Open Access
ARTICLE

Smartphone-Based Wi-Fi Analysis for Bus Passenger Counting
Department of Computer Science, College of Computer Engineering and Sciences, Prince Sattam Bin Abdulaziz University, Al-Kharj, 16278, Saudi Arabia
* Corresponding Author: Mohammed Alatiyyah. Email:
(This article belongs to the Special Issue: Edge Computing in Advancing the Capabilities of Smart Cities)
Computers, Materials & Continua 2024, 79(1), 875-907. https://doi.org/10.32604/cmc.2024.047790
Received 17 November 2023; Accepted 21 February 2024; Issue published 25 April 2024
 View Full Text
 Download PDF
Abstract
In the contemporary era of technological advancement, smartphones have become an indispensable part of individuals’ daily lives, exerting a pervasive influence. This paper presents an innovative approach to passenger counting on buses through the analysis of Wi-Fi signals emanating from passengers’ mobile devices. The study seeks to scrutinize the reliability of digital Wi-Fi environments in predicting bus occupancy levels, thereby addressing a crucial aspect of public transportation. The proposed system comprises three crucial elements: Signal capture, data filtration, and the calculation and estimation of passenger numbers. The pivotal findings reveal that the system demonstrates commendable accuracy in estimating passenger counts under moderate-crowding conditions, with an average deviation of 20% from the ground truth and an accuracy rate ranging from 90% to 100%. This underscores its efficacy in scenarios characterized by moderate levels of crowding. However, in densely crowded conditions, the system exhibits a tendency to overestimate passenger numbers, occasionally doubling the actual count. While acknowledging the need for further research to enhance accuracy in crowded conditions, this study presents a pioneering avenue to address a significant concern in public transportation. The implications of the findings are poised to contribute substantially to the enhancement of bus operations and service quality.Keywords
Public transportation systems play a crucial role in modern cities, providing an essential mode of travel for millions of people every day. As such, local governments and transportation agencies have invested significant resources in improving the quality and efficiency of these systems [1]. On the other hand, the ubiquitous presence of smartphones in society, facilitated by rapid technological advancements, has engendered an increasingly integrated digital landscape. Formerly an uncommon possession among individuals aged sixty-five and above, smartphones are now widely adopted across different age groups, including the elderly [2]. These devices have evolved into miniature computers with multifaceted functionalities, encompassing features such as global positioning system (GPS), compass, and light sensors. Consequently, there has been a surge of interest in utilizing smartphones as research tools to gather information about individuals’ behaviors and actions across various domains [3–7]. Furthermore, the pervasive utilization of digital devices has revolutionized human interactions with their surroundings. Residential spaces, workplaces, and even automobiles have become “smart,” with individuals becoming increasingly reliant on digital technologies in their daily routines. This shift has prompted vigorous competition among corporations, governments, and organizations to adopt innovative technologies and maintain a competitive edge.
Recently, the proliferation of open digital environments (ODEs) has presented exciting research prospects, particularly within the realm of public transportation [8–11]. Despite the availability of real-time bus schedules and timings, the issue of overcrowding in buses remains prevalent [10]. In fact, the installation costs of traditional people-counting on buses are prohibitively high, prompting the exploration of an alternative solution involving the analysis of the digital Wi-Fi environment on the bus. Particularly, the installation and maintenance expenses associated with deploying sensors on buses are substantial. Consequently, the suggested solution is to utilize more affordable tools to capture and analyze signals emitted by passengers’ devices [11]. As such, this paper specifically focuses on ODEs, which encompass public spaces like buses, shopping malls, streets, and events where unexpected data is abundant. The objective of this study is to investigate whether examining the Wi-Fi environment can yield a reasonably accurate estimation of the passenger count at a reduced cost. The analysis of signals emitted by passengers’ devices aims to address several inquiries surrounding passenger behaviors on buses, including the prevalence of Wi-Fi usage among passengers, the incidence of smartphone utilization during public transportation, and the development of methods to differentiate signals originating from inside vs. outside the bus. Ultimately, this research endeavor strives to enhance our comprehension of the intricate dynamics within the digital environment and its profound impact on our daily lives.
Based on the aforementioned discussion, this study presents a novel approach for analyzing Wi-Fi signals emitted by smartphones on buses, employing Wireshark—an advanced network analyzer. It discusses the utilization of media access control (MAC) addresses as unique identifiers and the acquisition of signals from passengers’ devices through probe requests. The key contributions of this paper can be highlighted as follows:
• A novel approach using smartphone Wi-Fi signals to estimate passenger count in buses. This approach is more affordable and scalable than traditional methods using people-counting sensors.
• The development of a signal acquisition and filtering pipeline using Wireshark. This pipeline helps to eliminate background noise and non-mobile device signals, improving the accuracy of the passenger count estimation.
• An algorithm that utilizes received signal strength indication (RSSI) values to estimate the number of passengers on board. This algorithm is based on signal attenuation patterns and takes into account the bus’s structure and layout.
The remainder of this paper is organized as follows. Section 2 presents an in-depth review of relevant literature. Section 3 outlines the proposed methodology, while Section 4 presents the experimental results. Section 5 is dedicated to the discussion of the findings, and finally, the paper is concluded in Section 6.
2.1 Classification Digital Environments
Video surveillance has limitations due to privacy concerns and high costs, which has led researchers to develop alternative techniques to achieve similar results. Zeng et al. [12] employed Wi-Fi signals to analyze shopper behavior in a retail store, achieving high accuracy by analyzing the Channel State Information (CSI) of Wi-Fi signals. CSI refers to the propagation of signals from source to receiver. Maekawa et al. [13] developed a method to detect train congestion using Bluetooth RSSI, resulting in an algorithm with 83% accuracy. Scholz et al. [14] introduced a fingerprinting-based system called wireless discrimination (WiDisc) for classifying subjects into three categories, tall, medium, and small, achieving up to 76% accuracy. Both studies utilized RSSI, but from different sources, which were Bluetooth and Wi-Fi. Furthermore, Wei et al. [15] investigated the effectiveness of Radio Frequency Interference (RFI) on detecting human activities using device-free CSI-based recognition techniques and demonstrated that RFI improved detection rates by up to 10%. de Sanctis et al. [16] developed an infrastructure-free human activity recognition system called WiFi beacon-enabled camera (WIBECAM) which analyzed PSD estimation from Wi-Fi Beacon messages and a video camera, achieving an average accuracy of 0.73 to 1 in different locations. These studies reveal different methods of detecting human actions or patterns in various scenarios.
This section delves into the significance of smartphone location detection in indoor environments and presents various approaches that researchers have explored to improve the accuracy of indoor localization. While GPS sensors are widely used for location detection, they may lack sufficient accuracy in indoor environments, which has motivated researchers to explore alternative approaches [17]. However, the focus of previous works on improving accuracy has generally overlooked the simplicity of development. Recent research on determining indoor location involved different approaches, such as sensors, algorithms, or a combination of both [18–22]. A notable study by Lymberopoulos et al. [18] evaluated 22 indoor localization systems through a comprehensive testing procedure under identical conditions. The results indicated that location errors varied from 0.72 to 10.22 m, with only three teams achieving less than 2 m accuracy, and the highest accuracy being obtained by Team 1 (0.72 m) using the 2.4 GHz Phase Offset technique. Another study by Chen et al. [17] proposed a distributed bear-localization (BearLoc) framework, that integrates sensors, algorithms, and applications, aiming to streamline the development process while minimizing overhead. The Binding concept in BearLoc allows algorithms to use data from different sources to generate a location estimate that is passed to applications or other components. The findings indicate that BearLoc reduced developers’ lines of code by 60% with acceptable network delay.
Furthermore, Sen et al. [19] proposed a cooperative ultra-wideband positioning indoors (CUPID2.0), that enhances the previously proposed CUPID system’s accuracy. CUPID2.0 leverages Time-of-Flight-based localization with signal strength to boost accuracy, and the system was tested in six sites with over 2.5 million locations, achieving approximately 1.8 m error localization with infrastructure-free implementation. In contrast, Meng et al. [20] focused on semantic translation of coordinates, enabling the recognition of store names by scanning Wi-Fi access points. Their prototype system demonstrated over 90% accuracy in identifying store names, paving the way for innovations beneficial to both shoppers and store owners.
Kocakusak et al. [22] established a model database (MD), consisting of 750 RSSI values collected from 96 different locations, with a view to improving location performance. Despite this, their study found the mean error to be around 3.24 m. However, the results obtained by Kocakusak et al. were not as strong as those reported by Lymberopoulos et al. [18] and Sen et al. [19]. Drawing a comparison between these studies, it appears that the proposed approach by Kocakusak et al. [22] may not be sufficient for achieving highly accurate location tracking. Nonetheless, it is important to note that further studies may be needed to explore other potential solutions to this problem. In fact, existing literature indicates that while location detection is critical for many applications, the methods for implementing indoor localization and the solutions’ accuracy vary considerably. Therefore, a detailed investigation of indoor positioning techniques is necessary for effective implementation of location-based solutions.
Detecting crowds is essential in providing efficient public transport services. To achieve accurate information on passenger density and congestion levels, researchers have explored alternative methods to traditional sensors. Lathia et al. noted that while public transport information systems are useful, they lack qualitative information about passengers [23]. To address this, Lathia et al. investigated the use of smartphones and social media to provide passengers with real-time updates in London, England. Their findings suggest that passengers are more likely to share positive experiences and report crowded or delayed services before announcements are made by the transit authority [23]. Similarly, Zhou et al. developed a system using cellular signals to monitor urban traffic in Singapore [24]. Their experiments revealed that weather conditions could have an impact on the accuracy of their system, but ultimately showed the feasibility of achieving a fine-grained estimate of traffic density using cellular signals [24]. By exploring alternative methods to detecting crowds, these studies offer innovative solutions to improving public transport services and enhancing passenger experience.
This section explores recent studies on the use and analysis of Wi-Fi signal in different domains. Freudiger [25] conducted a study to investigate Wi-Fi probe requests from popular smartphones in various settings. The author aimed to identify how different factors of mobile devices influence the frequency of probing, as well as the number of broadcasts. The results showed that smartphones send probe requests at a rate of 55 times per hour. Similarly, Schaub et al. [26] developed a system called privacy calendar (PriCal) that captures phone signals through MAC addresses. The system displays the appropriate calendar for each group depending on their MAC address when entering the office. By saving the MAC addresses beforehand, newcomers are shown the normal calendar. This system allows for more efficient use of time management, reducing the chances of double-bookings or missed appointments. In another study, Barbera et al. [27] aimed to capture probe requests from devices in public for three months. They collected over 11 million probes from over 160,000 different devices and presented their results in graphs. The authors emphasized the important sociological aspects that can be learned from analyzing these probes in a large crowd setting. Moreover, Fukuzaki et al. [28] developed a system to analyze pedestrian flow using Wi-Fi probe requests. The study confirmed that the system can effectively analyze pedestrian flow, and the authors suggest generating more accurate person-trip data for future work. This could serve as an important factor in analyzing pedestrian mobility trends in crowded spaces. On the other hand, a Wi-Fi-based device-free self-quarantine monitoring system using channel state information (CSI) derived from Wi-Fi signals was proposed for room occupancy detection and human activity recognition [29], offering an alternative to existing camera or wearable device-based systems. Meanwhile, Magsino et al. [30] presented a multi-story indoor localization scheme using multiple Wi-Fi Received Signal Strength Indicator (RSSI) signals, enabling tracking within a residential household. It can be observed that, these studies demonstrate the potential of Wi-Fi probe requests as a tool for gathering important data for a variety of purposes. Whether it is understanding social behavior, improving time management, detection and tracking, or analyzing pedestrian flow, the use of these probes shows great promise for future research.
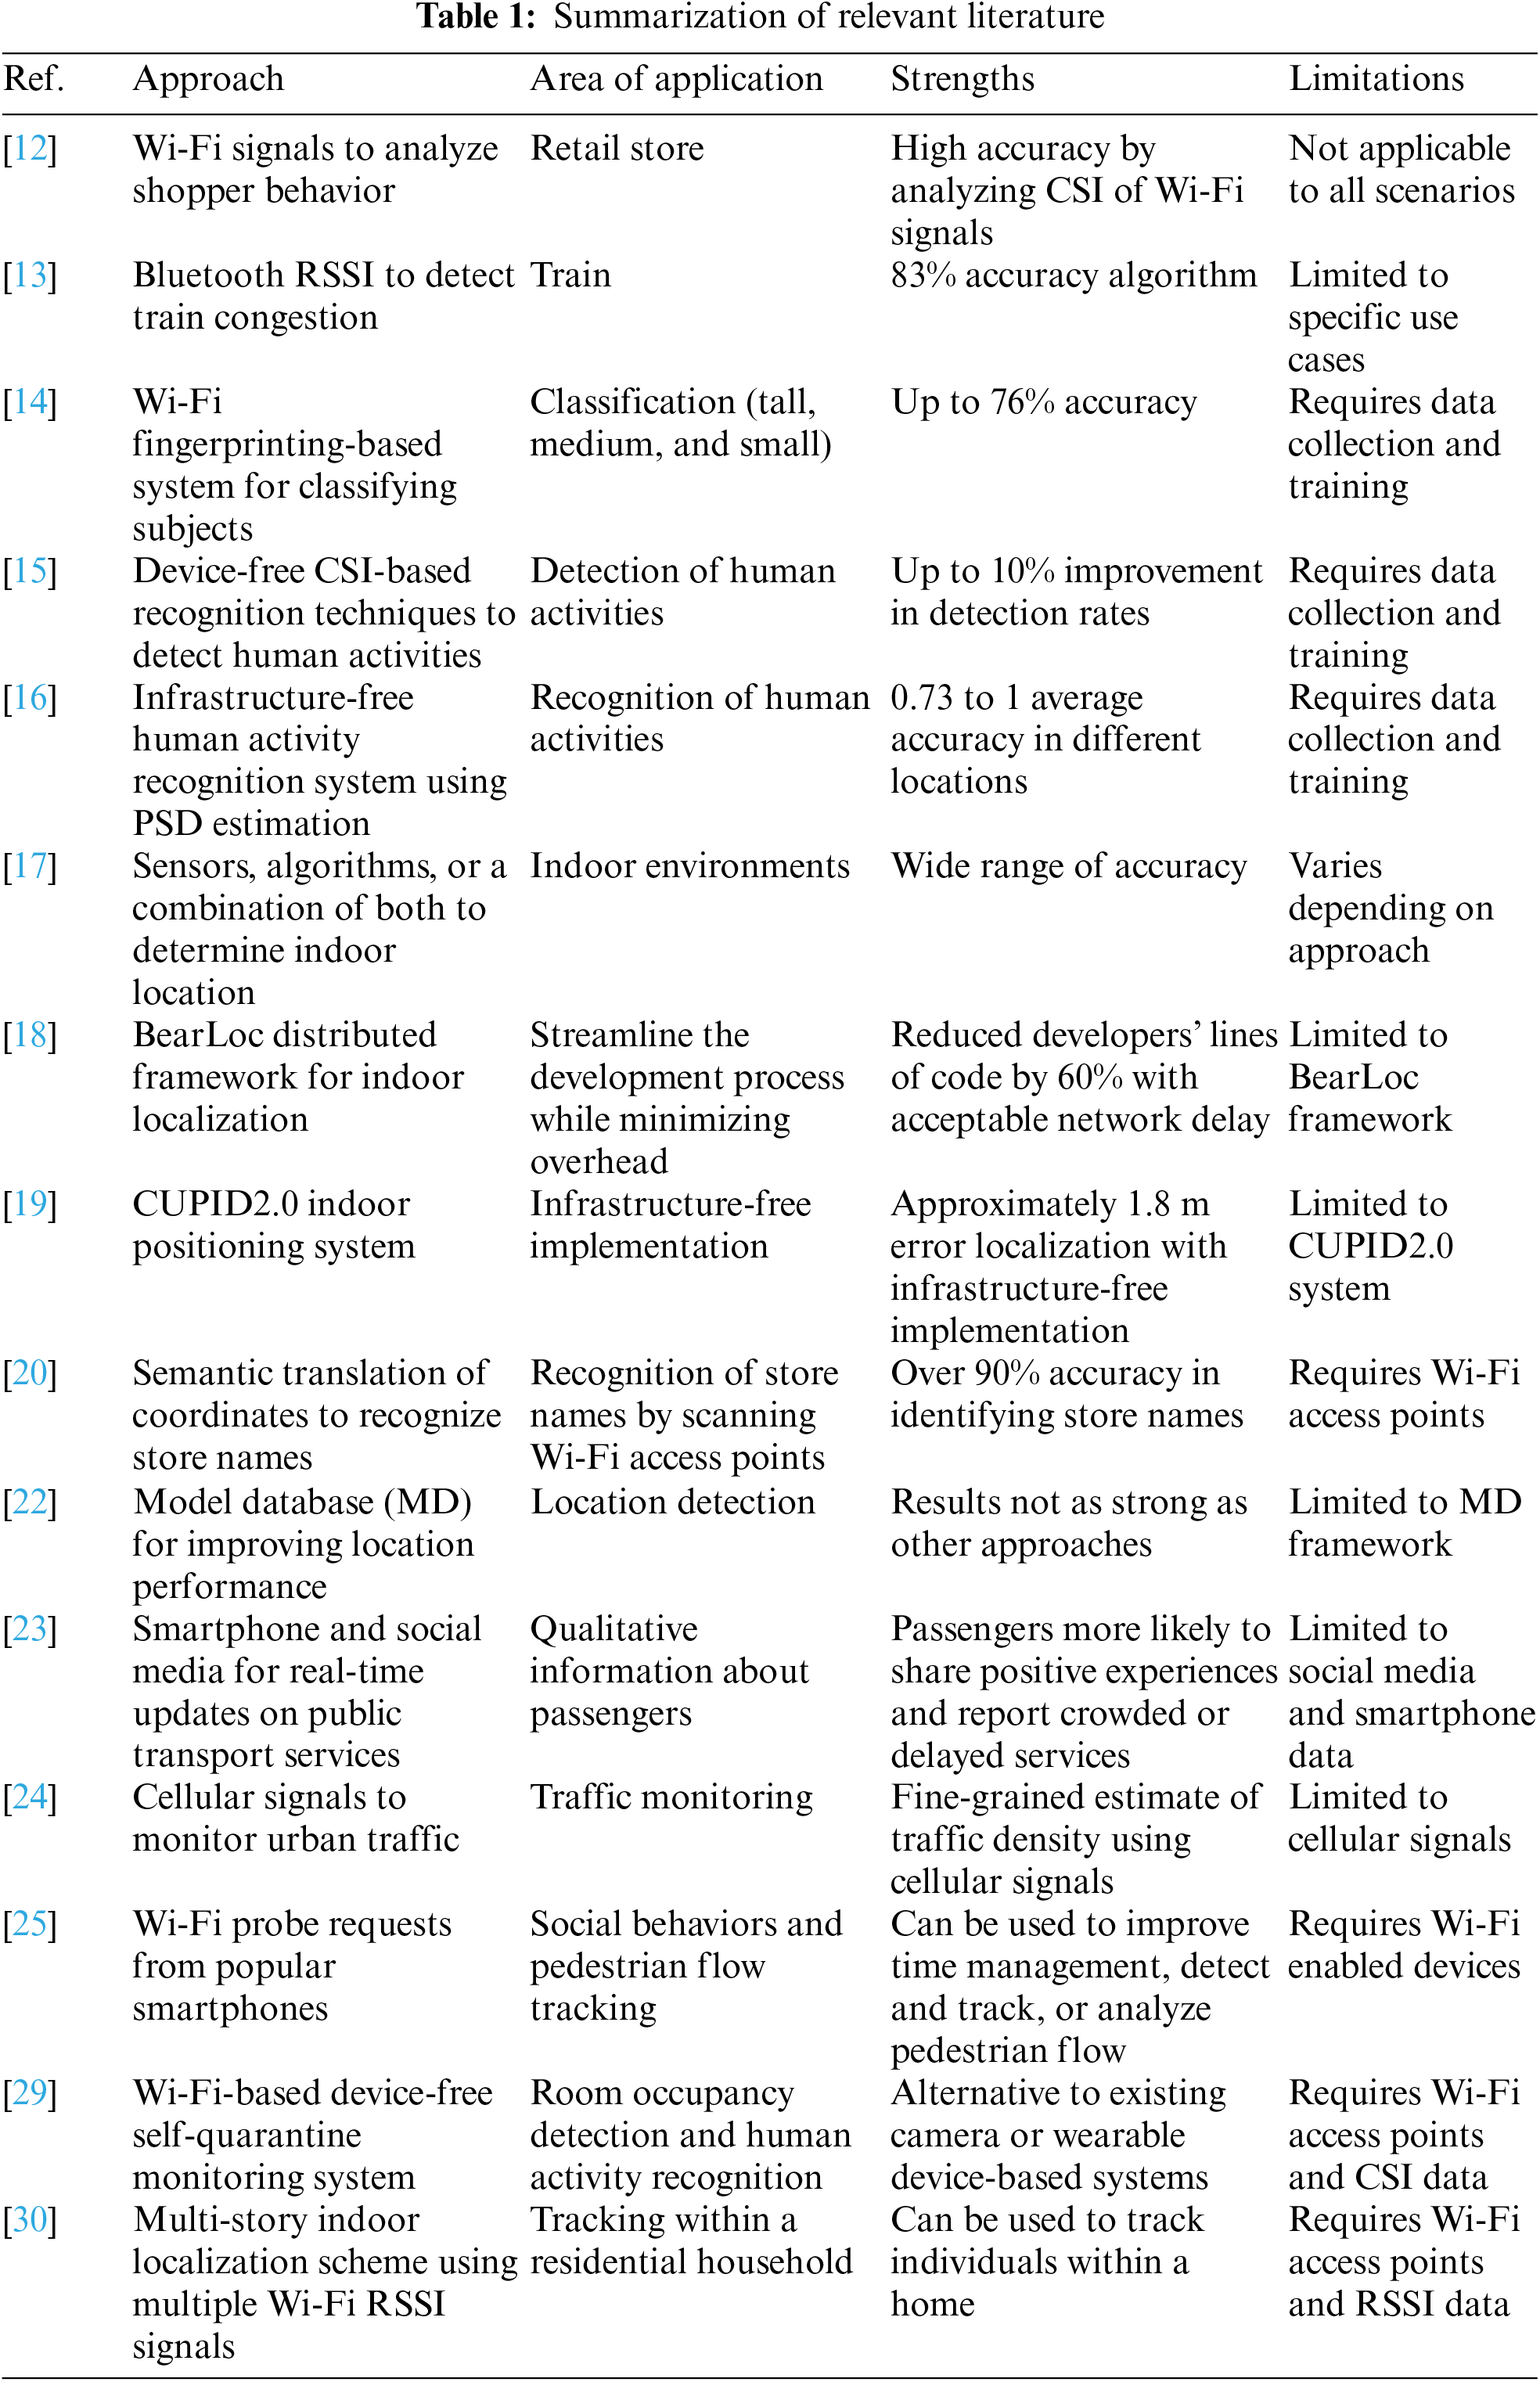
2.5 Summarization of Relevant Literature
Overall, the investigated studies demonstrate the potential of Wi-Fi signals and probe requests for a variety of applications, including understanding social behavior, improving time management, detecting and tracking, and analyzing pedestrian flow. However, there are also limitations to some of the approaches, such as requiring data collection and training. Further research is needed to develop more generalizable methods for using Wi-Fi signals for these purposes. The employed approaches, their applications, strengths and limitations of the relevant studies in literature are summarized in Table 1.
In the preceding section, a number of methodologies and approaches were elucidated with regards to addressing diverse issues, such as the detection of crowding in buses. One potential solution involves leveraging Wi-Fi signals emitted by passengers’ devices and subsequently analyzing and filtering the collected data. Nonetheless, the implementation of this approach necessitates the adoption of several measures to attain an acceptable level of precision. To assess the viability of this method, this paper will conduct an experimental study in the domain of public transportation, specifically on the Brighton & Hove Buses. This study will employ qualitative research techniques to evaluate the effectiveness of the proposed methodology.
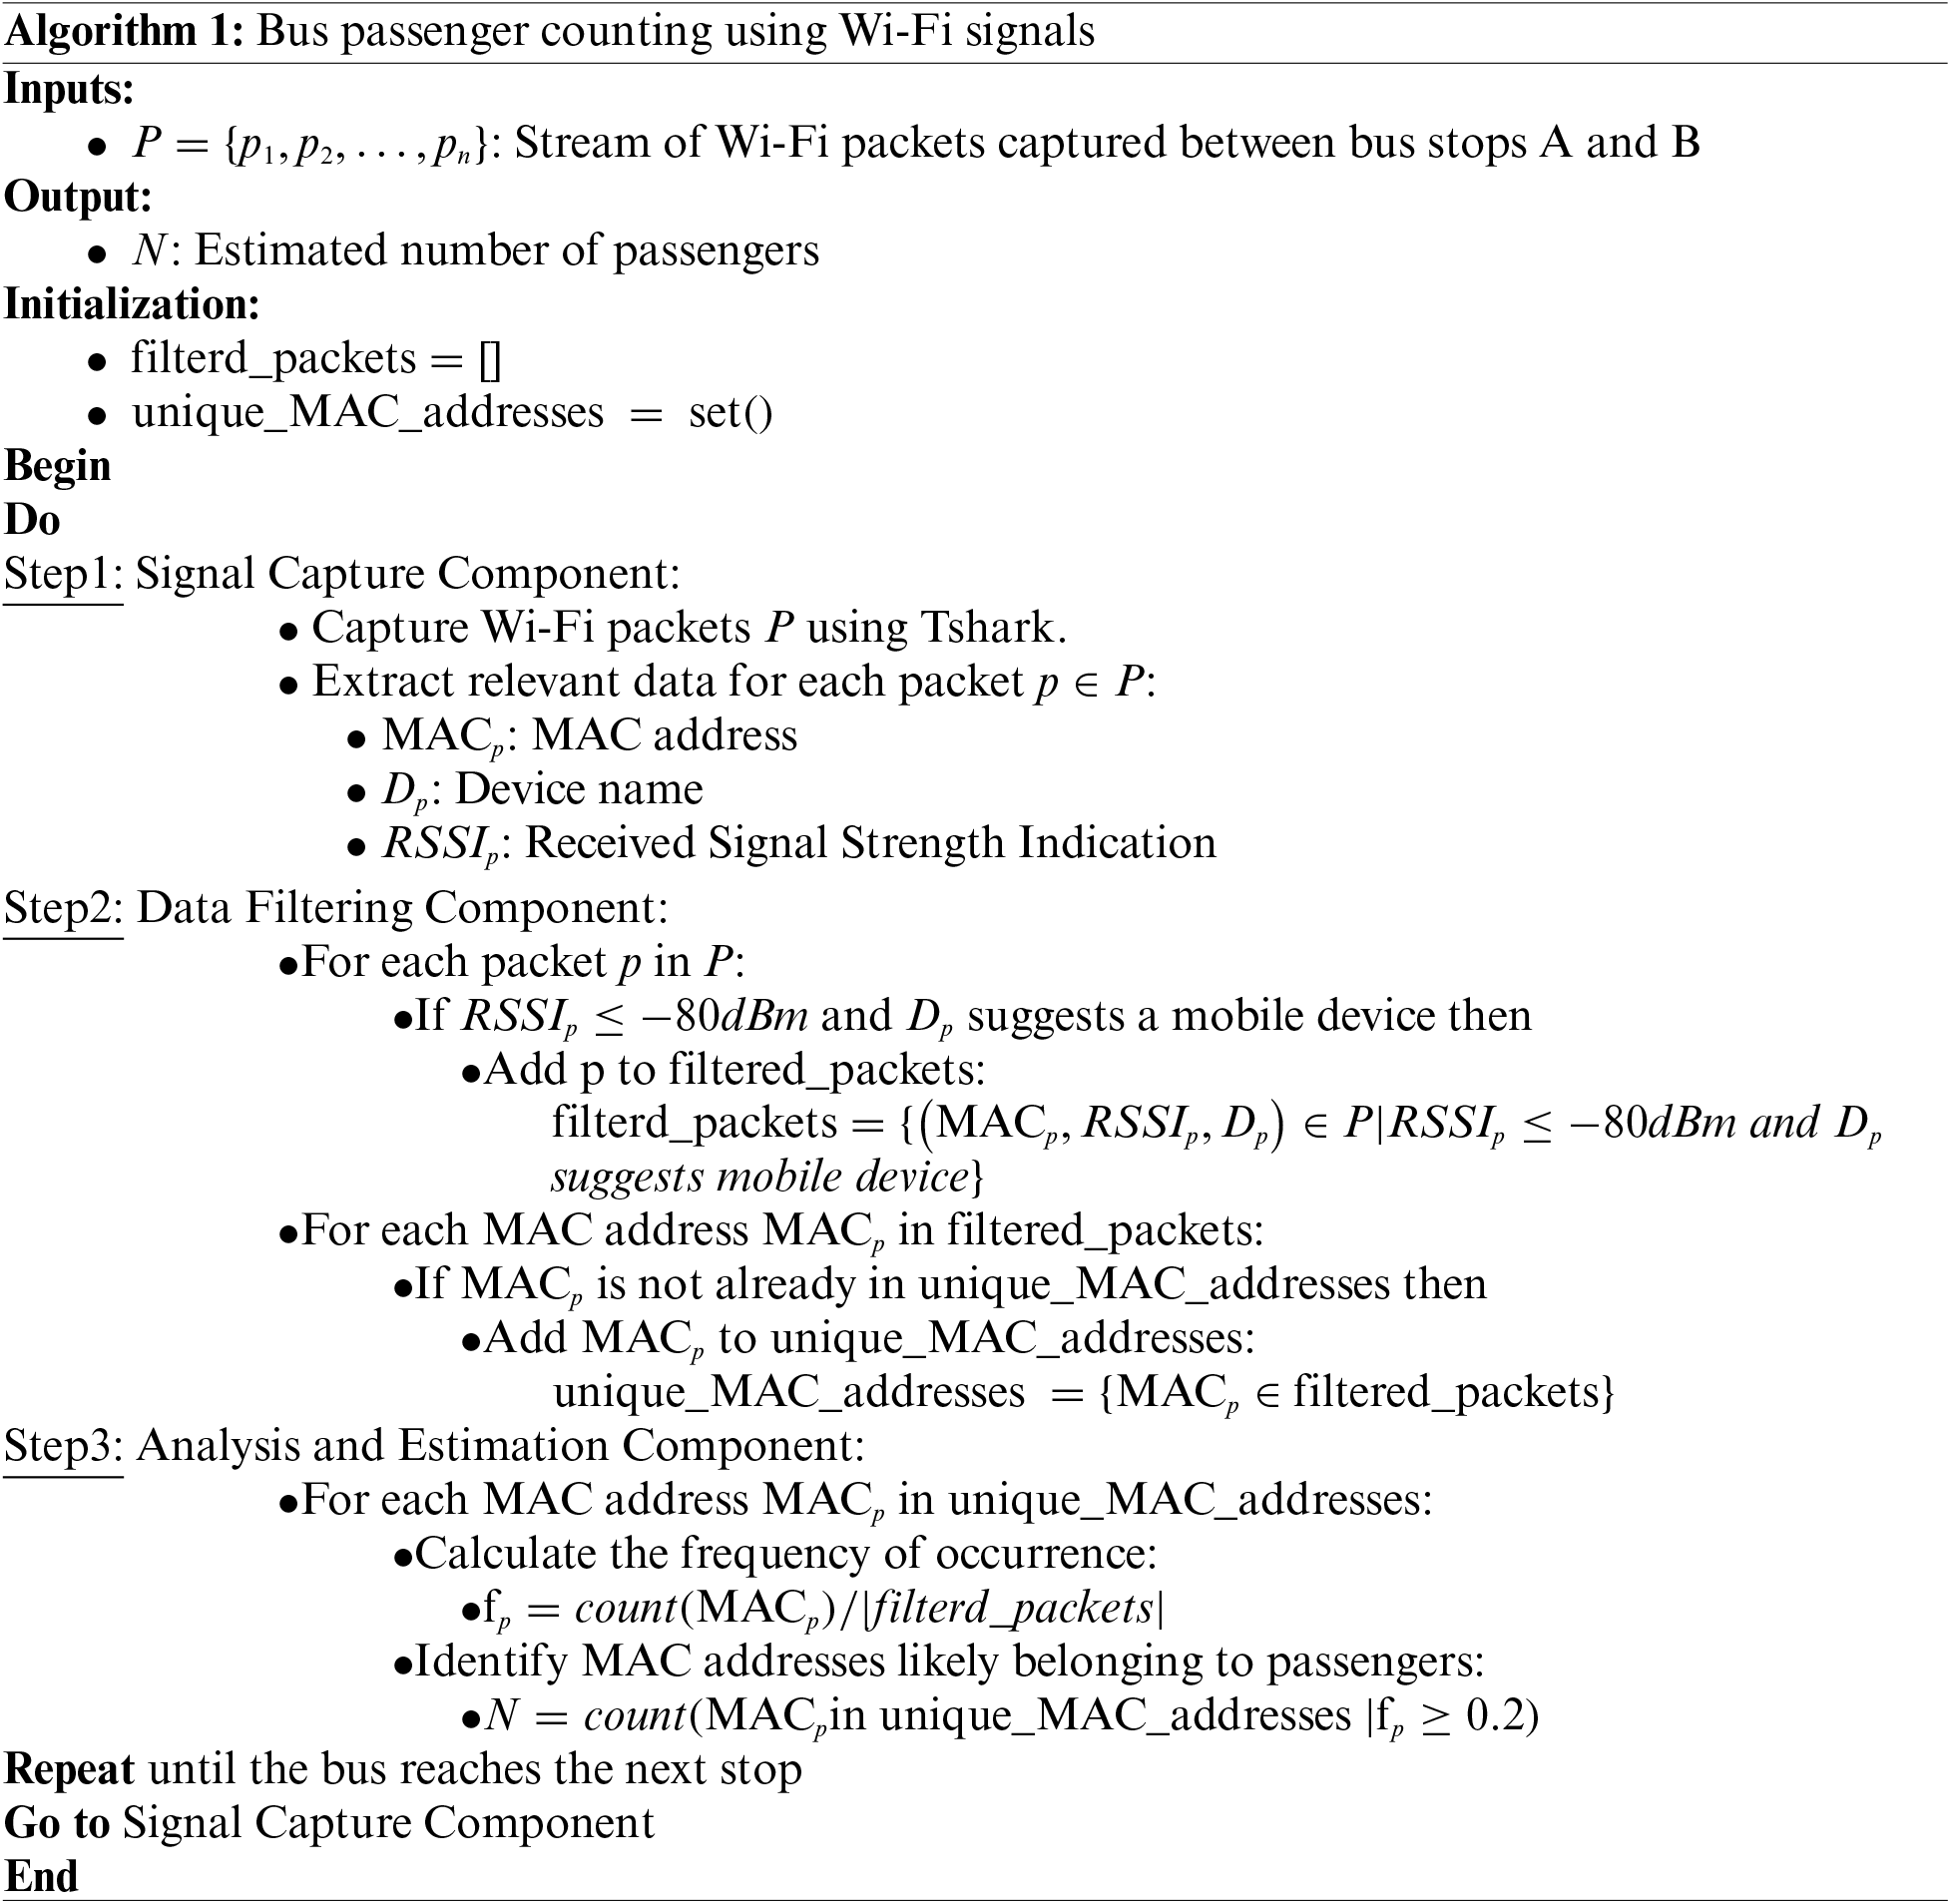
The architecture of our proposed system, as illustrated in Fig. 1, has been structured into three distinct components: (1) Signal capture, (2) Data filtering, and (3) Analysis and estimation. Each of these components is assigned specific tasks, with defined inputs and outputs. Moreover, a detailed flow diagram is shown in Fig. 2 to further explain the involved steps in each component of the system. In addition, the Pseudo-code of the proposed algorithm is further provided in Algorithm 1 to enhance the clarity and understanding of steps the proposed approach. Subsequent subsections will delve into a comprehensive explanation of each component, providing detailed insights.

Figure 1: The general architecture of the system
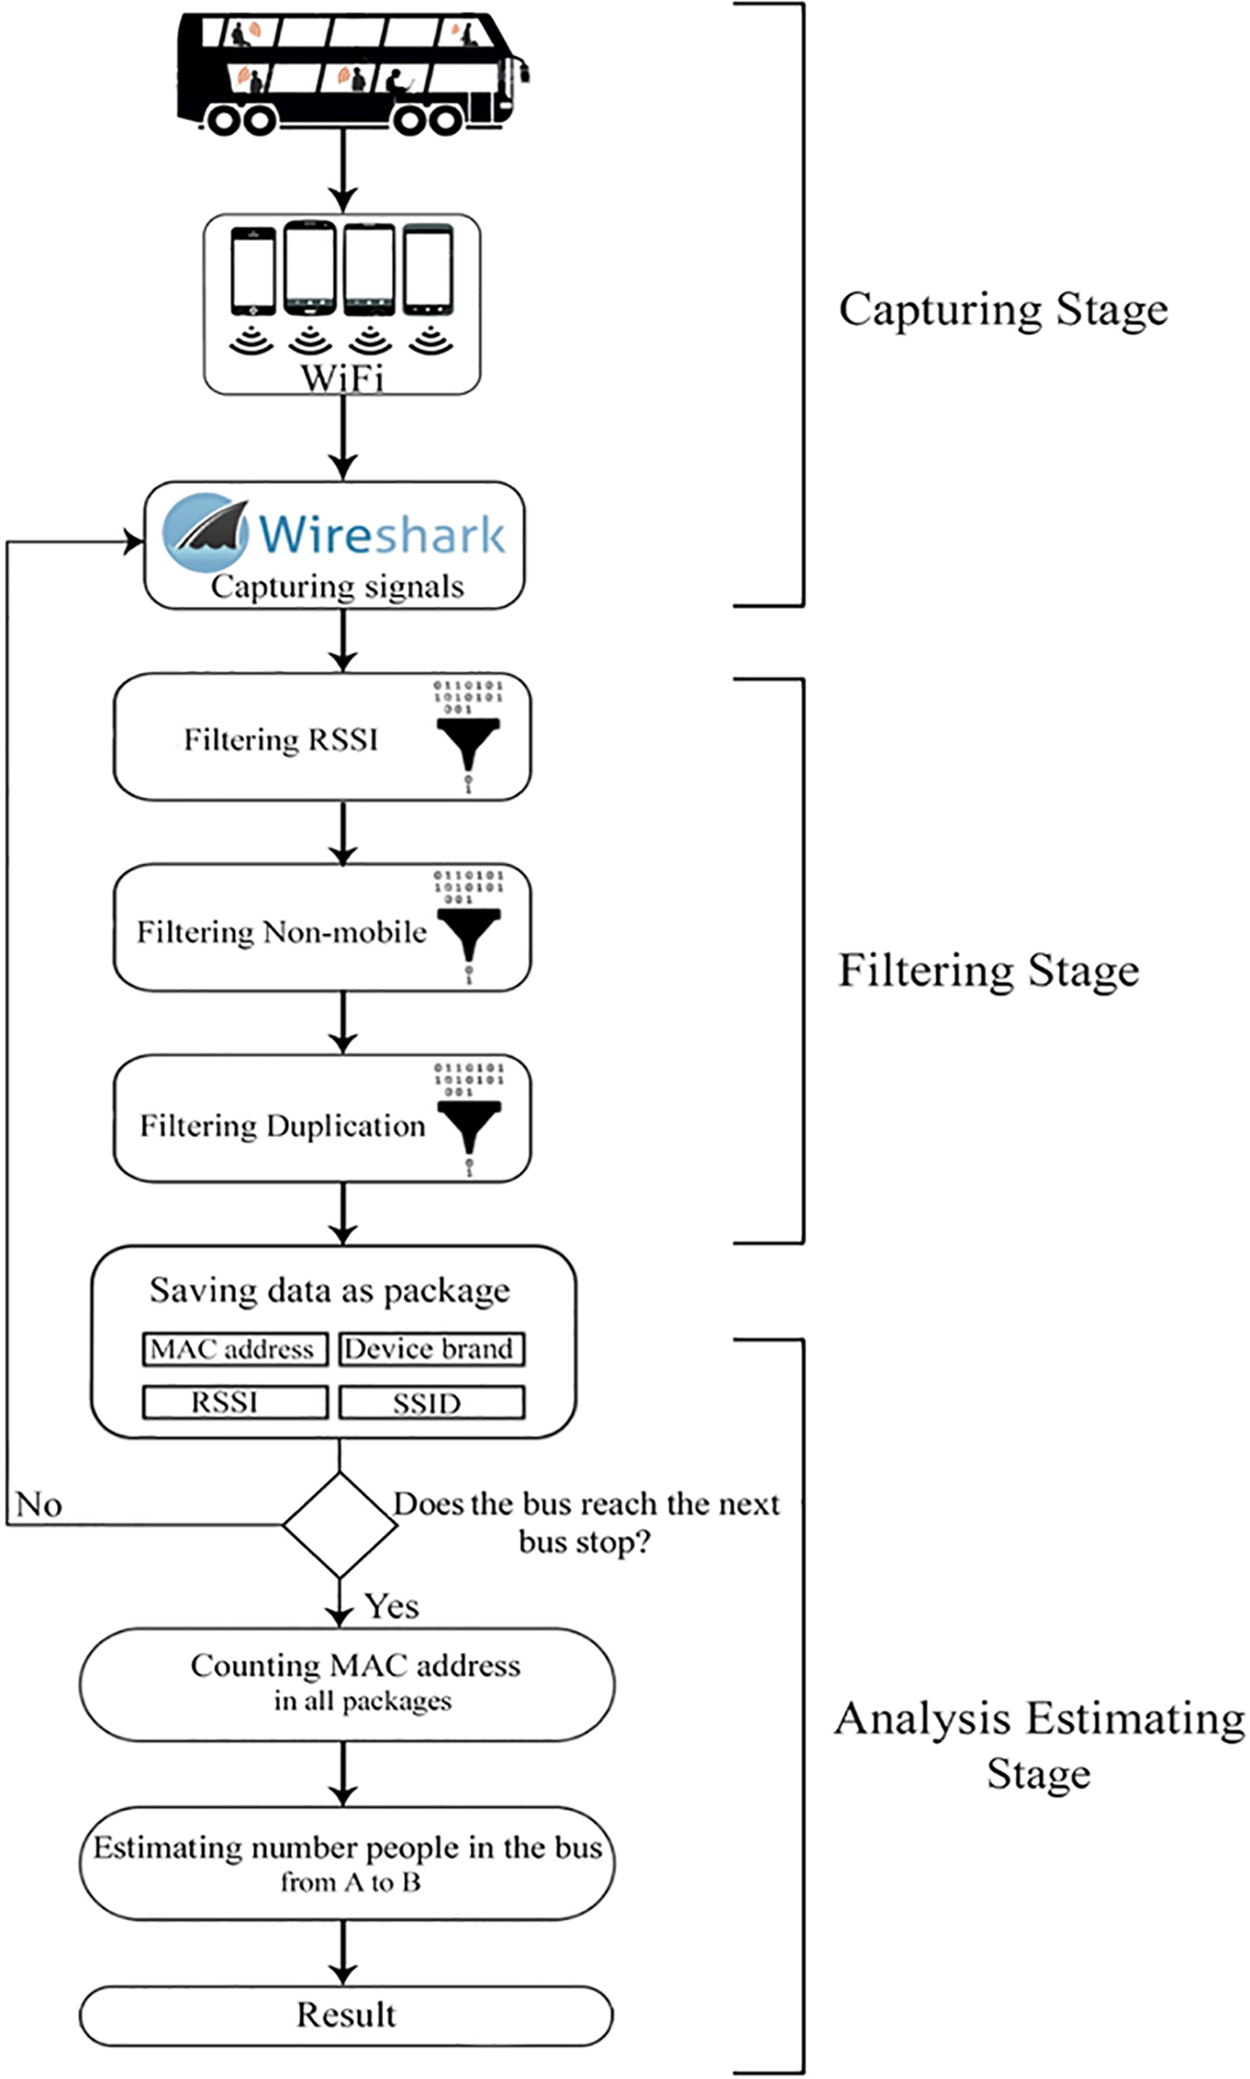
Figure 2: The flow diagram of the proposed system
The Capturing Component is the first stage of the proposed methodology. It is responsible for collecting the stream P = {p1, p2,..., pn} of Wi-Fi packets captured from passengers’ electronic devices while they are on board the bus. It employs a streamlined version of Wireshark, known as Tshark, which serves solely as a tool for signal capture, constituting the input mechanism of the system. Essentially, Wireshark is a network protocol analyzer renowned for its ability to monitor network activity at a granular level. It is employed to aid in data analysis and expedite the resolution of network-related problems with real-time capturing capabilities, which makes it suitable for the requirements of this study. Specifically, Wireshark is employed as the initial layer to capture network signals, with the intention of passing the data to the subsequent layer for filtering. The system will conduct live capture on buses and subsequently analyze the data to determine the number of passengers present. The specific data that Wireshark provides to the second layer of the system are listed in the following:
• MAC Address: The system proposed in this paper is reliant upon the collection of MAC addresses, which serve as a crucial prerequisite for the identification of devices within a digital environment.
• Device Name: Wireshark has the capability to furnish the device name or brand name associated with each captured signal, thereby enabling the system to filter out non-mobile devices based on this information.
• Service Set Identifier (SSID): One prospective development involves enhancing data analysis capabilities by leveraging the Service Set Identifier (SSID) to gather additional information. Within this system, the primary objective lies in accurately detecting and monitoring the occupancy levels of buses.
• Received Signals Strength Indication (RSSI): The RSSI holds substantial importance within the system, in terms of its ability to filter out signals originating from external to the bus devices. It is worth noting that the system can judiciously discern the distance of the device from the receiver based on the signal strength [19].
Data collection is a crucial aspect of any research project, as the accuracy and relevance of the data directly impact the validity of the study. In fact, the selected approach for data collection in this study focuses on utilizing the bus environment to capture signals from passengers’ electronic devices. This method aims to reduce the financial burden associated with the project as compared to other methodologies that rely on capturing signals near bus stops. It is important to note that the number of bus stops exceeds the number of buses, resulting in a higher availability of data for analysis when collecting signals on the bus. Generally, when collecting data from public or open spaces, researchers face challenges due to the large volume of available data, much of which may not be pertinent to the specific research project at hand. Particularly, it should be noted that Wireshark’s signal capture also gathers extraneous information for the project, such as IP addresses, IP targets, and protocol types. Consequently, filters are required to eliminate this superfluous data. This filtering process must be implemented to reduce the volume of data to be analyzed within the system. Based on that, the component proceeds with the task of saving and preparing the data for the subsequent component, which involves further data filtering. This sequence of tasks is repeated iteratively until reaching the next bus stop.
Within this component, the system undertakes an analysis of the collected data, applying filters to eliminate devices that are not mobile and those located outside of the bus. This stage comprises three interdependent steps. Firstly, the system filters all packets transmitted between bus stops A and B, discarding any packets associated with devices exhibiting an RSSI greater than −79 dBm, indicating that the device is not present on the bus. In fact, it was observed that signals weaker than −80 dBm are predominantly indicative of smartphones within the bus, as per experimental results.
where
where
where
3.3 Analysis and Estimation Component
The final layer of the system entails an algorithm that performs data analysis and identification of relevant information to estimate the number of individuals present on the bus. This component comprises two distinct steps. Firstly, the system calculates the frequency of occurrence for each MAC address across all packets as
where
where
The system under consideration is designed to operate based on specific initial values, crucial for its functionality. These values include the frequency of signal (probe request) transmission from smartphones within a given time frame and the signal strength inside and outside a bus environment. Such data are vital for filtering irrelevant signals and providing a comprehensive overview of the system’s operational context before its actual design, thereby avoiding incorrect assumptions. This section outlines the results from our initial experiments, which were conducted using a laptop as the capture device in a controlled setting. The primary objectives of these experiments were threefold: (1) to ascertain the presence of a smartphone on a bus, (2) to determine the frequency of wireless local area network (WLAN) packet transmissions from smartphones, and (3) to gather initial values that would inform and guide the subsequent system design. Below, we detail the main experiments and their setups, emphasizing the role of the laptop in capturing and processing the Wi-Fi signals.
This section presents the preliminary experiments conducted on smartphones and buses, and reports the results obtained from these experiments, which were subsequently utilized in the main experiments. Section 4.1.1 describes the experiment conducted on smartphones, while Section 4.1.2 presents the experiment that measures the signal strength of smartphones in buses. Additionally, Section 4.1.3 reports the initial experiment conducted on buses.
4.1.1 Smartphones WLAN Packet Experiment
In fact, this experiment mainly aimed to investigate how smartphones send signals to access points or scan for access points. The experiment was conducted using distinct available smartphones operated on different platforms, namely iOS and Android. The experiment involved testing the smartphones under five different scenarios as follows. (1) The devices are connected to the internet with locked screen. (2) The devices not connected to the internet with locked screen and Wi-Fi enabled. (3) The devices are connected to the internet and browsing a website. (4) The devices are connected to the internet with Wi-Fi enabled. (5) The devices are connected to the internet through Wi-Fi with the screen turned off.
Remark 1. The chosen scenarios were designed to comprehensively study how smartphones behave under different operational conditions such as internet connectivity, screen activity, and Wi-Fi usage, particularly in the context of bus passenger counting. The goal was to understand how smartphones interact with Wi-Fi networks in realistic usage conditions during bus commutes. The scenarios aimed to simulate common real-world situations that smartphones encounter and reflect realistic passenger behaviors and smartphone interactions with Wi-Fi networks inside a bus.
It is worth mentioning that each of the aforementioned scenarios was tested for a duration of 10 min, as the distance between bus stops is typically less than 10 min by bus. The number of signals transmitted by the smartphones during each experiment is illustrated in Fig. 3. It is evident that smartphones transmit signals frequently, more than once in 10 min, irrespective of whether they are connected to the internet or not. The iOS device transmitted the most signals in most experiments. Conversely, the Android device did not transmit any signals when the screen was locked with the battery-saver mode enabled (Android-I). However, it transmitted the most signals when connected to the internet through Wi-Fi with the battery-saver mode disabled (Android-II).
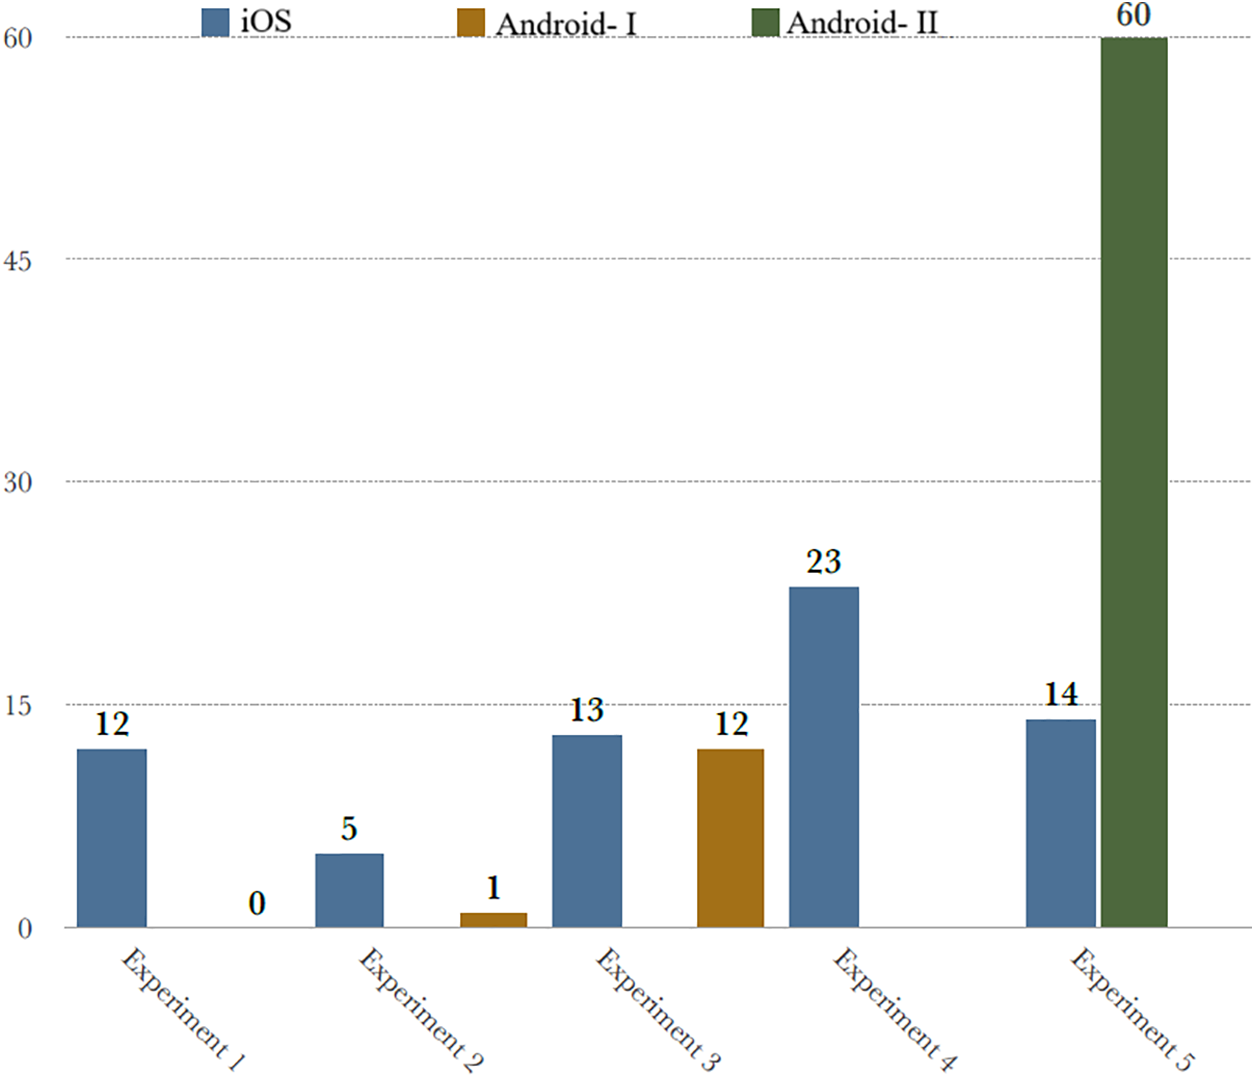
Figure 3: Results of smartphones experiment
4.1.2 Smartphones’ Strength Signals in a Bus Experiment
The purpose of this experiment was to investigate the strength of smartphone signals on a double-decker bus. The experiment was conducted to measure signal strength on both the first and second floors of the bus. The study was conducted in Brighton, UK on public buses. The results indicated that the strength of signals from a smartphone on a bus did not need to exceed −79 dBm. Fig. 4 displayed signal strength at various locations on the bus.
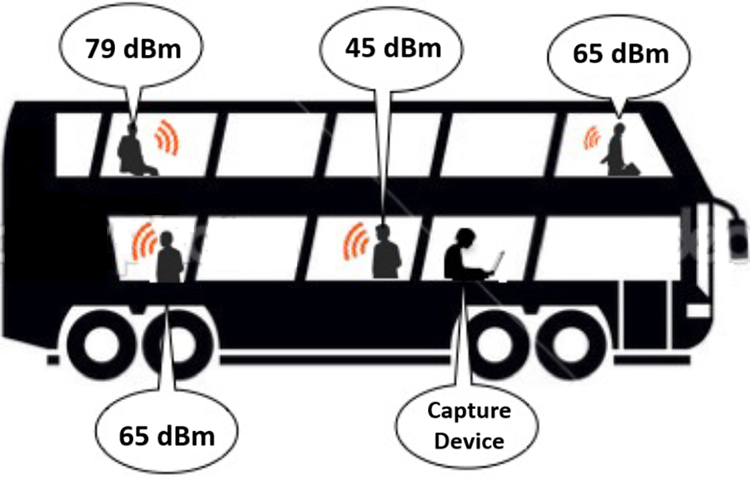
Figure 4: Strength signals in many locations on a bus
This experiment is conducted to comprehend the nature of data that could be collected. Two experiments were carried out on public transportation in Brighton, UK. The primary objective of these experiments was to collect data for analysis and determine the optimal data format. The first experiment was conducted on bus 23 (shown in Fig. 5), where signals were captured every 10 s between Park Village Bus Stop and Brighton Marina Bus Stop. The 10-s interval was selected because a bus cannot travel between two stops in less than 10 s, and the system needed to record more than one package between two stops. The system recorded MAC addresses and manual counts of passengers simultaneously. On the other hand, the second experiment was conducted on bus 7 (shown in Fig. 6), following the same settings as the first experiment. These routes were chosen because they pass through crowded areas such as downtown and Brighton Marina. The results of both experiments revealed that the number of MAC addresses exceeded the bus capacity at most stops. The first experiment captured approximately 3500 unique MAC addresses, while the second experiment captured 34,000 unique MAC addresses from different electronic devices. These results indicated that the system could potentially capture a vast amount of data, which would require filtering to refine the data. Figs. 7 and 8 illustrate the number of unique MAC addresses at each bus stop for the first and second experiments, respectively.
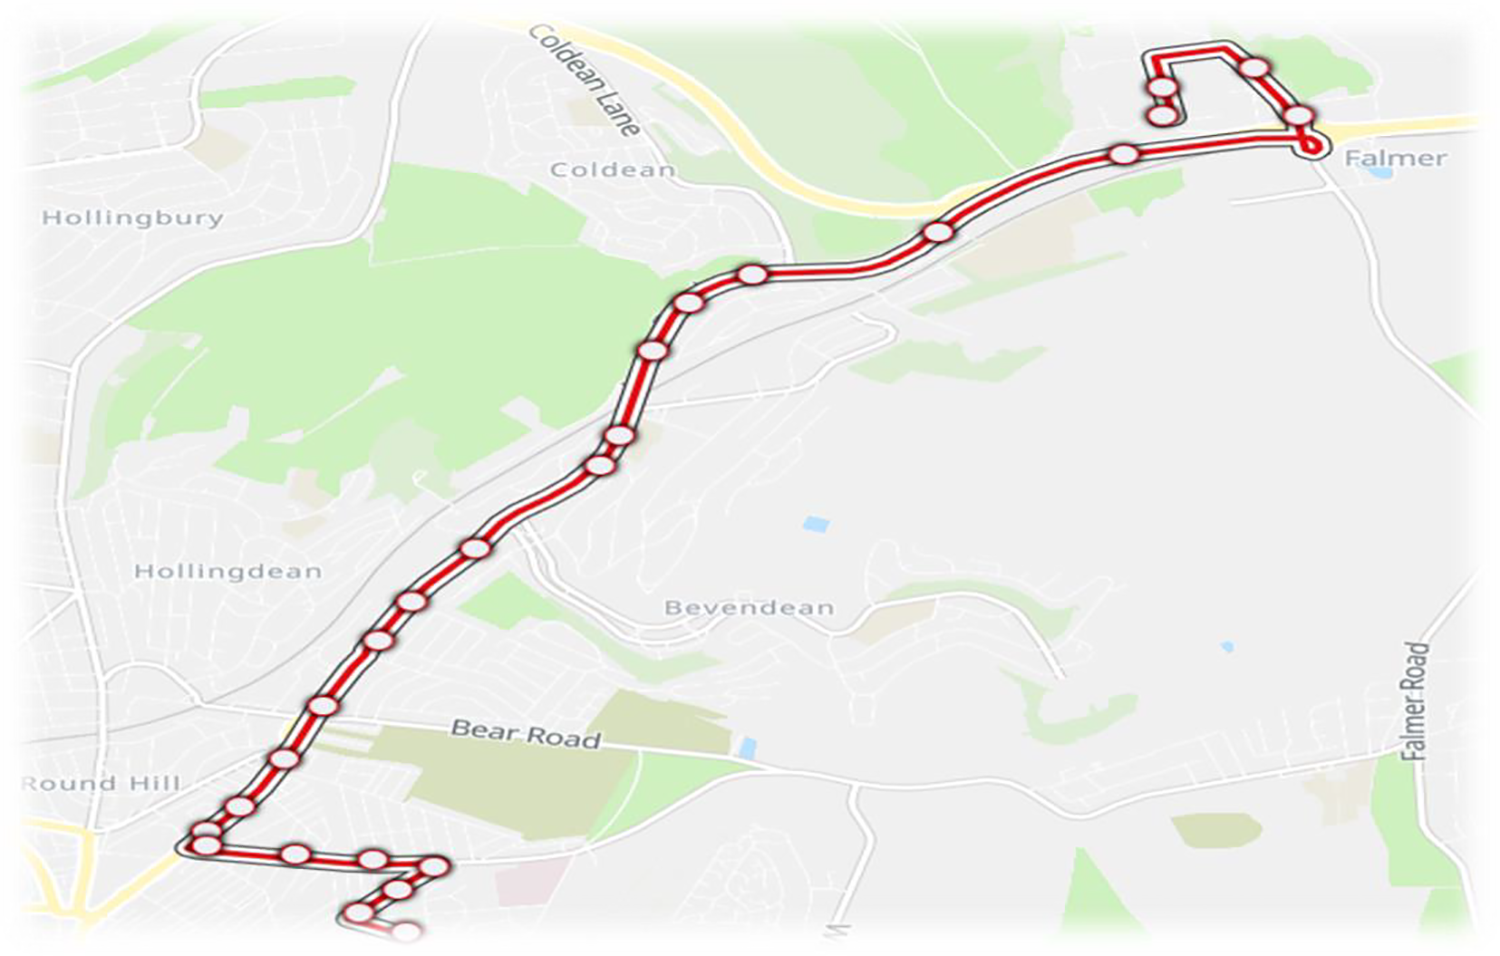
Figure 5: The first route: bus 7 Brighton & Hove
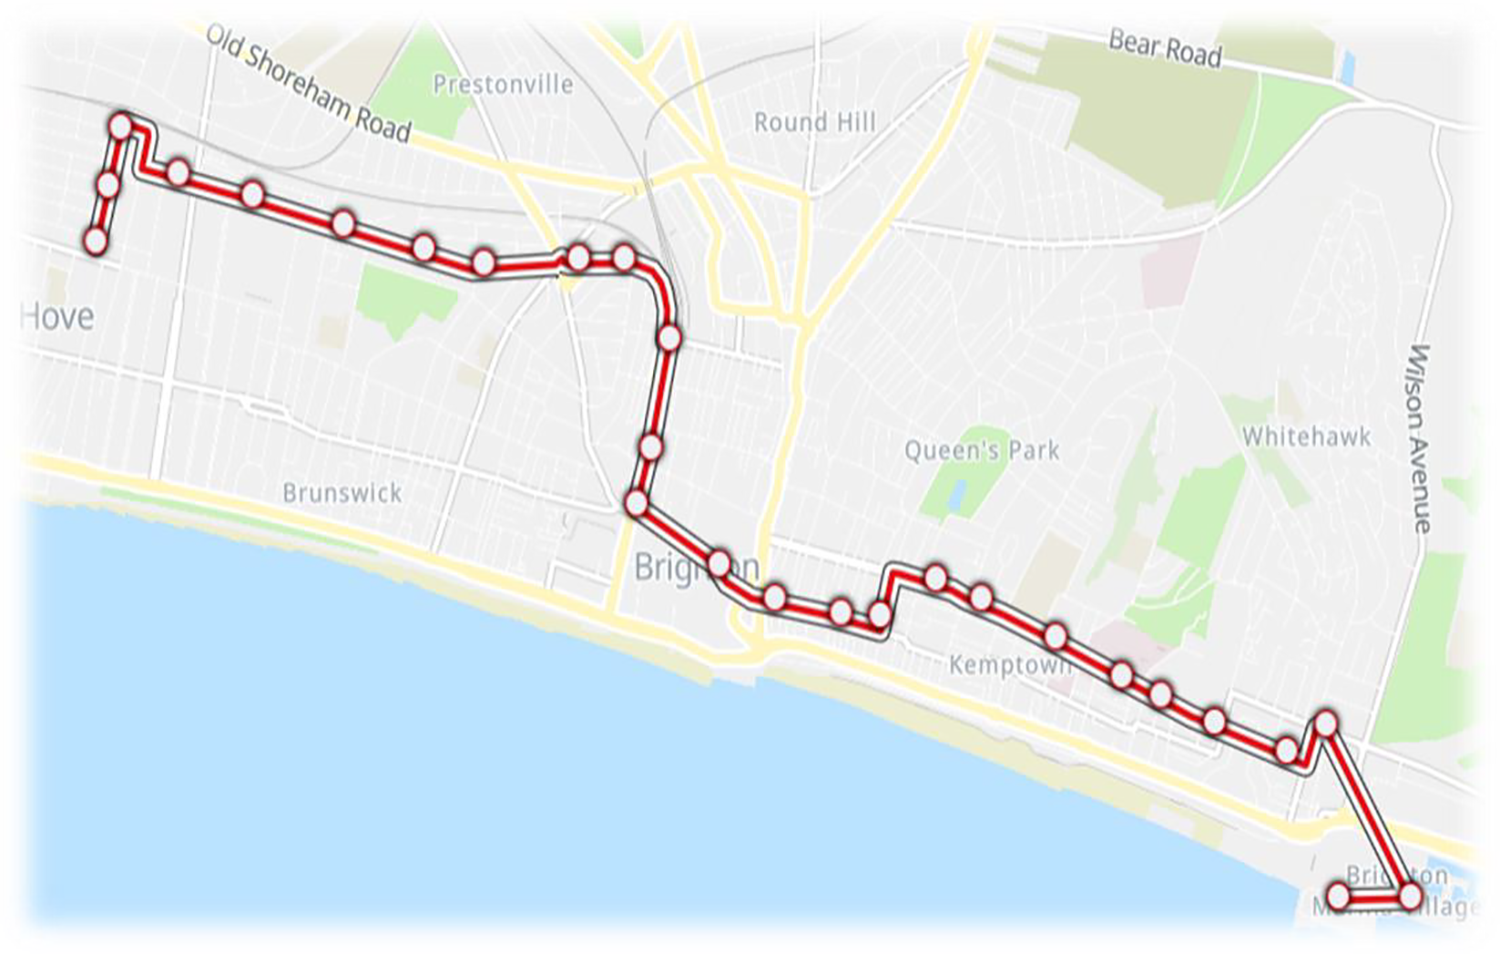
Figure 6: The second route: bus 23 Brighton & Hove
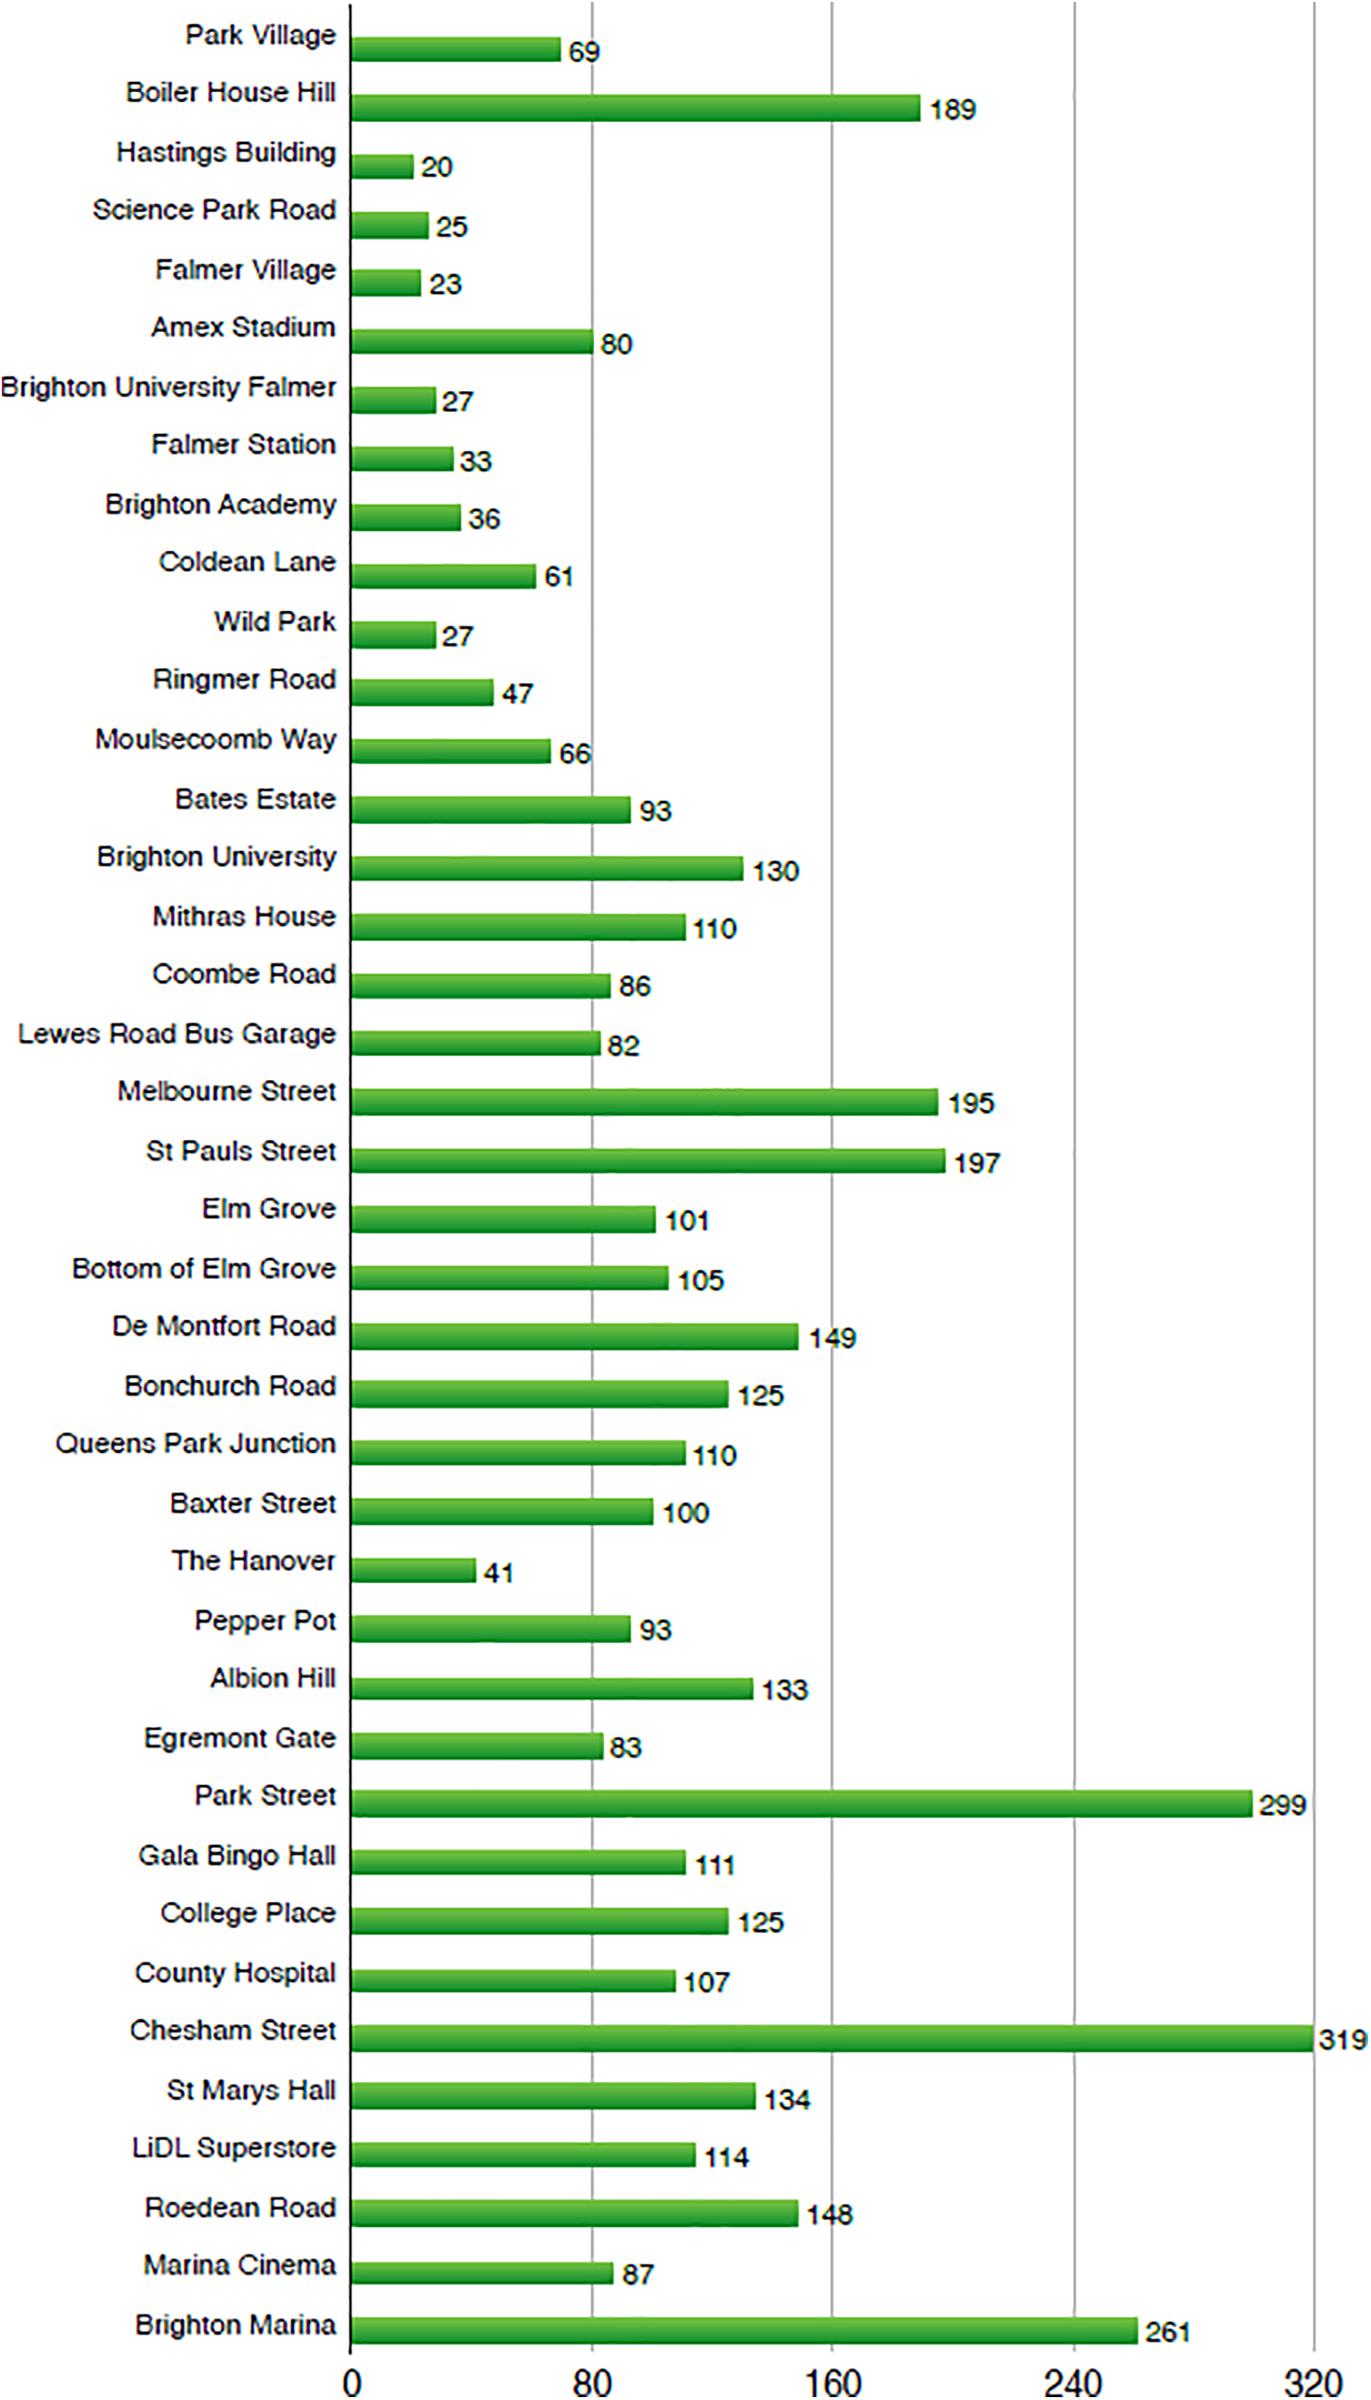
Figure 7: The number of MAC addresses at each bus stop of the first route
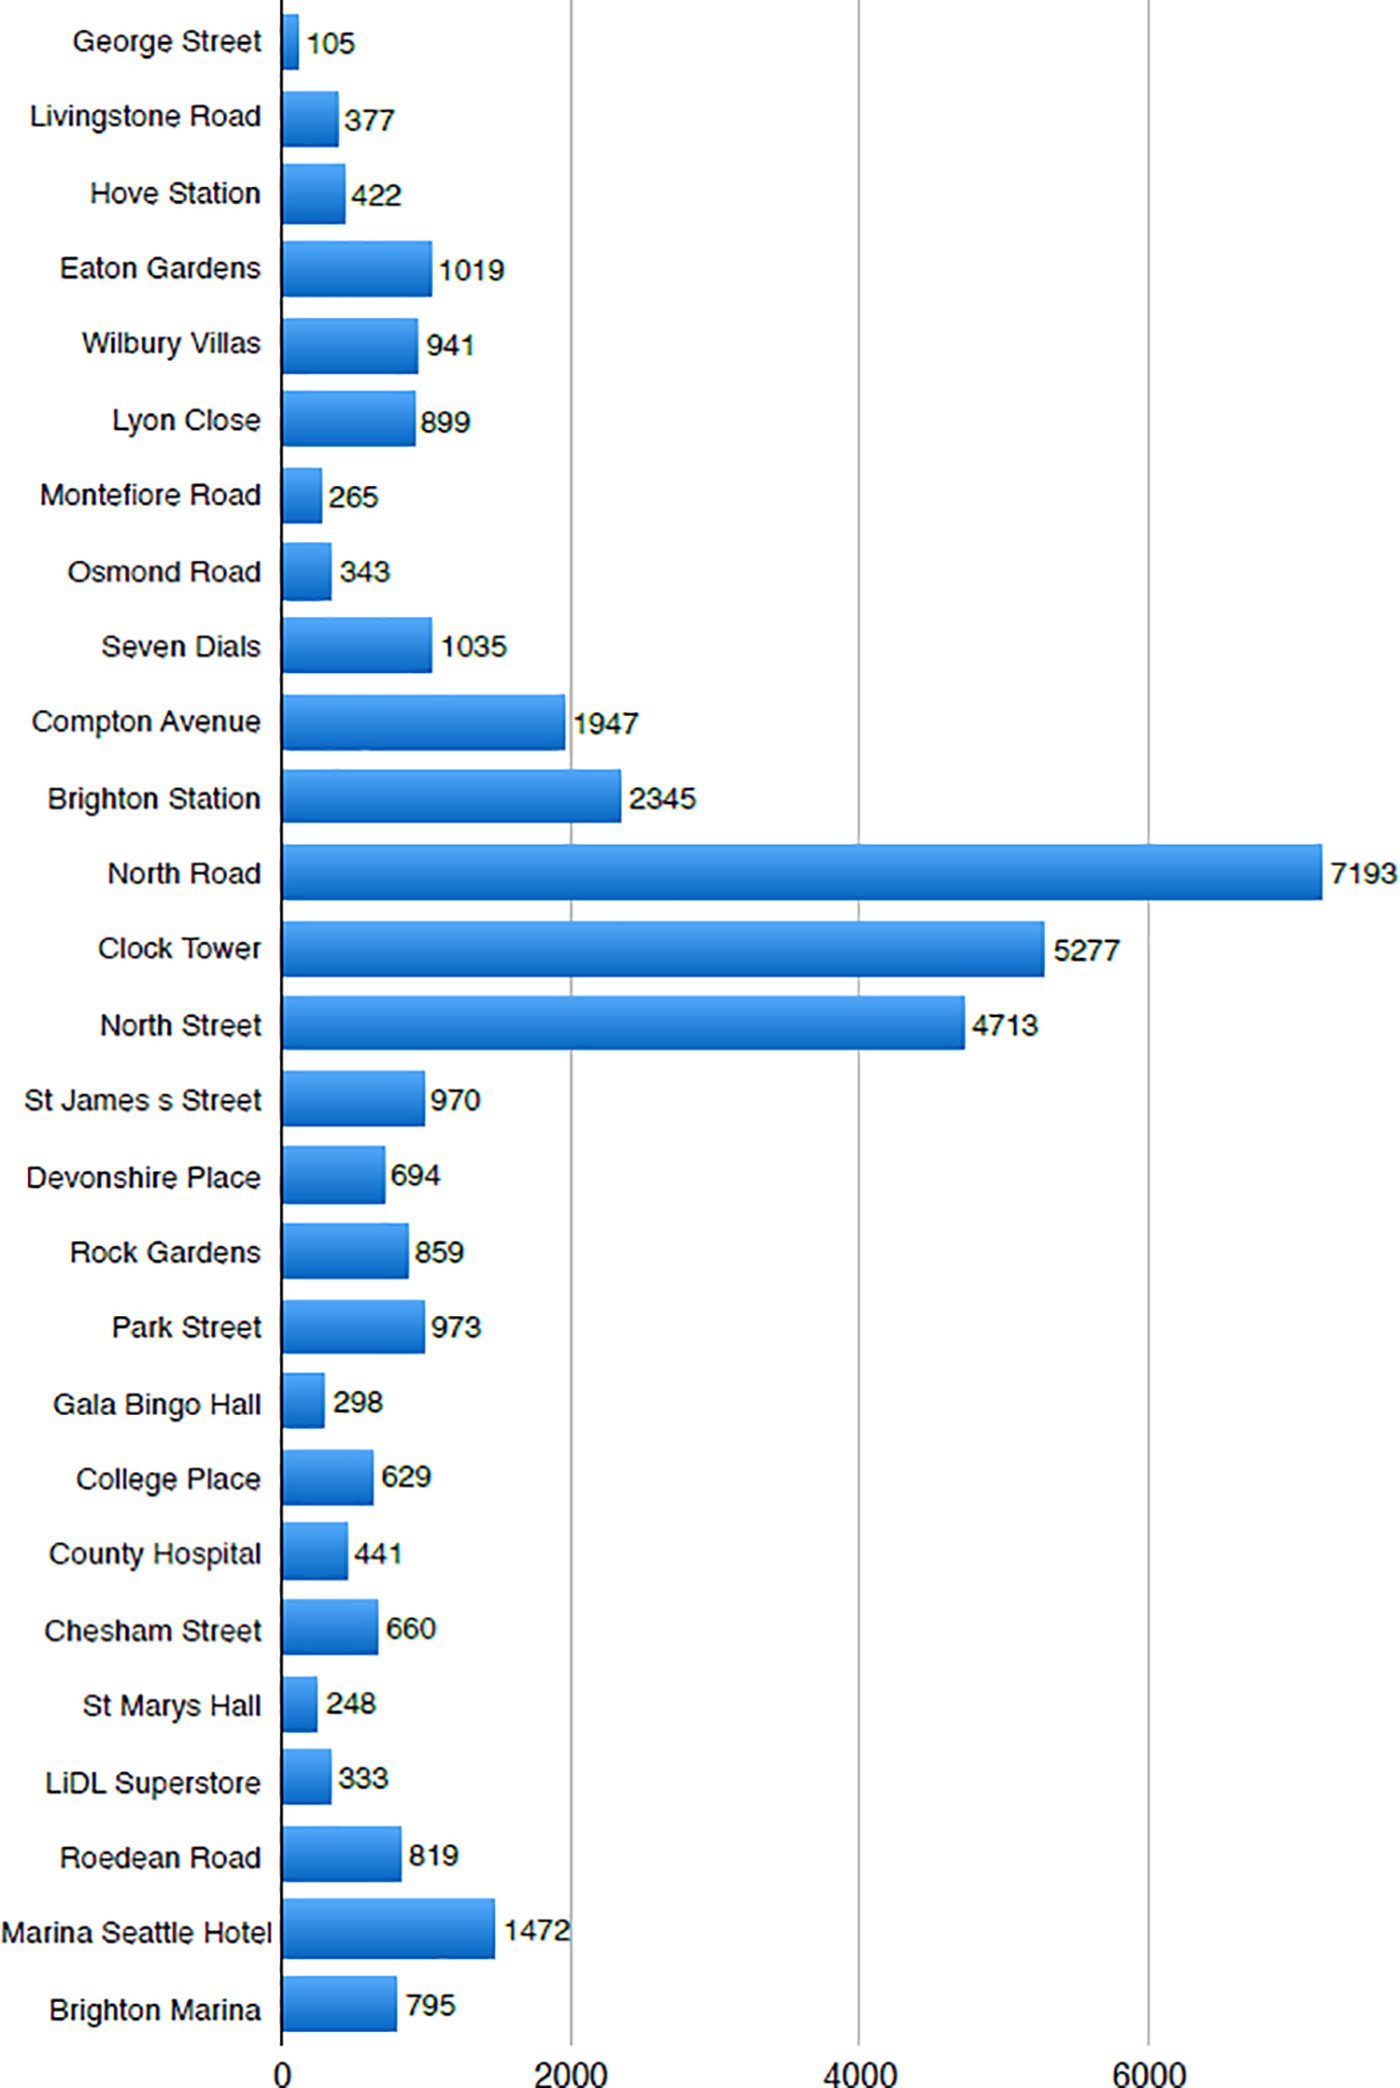
Figure 8: The number of MAC addresses at each bus stop of the second route
Remark 2. This study is designed to prioritize privacy and data protection. The proposed system does not involve tracking individuals’ movements or collecting personal data. Instead, it focuses on capturing and analyzing anonymized Wi-Fi signals to estimate passenger numbers, thereby safeguarding passengers’ privacy.
This section presents the detailed results of six main experiments conducted to test the proposed scheme for bus passenger counting. Essentially, manual recordings were taken at each bus stop to compare with the system’s results. The experiments captured around 127,000 unique MAC addresses, indicating the number of digital devices present on the buses. Particularly, the system’s estimates were generally higher than the actual number of passengers, and the reasons for this will be discussed in the next section. However, the system showed high accuracy rates of 90% to 100% in less crowded areas. The results are presented for each experiment, emphasizing the most important findings and providing an overall summary of the data.
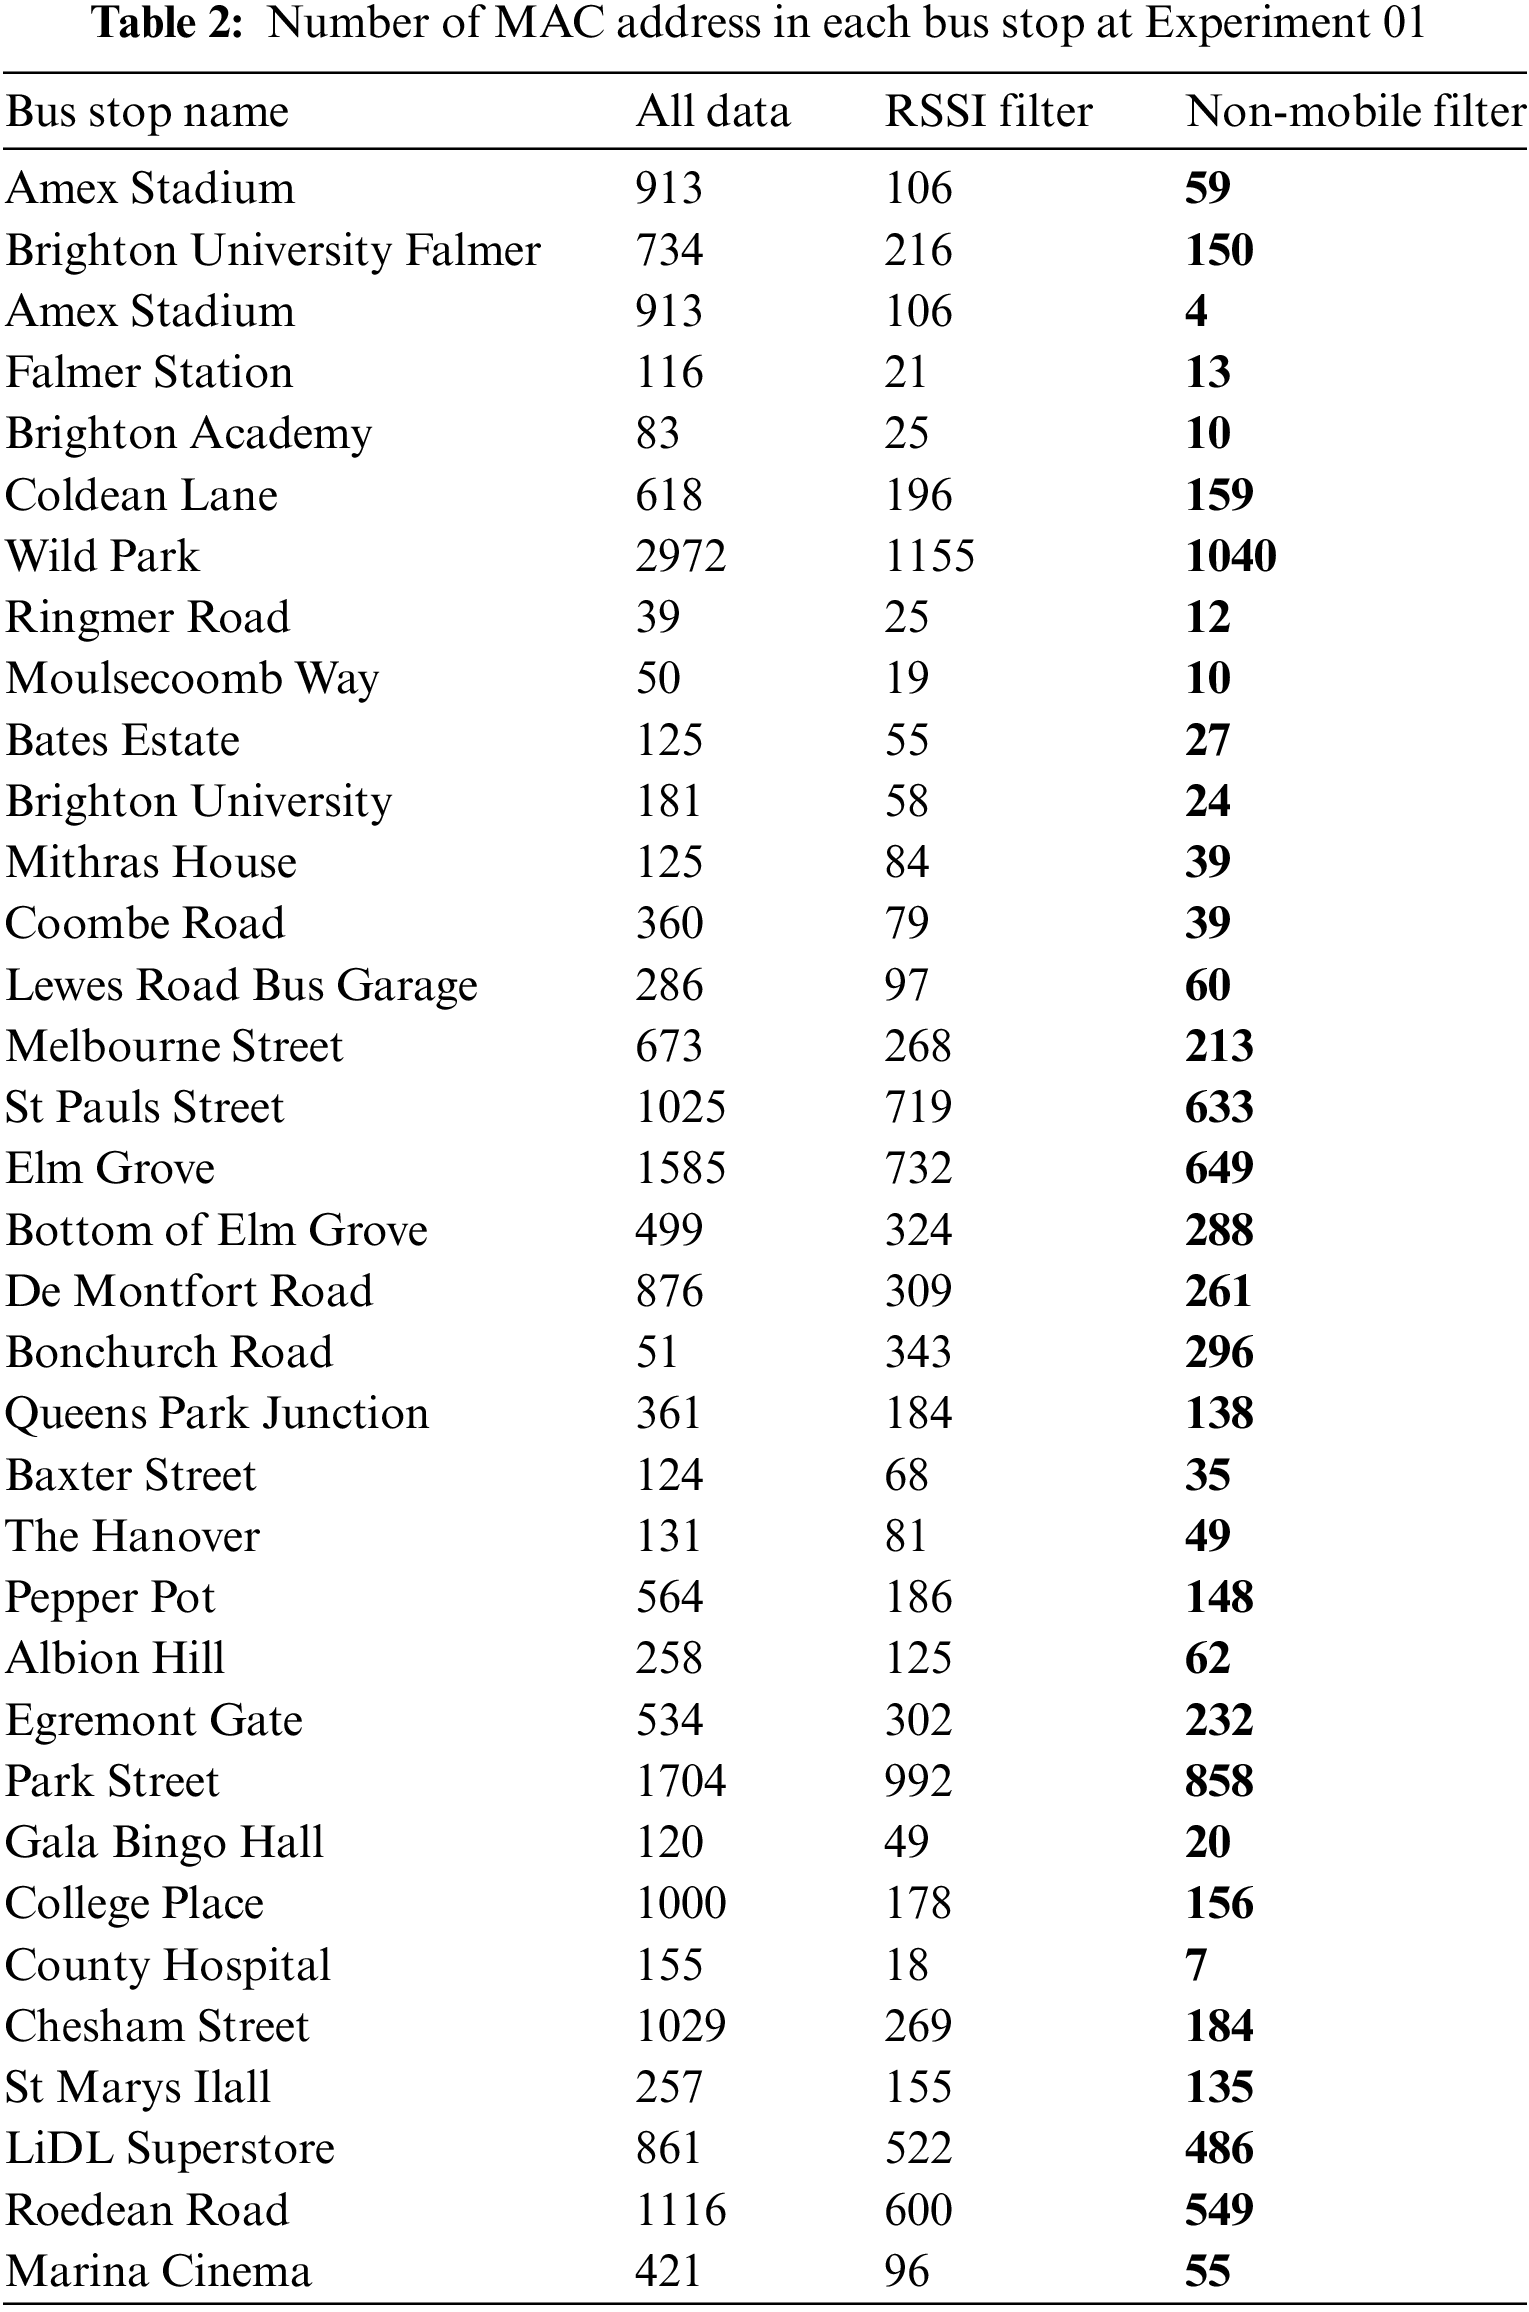
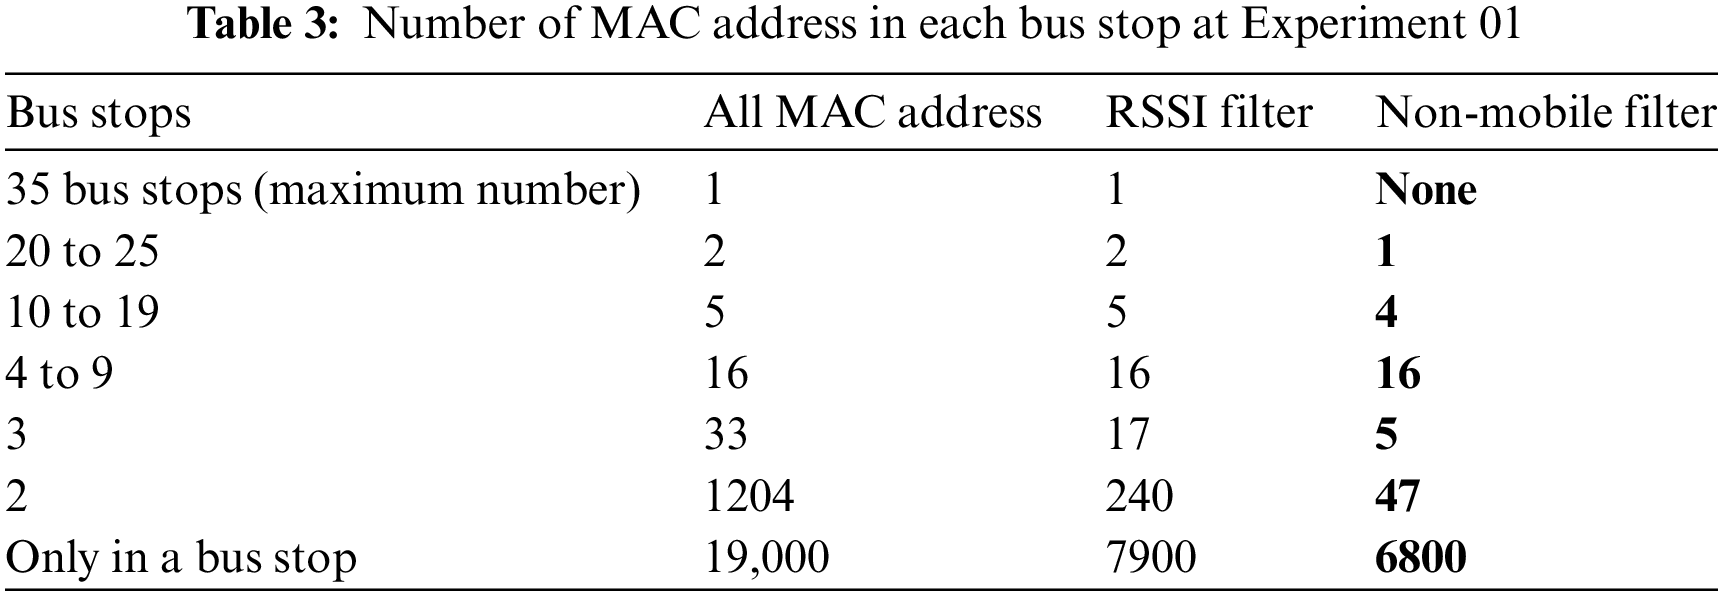
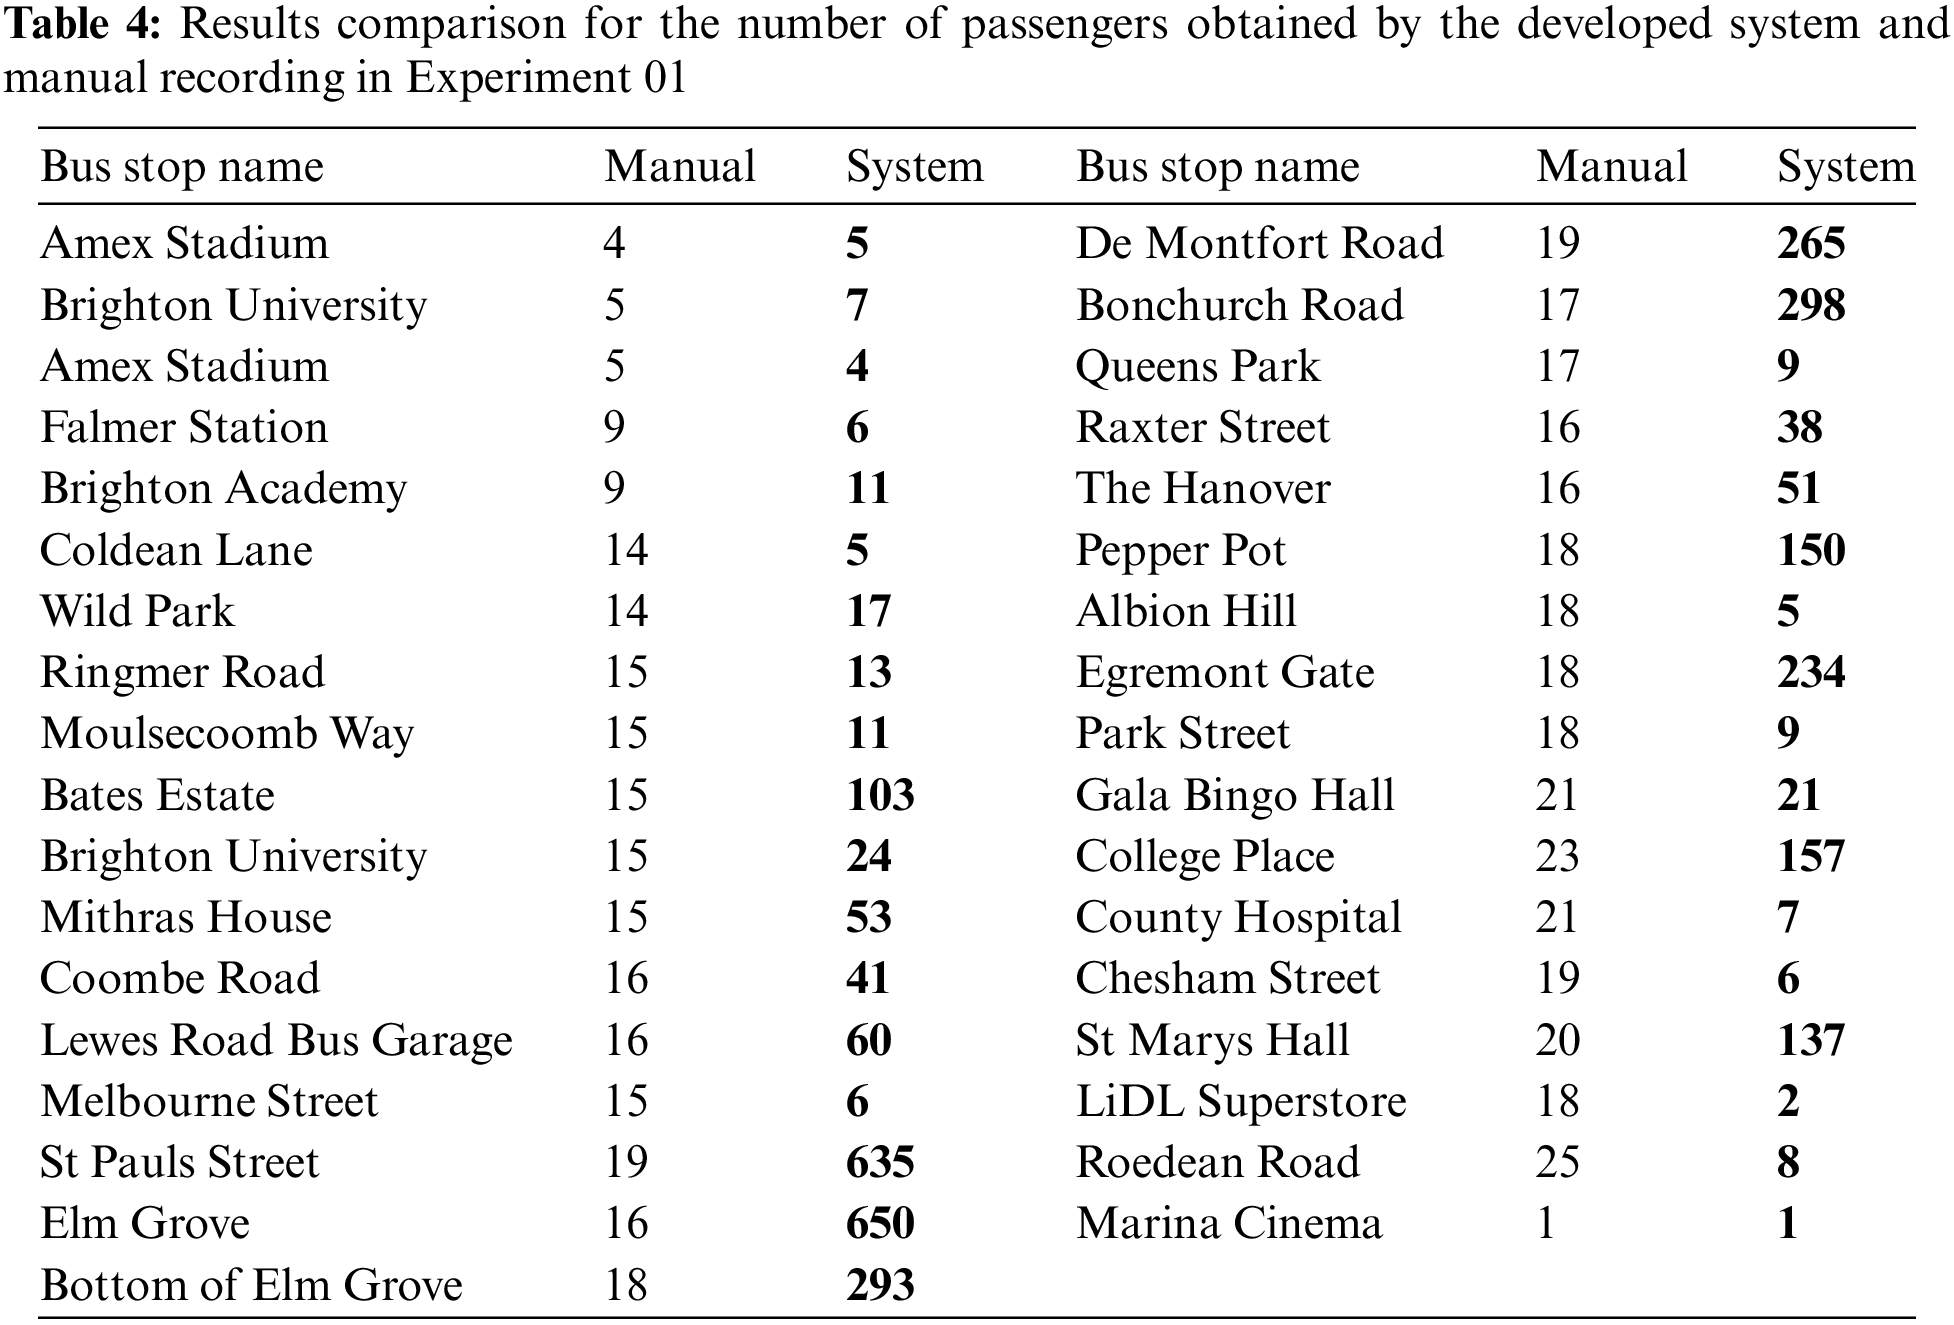
In the first experiment, data was collected from Bus 23 between Amex Stadium and Marina Cinema from 18:38:55 to 19:24:12. Over 20,000 unique MAC addresses were captured, with varying numbers at each bus stop. Table 2 displays the number of unique MAC addresses at each bus stop, with some stops having a large number of MAC addresses, such as Wild Park with approximately 3000 unique MAC addresses. However, this number does not necessarily reflect the number of people on the bus, as some MAC addresses may have been detected outside of the bus. From Table 3, it can be observed that 60 MAC addresses were captured three or more times. To remove the devices outside the bus, an RSSI filter is employed. As a result, the number of MAC addresses decreased to 8000. The number of MAC addresses after the RSSI filter is found with a decrease of approximately 58% at each bus stop. In fact, only 41 MAC addresses were captured more than twice. The data was further filtered to remove non-mobile devices, resulting in an average decrease of 33% in the number of MAC addresses at each bus stop. Furthermore, Table 4 shows the number of passengers recorded manually as compared to the obtained results of the developed system, indicating high accuracy in some places but lower accuracy in others, which will be discussed in the following section.
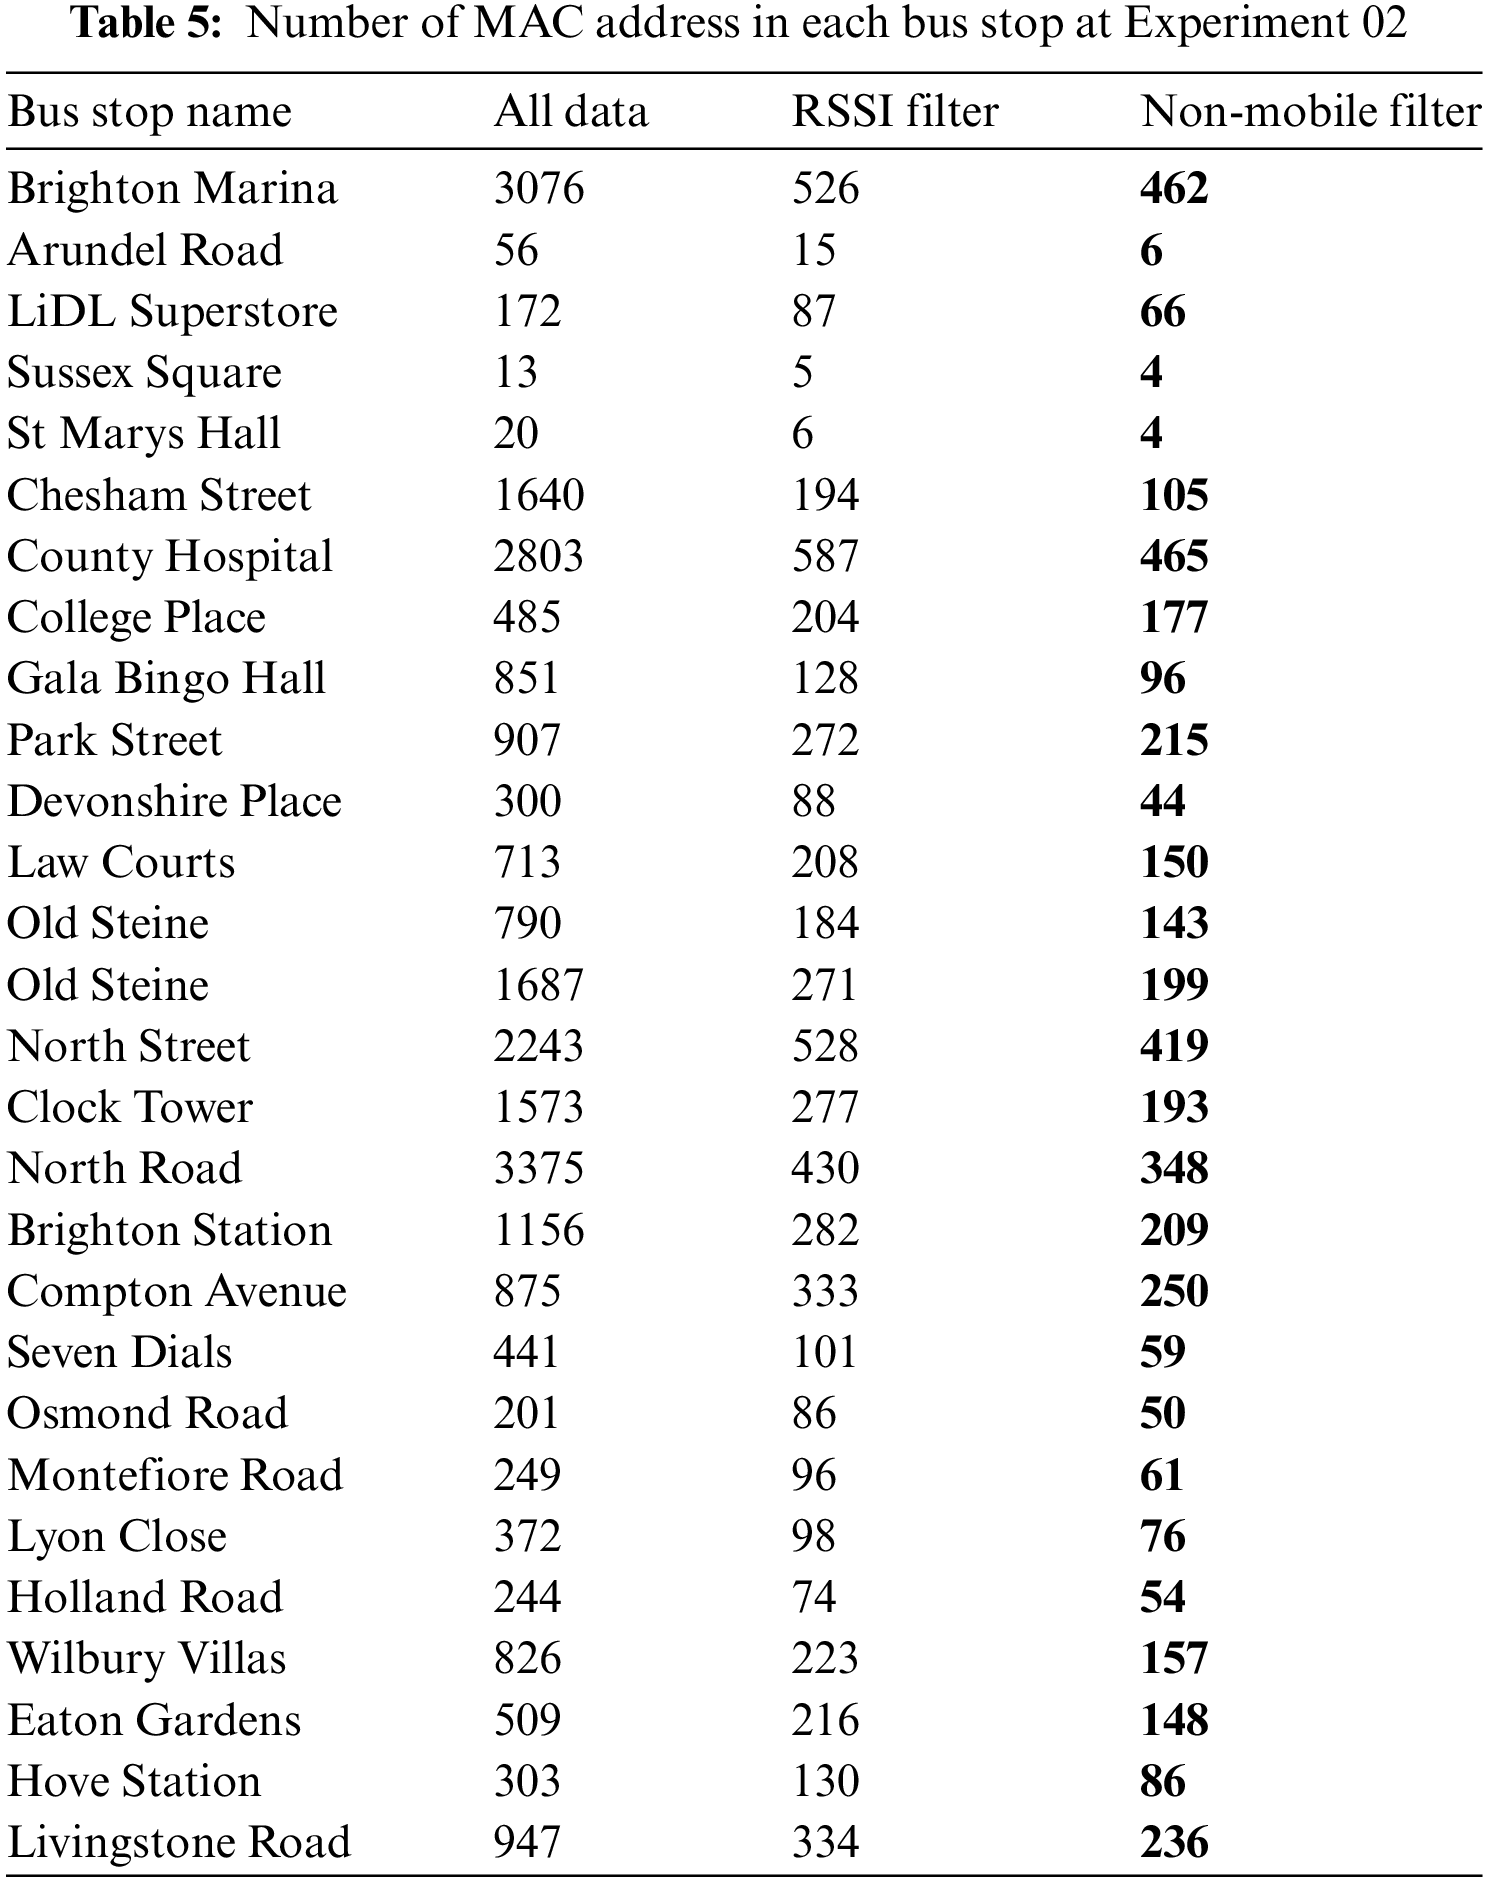
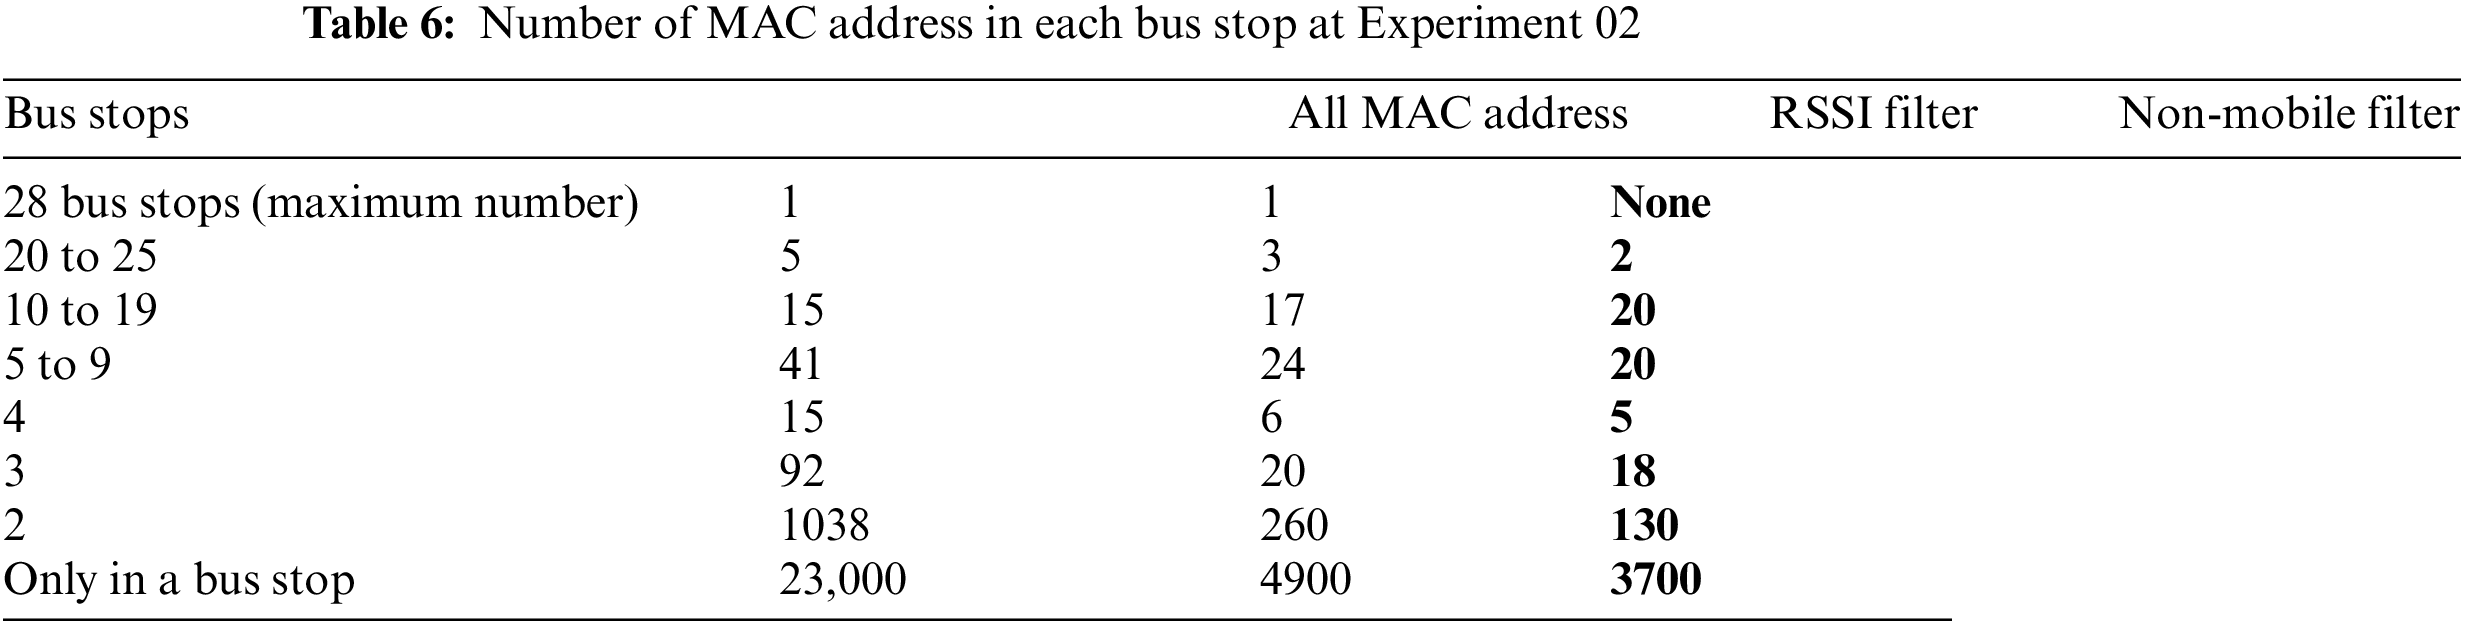
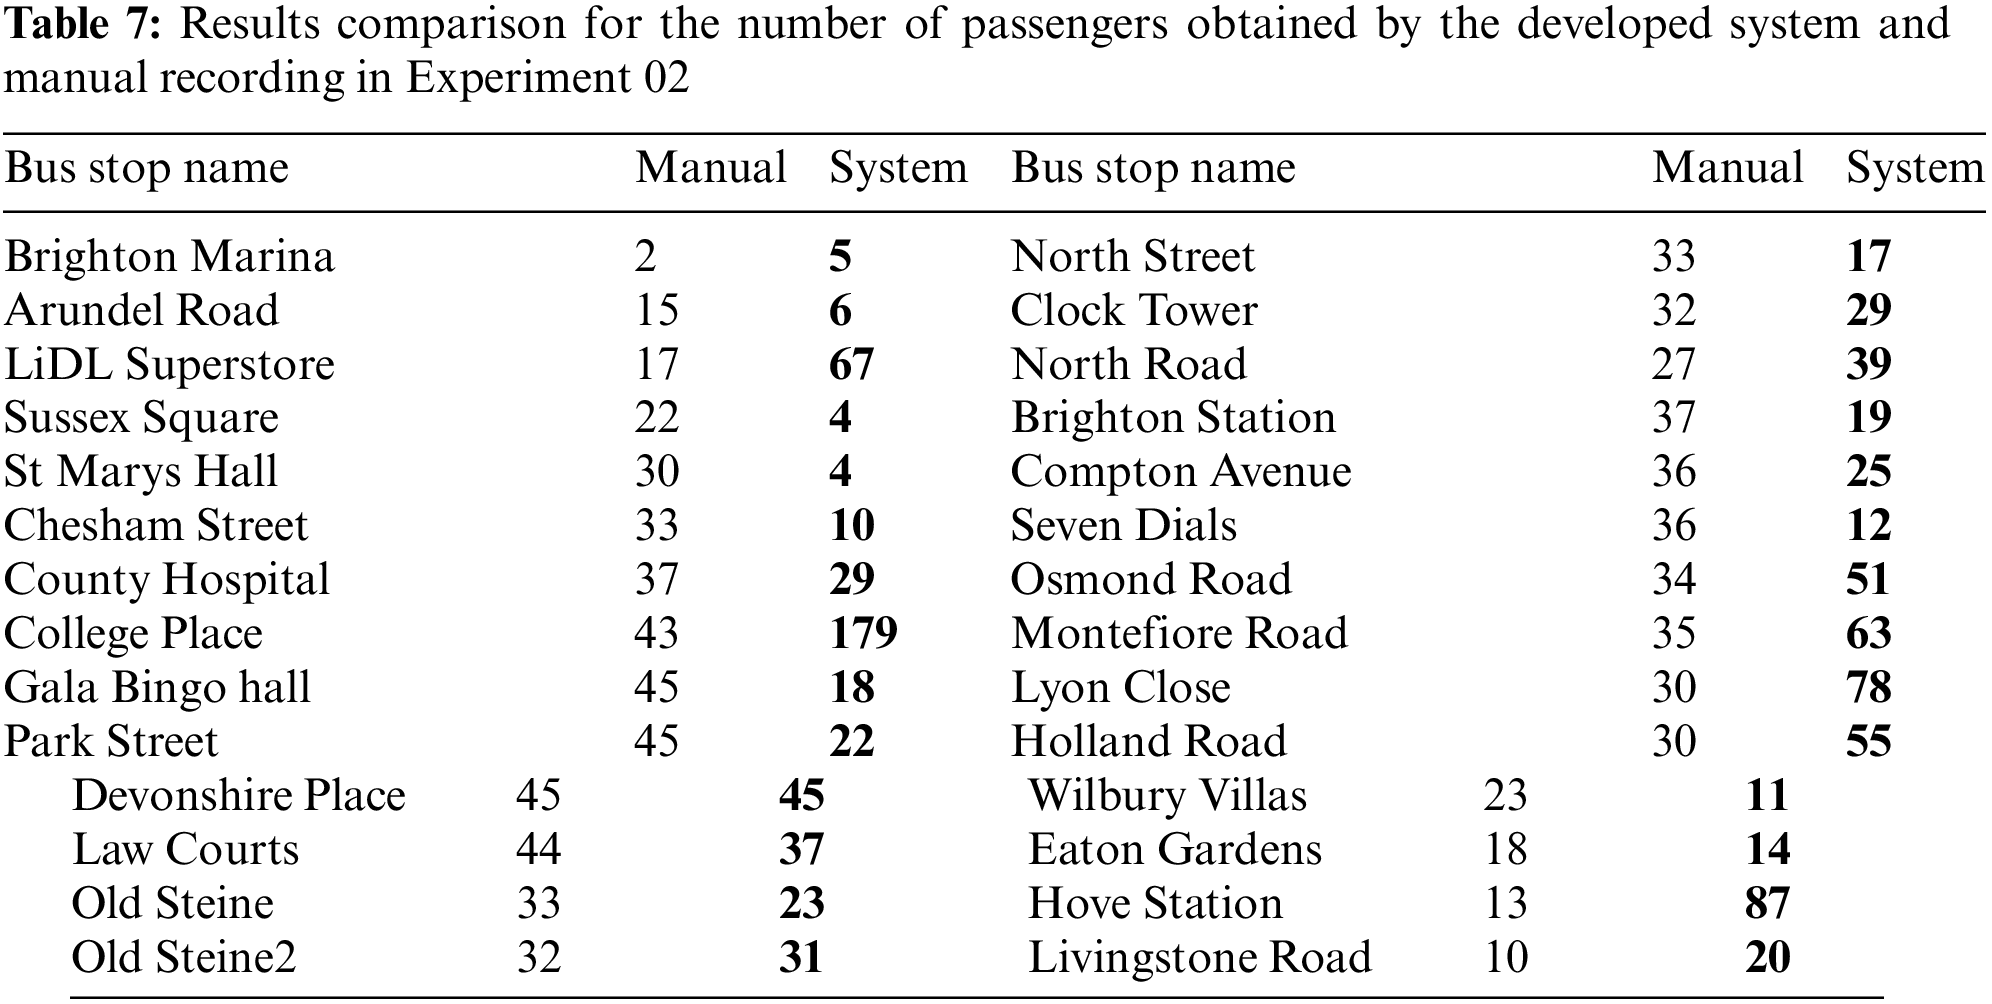
In the second experiment, Route 7 was selected to collect additional data between 19:36:43 and 20:13:20. The system successfully captured over 26,100 unique MAC addresses along the route from Brighton Marina to Livingstone Road. The number of MAC addresses was recorded in Table 5, with the majority of MAC addresses being captured at a single bus stop. However, approximately 4% of all MAC addresses, were captured at more than one bus stop, as shown in Table 6. After applying an RSSI filter, the number of MAC addresses decreased by almost 80%. The system then applied a non-mobile filter, which reduced the number of MAC addresses at each bus stop by an average of 25%, as shown in Table 6. Additionally, Table 7 shows the number of passengers recorded manually as compared to the obtained results of the developed system.
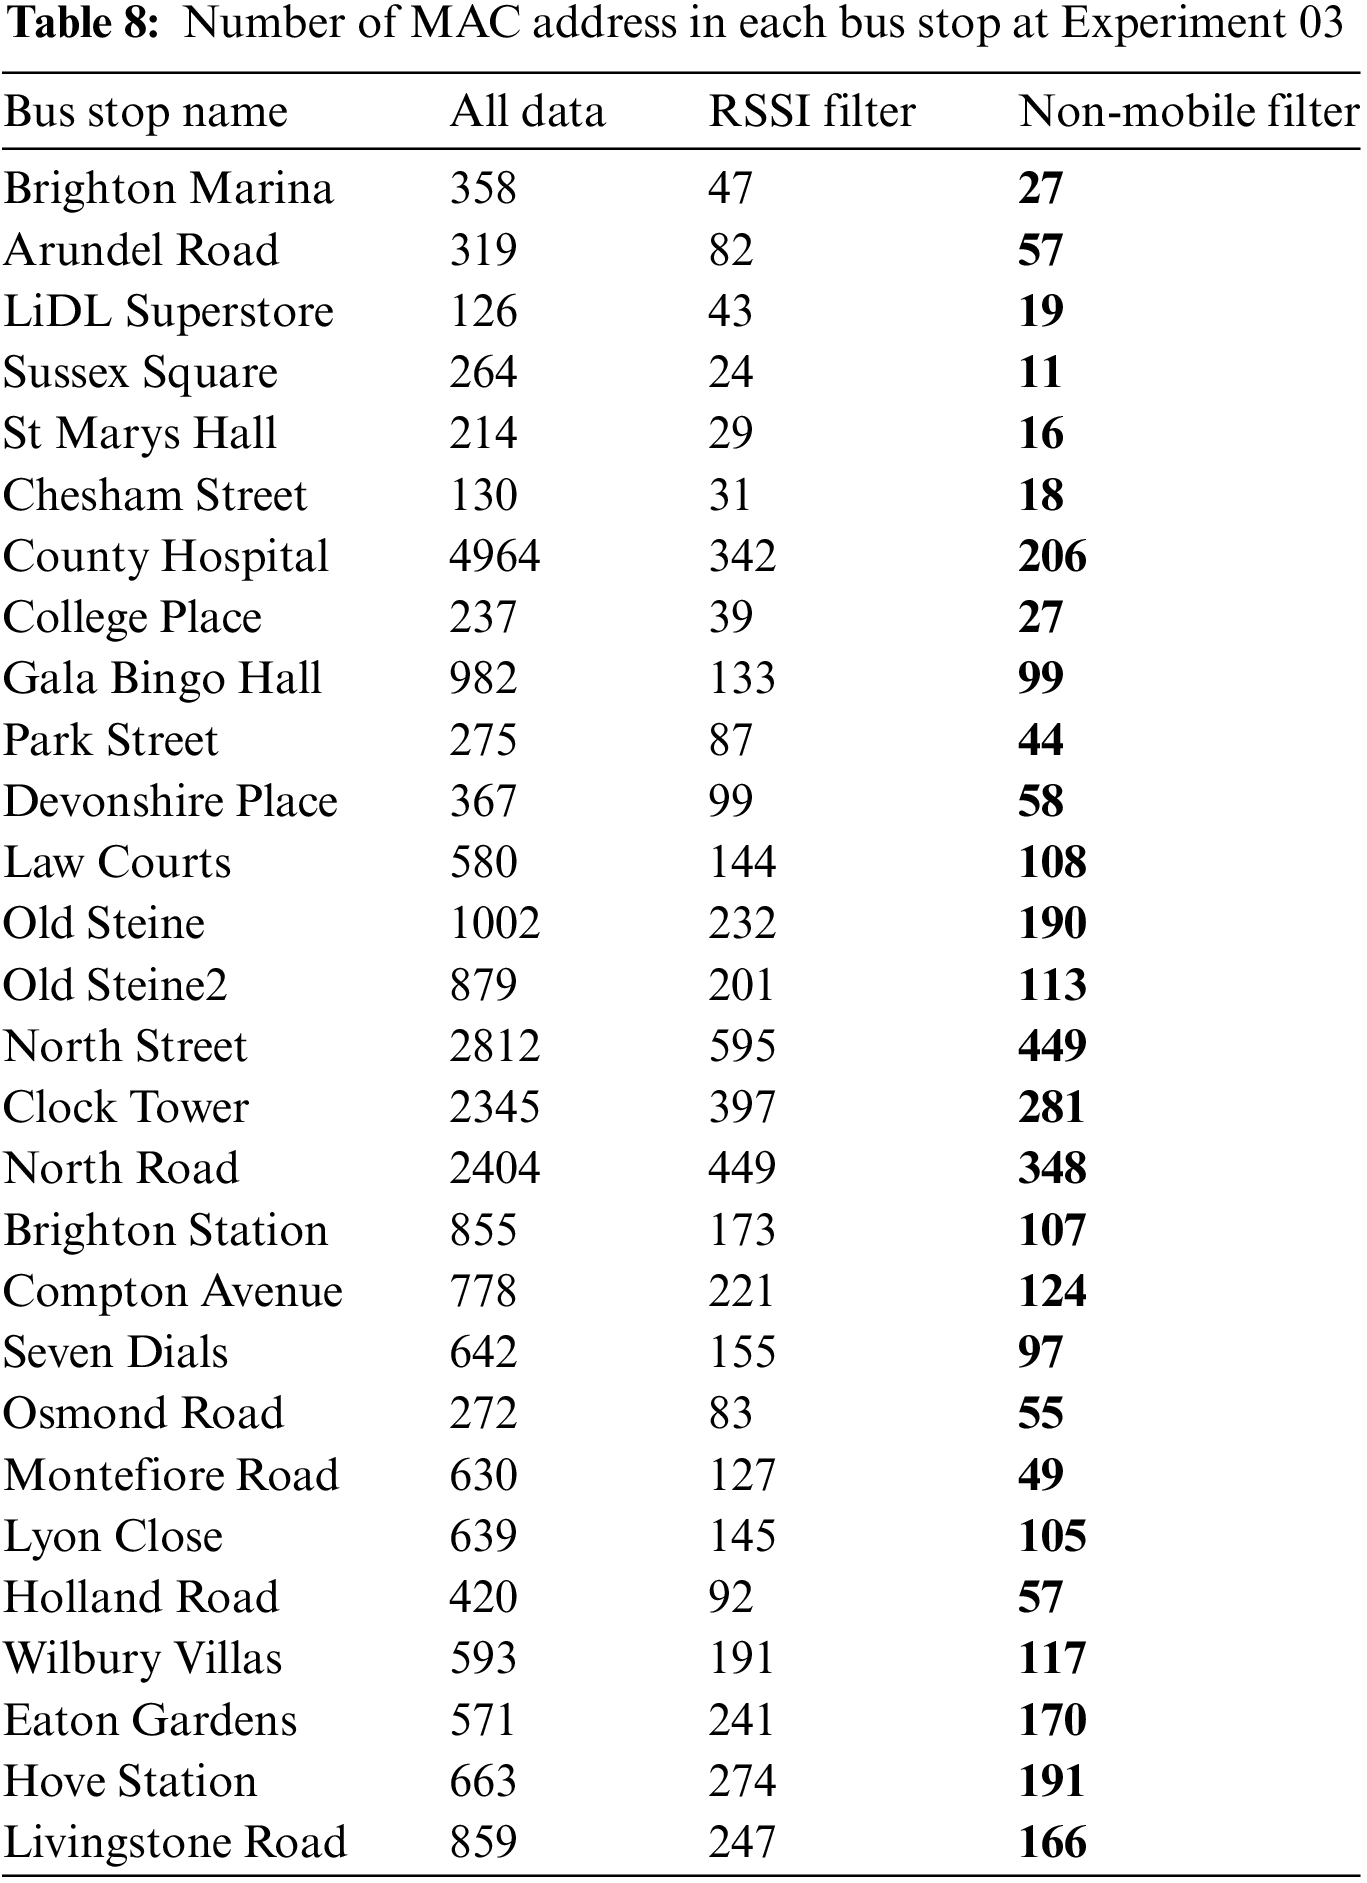
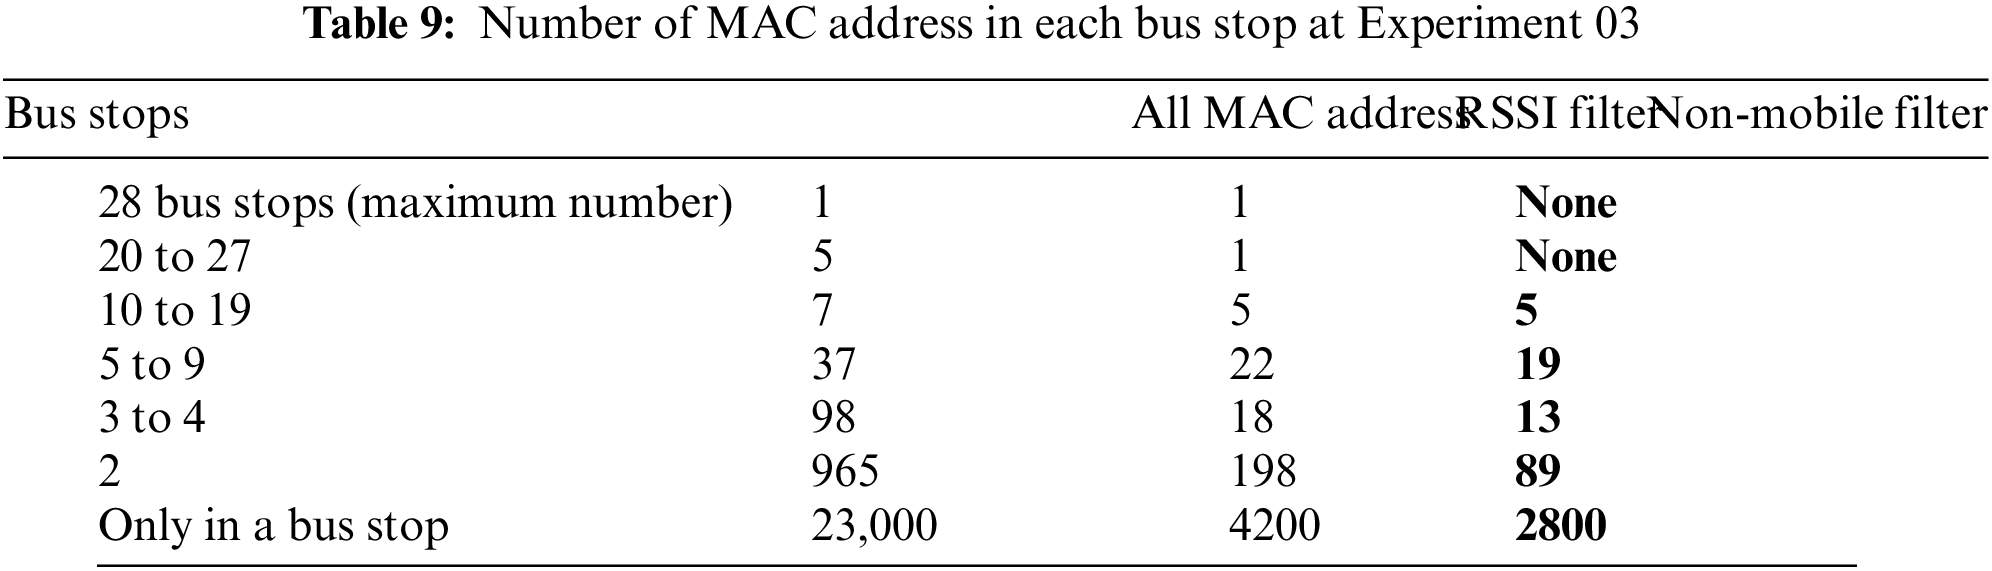
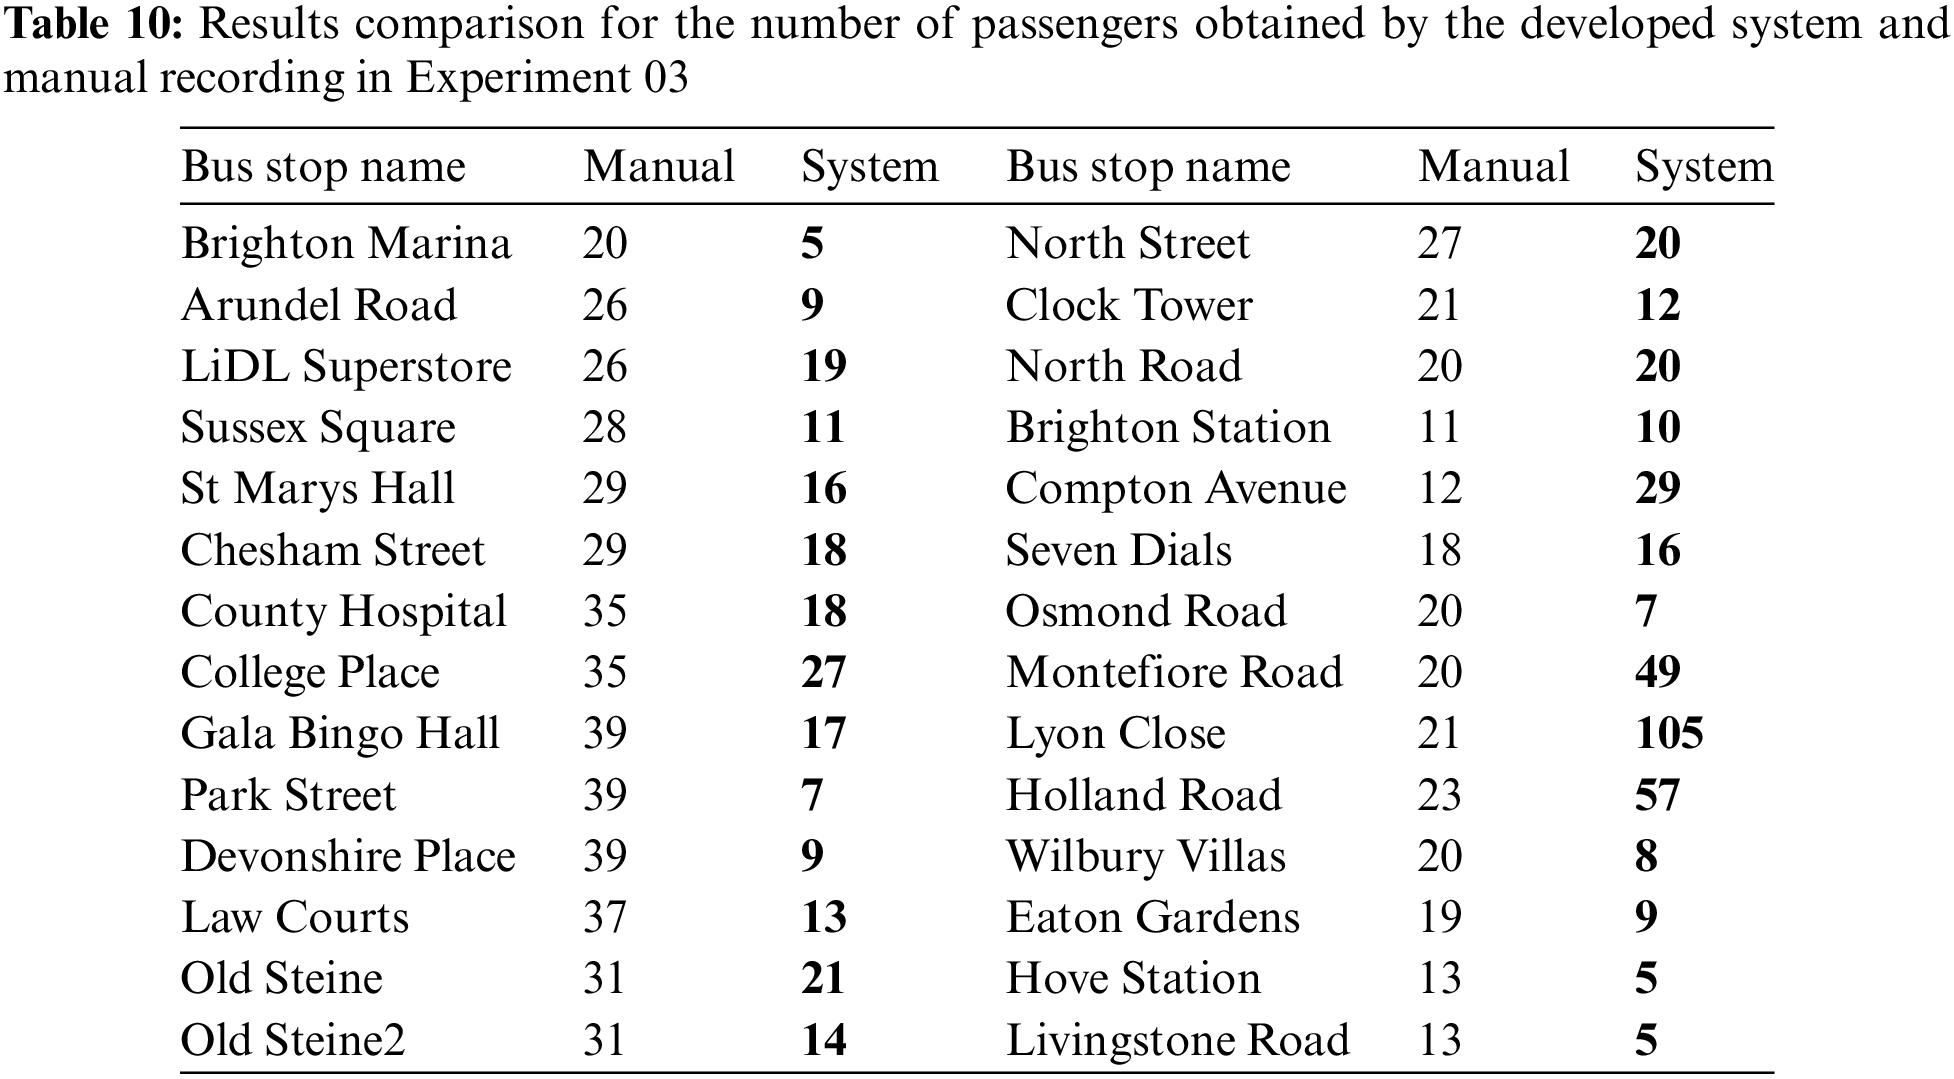
In this experiment, the same route as in the previous experiment is selected to collect more data. The experiment began at 09:20:24 and ended at 09:58:52, during which time the system captured over 24,000 unique MAC addresses from Brighton Marina to Livingstone Road. Table 8 displays the number of MAC addresses captured at each bus stop. The majority of MAC addresses were captured at only one bus stop, while around 5% of all MAC addresses were captured at more than one bus stop. Table 9 provides information on the number of MAC addresses captured at multiple bus stops. After applying an RSSI filter, the number of MAC addresses decreased by around 80%. Table 8 displays the number of MAC addresses captured at each bus stop after the RSSI filter was applied. Table 9 provides further information on the MAC addresses captured at multiple bus stops. After that, a non-mobile filter is employed, which resulted in an average 35% decrease in the number of MAC addresses captured at each bus stop. Furthermore, Table 10 shows the number of passengers recorded manually as compared to the obtained results of the developed system.
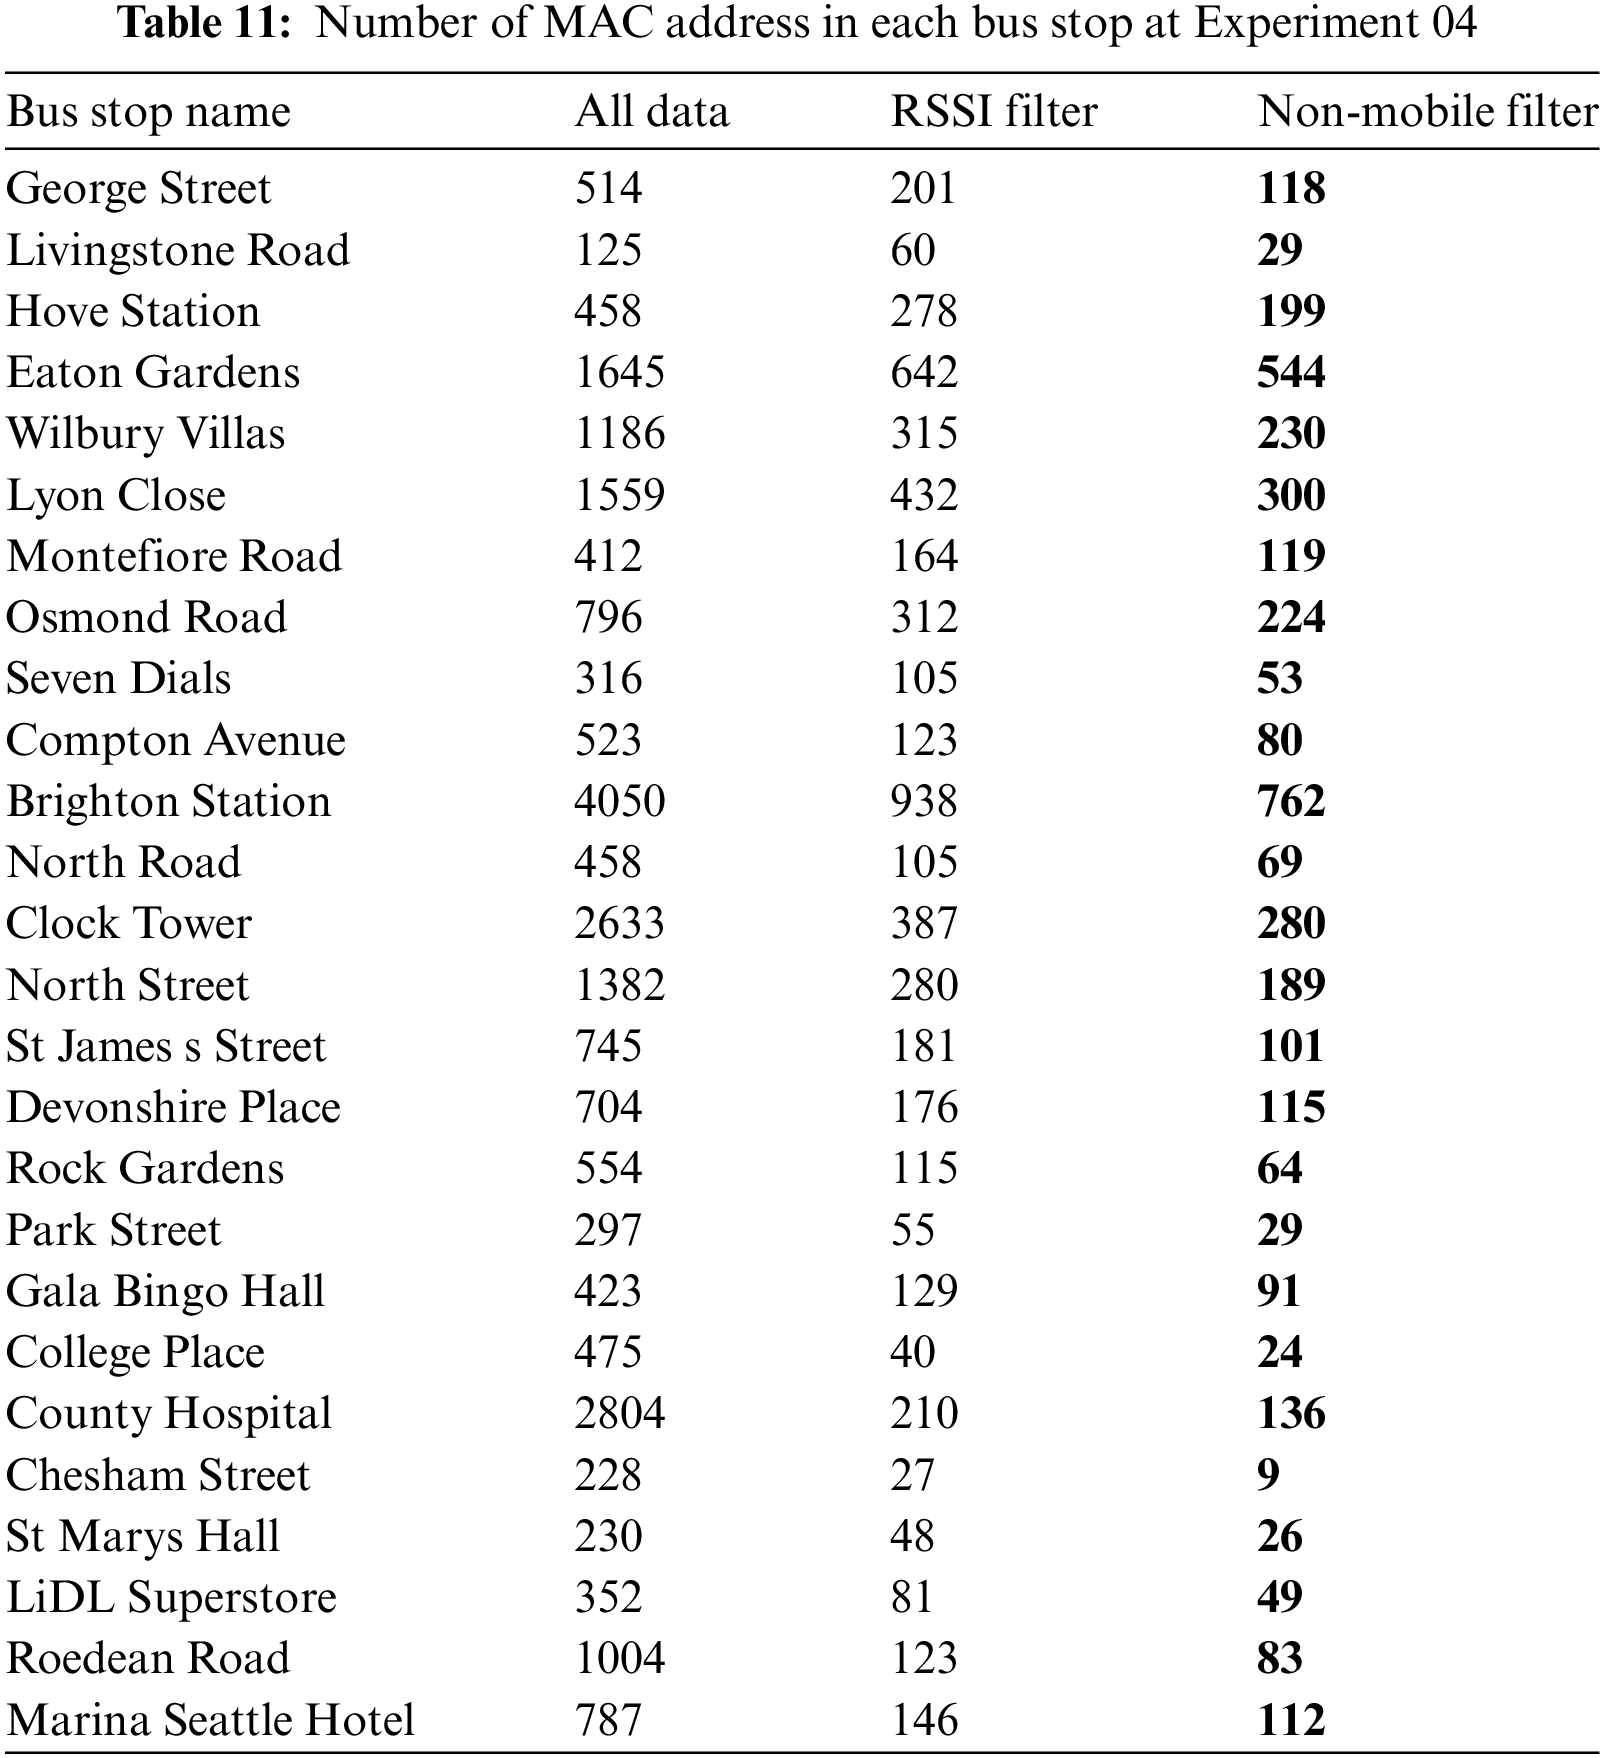
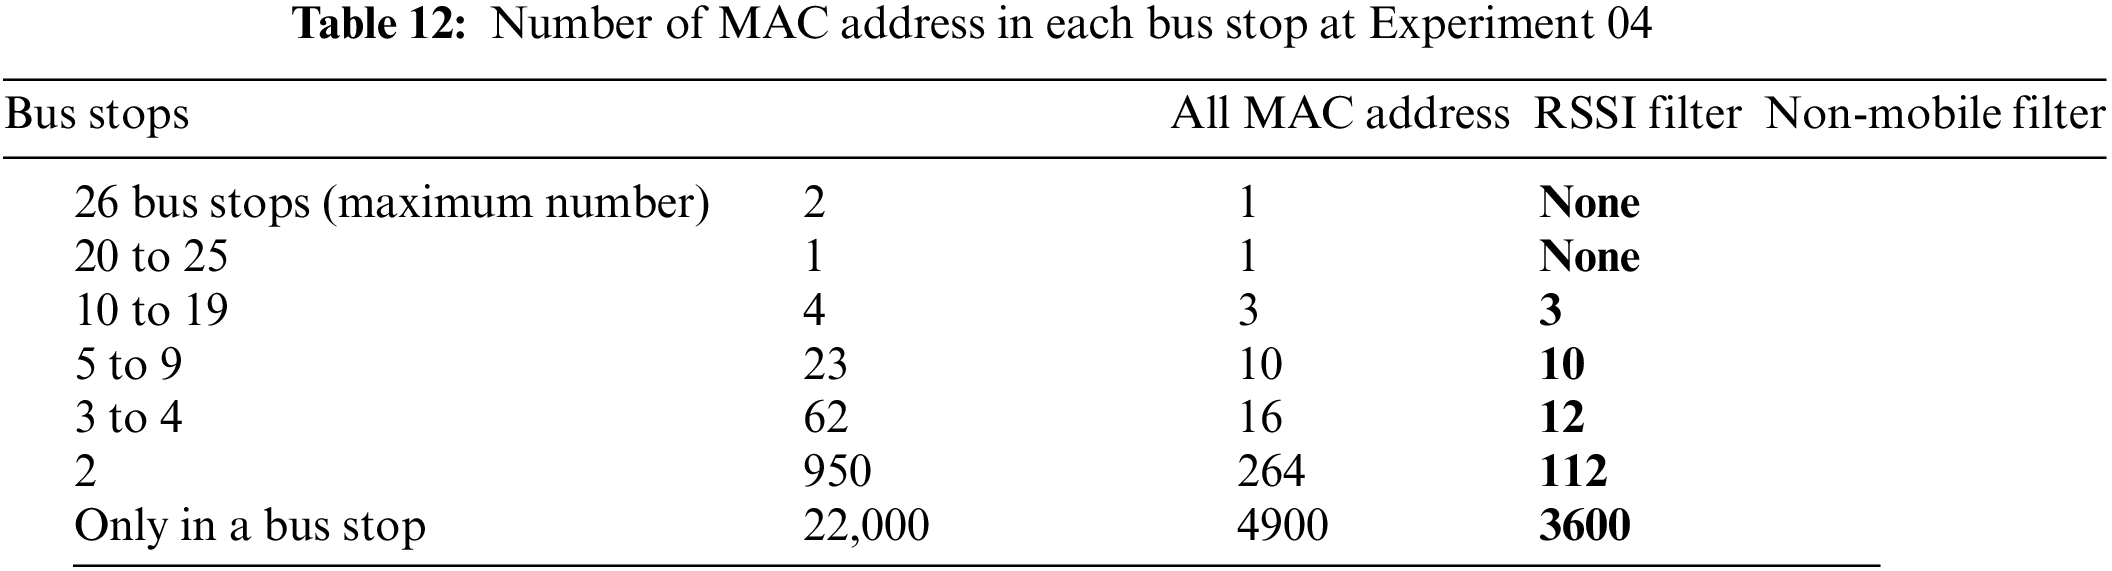
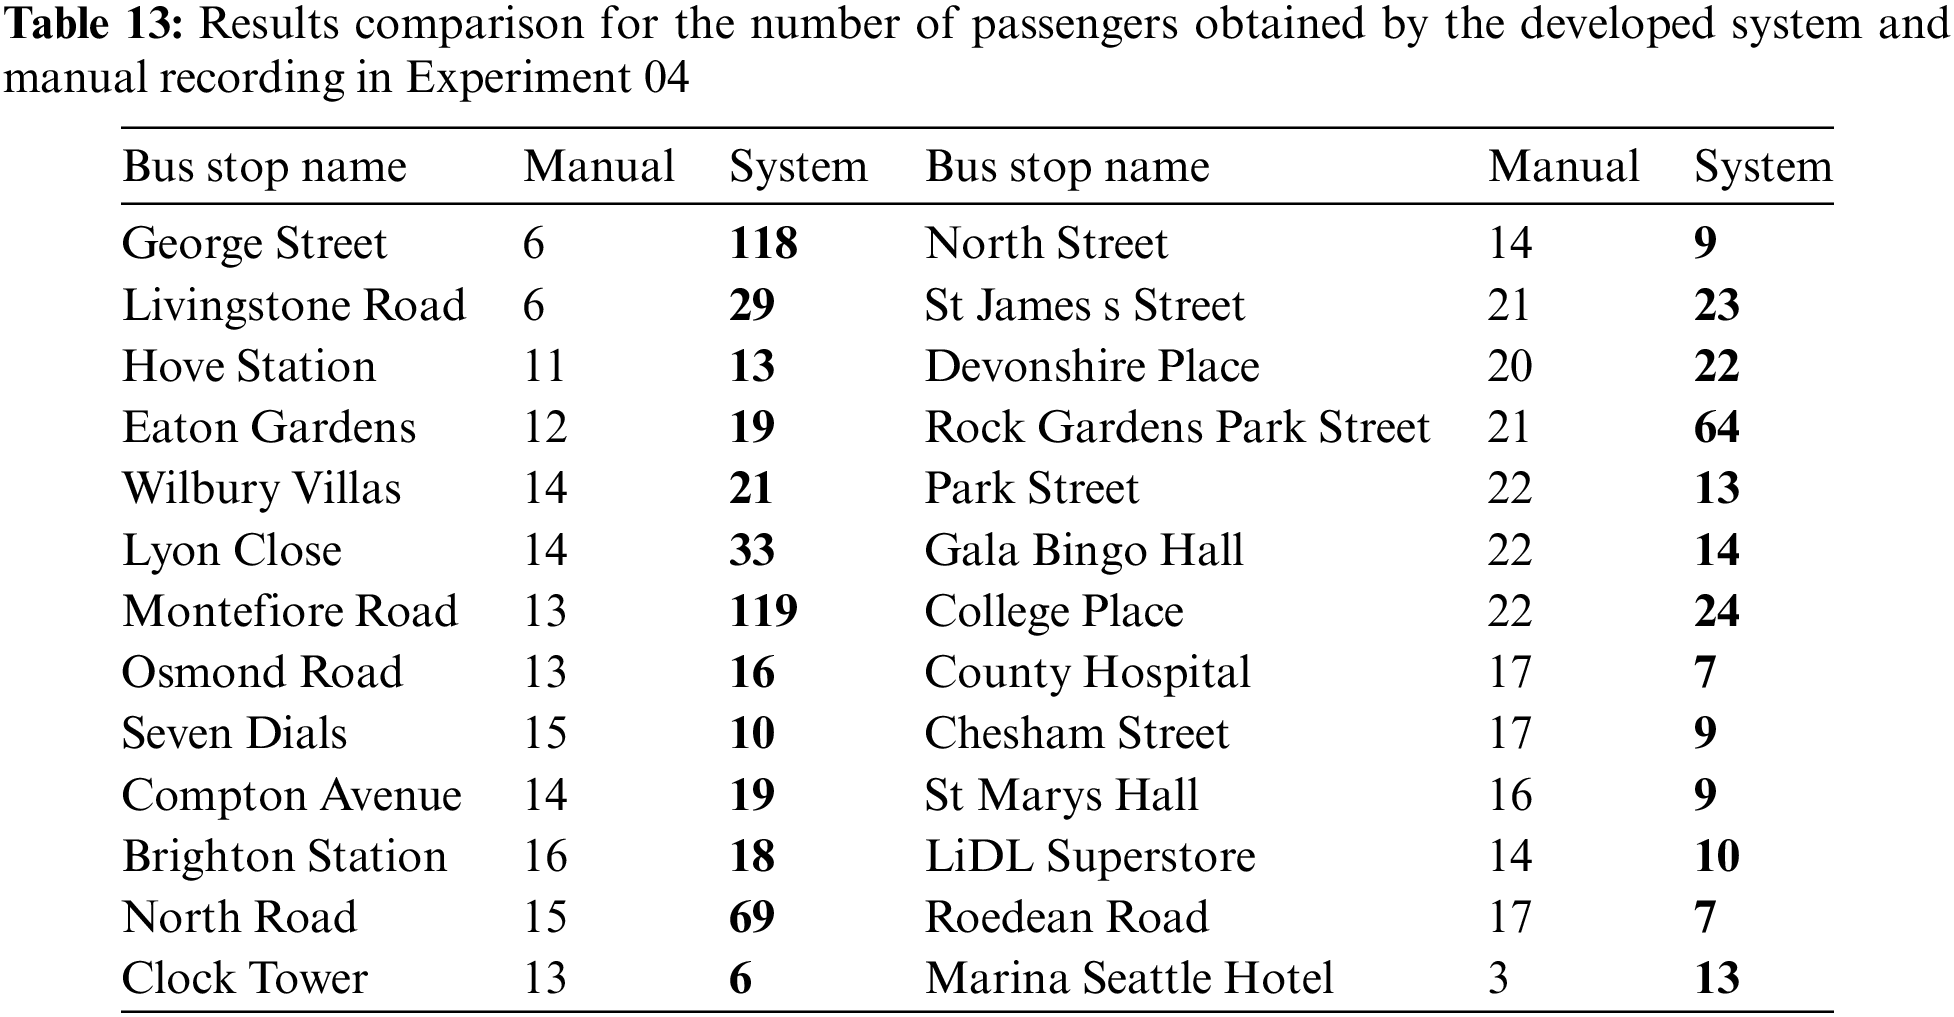
In this experiment, the data was collected along a route passing through the city center, beginning at 10:00:55 and ending at 10:39:22. The system recorded over 23,800 unique MAC addresses between George Street and Marina Seattle Hotel. Table 11 displays the number of MAC addresses captured at each bus stop, with the majority of MAC addresses being captured at only one bus stop. However, around 5% of all MAC addresses were captured at more than one bus stop, as shown in Table 12. After applying an RSSI filter, the number of MAC addresses decreased by approximately 79%, as indicated in Table 11. The researchers then applied a non-mobile filter, resulting in an average 29% decrease in the number of MAC addresses captured at each bus stop. Additionally, Table 13 shows the number of passengers recorded manually as compared to the obtained results of the developed system.
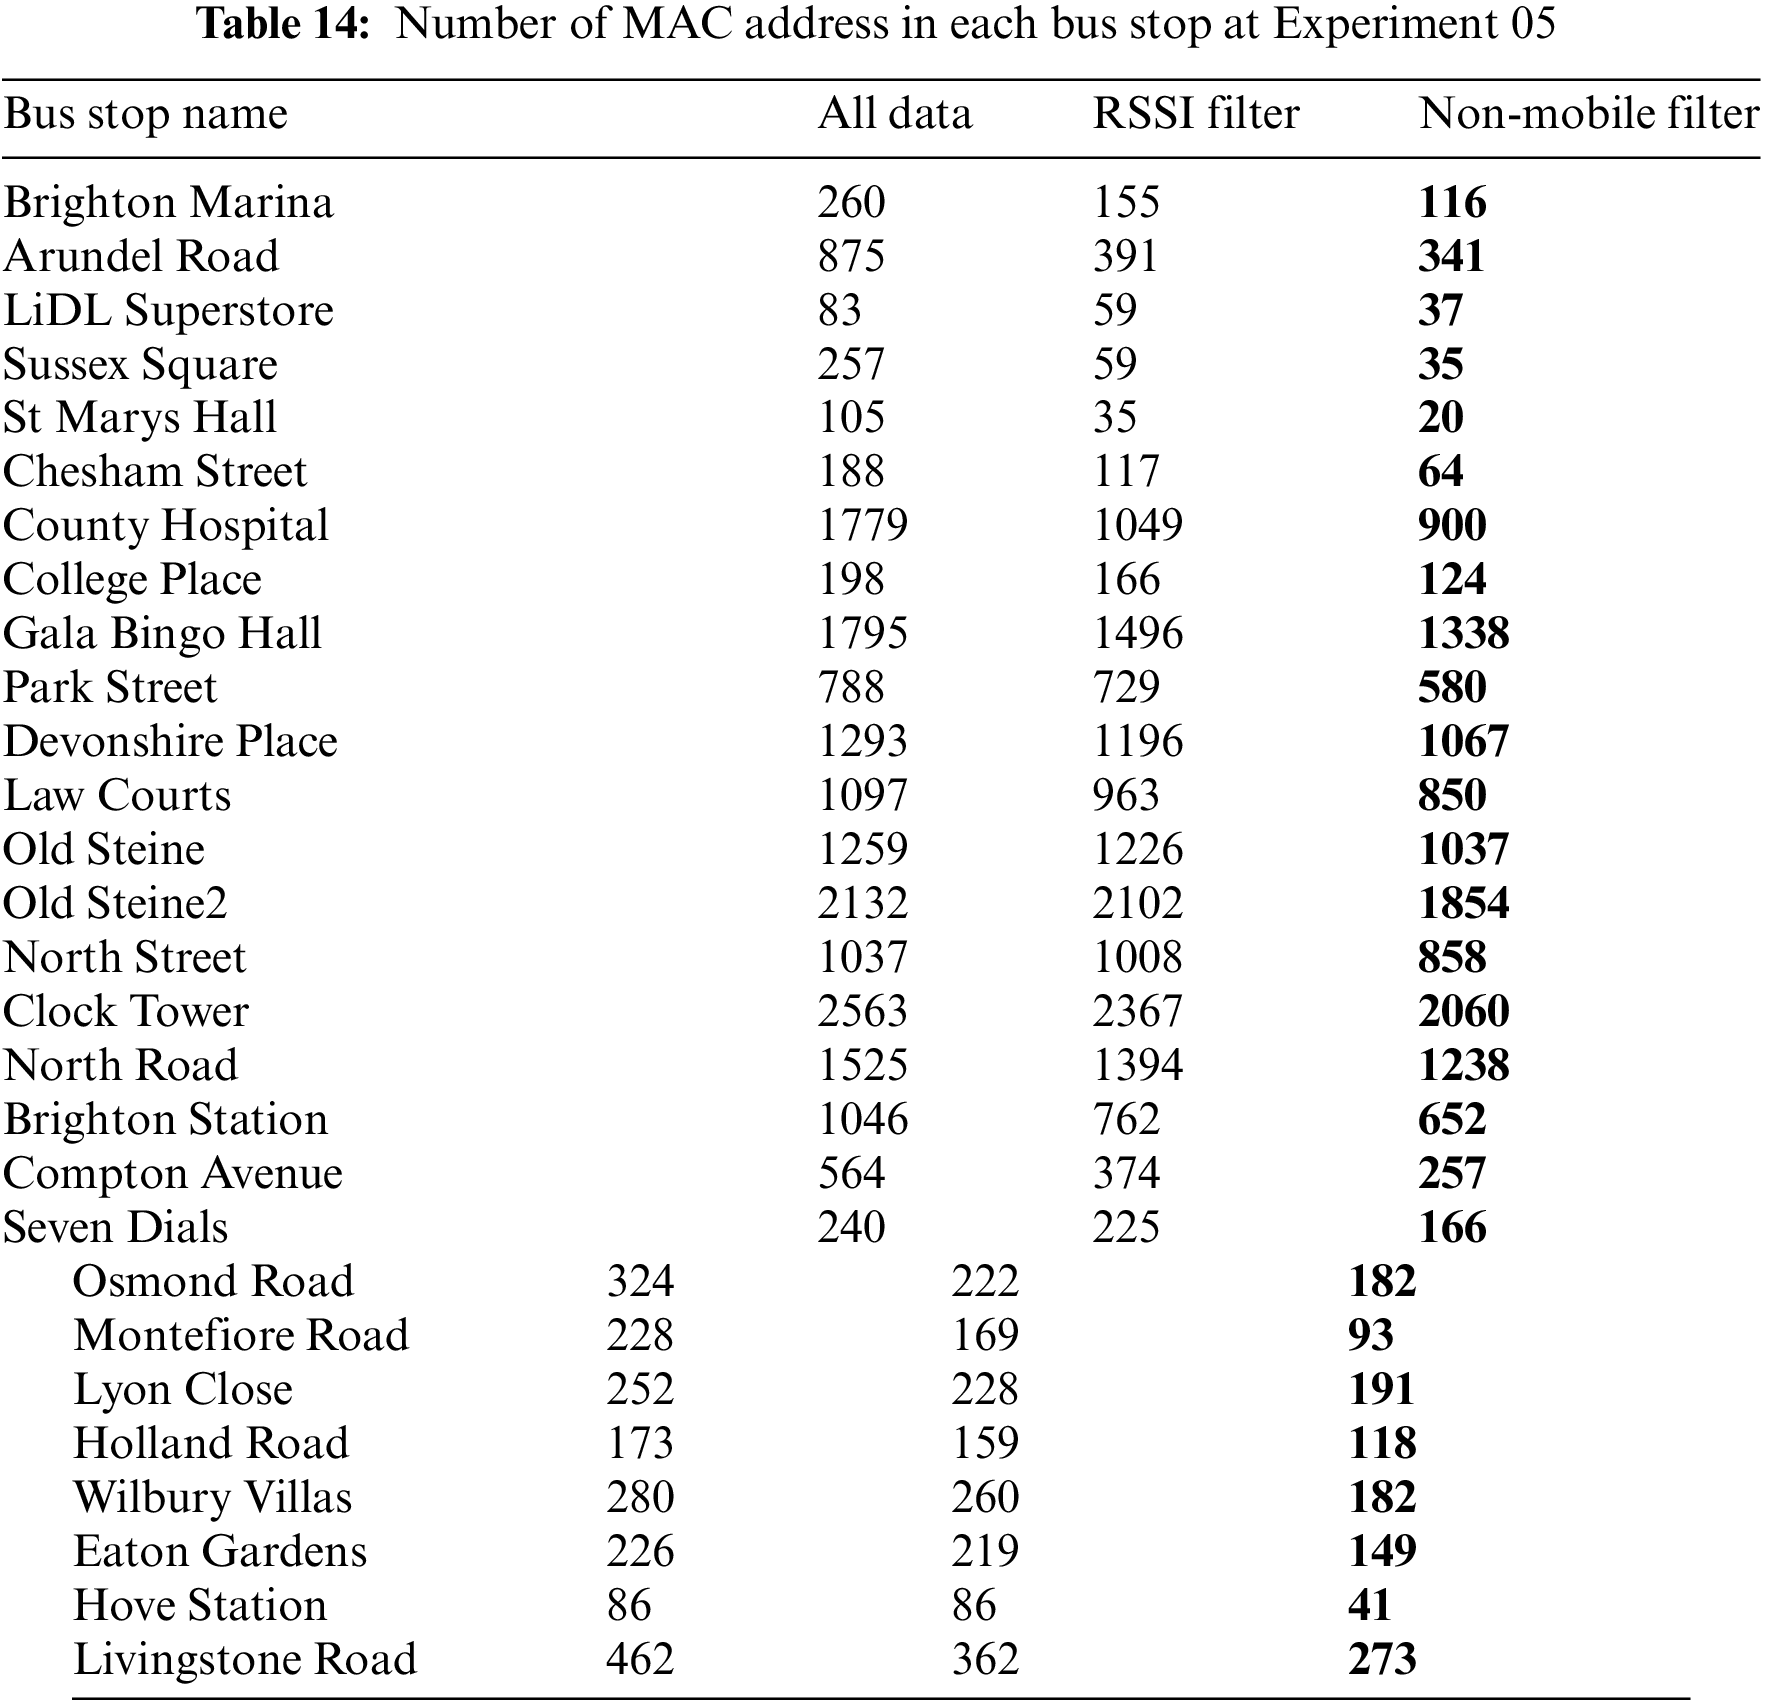
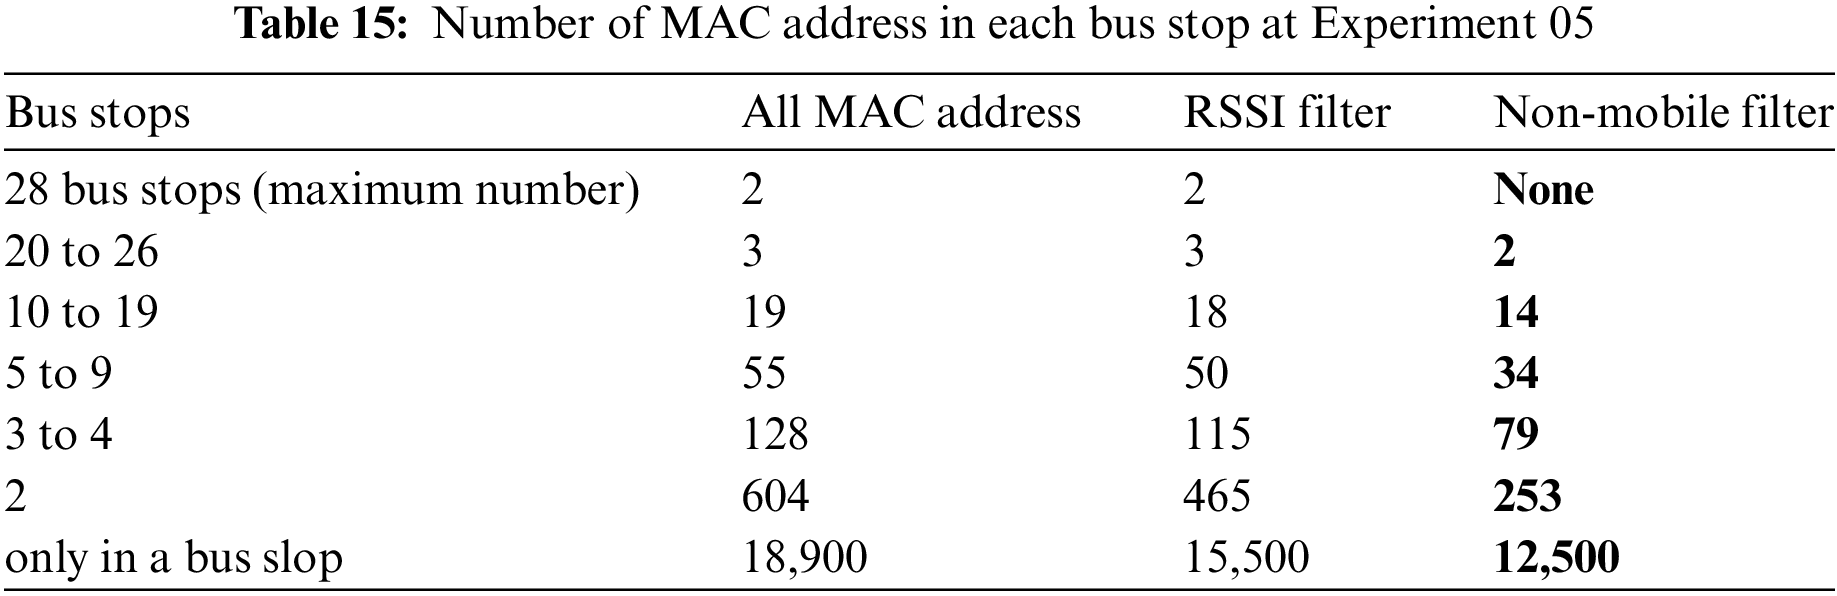
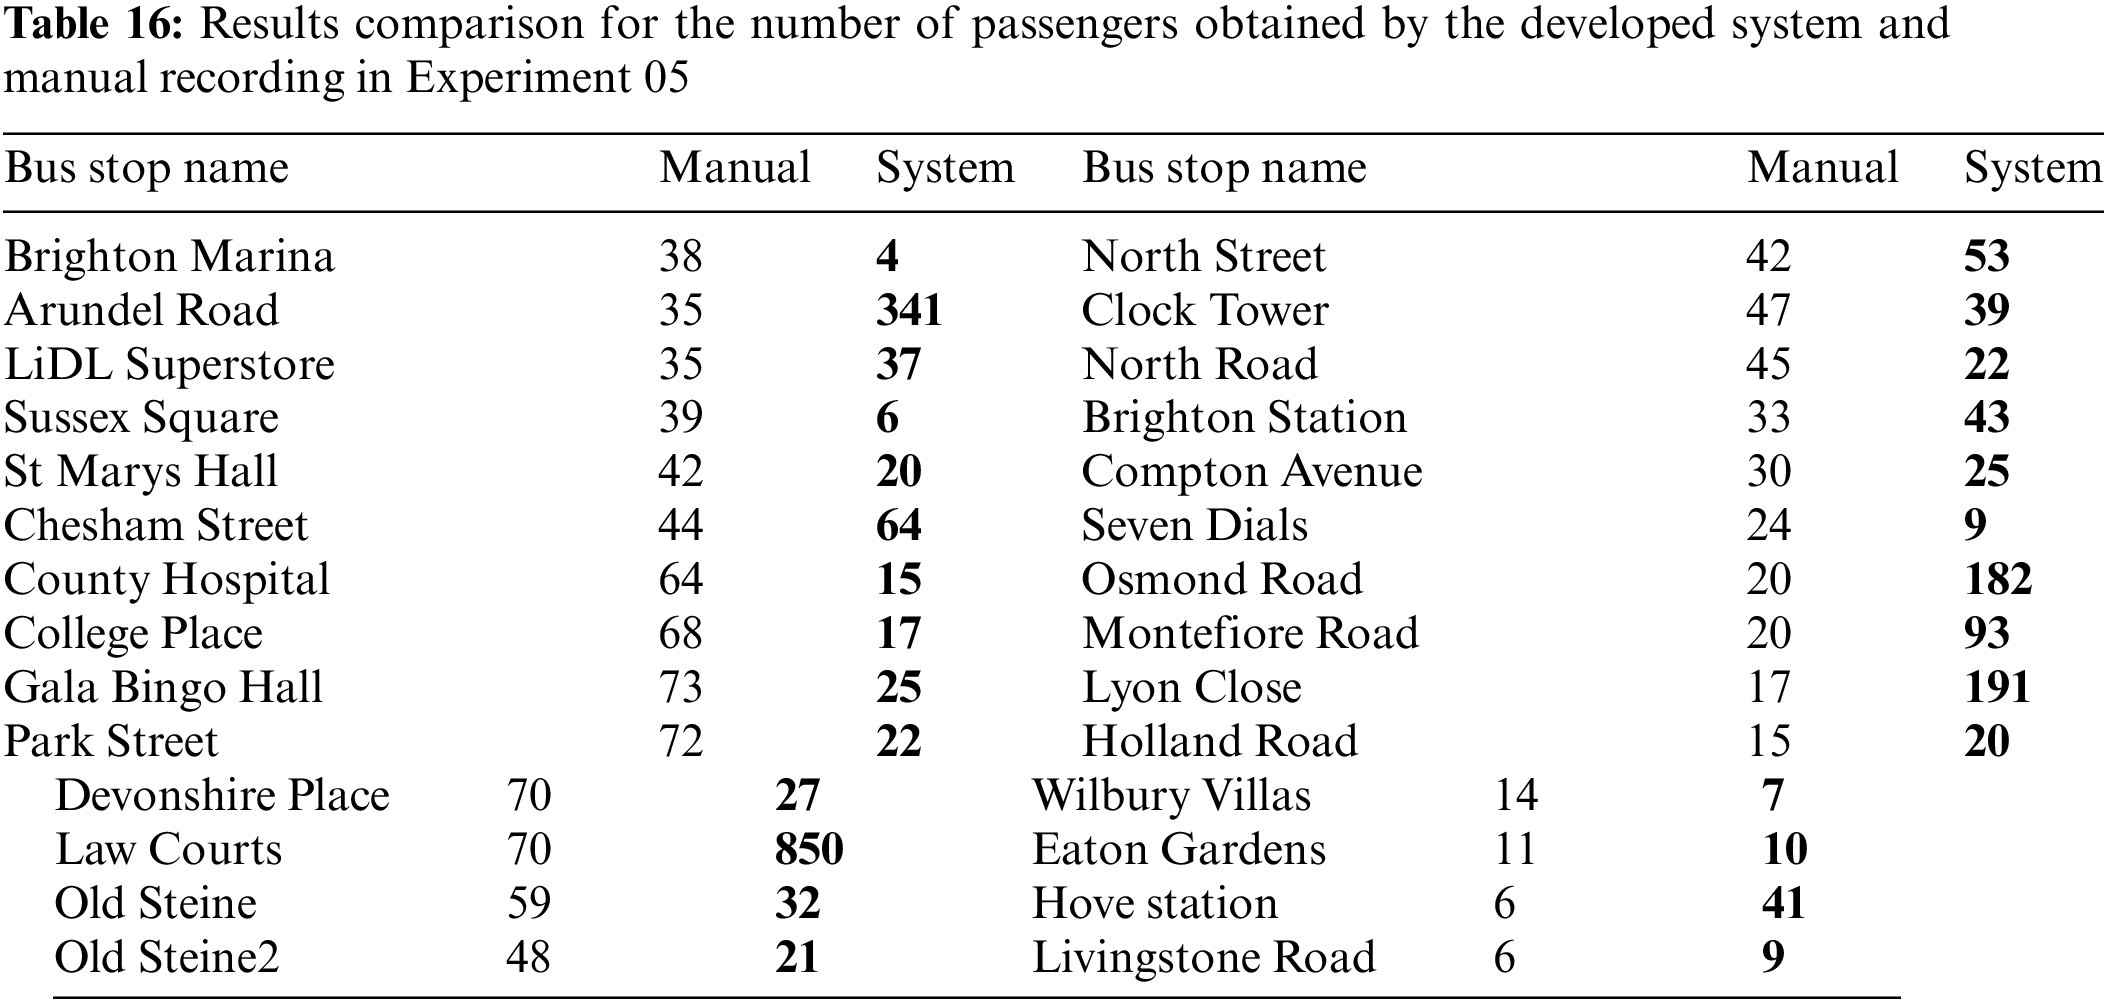
In this experiment, the data was collected at different times along Route 7. The system captured over 19,900 unique MAC addresses from Brighton Marina to Livingstone Road, with Table 14 displaying the number of MAC addresses at each bus stop. While the majority of MAC addresses were captured at only one bus stop, approximately 4% of all MAC addresses were captured at more than one bus stop, as shown in Table 15. After filtering the data with an RSSI filter, the number of MAC addresses decreased by around 19%, with Table 14 displaying the number of MAC addresses in each bus stop after the RSSI filter was applied. The data was then filtered again with a non-mobile filter, resulting in an average 21% decrease in the number of MAC addresses at each bus stop. Table 15 displays the number of MAC addresses captured at more than one bus stop after the non-mobile filter was applied. Additionally, Table 16 shows the number of passengers recorded manually as compared to the obtained results of the developed system.
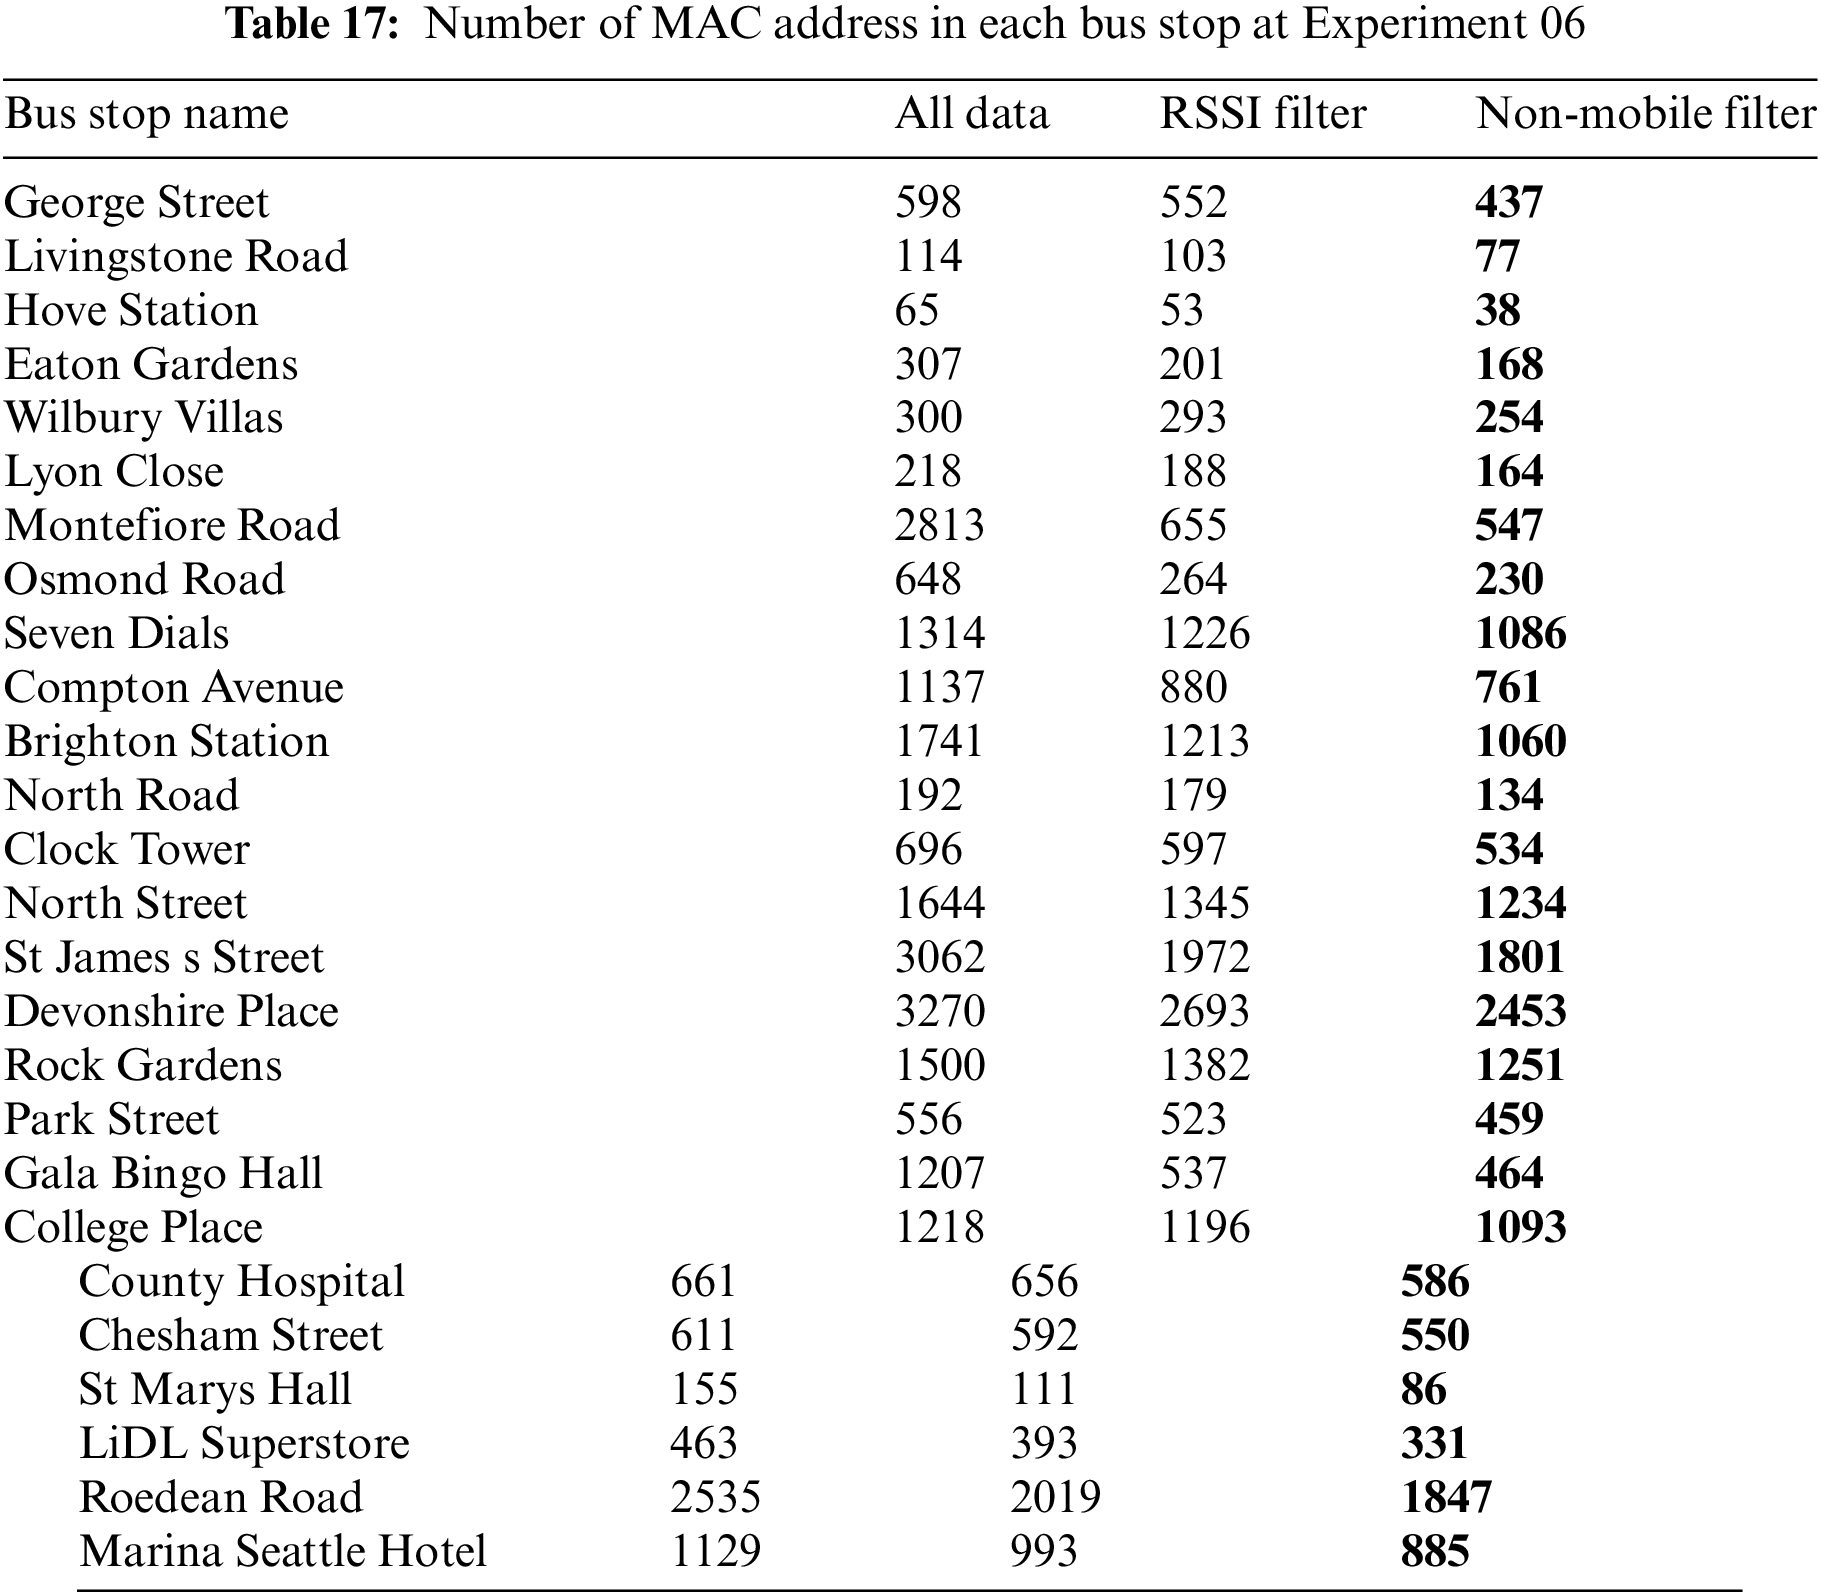
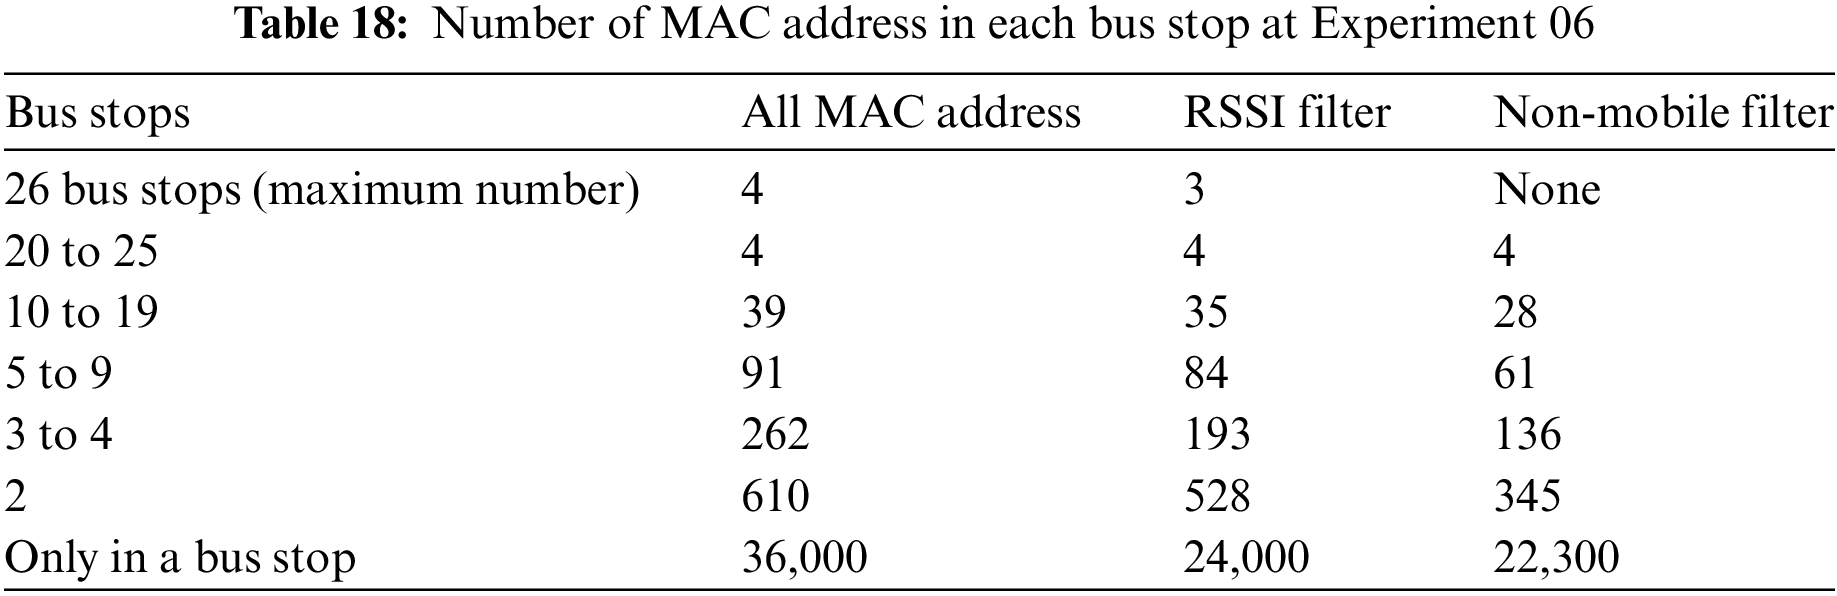
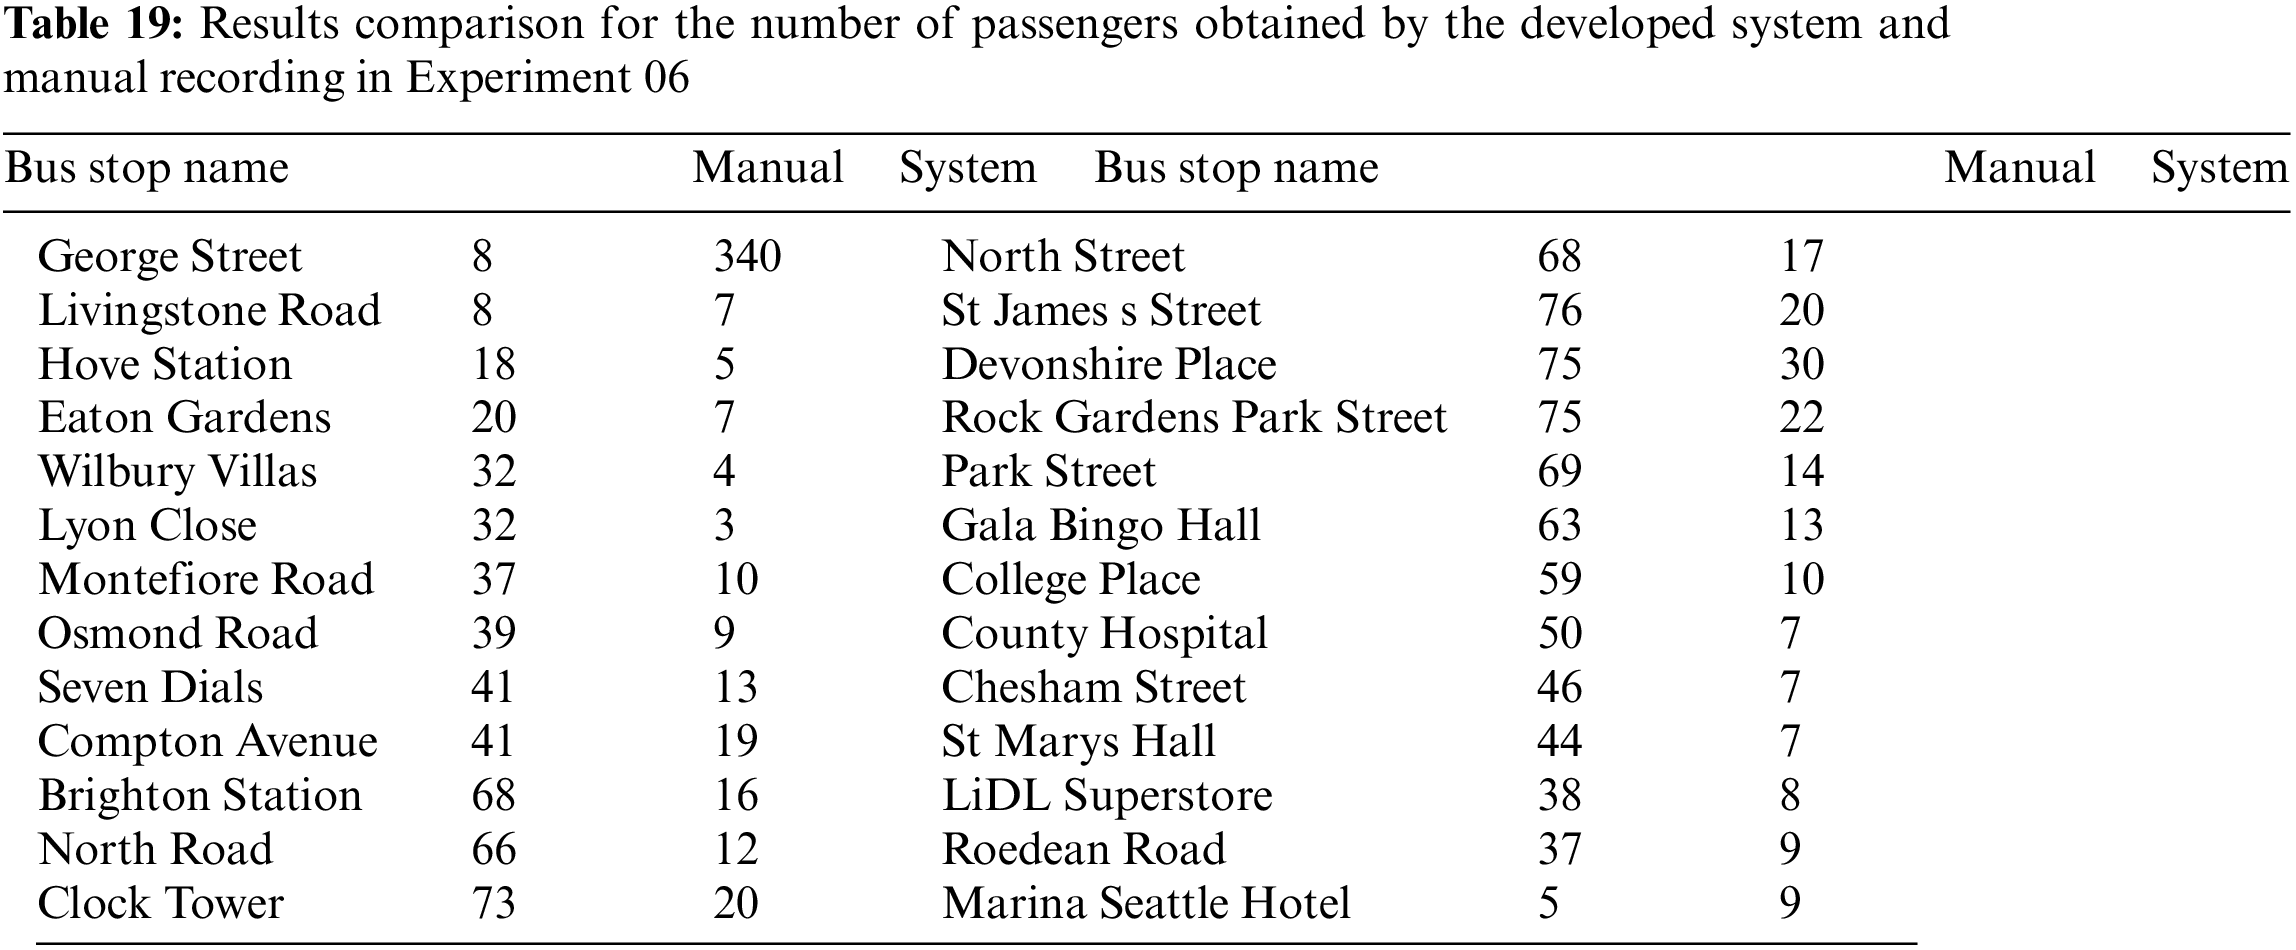
In the final experiment, a data analysis was conducted on Route 7 at different times. The system captured over 37,000 unique MAC addresses between George Street and Marina Seattle Hotel. Table 17 displays the number of MAC addresses at each bus stop, with the majority of MAC addresses being captured at only one bus stop. However, around 10% of all MAC addresses were captured at more than one bus stop, as shown in Table 18. After applying an RSSI filter, the number of MAC addresses decreased by approximately 31%. The data was then filtered again with a non-mobile filter, resulting in an average 10% decrease in the number of MAC addresses at each bus stop, as shown in Table 18. Additionally, Table 19 shows the number of passengers recorded manually as compared to the obtained results of the developed system.
In this particular section, we conduct a comprehensive assessment of the proposed system’s performance drawing from the achieved outcomes. More specifically, emphasis is laid on the accuracy, false positive rate (FPR), and sensitivity. These essential metrics are elucidated through the establishment of certain key values for each experiment:
• True Positives (TP): These are the cases where the system correctly identified the number of passengers.
• False Positives (FP): These are the cases where the system incorrectly identified an excess number of passengers.
• False Negatives (FN): These are the cases where the system incorrectly identified fewer passengers than there actually were.
• True Negatives (TN): These are the cases where the system correctly identified an absence of passengers.
Following the derivation of these fundamental values, the metrics of accuracy, sensitivity, and FPR are computed utilizing the subsequent equations:
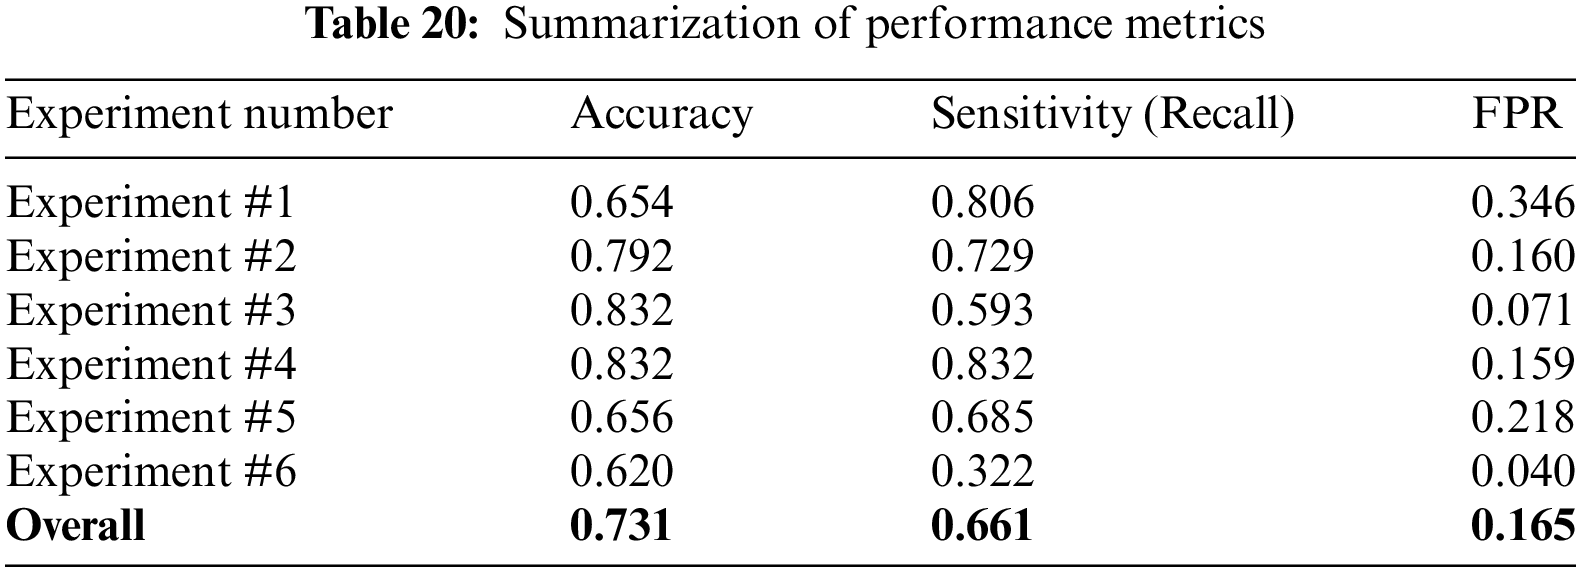
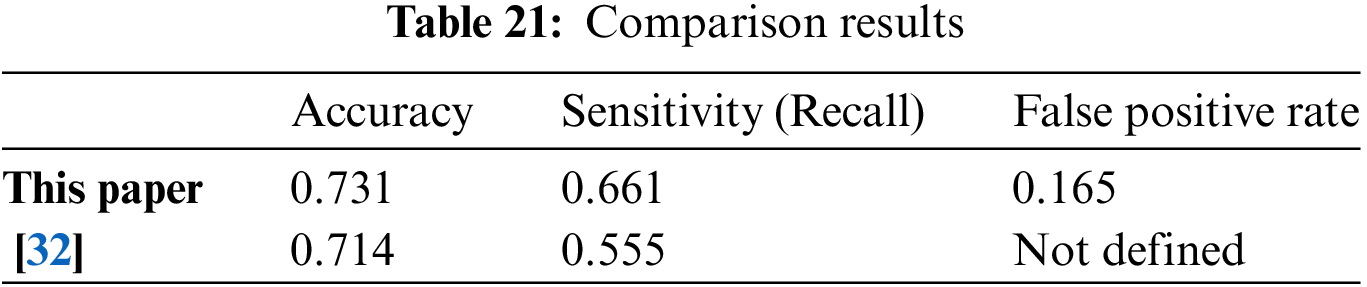
Furthermore, Table 20 succinctly encapsulates the performance metrics assessed across each experimental undertaking. Moreover, a comparative analysis is conducted to juxtapose the overall performance metrics with those elucidated in [31] as illustrated in Table 21. Based on the comparison result, it seems that the proposed algorithm outperforms the one presented in [31] in terms of accuracy and sensitivity (recall). The accuracy of the proposed solution is 0.731 as compared to 0.714 from [31], indicating that the proposed algorithm has a slight edge in correctly predicting the outcome. Moreover, the sensitivity (recall) is 0.661 as compared to 0.555 from [31], which suggests that the proposed solution has a better capability to identify true positives.
This section integrates the results from our six experiments with insights from existing literature, offering a comprehensive analysis of the factors influencing these outcomes and the system’s overall accuracy.
5.1 General Observations across Experiments
Consistent with findings by Mishalani et al. [32], our system demonstrated a tendency to overestimate passenger numbers in scenarios with high pedestrian traffic or vehicular congestion. This pattern, also observed by Paradeda et al. [33], underscores the influence of external environmental factors on system performance.
5.2 Correlation of Findings and Contributing Factors
Our experiments align [34], highlighting the variability of system accuracy with the bus’s movement and the presence of nearby vehicles. For instance, longer stops at traffic lights led to an increased capture of MAC addresses from nearby pedestrians, affecting the accuracy. This necessitates improved filtering mechanisms, a challenge also identified in the Wi-Fi-based Automatic Bus passenger CoUnting System (iABACUS) by Nitti et al. [35].
5.3 Behavioral Influences on System Performance
Another key factor affecting the results was the behavior of bus passengers regarding smartphone usage. Our assumption that 50% of passengers had their Wi-Fi enabled was not always accurate, leading to discrepancies in the system’s estimations. This was particularly evident in Experiment 6, where a higher proportion of older passengers, who are less likely to use smartphones, resulted in an underestimation of passenger numbers. The impact of passenger behavior on system performance, particularly smartphone usage, resonates with the observations by Wang et al. [36]. Our findings further emphasize the need for demographic considerations in system design, as also suggested by Bánhalmi et al. [37].
Each experiment provided unique insights, similar to the approach of Junior et al. [38], who also emphasized the importance of diverse experimental conditions. Our findings contribute to the growing body of research on Wi-Fi-based passenger estimation systems. While Experiments 1 and 2 highlighted the challenges in accurately estimating passenger numbers in varying traffic conditions, experiments 3 and 4 demonstrated the system’s higher accuracy during peak times. Experiment 5 underscored the impact of external factors like pedestrian traffic, and Experiment 6 revealed the influence of passenger demographics on the system’s accuracy.
5.5 Implications and Future Directions
Our cumulative findings, along with insights from Roncoli et al. [39] and Kuchár et al. [40], highlight the complexity and potential of Wi-Fi signals for passenger estimation in urban transit scenarios. These studies collectively suggest avenues for future research, particularly in refining system algorithms and integrating additional data sources.
5.6 Recommendations for System Improvement
To enhance the accuracy of the system, we propose integrating GPS technology, similar to the approach by Junior et al. [38], and recalibrating the signal capture percentage, as suggested by Wang et al. [36]. Implementing multiple monitors, as in the iABACUS system [35], could further refine our system’s ability to discern device locations, reducing errors from external signal sources. In conclusion, while our system shows potential in estimating bus occupancy, the experiments highlight several challenges and areas for improvement. Our approach, complemented by insights from these references, provides a foundation for future research in enhancing the accuracy and reliability of Wi-Fi-based passenger estimation systems in urban transit environments.
In conclusion, this project aimed to investigate the feasibility of counting passengers on a bus by detecting signals from their phones. The system designed for this purpose consisted of three components: Signal capture, data filtering, and passenger estimation. Six experiments were conducted to test the system, which showed that it was possible to estimate the number of passengers on the bus, but with a tendency to overestimate by more than double. The accuracy of the system was affected by factors such as bus movement and traffic conditions. To improve the accuracy of the system, additional receivers and GPS could be added, and signal capture could be controlled by the movement of the bus. Future research could further be dedicated to refining and enhancing the proposed system to confront the challenges associated with heavily crowded conditions during peak travel times, thereby extending the scope of its applicability and ensuring its reliability across a broader spectrum of operational scenarios. Moreover, the application of employed technology could be explored in other scenarios, such as counting people in stadiums or analyzing customer behavior in malls and supermarkets. The technology could also be used by advertisement companies to customize ads based on smartphone signals.
Acknowledgement: Mohammed Alatiyyah extends his heartfelt gratitude to his research team and funding source for their unwavering support throughout this project.
Funding Statement: This study is supported via funding from Prince Sattam bin Abdulaziz University Project Number (PSAU/2023/R/1445).
Author Contributions: Mohammed Alatiyyah conducted all aspects of the research and writing for this paper.
Availability of Data and Materials: Not applicable.
Conflicts of Interest: The author declares that he has no conflicts of interest to report regarding the present study.
References
1. S. Ryu, B. B. Park, and S. El-Tawab, “WiFi sensing system for monitoring public transportation ridership: A case study,” KSCE J. Civ. Eng., vol. 24, pp. 3092–3104, 2020. [Google Scholar]
2. PewResearchCenter, “Older adults and technology use,” Accessed: Oct. 10, 2023, 2014. [Online]. Available: http://www.pewinternet.org/2014/04/03/older-adults-and-technology-use/ [Google Scholar]
3. G. A. Farulla, L. O. Russo, S. Rosa, and M. Indaco, “ORIENTOMA: A novel platform for autonomous and safe navigation for blind and visually impaired,” presented at the 10th Int. Conf. Design Technol. Integr. Syst. Nanoscale Era (DTISNaples, Italy, IEEE, Apr. 20–24, 2015, pp. 1–6. [Google Scholar]
4. H. Nicolau, K. Montague, T. Guerreiro, A. Rodrigues, and V. L. Hanson, “Holibraille: Multipoint vibrotactile feedback on mobile devices,” presented at the 12th Int. Web All Conf., Florence, Italy, May 18–20, 2015, pp. 1–4. [Google Scholar]
5. D. H. Park, M. Liu, C. Zhai, and H. Wang, “Leveraging user reviews to improve accuracy for mobile app retrieval,” presented at the 38th Int. ACM SIGIR Conf. Res. Dev. Inf. Retrieval, Santiago, Chile, August 9–13, 2015, pp. 533–542. [Google Scholar]
6. L. P. Bergé, E. Dubois, and M. Raynal, “Design and evaluation of an ‘around the smartphone’ technique for 3D manipulations on distant display,” presented at the 3rd ACM Symp. Spatial User Interact., Los Angeles, California, USA, Aug. 8–9, 2015, pp. 69–78. [Google Scholar]
7. S. Hu, L. Su, H. Liu, H. Wang, and T. F. Abdelzaher, “Smartroad: Smartphone-based crowd sensing for traffic regulator detection and identification,” ACM Trans. Sens. Netw. (TOSN), vol. 11, pp. 1–27, 2015. [Google Scholar]
8. A. Bánhalmi, V. Bilicki, I. Megyeri, Z. Majó-Petri, and J. Csirik, “Extracting information from Wi-Fi traffic on public transport,” Int. J. Transport Dev. Integr., vol. 5, pp. 15–27, 2021. [Google Scholar]
9. A. Hidayat, S. Terabe, and H. Yaginuma, “Estimating bus passenger volume based on a Wi-Fi scanner survey,” Transp. Res. Interdiscip. Perspect., vol. 6, pp. 100142, 2020. doi: 10.1016/j.trip.2020.100142. [Google Scholar] [CrossRef]
10. Y. Wang and X. Zhang, “Estimating transit ridership using Wi-Fi signals: An enhanced rule-based approach,” presented at the Int. Conf. Syst., Man, Cybern. (SMCToronto, Ontario, Canada, IEEE, Oct. 11–14, 2020, pp. 2425–2431. [Google Scholar]
11. M. Nitti, F. Pinna, L. Pintor, V. Pilloni, and B. Barabino, “Behavior through WiFi signals,” presented at the 2nd Workshop Phys. Analytics, Florence, Italy, May 22, 2015, pp. 13–18. [Google Scholar]
12. Y. Zeng, P. H. Pathak, and P. Mohapatra, “Analyzing shopper’s behavior through WiFi signals,” presented at the 2nd Workshop Phys. Anal., 2015, pp. 13–18. [Google Scholar]
13. Y. Maekawa, A. Uchiyama, H. Yamaguchi, and T. Higashino, “Car-level congestion and position estimation for railway trips using mobile phones,” presented at the ACM Int. Joint Conf. Pervasive Ubiquitous Comput., Seattle, Washington, Sep. 13–17, 2014, pp. 939–950. [Google Scholar]
14. M. Scholz, L. Kohout, M. Horne, M. Budde, M. Beigl and M. A. Youssef, “Device-free radio-based low overhead identification of subject classes,” presented at the 2nd Workshop on Phys. Anal., Florence, Italy, May 22, 2015, pp. 1–6. [Google Scholar]
15. B. Wei, W. Hu, M. Yang, and C. T. Chou, “Radio-based device-free activity recognition with radio frequency interference,” presented at the 14th Int. Conf. Inform. Process. Sens. Netw., Seattle, Washington, Apr. 13–16, 2015, pp. 154–165. [Google Scholar]
16. M. de Sanctis, E. Cianca, S. di Domenico, D. Provenziani, G. Bianchi and M. Ruggieri, “Wibecam: Device free human activity recognition through WiFi beacon-enabled camera,” presented at 2nd Workshop on Phys. Anal., Florence, Italy, May 22, 2015, pp. 7–12. [Google Scholar]
17. K. Chen, S. He, B. Chen, J. Kolb, R. H. Katz and D. E. Culler, “BearLoc: A composable distributed framework for indoor local systems,” presented at the Workshop IoT Challenges Mobile Indust. Syst., Florence, Italy, May 18, 2015, pp. 7–12. [Google Scholar]
18. D. Lymberopoulos, J. Liu, X. Yang, R. R. Choudhury, V. Handziski and S. Sen, “A realistic evaluation and comparison of indoor locat. technologies: Experiences and lessons learned,” presented at the 14th Int. Conf. Inform. Process. Sens. Netw., Seattle, Washington, Apr. 13–16, 2015, pp. 178–189. [Google Scholar]
19. S. Sen, D. Kim, S. Laroche, K. H. Kim, and J. Lee, “Bringing CUPID indoor positioning system to practice,” presented at the 24th Int. Conf. World Wide Web, Florence, Italy, May 18–22, 2015, pp. 938–948. [Google Scholar]
20. R. Meng, S. Shen, R. R. Choudhury, and S. Nelakuditi, “Matching physical sites with web sites for semantic localization,” presented at the 2nd Workshop on Phys. Anal., Florence, Italy, May 22, 2015, pp. 31–36. [Google Scholar]
21. F. Viani, L. Lizzi, P. Rocca, M. Benedetti, M. Donelli and A. Massa, Object Tracking through RSSI Measurements in Wireless Sensor Networks. Italy: University of Trento, May, 2008. [Google Scholar]
22. A. Kocakusak and S. Helhel, “WLAN based indoor positioning in building halls by using trilateral method,” Int. Rev. Prog. Appl. Comput. Electromagn., vol. 31, pp. 246–247, 2015. [Google Scholar]
23. N. Lathia and L. Capra, “Tube star: Crowd-sourced experiences on public transport,” presented at the 11th Int. Conf. Mobile Ubiquitous Syst. Comput. Network. Serv., London, Grear Britain, Dec. 2–5, 2014, pp. 161–170. [Google Scholar]
24. P. Zhou, S. Jiang, and M. Li, “Urban traffic monitoring with the help of bus riders,” presented at the 2015 IEEE 35th Int. Conf. Distrib. Comput. Syst., Columbus, OH, USA, Jun. 29–Jul. 2, 2015, pp. 21–30. [Google Scholar]
25. J. Freudiger, “How talkative is your mobile device? An experimental study of Wi-Fi probe requests,” presented at the 8th ACM Conf. Security & Privacy Wireless Mob. Netw., New York, Jun. 22–26, 2015, pp. 1–6. [Google Scholar]
26. F. Schaub, B. Könings, P. Lang, B. Wiedersheim, C. Winkler and M. Weber, “PriCal: Context-adaptive privacy in ambient calendar displays,” presented at the 2014 ACM Int. Joint Conf. Pervasive Ubiquitous Comput., Seattle, Washington, Sep. 13–17, 2014, pp. 499–510. [Google Scholar]
27. M. V. Barbera, A. Epasto, A. Mei, V. C. Perta, and J. Stefa, “Signals from the crowd: Uncovering social relationships through smartphone probes,” presented at the 2013 Conf. Internet Meas. Conf., Barcelona, Spain, Oct. 23–25, 2013, pp. 265–276. [Google Scholar]
28. Y. Fukuzaki, M. Mochizuki, K. Murao, and N. Nishio, “A pedestrian flow analysis system using Wi-Fi packet sensors to a real environment,” presented at the ACM Int. Joint Conf. Pervasive Ubiquitous Comput. Adjunct. Publ., Seattle, Washington, Sep. 13–17, 2014, pp. 721–730. [Google Scholar]
29. J. Guo and I. W. H. Ho, “CSI-based efficient self-quarantine monitoring system using branchy convolution neural network,” presented at the IEEE 8th World Forum Internet Things (WF-IoT2022, pp. 1–6. [Google Scholar]
30. E. R. Magsino, J. K. Sim, R. R. Tagabuhin, and J. J. S. Tirados, “Indoor localization of a multi-story residential household using multiple WiFi signals,” presented at the Int. Conf. Innov. Intell. Inform. Comput. Technol. (3ICTSep. 29–39, 2021, pp. 365–370. [Google Scholar]
31. Y. Ji, J. Zhao, Z. Zhang, and Y. Du, “Estimating bus loads and OD flows using location-stamped farebox and Wi-Fi signal data,” J. Adv. Transp., 2017. doi: 10.1155/2017/6374858. [Google Scholar] [CrossRef]
32. R. G. Mishalani, M. R. McCord, and T. Reinhold, “Use of mobile device wireless signals to determine transit route-level passenger origin-destination flows: Methodology and empirical evaluation,” Transp. Res. Rec., vol. 2544, no. 1, pp. 123–130, 2016. doi: 10.3141/2544-14. [Google Scholar] [CrossRef]
33. D. B. Paradeda, W. K. Junior, and R. C. Carlson, “Bus passenger counts using Wi-Fi signals: Some cautionary findings,” Transp., vol. 27, no. 3, pp. 115–130, 2019. doi: 10.14295/transportes.v27i3.2039. [Google Scholar] [CrossRef]
34. K. Lu, J. Liu, X. Zhou, and B. Han, “A review of big data applications in urban transit systems,” IEEE Trans. Intell. Transp. Syst., vol. 22, no. 5, pp. 2535–2552, 2020. doi: 10.1109/TITS.2020.2973365. [Google Scholar] [CrossRef]
35. M. Nitti, F. Pinna, L. Pintor, V. Pilloni, and B. Barabino, “iABACUS: A Wi-Fi-based automatic bus passenger counting system,” Energies, vol. 13, no. 6, pp. 1446, 2020. doi: 10.3390/en13061446. [Google Scholar] [CrossRef]
36. Y. Wang and X. Zhang, “Estimating transit ridership using Wi-Fi signals: An enhanced rule-based approach,” presented at the 2020 IEEE Int. Conf. on Syst., Man, and Cybern. (SMCToronto, Ontario, Canada, Oct. 11–14, 2020, pp. 2425–2431. [Google Scholar]
37. A. Bánhalmi, V. Bilicki, I. Megyeri, Z. Majó-Petri, and J. Csirik, “Extracting information from Wi-Fi traffic on public transport,” Int. J. Transp. Dev. Integr., vol. 5, no. 1, pp. 15–27, 2021. [Google Scholar]
38. M. P. R. Junior, R. M. A. Medrano, and C. F. Almeida, “UAI-FI: Using artificial intelligence for automatic passenger counting through Wi-Fi and GPS data,” Transp., vol. 30, no. 2, pp. 2555, 2022. doi: 10.14295/transportes.v30i2.2555. [Google Scholar] [CrossRef]
39. C. Roncoli, E. Chandakas, and I. Kaparias, “Estimating on-board passenger comfort in public transport vehicles using incomplete automatic passenger counting data,” Transp. Res. Part C Emerg. Technol., vol. 146, pp. 103963, 2023. doi: 10.1016/j.trc.2022.103963 [Google Scholar] [PubMed] [CrossRef]
40. P. Kuchár, R. Pirník, A. Janota, B. Malobicktfytf, J. Kubík and D. Šišmišová, “Passenger occupancy estimation in vehicles: A review of current methods and research challenges,” Sustain., vol. 15, no. 2, pp. 1332, 2023. [Google Scholar]
Cite This Article
 Copyright © 2024 The Author(s). Published by Tech Science Press.
This work is licensed under a Creative Commons Attribution 4.0 International License , which permits unrestricted use, distribution, and reproduction in any medium, provided the original work is properly cited.
 Downloads
 Citation Tools