
 Submit a Paper
 Propose a Special lssue
 Open Access
ARTICLE

Combined CNN-LSTM Deep Learning Algorithms for Recognizing Human Physical Activities in Large and Distributed Manners: A Recommendation System
1 Control and Energy Management Laboratory, National Engineering School, Preparatory Institute for Engineering Studies, University of Sfax, Sfax, 3029, Tunisia
2 Higher Institute of Computer Science and Communication Technologies, University of Sousse, Sousse, BN1 9RH, Tunisia
3 College of Computer and Information Sciences, Jouf University, PO Box 2014, Sakakah, Saudi Arabia
* Corresponding Author: Alaa Alaerjan. Email:
(This article belongs to the Special Issue: The Next-generation Deep Learning Approaches to Emerging Real-world Applications)
Computers, Materials & Continua 2024, 79(1), 351-372. https://doi.org/10.32604/cmc.2024.048061
Received 26 November 2023; Accepted 05 February 2024; Issue published 25 April 2024
 View Full Text
 Download PDF
Abstract
Recognizing human activity (HAR) from data in a smartphone sensor plays an important role in the field of health to prevent chronic diseases. Daily and weekly physical activities are recorded on the smartphone and tell the user whether he is moving well or not. Typically, smartphones and their associated sensing devices operate in distributed and unstable environments. Therefore, collecting their data and extracting useful information is a significant challenge. In this context, the aim of this paper is twofold: The first is to analyze human behavior based on the recognition of physical activities. Using the results of physical activity detection and classification, the second part aims to develop a health recommendation system to notify smartphone users about their healthy physical behavior related to their physical activities. This system is based on the calculation of calories burned by each user during physical activities. In this way, conclusions can be drawn about a person’s physical behavior by estimating the number of calories burned after evaluating data collected daily or even weekly following a series of physical workouts. To identify and classify human behavior our methodology is based on artificial intelligence models specifically deep learning techniques like Long Short-Term Memory (LSTM), stacked LSTM, and bidirectional LSTM. Since human activity data contains both spatial and temporal information, we proposed, in this paper, to use of an architecture allowing the extraction of the two types of information simultaneously. While Convolutional Neural Networks (CNN) has an architecture designed for spatial information, our idea is to combine CNN with LSTM to increase classification accuracy by taking into consideration the extraction of both spatial and temporal data. The results obtained achieved an accuracy of 96%. On the other side, the data learned by these algorithms is prone to error and uncertainty. To overcome this constraint and improve performance (96%), we proposed to use the fusion mechanisms. The last combines deep learning classifiers to model non-accurate and ambiguous data to obtain synthetic information to aid in decision-making. The Voting and Dempster-Shafer (DS) approaches are employed. The results showed that fused classifiers based on DS theory outperformed individual classifiers (96%) with the highest accuracy level of 98%. Also, the findings disclosed that participants engaging in physical activities are healthy, showcasing a disparity in the distribution of physical activities between men and women.Keywords
Human physical activities such as walking, running, cycling, doing sports, etc., are all defined as body movements produced by the activation of skeletal muscles and resulting in a substantial release of energy.
Human activity recognition is a field of study related to the spontaneous detection of daily activities performed by individuals, based on recordings of time series using sensors. The use of sensors for the recognition of these human actions represents a major advancement in the field of computer science and technology. Significant progress has been made in interconnected sensor technology, the Internet of Things (IoT), cloud computing, and edge computing. Sensors are cost-effective devices that can be easily integrated or incorporated into portable and non-portable devices. Wearable devices equipped with sensors, an omnipresent application of the IoT, record valuable data in a broader and distributed manner, capturing information such as movements, variations in pressure, or visual images, depending on their type.
Studies focus on activity recognition using video sequences collected by standard cameras and surveillance cameras [1,2]. Recognizing activity with regular cameras can be challenging due to low light conditions or darkness. In recent years, the widespread adoption of wearable devices, particularly smartphones, featuring sensors like accelerometers and gyroscopes, has facilitated the identification and localization of human movements, paving the way for the development of numerous applications in the field of human activity recognition. Accelerometers and gyroscopes are indispensable tools for human activity recognition, providing a rich and detailed source of information on body movements. Their use significantly contributes to a variety of applications, ranging from personal health tracking to the design of interactive interfaces and physical rehabilitation [3–7].
Specifically in the field of health, human activity recognition proves to be particularly promising, encompassing the detection, classification, and interpretation of physical activities. Through this approach, computer systems gain the ability to precisely understand human behavior, monitor and assess the mobility of patients, track prescribed physical exercises, and facilitate physical rehabilitation.
Recognizing these physical activities is highly beneficial for heart, body, and mind health, contributing to the prevention of diseases such as cardiovascular diseases, cancer, and diabetes. The distributed monitoring of health by studying an individual’s activities is considered effective and beneficial for improving the physical and mental well-being of individuals, enabling them to safeguard against any potential danger that could lead to serious illnesses. In this context, private companies develop medical devices based on a system of human physical activity recognition to predict health indicators such as heart rate, pulse analysis, blood pressure, calorie consumption, and so on, these devices often require patients to complete a series of well-defined exercises as part of their treatment [8–12]. Typically, those medical devices are designed to operate in different distributed environments. As a result, recognizing their daily activities becomes quite valuable in providing information on the patient’s physical and even mental behavior to the healthcare team. Physical activity recognition systems can provide information on physical health as well as mental health if coupled with facial recognition systems used to track facial expressions and assess an individual’s emotional state [13]. By combining the two systems, it becomes possible to create more sophisticated systems for understanding how people interact in various situations.
Machine and deep learning algorithms are commonly utilized in the recognition of human physical activity based on smartphone sensors. Several researchers have attempted to classify human physical activity using typical machine learning techniques, which produce less accurate results [4,5,14,15]. Furthermore, several writers have separately applied deep learning algorithms to CNN [16–20] and Recurrent Neural Network (RNN) architectures. The results obtained in this respect suffer from limitations, since CNN architectures, in reality, are made for retrieving geographical information, whereas RNN or its derivatives such as LSTM architectures are made for retrieving data [21–24]. In addition, some works have achieved precision that can be improved by imposing problems to classify certain types of activities where the activities studied in the data are limited.
To overcome these limitations, some researchers have suggested human activity data contains both spatial and temporal information [25–28]. In this case, an architecture capable of extracting both data at the same time is required [8,19,22]. Inspired by the idea of spatial and temporal data, we proposed, in this paper, to combine CNN with LSTM to identify and classify the physical activities based on the smartphone sensor data and to obtain better accuracy.
In this setting, our contribution focuses on two dimensions:
• The first involves employing deep learning techniques such as CNN, LSTM which is a variation of RNN, and bidirectional LSTM to classify human behaviors. The CNN-LSTM and the convolutional LSTM are used to increase classification accuracy by taking into account the extraction of both spatial and temporal data. The first is a hybrid of CNN and LSTM, whereas the second is a CNN-LSTM variation in which the internal matrix multiplications are substituted with convolution operations, thereby making state-to-state and input-to-state transitions between the cell and its neighbors easier. A comparison between these different architectures was conducted to show the effectiveness of the combined architecture providing the best accuracy especially when the approach is used in distributed domains. Best accuracy leads to making the best decisions related to health. But the accuracy is connected to the smartphone data, which is always susceptible to a certain ambiguity. The uncertainty stems from reading faulty data and/or acquiring a less-than-perfect sensor. Generally, most existing publications in the literature suffer from this constraint because they base their research on all available facts without taking into account the uncertain element which is considered a limitation. To improve accuracy and reduce the negative influence of imperfection and uncertainty in the data of the smartphone sensors, the DS theory of belief functions and the voting method are utilized in this research effort [29–31]. These two strategies help to increase the fundamental data quality and dependability. Their principle is to combine data from several sources or classifiers.
• Based on the human activities classification results obtained in the first axis, the second axis is to create a healthy suggestion system to tell smartphone users about their health behavior concerning their human physical activities. This data is gathered by measuring the number of calories each user burns during a physical activity calculated with mathematical equations. Thus, conclusions could be drawn about a person’s physical behavior by computing the number of calories burned after evaluating data collected daily or even weekly following a series of physical workouts. Given the circumstances, it is crucial to acknowledge that calorie consumption varies from men to women, and it is influenced by a variety of factors that have an impact on people’s health behavior, such as alcohol and smoking.
The structure of this paper will include the following sections: Section 2 will cover related research, while Section 3 will offer (i) the customized database, (ii) the above-mentioned deep learning algorithms applied to smartphone sensor data, (iii) the computation of calories based on daily activities, and (iv) data fusion approaches to define our methodology for the classification of physical activities. The experimental results and discussions are presented in Section 4. The final section demonstrates the conclusion with some suggestions for further research.
In the field of physical activity recognition several studies have been conducted based on deep learning algorithms mainly on CNN and RNN architectures [22–27]. RNN architectures are specifically built for data retrieval, whereas CNN structures are designed for spatial information retrieval. CNN and LSTM models, which are derivative of RNN models, are used to identify and classify a time series from numerous sources using labeled training data. These algorithms can be used to solve a variety of problems, including recognizing human activities.
In [23], a CNN model is used to categorize two types of activities (dynamic and static), with two 3-class classifiers doing the recognition. The accuracy gained was 97.62%.
The authors suggested two deep learning approaches, a Deep Neural Network (DNN) and a feed-forward deep neural network, to categorize physical activities [18]. Two physical movement datasets acquired from numerous participants wearing tri-axials are used to test these two models. The first dataset was obtained from 16 volunteers who each wore a sole tri-axial accelerometer on their wrist and recorded 14 distinct daily activities. The second database, which contains 10 different everyday activities, was gathered from eight participants who wore the sensors on their hips. According to the findings, the RNN model achieved an accuracy of 82.56%.
In [3], the Bidirectional LSTM is used as a deep learning model with a bidirectional layer followed by a dropout layer to read and extract its features using 10 epochs and 400 samples. The data used comes from Wireless Sensor Data Mining (WISDM). A smartphone tri-axial accelerometer was used for 36 users to characterize their actions, which included walking, jogging, moving downstairs and upstairs, sitting, and standing. The results demonstrated that the precision is good for predicting some activities but problems have appeared for clearly identifying the others activities.
In [4], the authors proposed a descriptor-based approach for classifying activities using integrated smartphone sensors such as accelerometers and gyroscopes. Two descriptors, namely the gradient histogram and the Fourier descriptor based on the centroid signature, are used to extract feature sets from these signals. For the classification, the performance of multiclass support vector machine and k-nearest neighbor classifiers are studied based on two publicly available data sets, namely, the UCI HAR data set and physical activity sensor data. The experimental results show that the average activity classification accuracy achieved 97.12%.
In [5], the authors used data from the accelerometer to recognize the kind of user movements using the machine (decision tree algorithm) and deep learning (bidirectional LSTM) algorithms. The data is provided from the Wireless Sensor Data Mining (WISDM) by collecting the sensor data from smartphones obtained from 36 users with six attributes: User, activity, timestamp, x-acceleration y-acceleration, z-acceleration, and the activities included walking, jogging, downstairs, upstairs, sitting and standing. Two attributes age and gender are added to the data for every physical activity with random distribution. Based on the classification results, they have proposed a recommendation system computing the total time of physical activities consuming calories to decide about the healthy behavior of a person based on his gender and age, based on their daily physical activities. The paper presents some limitations since the authors did not investigate a diverse range of activities in terms of type and quantity, nor did they employ more robust algorithms. This has led to a relatively low precision, yielding unreliable results for the recommendation system.
In [20], the authors proposed LSTM-based deep Recurrent Neural Networks to create models for human activity recognition. They designed architectures using both unidirectional and bidirectional RNNs with deep layers. The outcomes of their research, conducted on the UCI-HAD dataset, demonstrated that the unidirectional DRNN model achieved a certain level of classification accuracy of 96.7%.
In [25], the authors developed an activity recognition system using the data of an accelerometer and a gyroscope. The results showed that using the UCI HAR dataset and a 3-layer LSTM model, helped to reach an accuracy rate of 97.4% for the global classification of 7 activities (walking, jogging, lying down, standing, falling, climbing, descending stairs).
Concerning human activity, some researchers used an architecture that can extract data containing both spatial and temporal information simultaneously. Reference [21] presented a deep network with four convolutional layers succeeded by two LSTM layers combining LSTM and CNN. The authors of [19] constructed a hybrid model combining CNN and LSTM, in which the CNN is used to extract spatial characteristics whereas the LSTM network is used to learn temporal information. The scientists used a dataset of 12 different kinds of human physical activity that was collected from 20 subjects using the Kinect V2 sensor. The accuracy attained 90.89%.
In [22], the authors explored various hybrid multi-layer deep learning architectures aimed at improving human activity recognition performance by incorporating local features and being scale-invariant with activity dependencies. the results obtained showed an activity recognition rate of 94.7% on the University of California at Irvine public dataset for human activity recognition, comprising 6 activities, with a hybrid 2-layer CNN-1-layer LSTM model. In addition, on the University of Texas at Dallas multimodal human activity dataset, comprising 27 activities, with a hybrid 4-layer CNN-1-layer LSTM model, they achieved an activity recognition rate of 88.0%.
The authors introduced a hybrid deep neural network model in [28] to detect spatial-temporal features. This model integrates the characteristics of a 1D CNN, which can extract spatial or local information from the raw sensor data, and a Gated Recurrent Unit (GRU), which can recognize temporal features. Derived from accelerometer-captured sensor data and a gyroscope obtained from the WISDM data set, this model called CNN-GRU allows to categorization of eighteen distinct simple and intricate human activities into three categories: Activities related to walking, general hand-oriented activities, and hand-oriented activities involving feeding. On the smartphone dataset, the CNN-GRU model was 90.44% accurate.
We presented this work in two parts to make a reliable recommendation system. The system is intended to operate and observe physical activities in largely distributed manners. The first part is concerned with applying deep learning algorithms to recognize various physical activities. The second part deals with calculating the calories burned for each user according to his daily physical activity, based on the recognition results. This calculation allows to achieve a recommendation system that informs smartphone users about their physical health behavior. So, the proposed methodology is based on four steps:
• Description of data.
• Classification of physical activities using deep learning algorithms.
• Computation of the calories to determine the physical behavior based on daily activities.
• DS theory to reduce the decision uncertainties.
The used data comes from the Multi-level Monitoring Activity and Sleep on Healthy people (MMASH) by collecting the sensor data from smartphones [32]. Smartphones are equipped with multiple sensors that contribute to the recognition of human activity. By utilizing the information collected by sensors in smartphones, one can detect and interpret the movements and behaviors of a user:
• Accelerometer: This sensor measures linear acceleration. By analyzing changes in acceleration, various types of physical activities such as walking, running, cycling, etc., can be determined. Accelerometer data is used to create activity profiles.
• Gyroscope: It helps determine the orientation of the phone. When combined with other sensors, the gyroscope can refine activity recognition.
• GPS: Used for location tracking by recording the user’s movements. This allows tracking outdoor activities like running or cycling and provides information on distances traveled.
• Motion Pattern Identification: By combining accelerometer and gyroscope data, specific motion patterns can be identified. This enables the distinction between different physical activities and the assessment of how the user performs these activities.
• After identifying motion patterns, it becomes easy to use the collected information for various applications such as health monitoring: These data can assist healthcare professionals in evaluating the intensity of physical activity, crucial for managing various health conditions. In our application, by combining sensor data with information available in the database, the activity recognition algorithm can more accurately estimate the total energy expenditure associated with specific physical activity. This can be a valuable tool for individuals aiming to maintain a healthy lifestyle.
In our dataset, the human physical activities are measured thanks to the tri-axial accelerometer data for 22 participants. The attributes of the data are accelerometer (axis1, axis2, axis3), ‘Start’ and ‘end’ columns, heart rate, age (between 20 and 40 years), weight, gender, and activities.
The activities column contains 10 types and is broken into three categories:
Low-effort activities: Sleeping, laying down, sitting.
Medium effort activities: Light movement (slow walk), eating, small screen usage, caffeinated drink consumption.
High-effort activities: Medium (fast walk), Heavy (running), Large screen.
The 22 participants are classified according to their physical activities. The distribution of activities is different for men and women. Also, several factors such as alcohol and smoking influence these activities and can disrupt the daily lives of people by affecting their health and causing serious diseases. Men and women are different in the consumption of these two elements and their influence on their physical activities. For this reason, two attributes are added to the above data: Alcohol and smoking. A binary notation is assigned to these two attributes. 1 if the user consumes alcohol and smoking, 0 otherwise.
Deep learning relies on a neural network model equipped with algorithms that emulate the cognitive processes of the human brain. Hundreds of layers of neurons make up these networks. Every layer receives and processes information from the preceding layer [33]. Deep learning models are good at handling massive volumes of data. They are placed at the data level without any deformation or prior aggregation. The network l then learns the implicit data by itself using a large number of variables that are adjusted during the learning process.
We used the deep learning algorithms in this paper. First, we used the standard LSTM and the stacked and bidirectional LSTMs which are two derivatives of LSTM. The architectures of these algorithms are specifically designed for data retrieval.
Indeed, CNNs have demonstrated their effectiveness in extracting spatial and discriminative features from sensor data, such as accelerometer and gyroscope readings, treated as images. They are well-suited for fixed and short sequence classification problems but are not recommended for long and complex temporal data.
Problems involving sequential analysis over a while, such as activity recognition from sensor data, typically call for a specialized type of neural network designed specifically for sequential data analysis, with the ability to uncover hidden patterns from sequential information. LSTMs prove valuable in handling temporal sequences, which is relevant for data from moving sensors. These models exhibit the capability to retain information over an extended period. The internal architecture of LSTMs includes multiple gates (including input, forget, and output gates), where each gate processes input from the preceding gate and passes it to the next gate, thus controlling the flow of information toward the final output.
Given that smartphone sensor data, dedicated to physical activity recognition, contains both spatial and temporal information, we proposed a hybrid approach combining both CNN and LSTM (or its derivatives). Therefore, we used the CNN-LSTM and the convolutional LSTM which is a variant of CNN-LSTM but the internal matrix multiplications are substituted with convolution operations, which enable the transitions between the cell and its neighboring states, both for state-to-state and input-to-state interactions. In this combined architecture, spatial features are extracted from CNN layers and then fed into LSTM for learning temporal information.
The following sections go over all of these algorithms:
• LSTM: LSTM networks, which extend the memory capacity compared to traditional RNNs, serve as fundamental components in RNN layers. LSTMs allocate “weights” to data, enabling RNNs to manage the introduction of new information, the forgetting of old data, and the assessment of information’s importance, all of which can influence the output. It has a single hidden layer unit which is referred to as a “memory block,” and each memory block can contain one or multiple memory cells, all of which are shared within the same memory block. Every memory cell’s functionality is autonomously regulated by three gates [21]:
Forget gates: These gates identify pertinent information from the past.
Input gates: They choose the information from the current input that will remain relevant in the long run.
Output gates: These gates extract critical information from the new cell state for
The following set of equations represents the LSTM architecture in Fig. 1:
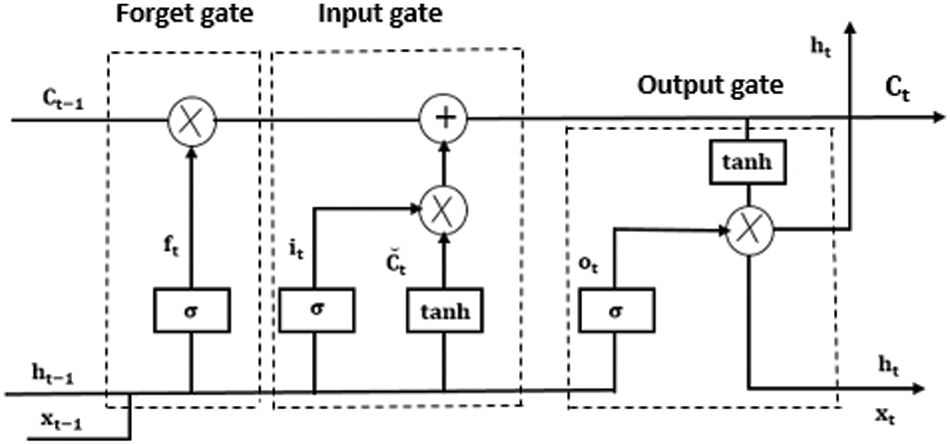
Figure 1: LSTM architecture
with
• Stacked LSTM: It has the same architecture as LSTM except that it has two hidden layers.
• Bidirectional LSTM: Two models are trained in the bidirectional LSTM. The first model learns the input sequence, whereas the second model learns the inverse of that sequence. The results of the two LSTM layers are subsequently merged through various techniques, such as averaging, summing, multiplying, and concatenating.
• CNN-LSTM: First, in the CNN model, there is a convolutional layer responsible for processing subsequences, which necessitates the specification of both the number of filters and the kernel size. The number of filters corresponds to the quantity of input sequence “reads” or interpretations. The kernel size is the number of time steps contained in each input sequence “read” operation. Following the convolution layer, a maximum pooling layer reduces the filter maps to half their original size and highlights the most important characteristics. These structures are then flattened into a one-dimensional vector that the LSTM layer employs as a single input time step. The LSTM component of the model, which comprehends the interpretation provided by the CNN model for the input sequence, can then be defined. In our proposed hybrid model, by combining these two models, we extract spatial features via the CNN, then pass these features on to the LSTM for temporal learning and finally into a fully connected layer for recognition. The first two layers of the CNN have different filter sizes: In the first layer, the filter size is 64, while in the second layer, the filter size is 128. In addition to the filter size, the core size of both layers is 3, and the activation function used in both layers is the ReLU activation function. These two layers are followed by the maximum pooling layer with a pooling size of 2. These features from the CNN layers pass through two LSTM layers with the same cell size of 64 in each layer. The LSTM layer is followed by the flattening layer and the dense layer with a softmax activation function.
• Convolutional LSTM: LSTM variation is closely tied to the CNN-LSTM approach, as it incorporates the convolutional input processing directly within each LSTM unit.
In the tuning experiments, the models have been trained for 50 epochs and evaluated on the testing sets using the Adam version of stochastic gradient descent to optimize the deep neural network with a batch size of 32, a learning rate of 0.002, and a dropout of 0.03.
Fig. 2 represents the convolutional LSTM architecture with
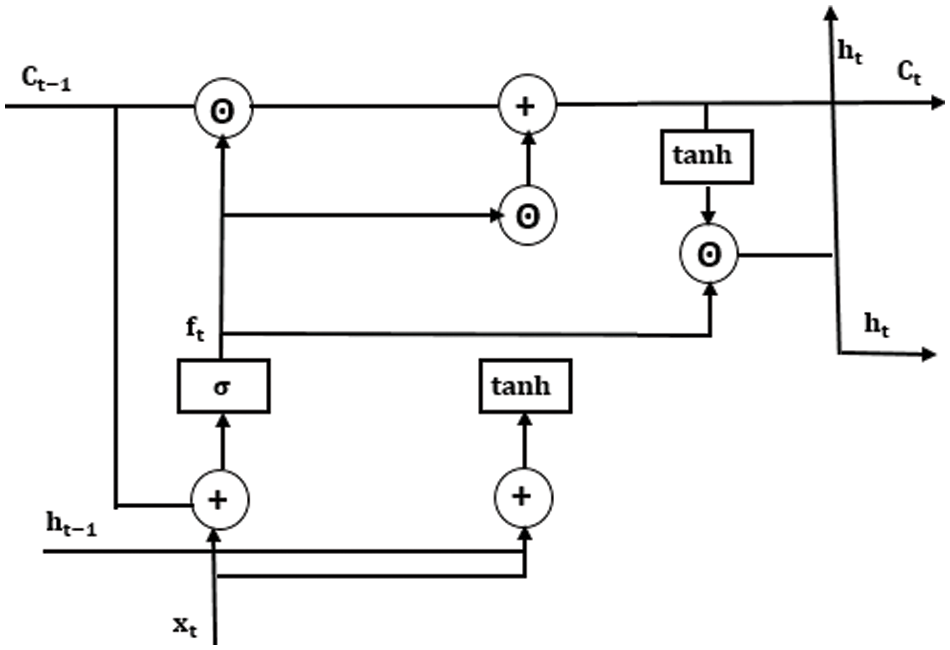
Figure 2: Convolutional LSTM architecture
The developed recommended system is based on the computing of calories and its goal is to warn people about their physical health habits (healthy or not healthy). Indeed, the calculation of the calories, burned by the body according to its daily physical activities, is a useful tool for determining a person’s health status. Heart rate is one of the best ways to measure calorie expenditure. It indicates the effort it takes for a person to perform a certain activity, and this effort determines the calories burned. The heart rate is determined by the analysis of data obtained from a person’s physical activities. Using the obtained heart rate values, we based the two following mathematical equations [34,35] to calculate the number of calories consumed by men and women.
The number of calories consumed by men:
The number of calories consumed by women:
In these equations,
The information delivered from smartphone sensor data may exhibit a degree of uncertainty due to the volume of data and the veracity of the information. The source delivering the information may be unreliable, prone to errors, or intentionally providing incorrect information. Consequently, the information can be incomplete and inaccurate. Our goal is to improve the performance by improving the accuracy of the classifiers. Accuracy is contingent upon the data employed during the learning phase, which is characterized by imprecision, uncertainty, vagueness, and incompleteness. These factors pose challenges when articulating knowledge, primarily due to the limited availability of numerical data and the use of natural language terms to describe certain attributes [36]. Uncertain information is encountered in applications such as disease diagnosis, image processing and segmentation, treatment and reading of texts, sensor signals, object detection, and recognition. This uncertainty is caused by inaccurate data readings and/or sensor acquisition errors.
To address the challenges of imprecision and uncertainty, it is crucial to employ formalisms for modeling these imperfections. Furthermore, to make the most of the available information, it is also necessary for these formalisms to propose fusion mechanisms (combination or aggregation) that allow to merging of several data coming from a variety of origins or via distinct classification systems. This research is built on voting and DS which are two of the most common merging techniques. This combination phase enables us to obtain synthetic information to aid in decision-making.
The voting technique is a formalism that amalgamates forecasts from various models, culminating in an output based on the highest probability. The voting classification algorithm simply aggregates the results from each classifier embedded within the model and forecasts the output class with the greatest number of votes [29].
The Voting method supports two voting approaches:
Hard Voting: The voting classifier estimator predicts the output by selecting the class that receives the highest number of votes from each classifier.
Soft Voting: The output class is predicted based on the average probability assigned to that class. If ‘hard’ is chosen, the predicted class labels are used for the majority vote, while ‘soft’ relies on the arg max of the summed predicted probabilities. The ‘soft’ approach is recommended for a set of well calibrated classifiers.
The steps of the voting method algorithm are:
• Determine the feature importance score for each of the foundational estimators.
• Multiply the weights of the foundational estimators by the importance score of each feature.
• Calculate the average of the importance scores (from the previous step) for each feature.
3.4.2 DS Theory of Belief Functions
The theory of belief functions originated in Arthur Dempster’s work on the generalization of Bayesian formalism [4]. The credal aspect of the theory was established by Glenn Shafer [4]. Known as the Dempster–Shafer theory of evidence and rooted in probabilistic mathematics, it provides a formal framework for reasoning under uncertainty, offering a model for knowledge representation. Through belief functions, which serve as tools for gauging subjective probability, we can assess the degree of truthfulness of a statement. By introducing masses of evidence, coefficients of their weakening, and employing the rule of combination, the theory enables the handling of information from diverse sources and fields, aiming to determine their reliability.
The DS theory allows for the generalization of additive probability measures. They might be thought of as upper and lower boundaries on probabilities that are unknown. The theory’s principle is given in the following steps [4]:
Each source of information provides a belief function that expresses the confidence or degree of belief associated with different hypotheses or propositions. We begin by presenting the information provided by their mass functions. By distinguishing frame Ω, the mass function m represents with m (A) is the following:
The information is then corrected using the uncertainty mass function m also known as belief mass, representing the strength of belief for each set of assumptions, and the degree of belief in the source’s credibility μ yielding the revised function:
In the last, we combine the uncertainty masses from different sources to form a combined mass and to obtain the informed choice. Consider two sources represented, respectively, by the mass functions m1 and m2. This involves the use of combination rules, such as Dempster’s rule, which takes into account the intersection of uncertainty masses. The following new mass function appears from the merging of the two sources:
The final belief function is derived from the combined mass and reflects the synthesis of the various sources of information to assess overall confidence in the various hypotheses. It is given by pignistic transformation which is characterized as the probability distribution that is formulated as follows:
The decision is made based on the pignistic transformation by selecting the element x with the highest probability:
The DS fusion theory offers a notable benefit by enabling decision-making even in cases where a classifier may falter. Additionally, despite employing diverse learning algorithms, classifiers can approach the same problem from multiple perspectives, resulting in more precise decision outcomes. Cette approche a bien montré son efficacité dans plusieurs domaines incluant HAR où elle a permis d’améliorer les précisons obtenus sans fusion [5,37,38].
Our main objective in this paper is to identify and classify physical activities as accurately as possible using the dataset presented above.
The first section of the project was devoted to computing the accuracy by calculating the error rate for each deep learning classifier on its own. The fusion error rate is then computed by combining the mass functions of classifiers.
For the deep learning algorithms, we present C1, C2, C3, C4, and C5, respectively, from LSTM, stacked LSTM, bidirectional LSTM, CNN-LSTM, and convolutional LSTM.
We used the confusion matrix to measure classification skills when it comes to physical activities. It compares the observed and expected values. The confusion matrix is used to define the following measures:
• True Positives (TP) are the number of positive incidents that have been classified as such.
• True Negatives (TN): The number of negative incidents that have been classified as such.
• False Positives (FP) are the number of negative events that are mistakenly labeled as positive.
• False Negatives (FN) are the number of positive incidents that are incorrectly labeled as negative.
The following metrics are defined based on the above values:
The precision is determined by the ratio of correctly classified positive instances to the total number of instances classified as positive.
The Recall is determined as the ratio of correctly categorized positive instances to the total number of positive instances.
F1 is a single measure that combines precision and recall.
As a backend, we used Python (version 3.6.5) with Anaconda distribution on Ubuntu 16.04.6 LTS (XenialXerus), Keras (version 2.1.6), and Tensorflow (version 1.7.0) in this research.
4.1 Results on Independent Classifiers
After calculating the measures of Eqs. (14)–(16), Figs. 3–5 represent the confusion matrices of each DL classifier.

Figure 3: Confusion matrix of the bidirectional LSTM
Figure 4: Confusion matrix of CNN-LSTM
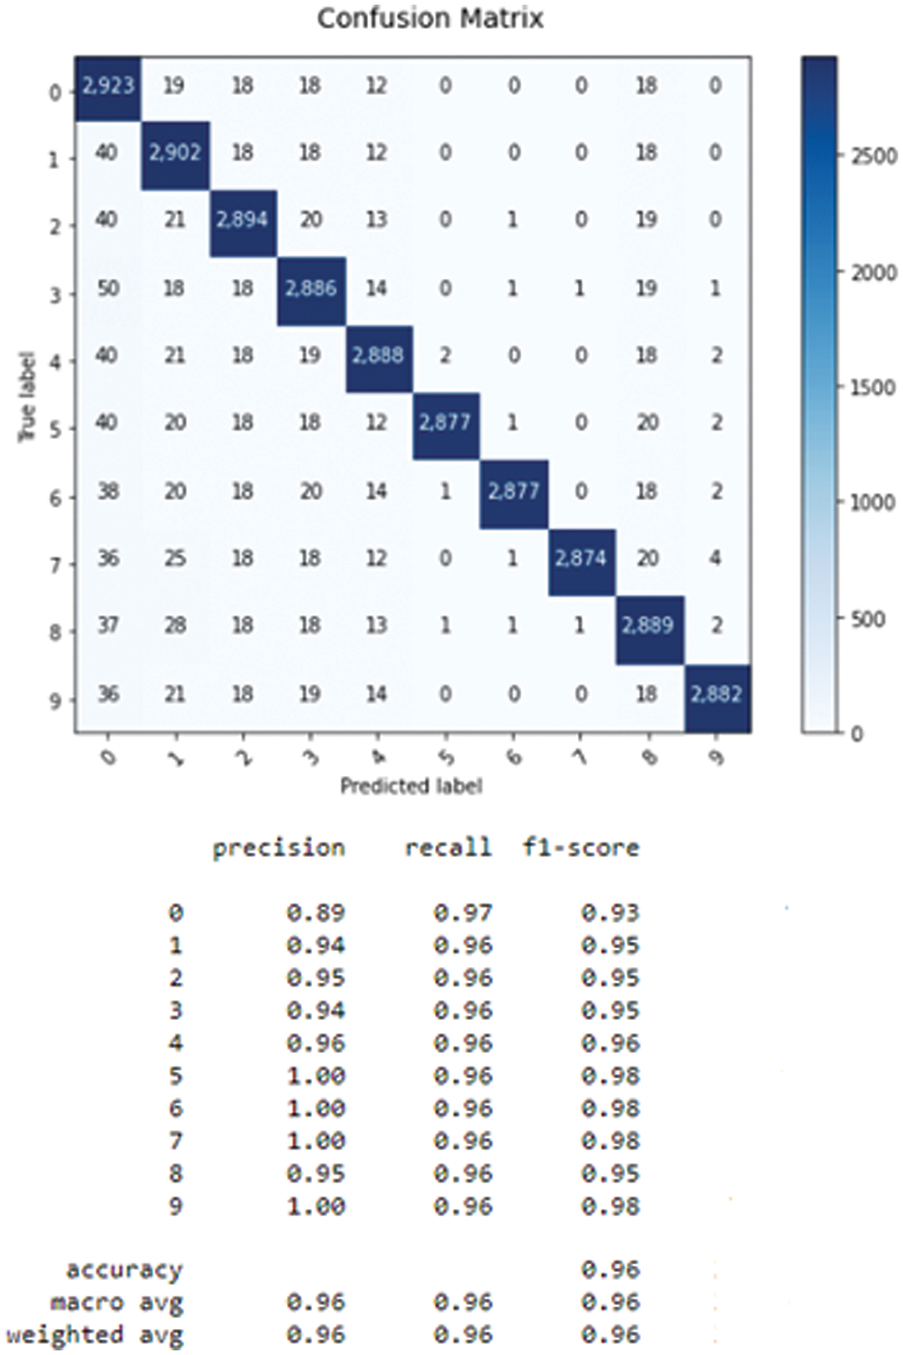
Figure 5: Confusion matrix of the convolutional LSTM
The error rate for each classifier is shown in Table 1.
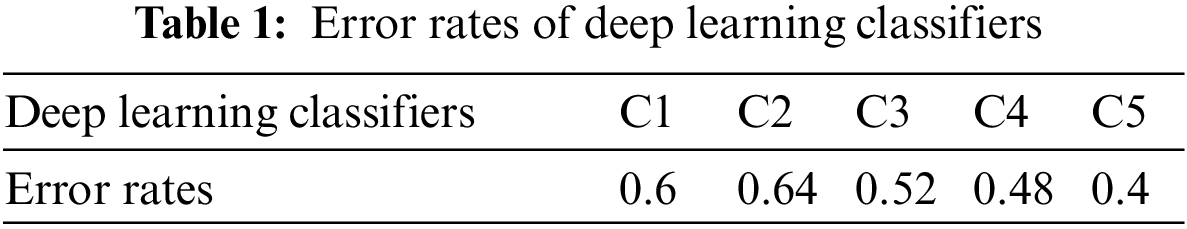
From Table 1, the convolutional LSTM achieves the lowest error rate equal to 0.4 which corresponds to the best accuracy of 96%. Acomparison with state art is given in Table 2.
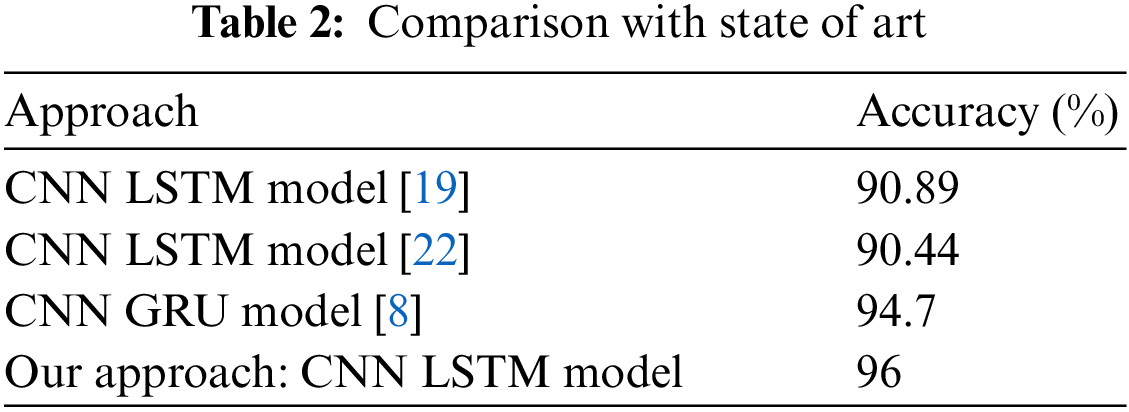
Our approach gave a higher score than those obtained in literature [19] (90.89%), [22] (90.44%), [8] (94.7%). It should be noted that these existing works have also used an approach that combines CNN with LSTM or its derivatives, as in [22] the author used GRU, which is a variant of LSTM but with fewer gates. However, the databases for each reference as well as my own are different, especially in terms of the activities studied. It is also worth mentioning that the values of accuracy are obtained without taking into account the uncertain aspect, which is considered a constraint for this task.
4.2 Results on Fusion Classifiers
To improve the accuracy to 96% and lessen the impact of the uncertain aspect, the voting and belief functions methods are used. In this case, different combinations of the above deep learning classifiers are tested to acquire the fusion error rate for each combination. The results of these combination tests showed that by combining the C3, C4, and C5, the least fusion error rate is recorded. Using the voting technique, the mistake is equal to 0.32, which corresponds to a 96.8% accuracy rate.
For the DS theory, we recall the steps described in Section 3.4.2 concerning where the merged sources are the predictions obtained by each classifier independently.
First, each classifier issues degrees of belief associated with its predictions (Table 1). Each classifier assigns degrees of belief to its predictions. These degrees of belief reflect the classifier’s confidence in its predictions. DS theory provides a formal expression of these degrees of belief in the form of belief masses, where each mass is associated with a specific class or decision Eqs. (9) and (10).
Second, the combination of belief masses allows for representing the overall uncertainty associated with the final decision, taking into account discrepancies among the classifiers. The Dempster-Shafer rule facilitates the combination of belief masses by merging information from multiple classifiers (Eq. (11)). In our case, the optimal combination is achieved by merging the classifiers C3, C4, and C5 offered by the mass function m3 + m4 + m5.
Third, the resulting fusion generates a new belief mass representing the combined belief across all possible classes or decisions (Eq. (12)). Indeed, it considers both the belief masses associated with specific predictions and manages conflicts by quantifying the degree of discordance between the information sources of the classifiers.
Finally, the ultimate decision is derived from the combined belief mass. This can be achieved by selecting the class with the highest belief mass, considering a decision threshold, or employing other criteria tailored to the specific task (Eq. (13)). Thus, classifiers contribute to the final decision based on their degree of belief, allowing for the consideration of situations where certain classifiers are more reliable than others.
Based on the above steps, the mistake obtained by the DS theory is equal to 0.2, which equates to 98% accuracy. The last value indicates the effectiveness of the DS approach, as it outperforms the results obtained using each classifier alone (96%) as well as the voting approach. As can be seen, the belief function method produced more robust fusion results than the voting method. We can explain the contribution of this method as follows: The voting method generally combines the predictions of the different classifiers, assigning equal weight to each vote and then selecting the majority class. However, it does not take into account the uncertainty associated with each prediction, nor the respective reliability of the classifiers. In contrast, the belief function method lies in its ability to model uncertainty in a more refined way. It offers a formal approach for taking into account uncertainty, confusion, and discrepancies between the predictions of different classifiers. It assigns belief masses to sets of classes, taking into account the degree of confidence accorded to each classifier. These belief masses are then combined to calculate an overall belief mass for each class.
Fig. 6 presents the confusion matrix of the combined classifiers.
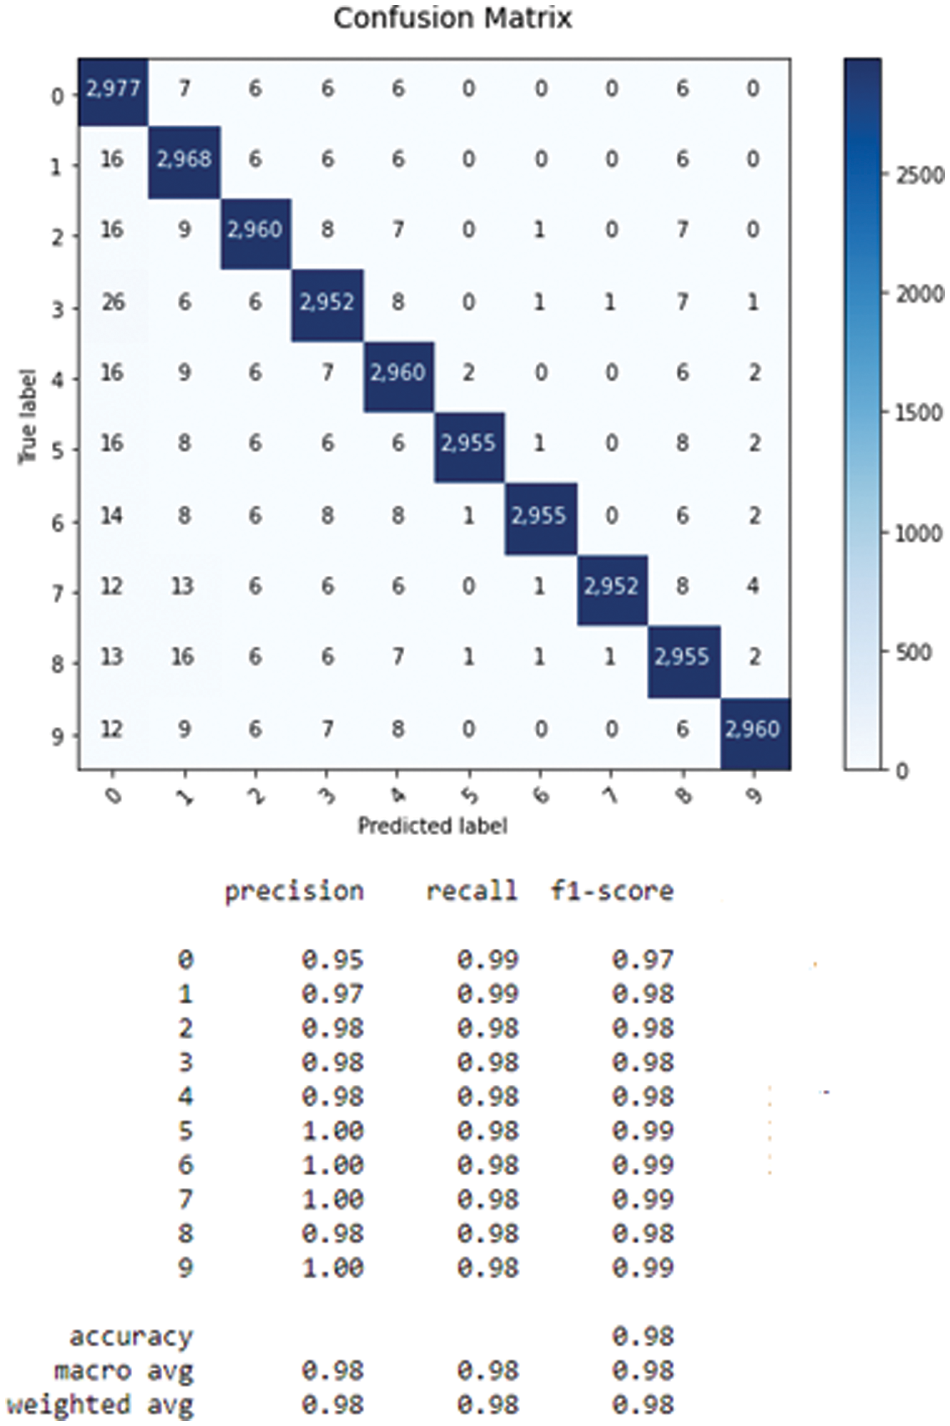
Figure 6: Confusion matrix of fusion classifiers
4.3 Results on the Recommended System
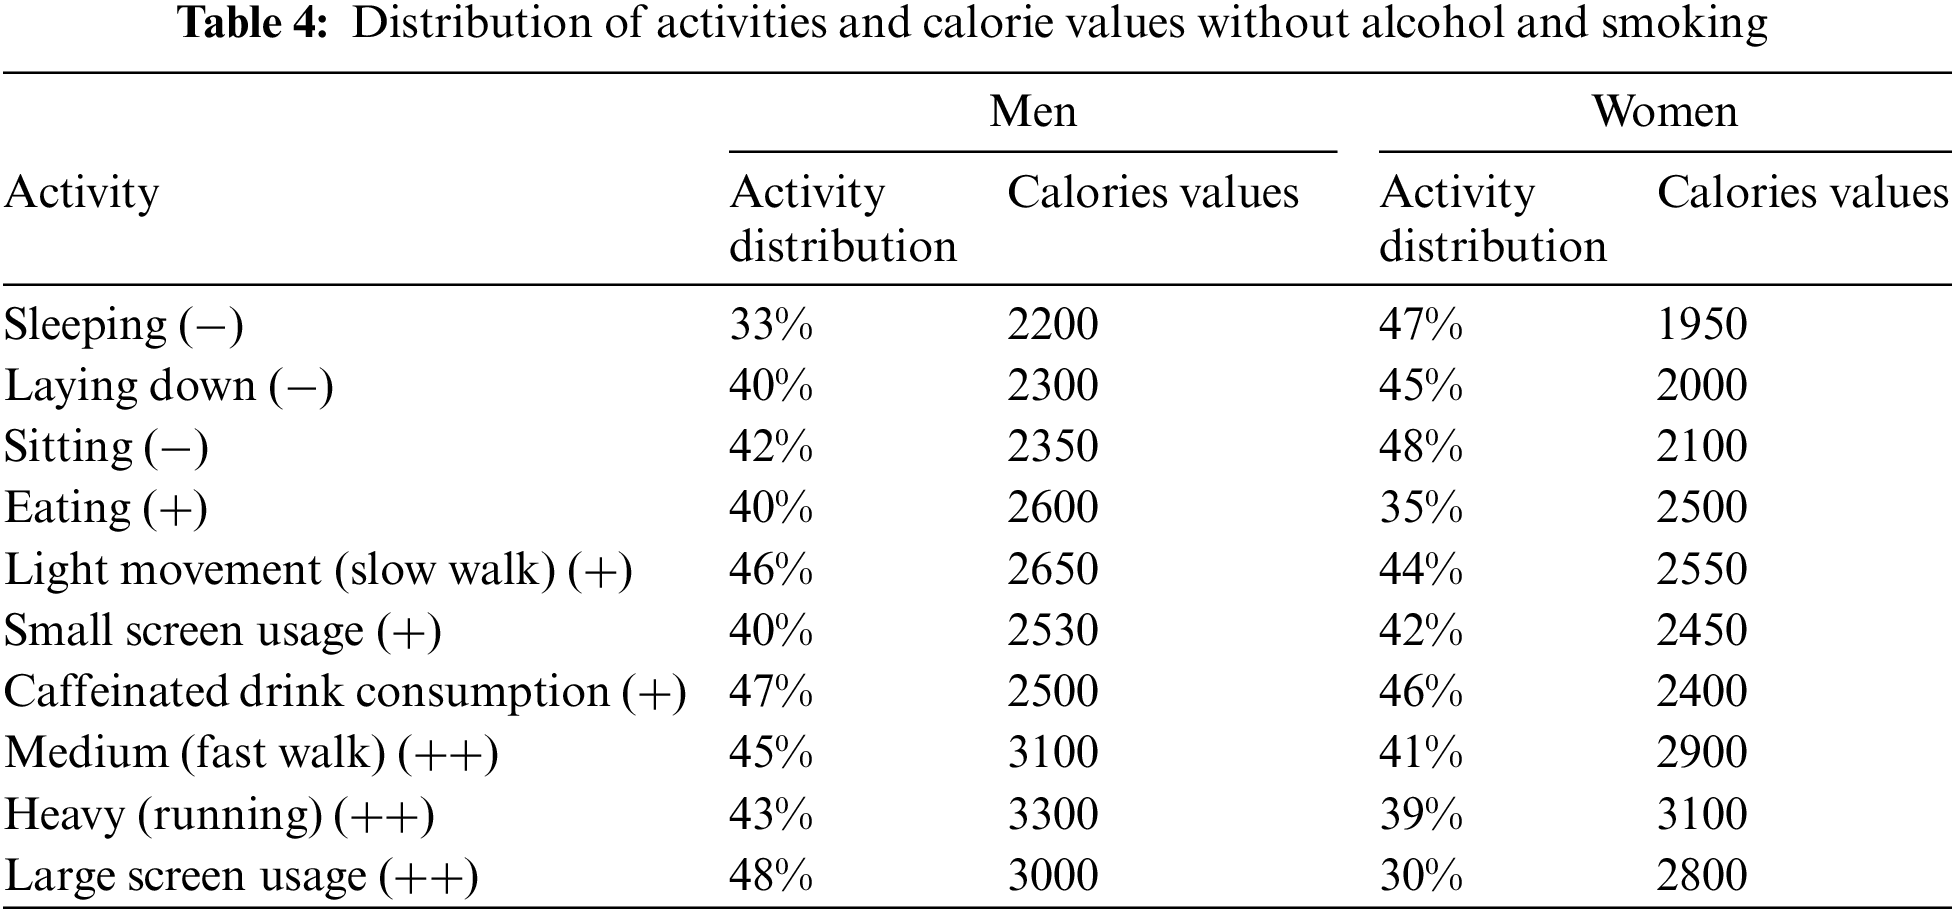
Based on the obtained human activities classification results, the second of this project was dedicated to calculating the number of calories each user burns during physical activity. The distribution of daily physical activities for the 22 participants is divided into 50% males and 50% females.
Using the Eqs. (7) and (8), the calorie values are calculated every 30 min of the day. To draw the necessary conclusions about the health status of each individual and decide on his calorie consumption (healthy behavior or not healthy behavior), the calorie values calculated for each activity must be compared with those declared by the World Health Organization (WHO). The WHO has defined the caloric threshold criteria according to the type of physical activities which are divided into three categories (low-effort activities rated (−), medium-effort activities rated (+), and intense-effort activities rated (++)). Table 3 presents the calorie threshold values for men and women.
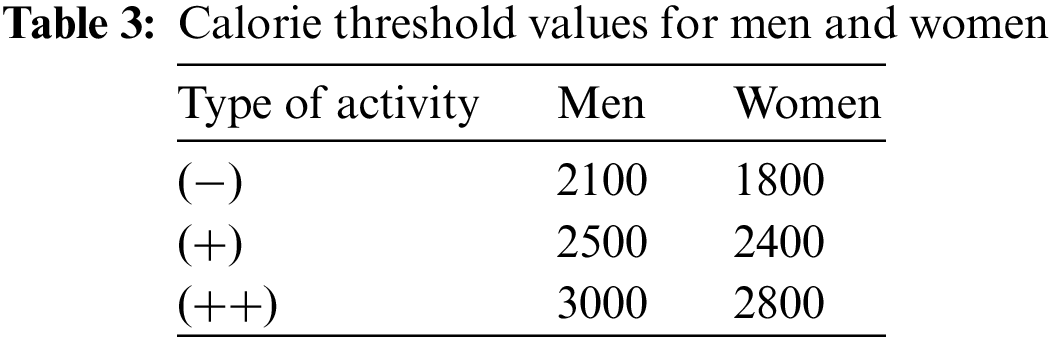
From Table 3, the distribution of physical activities reveals that all participants (male and female) are healthy. The fact that these participants produce more energy than the threshold value shown in Table 3 justifies this outcome.
Also, Table 4 clearly illustrates that the distribution differs from men to women, particularly for low and high-effort activities. 48% of males have a big distribution value for the large screen usage activity that requires a lot of effort. Women, on the other hand, have the same percentage for the low-effort sitting exercise.
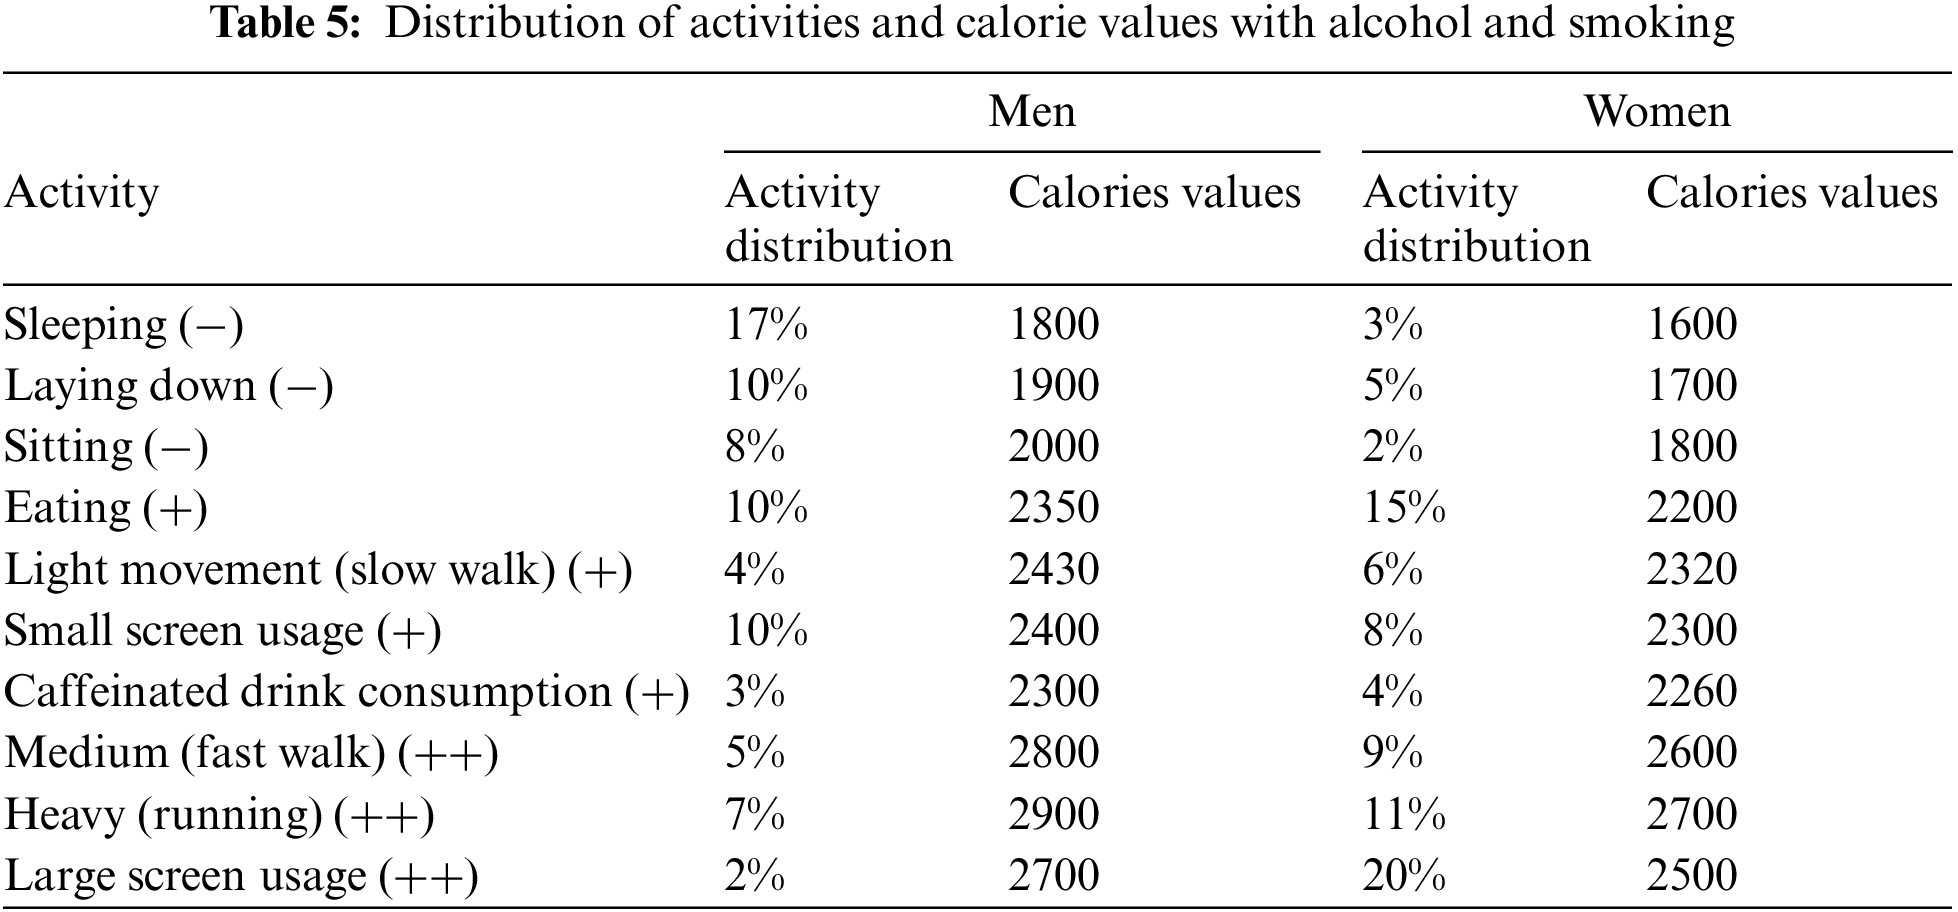
To demonstrate the detrimental impact of alcohol and tobacco consumption on human health, even with regular exercise, we integrated these two factors as attributes in the database and studied their influence on calorie consumption. Table 5 presents the obtained results, it reveals that all individuals are unhealthy since the obtained calorie values are lower than the threshold values, demonstrating the harmful impact of drinking and smoking on human health.
As a summary of the results of this work:
• Recognizing physical activity through smartphone data achieved high precision by employing a hybrid CNN-LSTM architecture and incorporating belief function theory.
• The suggested system, relying on the outcomes of physical activity recognition, demonstrated its efficacy in determining the health status of individuals, with varying distributions observed between men and women. These systems lead to applications that, once installed on the smartphone, will give an alert in the form of a message to the wearer, informing him of his health status based on his movement.
• As shown, smartphone sensors are still useful tools for recognizing physical activity, offering a practical and widely accessible approach to monitoring health and well-being. But their use has certain limitations that can influence the results obtained:
–Sensors integrated into smartphones, such as accelerometers and gyroscopes, can have variable accuracy depending on the model and brand of the smartphone, which can lead to inconsistencies in data acquisition.
– Wearing the smartphone in a pocket, the hands, or any other position may give different results.
– Sensor limitations: Some types of physical activity may not be well detected by available sensors, requiring specific sensors for more accurate recognition.
These limitations cannot negate the contribution of smartphones in the field of physical activity recognition. However, progressive advances in sensor technology and advances in Artificial Intelligence (AI) tools, in terms of the algorithms and methods used, may help to alleviate some of these limitations.
Detecting human activity through smartphone sensor data is crucial in the health domain for preventing chronic diseases. The smartphone records daily and weekly physical activities, providing feedback to users on their movement patterns and determining a person’s health state. It is considered effective since it can be applied in a large distributed manner.
This paper had a dual objective. Firstly, we analyzed human behavior by recognizing physical activities. In this context, we considered and categorized low, medium, and high effort activities for total participants of 22 men and women. Based on these data, the methodology relies on artificial intelligence models, specifically deep learning techniques such as LSTM, stacked LSTM, and bidirectional LSTM. Given that our smartphone sensor data, dedicated to physical activity recognition, contains both spatial and temporal information, we proposed an approach combining both CNN and LSTM (or its derivatives). In this combined architecture, spatial characteristics are derived from the CNN layers and subsequently inputted into the LSTM for learning temporal information. The hybrid architecture CNN-LSTM has demonstrated superior accuracy in discerning intricate human activities when contrasted with the accuracies achieved by individual architecture types. The convolutional LSTM had the best accuracy of 96%, according to data.
Acknowledging that the data learned by these algorithms is susceptible to errors and uncertainty, the paper introduces fusion mechanisms to enhance performance. Despite achieving a 96% accuracy level, the proposed solution incorporates Voting and DS approaches. The fused classifiers based on DS theory surpass individual classifiers, achieving the highest accuracy level of 98%. This strategy has mitigated inaccuracies and ambiguities in the data, providing synthetic information for decision-making.
Secondly, based on the results of activity detection and classification, a health recommendation system was created. The system is based on the calculation of the calories burned during each physical activity. The assessment of daily or weekly data allows conclusions about an individual’s physical behavior and has enabled to decide on the healthy physical behavior of users’ smartphones. The computing of calories was calculated based on two mathematical equations dedicated to men and women. The findings revealed that the participants are healthy, with a difference in the distribution of physical activities between men and women. Also, it was demonstrated that individuals consuming alcohol and smoking are not healthy, even if they participated in physical activities, underscoring the impact of these two factors on human health.
In future works, we propose using a larger database that will include more physical activities of daily living as well as an increased number of complex activities. In addition, to increase the obtained accuracy, we propose to explore advanced techniques based on deep learning such as reinforcement learning, transfer learning, and attention mechanism for activity recognition.
Acknowledgement: The authors extend their acknowledgment to all the researchers and the reviewers who help in improving the quality of the idea, concept, and the paper overall.
Funding Statement: The authors extend their appreciation to the Deputyship for Research & Innovation, Ministry of Education in Saudi Arabia for funding this research work through the Project Number 223202.
Author Contributions: The authors confirm contribution to the paper as follows: Study conception and design: Ameni Ellouze, Nesrine Kadri; data collection: Alaa Alaerjan, Mohamed Ksantini; analysis and interpretation of results: Ameni Ellouze, Nesrine Kadri; draft manuscript preparation: Alaa Alaerjan, Mohamed Ksantini; review and improve the draft. All authors reviewed the results and approved the final version of the manuscript.
Availability of Data and Materials: Not applicable.
Conflicts of Interest: The authors declare that they have no conflicts of interest to report regarding the present study.
References
1. A. Ullah, K. Muhammad, W. Ding, V. Palade, I. Haq and S. W. Baik, “Efficient activity recognition using lightweight CNN and DS-GRU network for surveillance applications,” Appl. Soft Comput., vol. 103, pp. 107102, 2021. [Google Scholar]
2. A. Ullah, K. Muhammad, T. Hussain, and S. W. Baik, “Conflux LSTMs network: A novel approach for multi-view action recognition,” Neurocomputing, vol. 435, no. 7, pp. 321–329, 2021. [Google Scholar]
3. N. Kadri, A. Ellouze, and M. Ksantini, “Recommendation system for human physical activities using smartphones,” in 2020 2nd Int. Conf. Comput. Inf. Sci. (ICCIS), Sakaka, Saudi Arabia, Oct. 2020. [Google Scholar]
4. A. Jain and V. Kanhangad, “Human activity classification in smartphones using accelerometer and gyroscope sensors,” IEEE Sens. J., vol. 18, no. 3, pp. 1169–1177, 2018. [Google Scholar]
5. N. Kadri, A. Ellouze, and M. Ksantini, “Fusion of classifiers based on physical activities data from smartphone user,” in 17th Int. Multi-Conf. Syst. Signals Dev. (SSD), Monastir, Tunisia, Jul. 2020. [Google Scholar]
6. M. Shoaib, S. Bosch, O. D. Incel, H. Scholten, and P. J. M. Havinga, “Complex human activity recognition using smartphone and wrist-worn motion sensors,” Sens., vol. 16, no. 4, pp. 426, 2016. [Google Scholar]
7. I. D. Luptáková, M. Kubovčík, and J. Pospíchal, “Wearable sensor-based human activity recognition with transformer model,” Sens., vol. 22, no. 5, pp. 1911, 2022. [Google Scholar]
8. S. Gupta, “Deep learning based human activity recognition (HAR) using wearable sensor data,” Int. J. Inf. Manag. Data Insights, vol. 1, no. 2, pp. 100046, 2021. doi: 10.1016/j.jjimei.2021.100046. [Google Scholar] [CrossRef]
9. S. C. Mukhopadhyay, “Wearable sensors for human activity monitoring: A review,” IEEE Sens. J., vol. 15, no. 3, pp. 1321–1330, 2015. doi: 10.1109/JSEN.2014.2370945. [Google Scholar] [CrossRef]
10. W. Z. Tee, R. Dave, N. Seliya, and M. Vanamala, “A close look into human activity recognition models using deep learning,” Int. Conf. on Comput., Netw. and Internet of Things (CNIOT), pp. 201–206, Qingdao, China, Jul. 2022. doi: 10.1109/CNIOT55862.2022.00043. [Google Scholar] [CrossRef]
11. M. A. Mousse, C. Motamed, and E. C. Ezin, “Percentage of human-occupied areas for fall detection from two views,” Vis. Comput., vol. 33, no. 12, pp. 1529–1540, 2017. doi: 10.1007/s00371-016-1296-y. [Google Scholar] [CrossRef]
12. Y. Zhou, Z. Yang, X. Zhang, and Y. Wang, “A hybrid attention-based deep neural network for simultaneous multi-sensor pruning and human activity recognition,” IEEE Internet Things J., vol. 9, no. 24, pp. 25363–25372, 2022. doi: 10.1109/JIOT.2022.3196170. [Google Scholar] [CrossRef]
13. V. A. Saeed, “A framework for recognition of facial expression using HOG features,” Int. J. Math. Stat. Comput. Sci., vol. 2, no. 18, pp. 1–8, 2023. doi: 10.59543/ijmscs.v2i.7815. [Google Scholar] [CrossRef]
14. M. Abid et al., “Physical activity recognition based on a parallel approach for an ensemble of machine learning and deep learning classifiers,” Sens., vol. 21, no. 14, pp. 1–11, Jul. 2021. [Google Scholar]
15. X. Yang and Y. L. Tian, “Eigenjoints-based action recognition using naive-bayes-nearest-neighbor,” in Proc. 2012 IEEE Comput. Soc. Conf. Comput. Vis. Pattern Recognit. Workshops, Providence, RI, USA, Jun. 2012, pp. 14–19. [Google Scholar]
16. S. Wan, L. Qi, X. Xu, C. Tong, and Z. Gu, “Deep learning models for real-time human activity recognition with smartphones,” Mobile Netw. Appl., vol. 25, no. 2, pp. 743–755, 2020. doi: 10.1007/s11036-019-01445-x. [Google Scholar] [CrossRef]
17. K. Wang, J. He, and L. Zhang, “Attention-based convolutional neural network for weakly labeled human activities’ recognition with wearable sensors,” IEEE Sens. J., vol. 19, no. 17, pp. 7598–7604, 2019. doi: 10.1109/JSEN.2019.2917225. [Google Scholar] [CrossRef]
18. V. Nunavath et al., “Deep learning for classifying physical activities from accelerometer data,” Sens., vol. 21, no. 16, pp. 5564, Aug. 2021. [Google Scholar]
19. I. Ullah Khan, S. Afzal, and J. W. Lee, “Human activity recognition via hybrid deep learning based model,” Sens., vol. 22, no. 1, pp. 323, Jan. 2022. [Google Scholar]
20. A. Murad and J. Y. Pyu, “Deep recurrent neural networks for human activity recognition,” Sens., vol. 17, no. 11, Nov. 2017. [Google Scholar]
21. F. J. Ordonez and D. Roggen, “Deep convolutional and LSTM recurrent neural networks for multimodal wearable activity recognition,” Sens., vol. 16, no. 11, pp. 115, 2016. [Google Scholar]
22. S. P. Gamboa, Q. Sun, and Y. Zhang, “Improved sensor based human activity recognition via hybrid convolutional and recurrent neural networks,” in IEEE Int. Symp. Inertial Sens. Syst. (INERTIAL), Kailua-Kona, HI, USA, Mar. 2021. [Google Scholar]
23. H. Cho and S. M. Yoon, “Divide and conquer-based 1D CNN human activity recognition using test data sharpening,” Sens., vol. 18, no. 4, pp. 1055, 2018. doi: 10.3390/s18041055 [Google Scholar] [PubMed] [CrossRef]
24. T. Hur, J. Bang, T. H. The, J. Lee, J. Kim and S. Lee, “A novel signal-encoding technique for CNN-based human activity recognition,” Sens., vol. 18, no. 11, pp. 3910, 2018. doi: 10.3390/s18113910. [Google Scholar] [CrossRef]
25. N. Tufek, M. Yalcin, M. Altintas, F. Kalaoglu, Y. Li and S. K. Bahadir, “Human action recognition using deep learning methods on limited sensory data,” IEEE Sens. J., vol. 20, no. 6, pp. 3101–3112, 2019. [Google Scholar]
26. W. Jiang and Z. Yin, “Human activity recognition using wearable sensors by deep convolutional neural networks,” in Proc. 23rd ACM Int. Conf. Multimed. Brisbane, Australia, 2015, pp. 1307–1310. [Google Scholar]
27. K. M. Mustaqeem et al., “Human action recognition using attention-based LSTM network with dilated CNN features,” Future Gen. Comput. Syst., vol. 125, no. 3, pp. 820–830, 2021. doi: 10.1016/j.future.2021.06.045. [Google Scholar] [CrossRef]
28. X. Li et al., “Concurrent activity recognition with multimodal CNN-LSTM structure,” arXiv:1702.01638, 2017. [Google Scholar]
29. L. Lam and S. Y. Suen, “Application of majority voting to pattern recognition: An analysis of its behavior and performance,” IEEE Trans. Syst. Man, Cybern.—Part A: Syst. Hum., vol. 27, no. 5, pp. 553–568, 1997. doi: 10.1109/3468.618255. [Google Scholar] [CrossRef]
30. Y. Bi, J. Guan, and D. Bell, “The combination of multiple classifiers using an evidential reasoning approach,” Artif. Intell., vol. 172, no. 15, pp. 1731–1751, 2008. doi: 10.1016/j.artint.2008.06.002. [Google Scholar] [CrossRef]
31. G. Rogova, “Combining the results of several neural network classifiers,” Neural Netw., vol. 7, no. 5, pp. 777–781, 1994. doi: 10.1016/0893-6080(94)90099-X. [Google Scholar] [CrossRef]
32. A. Rossi et al., “Multilevel monitoring of activity and sleep in healthy people (version 1.0.0),” PhysioNet, vol. 5, no. 4, 2020. doi: 10.13026/cerq-fc86. [Google Scholar] [CrossRef]
33. A. Shrestha and A. Mahmood, “Review of deep learning algorithms and architectures,” IEEE Access, vol. 7, pp. 53040–53065, 2019. doi: 10.1109/ACCESS.2019.2912200. [Google Scholar] [CrossRef]
34. M. Golzar, F. F. Ghazvini, H. Rabbani, and F. S. Zakeri, “Mobile cardiac health-care monitoring and notification with real time tachycardia and bradycardia arrhythmia detection,” J. Med. Signals Sens., vol. 7, no. 4, pp. 193–202, 2017 [Google Scholar] [PubMed]
35. G. K. Reddy and K. L. Achari, “A non invasive method for calculating calories burned during exercise using heartbeat,” in IEEE Sponsored 9th Int. Conf. Intelligent Syst. Cont. (ISCO), Coimbatore, India, 2015. [Google Scholar]
36. I. Bloch, “Some aspects of Dempster-Shafer evidence theory for classification of muti-modality medical images taking partial volume effect into account,” Pattern Recognit. Lett., vol. 17, no. 8, pp. 905–919, 1996. doi: 10.1016/0167-8655(96)00039-6. [Google Scholar] [CrossRef]
37. N. Triki, M. Ksantini, and M. Karray, “Traffic sign recognition system based on belief functions theory,” in 13 th Int. Conf. on Agents Artif. Intell. (ICAART), Vienna, Austria, 2021. [Google Scholar]
38. A. Ellouze, O. Kahouli, M. Ksantini, H. Alsaif, A. Aluoi and B. Kahouli, “Artificial intelligence-based diabetes diagnosis with belief functions theory,” Symmetry, vol. 14, no. 10, pp. 2197, 2022. doi: 10.3390/sym14102197. [Google Scholar] [CrossRef]
Cite This Article
 Copyright © 2024 The Author(s). Published by Tech Science Press.
This work is licensed under a Creative Commons Attribution 4.0 International License , which permits unrestricted use, distribution, and reproduction in any medium, provided the original work is properly cited.
 Downloads
 Citation Tools