
 Submit a Paper
 Propose a Special lssue
 Open Access
ARTICLE

Infrared and Visible Image Fusion Based on Res2Net-Transformer Automatic Encoding and Decoding
1 Key Laboratory of Modern Power System Simulation and Control & Renewable Energy Technology, School of Electrical Engineering, Northeast Electric Power University, Jilin, 132012, China
2 School of Electrical Engineering, Northeast Electric Power University, Jilin, 132012, China
3 School of Aeronautical Engineering, Jilin Institute of Chemical Technology, Jilin, 132022, China
* Corresponding Author: Wukai Liu. Email:
(This article belongs to the Special Issue: Machine Vision Detection and Intelligent Recognition)
Computers, Materials & Continua 2024, 79(1), 1441-1461. https://doi.org/10.32604/cmc.2024.048136
Received 28 November 2023; Accepted 08 March 2024; Issue published 25 April 2024
 View Full Text
 Download PDF
Abstract
A novel image fusion network framework with an autonomous encoder and decoder is suggested to increase the visual impression of fused images by improving the quality of infrared and visible light picture fusion. The network comprises an encoder module, fusion layer, decoder module, and edge improvement module. The encoder module utilizes an enhanced Inception module for shallow feature extraction, then combines Res2Net and Transformer to achieve deep-level co-extraction of local and global features from the original picture. An edge enhancement module (EEM) is created to extract significant edge features. A modal maximum difference fusion strategy is introduced to enhance the adaptive representation of information in various regions of the source image, thereby enhancing the contrast of the fused image. The encoder and the EEM module extract features, which are then combined in the fusion layer to create a fused picture using the decoder. Three datasets were chosen to test the algorithm proposed in this paper. The results of the experiments demonstrate that the network effectively preserves background and detail information in both infrared and visible images, yielding superior outcomes in subjective and objective evaluations.Keywords
Image fusion involves combining two or more pictures using a certain algorithm to create a new image. Utilizing the spatial and temporal correlation as well as information complementarity of many photos enhances the clarity and comprehensiveness of the scene description, making the fused image more appropriate for human visual perception and automated machine detection [1]. Infrared sensors detect heat source targets by detecting thermal radiation and may operate in all situations and weather. They have an excellent ability to differentiate between background and target information and demonstrate considerable resistance to interference. Nevertheless, the pictures acquired frequently lack structural texture. Visible sensors can analyze intricate scene and texture characteristics by interpreting light reflection, mirroring the observation pattern of the human eye. The identification effect is moderate and sensitive to light, which might make it challenging to use in low-light conditions. Image fusion technology combines visible and infrared sensors to leverage their strengths and compensate for their weaknesses, resulting in images with enhanced detail and improved target perception. These images can be used to aid other related activities in other areas, such as medical diagnosis, smart driving, and security monitoring [2].
Current methods for combining infrared and visible pictures may be generally divided into two categories: Conventional fusion techniques and deep learning-driven fusion techniques. Traditional fusion methods include image pyramid transform [3], wavelet transform based [4], contour wavelet [5], multi-scale geometric transform, spatial filtering, etc. [6–8]. For example, in literature [9], weighted average and nuclear norm are set as fusion strategies; however, for modal features of infrared images, the target is highlighted by pixel brightness perception, while for visible light, the feature is highlighted by structural texture, and the most perfect feature may not be obtained. Also, in the literature [10], the visible and infrared images are decomposed separately using multiscale transform (MST), and colour fusion is performed manually. Conventional fusion techniques need manual configuration, and the resultant fused picture is dependent on manually established guidelines. Furthermore, conventional approaches have a drawback in feature extraction since they extract a limited number of characteristics. Deep learning has advanced image processing by effectively extracting intricate features from images, addressing the limitations of traditional methods in feature extraction. Consequently, fusion methods based on deep learning are increasingly utilized.
Deep learning approaches may be categorized into four groups, with the first being a convolutional neural network [11–13], which extends the multi-scale processing of images. Optimization network approaches, like filters or feature extraction networks, convert the spatial domain into the basic domain and the detail domain. The average of the basic domain is combined with high-frequency texture features in the detail domain. The detailed feature map generated from the original pre-trained neural network is integrated. The basic image and detailed image are fused to create the final fused picture. In literature [14], Zhang et al. designed a feature coding block composed of convolutions and proposed a lightweight convolutional neural network containing only nine convolutional neural networks (CNNs) layers for encoding and decoding, which can carry out feature fusion more fully. In the literature [15], Tang et al. introduced a method for fusing infrared and visible light images using Convolutional Neural Networks (CNNs) and saliency detection. They utilized a two-channel CNN to generate the initial fused image. A saliency map is created by comparing the structural similarity between the infrared and visible source pictures with the original fused image. A weighted fusion rule is employed to create the fused picture, maintaining the intensity and texture homogeneity in the saliency zone. The second category is based on generative adversarial networks [16,17]. In this type of article, image fusion is considered as a result of adversarial equilibrium, where the generator creates fused images that contain the glowing and texture information of the source image and keeps adding detailed information for generation and adversarial, and finally, the generator produces fused images that are indistinguishable by the discriminator. These end-to-end models avoid the manual design of fusion rules. In literature [18], Liu et al. proposed a comparison of visible infrared image conversion networks and introduced a class-activation graph-based attention module into the generator and discriminator for generating adversarial networks (GANs) to capture richer contextual information in images. For example, in literature [19], Li et al. utilized the coupled generative adversarial network in picture fusion to expedite the network’s convergence. The third category is an automatic encoding and decoding-based image fusion architecture where the network is taught during the training phase to extract features from the source picture. During the testing step, the feature maps are combined individually, and then the integrated picture is rebuilt using a decoder. Deep neural networks (DNNs) are commonly employed to extract features from input images, followed by the application of specific fusion algorithms to combine these characteristics and accomplish the image fusion job. In a study referenced as [20], it was shown that utilizing solely convolutional and pooling layers together with a loss function, without incorporating reference quality measurements, effectively combines the feature. Wang et al. retrieved superficial and profound image features by using two branches of the encoder in literature [21]. The fusion layer uses residual blocks to combine two sets of features from the infrared and visible images inside the same branch, and the decoder creates the final fused image. The fourth category is fusion methods based on Transformer, which was first proposed in the literature [22] in 2017 and applied to natural language processing with good results. Since then, Transformer applications have gradually emerged in image processing. For example, in literature [23], a Transformer network was used for automatic detection in image processing and achieved good results, followed by image recovery in literature [24] in 2021. The approach involved utilizing a convolutional layer for extracting shallow features initially, followed by employing the Swin Transformer for deep feature extraction. In 2022, in literature [25], Wang et al. introduced the use of a Transformer in image fusion for infrared and visible light. They developed a fully attentional feature encoding backbone to capture long-range dependencies. This pure Transformer network has superior representational abilities compared to convolutional neural networks and effectively maintains the brightness of infrared images while preserving visible details.
However, the aforementioned deep learning methods still have certain issues. For instance, in convolutional neural networks, the excessive use of convolutional layers can lead to the vanishing or exploding gradients of the network. While GANs train the generator and discriminator in an adversarial manner, there are potential problems such as training imbalance and mode collapse. Sometimes, the generator is able to generate samples of high quality, but the discriminator can still accurately distinguish them, causing training to become difficult. Standalone encoder-decoder networks or Transformer networks also have their limitations. This research suggests an automatic encoded and decoded infrared-visible image fusion network that combines Res2Net and Transformer to overcome the limits of individual approaches and improve the quality of fused pictures. This paper’s contributions can be summarized as follows:
(1) The introduction of the improved Inception module enables the extraction of multi-scale features on the one hand, and on the other hand, it also increases the robustness of the network.
(2) An Edge Enhancement Module (EEM) is created to extract additional edge characteristics from the original photos.
(3) A novel encoder consisting of Res2Net and Transformer is built for simultaneous extraction of local and global information from infrared and visible images.
(4) A modal maximum difference degree fusion technique is proposed to enhance the adaptive representation of information in various regions of the source picture during fusion, resulting in a fused image that aligns better with human visual perception.
(5) The proposed method achieved favourable results in subjective evaluations and objective analyses compared to several typical methods across three different datasets.
The remainder of this article is organized as follows. Section 2 presents the network fusion framework and the framework of each module, Section 3 provides the loss function and fusion technique, Section 4 covers the experimental findings and analysis, and Section 5 concludes the document.
The network has three primary modules: Feature extraction, feature fusion, and feature reconstruction. The feature extraction module consists of three stages: Extracting features from infrared pictures, extracting features from visible light images, and extracting edge features from both types of photos. During each stage, both the infrared (IR) and visible source images are simultaneously processed. Shallow feature extraction is conducted using an enhanced Inception module, passing through each convolutional layer sequentially. Feature enhancement and a Transformer cascade of Res2Net are utilized for feature extraction to generate the background and detail feature maps of IR and visible light, denoted as

Figure 1: Infrared and visible image fusion network
This research utilizes the Inception network to incorporate multi-scale information to enhance the fused picture characteristics and ensure the network’s resilience. The inception network is a significant achievement in the evolution of CNN classifiers. Before Inception, popular CNNs often added additional convolutional layers to increase the depth of the network in order to improve performance. The first iteration of the Inception network, Inception V1 or GoogLeNet, was created to develop a network with a strong local structure by executing numerous convolution and pooling operations simultaneously on the input image and combining all the results into a deep feature map. Utilizing various convolution procedures like 1 × 1, 3 × 3, or 5 × 5 together with pooling operations may gather diverse information from the input picture. Running these operations simultaneously and merging the outcomes enhances the image representation. Subsequent to Inception V1, networks like Inception V2, Inception V3, Inception V4, and Inception-ResNet-V2 [26–29] have been introduced.
Fig. 2 displays the enhanced Inception module structure utilized in this study, which maintains the benefits of feature maps, including intricate feature patterns at various sizes, employing diverse convolutional kernels, and capturing features at many scales. The network starts with a 1 × 1 convolution, followed by 3 × 3 and 5 × 5 convolutions to enhance network depth, enhance network nonlinearity, and decrease network parameters. The model incorporates a bulk normalization (BN) layer preceding each input layer to normalize the inputs to a mean of 0 and a variance of 1. This boosts the network’s complexity and non-linear characteristics while also speeding up the training procedure.

Figure 2: Inception module
Res2Net was proposed by Mingming Cheng’s group at Nankai University in 2019 [30], and the main contribution is to improve the block module in the ResNet model with no increase in computational load and more powerful feature extraction. As shown in Fig. 3, in simple terms, Res2Net divides the input of 3 × 3 convolutional layers into four parts, and the network is connected internally in a residual style. Before finally going through the 1 × 1 convolution, after the newly added Squeeze-and-Excitation (SE) module, the expressive ability and performance of the neural network are enhanced by adaptively learning the weights of each channel so that the network can learn and utilize the relationship between the feature channels more efficiently, enabling Res2Net to better extract multi-scale features.

Figure 3: Res2Net module
Fig. 4a illustrates the network structure of the Res2Net Residual Swin Transformer Block. It consists of Res2Net and a sequence of Swin Transformer layers (STLs) with residual connections after the previous shallow extraction, followed by combining the extracted information into the Residual Swin Transformer Block network. Three Res2Net modules and three Swin Transformer layers are employed in this study to extract intermediate global features. Res2Net and Swin Transformer utilize many layers to capture global data effectively, with residual connections aggregating features across various levels.
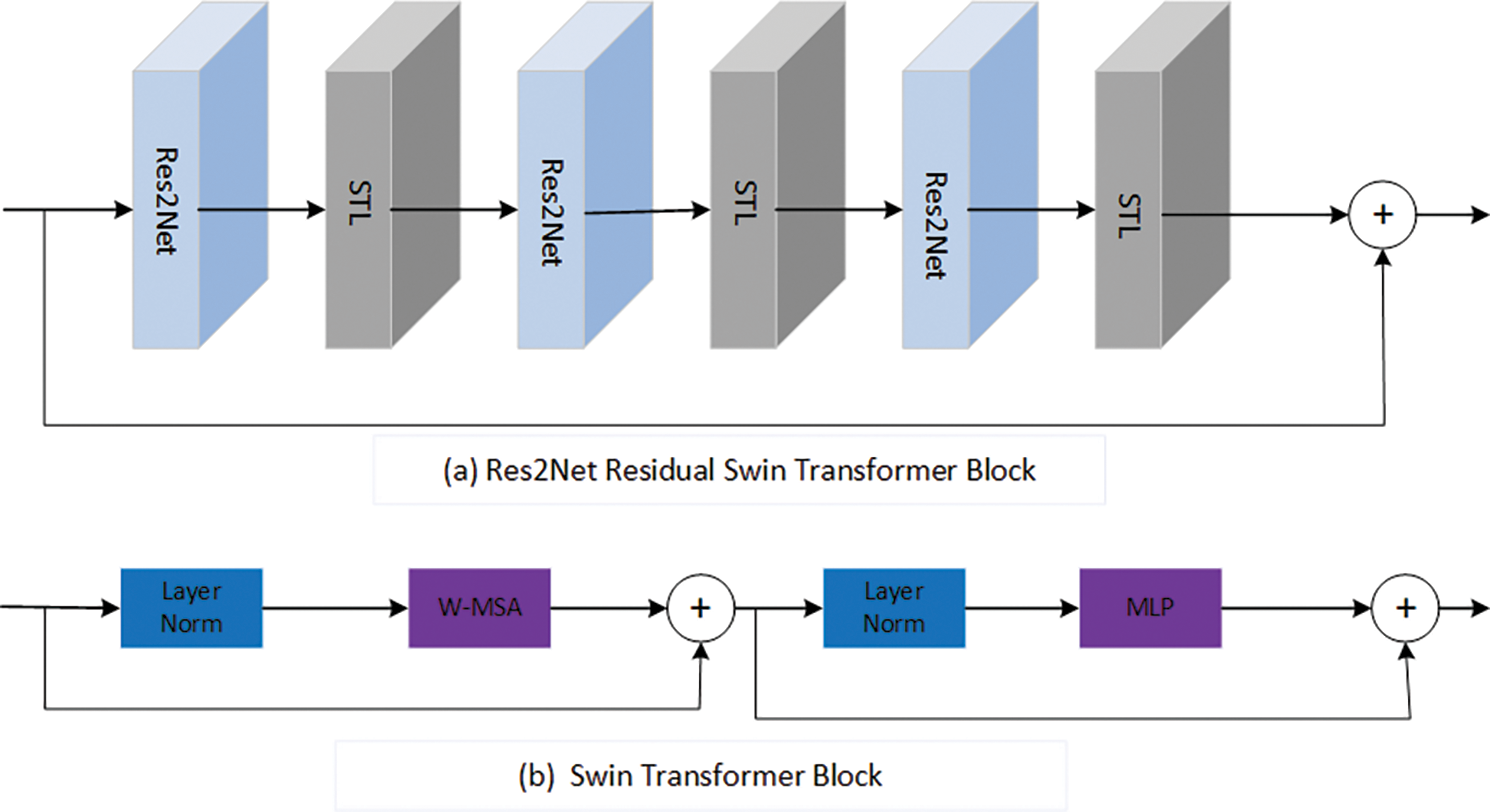
Figure 4: Res2Net residual swin transformer block & swin transformer block
The Swin Transformer layer, depicted in Fig. 4b, as described in the literature [25], first employs an N × N sliding window to divide the input into non-overlapping
The parameters
p represents the learnable parameter utilized for position decoding. The Swin Transformer layer then calculates the usual Multiple Self Attention (MSA) for the shift window. The system consists of a Weighted-Moving Standard Average (W-MSA) and a multilayer perceptron (MLP). A LayerNorm layer is placed before W-MSA and MLP, with a residual connection utilized for the module.
In order to retain more edge features in the fusion stage, an edge feature extraction module is designed, as shown in Fig. 5a. First, the Canny edge extraction operator is used to obtain preliminary edge features, and then two groups of convolution layers, both of which have convolution kerns of 3 × 3, and the Relu activation function is used in CONV-Block 1. In CONV-Block 2, the Tanh activation function is used and finally passes through the convolutional block attention module (CBAM) module, as shown in Fig. 5b. The edge feature extraction of the source image is realized.

Figure 5: Edge enhancement module
3 Loss Functions and Fusion Strategies
3.1 Loss Function for Image Decomposition (Coding)
The background feature map is to get the same feature points of IR and visible light, and the detail feature map is to get the respective features of IR and visible light, so it should make the difference between the obtained same features a little less and make the difference between different features a little more, respectively, the loss function for image decomposition is defined as follows:
3.2 Loss Function for Image Reconstruction
The reconstruction loss function is defined by the following equation for image reconstruction, where the objective is to accurately maintain the input image’s pixel intensity and fine-grained texture information:
The input and reconstructed pictures are designated by the letters
Combining Eqs. (6) as well as (7), the total loss
The hyperparameters in the loss function are set as follows:
The preceding section outlines the network structure and loss function. Following the training process, an encoder and a decoder will be generated. The objective during the fusion step is to combine the infrared and visible pictures. A fusion layer is added during the fusion stage to combine the background and detail feature maps together with the edge features. The fusion of the background features is calculated as Eq. (11) since the difference between the two is not much for the background information, but the difference between the detail information features is large.
However, the detailed feature map is to show the difference between the two. The infrared detail feature map and the visible detail feature map are subtracted to calculate the difference between the two, and then the difference feature map and the maximum difference degree of the difference feature map are divided to obtain the relative difference weights and, as shown in Eqs. (12) and (13).
The max in Eqs. (12) and (13) performs a global depth maximum pooling operation on the difference feature maps to obtain the maximum degree of difference between the two images.
In order to assign weights to the pixels in the infrared and visible feature maps according to their importance, the relative difference weights obtained above are added to their absolute values and averaged as the final adaptive weighted maps
This adaptive weighting map and the initial feature map are then multiplied to generate the pre-fused feature maps
Finally, the two pre-fusion feature maps are averaged to obtain the final detailed fusion feature map
Finally,
Suppose in the training phase, the number of images in the dataset in the training phase is M, the number of cycles of training is E, the number of images contained in one iteration, i.e., the batch size, is N, the number of iterations (which denotes the number of iterations contained in one cycle) is I, and I = M/N. So, the time complexity obtained in the data extraction phase is O(E) * O(N) * O(I) = O(E * N * I).
The article only includes the essential phases of the training cycle, as the primary time-consuming components are the Transformer and Res2Net modules. The time complexity of the Transformer model is calculated as O(dim * H * W + d * nW + H * W * dim * dim * mlp_ratio), where dim represents the input features’ dimension, H is the input image height, W is the input image width, d is the input feature dimension within each window, and nW is the total number of windows. The time complexity of the 1x1 convolutional layer in Res2Net is O(c_in * c_out * h * w), whereas the time complexity of the BN layer and activation function may be ignored to get the total time complexity of Res2Net. Res2Net’s time complexity is O(c_in * c_out * h * w * scales), c_in and c_out denote the input and output channels of the convolutional layer, h represents the height of the input feature map, w represents the width of the input feature map, and scales indicate the number of feature groups in the residual block.
In the training phase, since the rest of the steps are executed sequentially, the time complexity is all O(1), so the total time complexity is O(ENI) * [ O(dim * H * W + d * nW + H * W * dim * dim * mlp_ratio) + O(c_in * c_out * h * w * scales)].
In the testing phase, this paper uses only one kind of dataset to test the time complexity and uses the already trained model. The time complexity depends on the number of times of forward propagation, so the time complexity of the testing phase is O(M * I), where M is the number of samples tested and I is the prediction time of each sample.
This section aims to analyze the fusion effect obtained by picture fusion and contrast it with other advanced modelling techniques. The FLIR dataset was chosen for training in this study, and all pictures were transformed to grayscale prior to training. This study simultaneously centred and cropped the images to 128 × 128 pixels. One hundred and eighty pairings of infrared and visible datasets were utilized for training, whereas three publically accessible datasets, namely TNO, NIR-century, and FLIR, were employed for fusion experiments. The studies were carried out using a hardware setup consisting of an NVIDIA GeForce RTX 3090 and a software setup including Windows 10, Python 3.8, and PyTorch 1.10.2.
This study uses six objective parameters to thoroughly assess the quality of the merged picture. Information entropy (EN) quantifies the information included in the combined features of the grayscale distribution inside the image. Mutual information (MI) quantifies the level of mutual interdependence between two variables. MI may assess the level of information overlap between two input pictures in image fusion. The average gradient (AG) is a measure of picture sharpness in fused images. A higher AG value implies greater image sharpness and overall fusion quality. Standard deviation (SD) is a quantitative measure that assesses the amount of information included in a picture. A higher standard deviation number signifies a wider spread of grayscale values and a greater quantity of information conveyed by the image, leading to improved fusion image quality. Visual Information Fidelity (VIF) is a measure used to assess how well visual information is maintained. Peak signal-to-noise ratio (PSNR) assesses picture distortion by analyzing the discrepancies between the original and reconstructed images. Higher PSNR values correspond to superior image quality. Six generally used parameters are utilized to objectively assess the fusion results of each approach.
4.2 Experimental Results and Analysis
In the training phase, Adam optimizes the network for 120 epochs with a batch size of 24 during the training phase. In this study, the learning rate is set at
In order to verify the optimal values of each parameter value, the values of each parameter were adjusted to four sets of values (a), (b), (c), and (d), respectively, in the training phase and the optimal values were obtained according to the training results. The values of each parameter were set among them, as shown in Table 1.
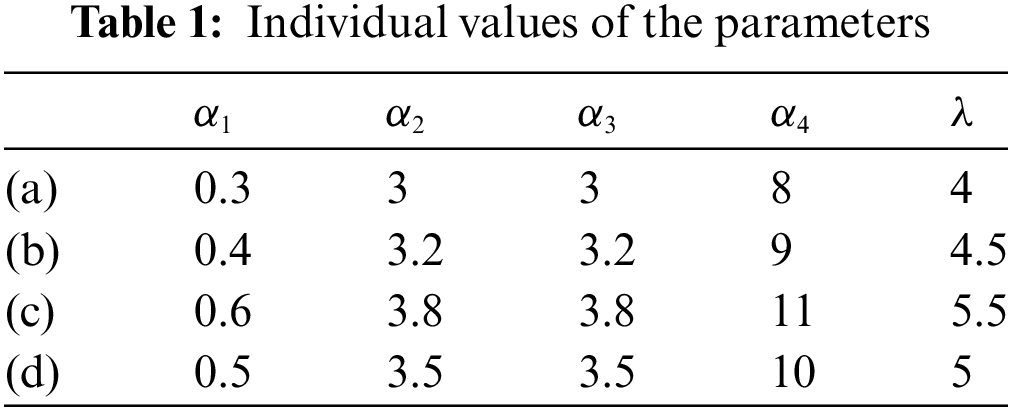
The obtained training effects are shown in Figs. 6a–6d, define the horizontal and vertical axes as the x-axis and y-axis, respectively. The results show that all the loss curves are almost very flat after 120 rounds of training. Four training images were obtained for the four sets of data in the setup, and in Figs. 6a and 6c, although the overall loss function and the recombined loss function curves reached convergence after about 20 rounds, the background loss function did not converge until about 40 rounds, and the convergence performance was slow and ineffective. Fig. 6b shows that while the overall loss function and background loss function converge rapidly, the detail loss function decreases compared to group (d). A higher value in the detail loss function indicates better model extraction performance, making the image (d) more effective. Therefore, the data from group (d) is selected as the parameter value.


Figure 6: Variation of each loss function curve after 120 rounds
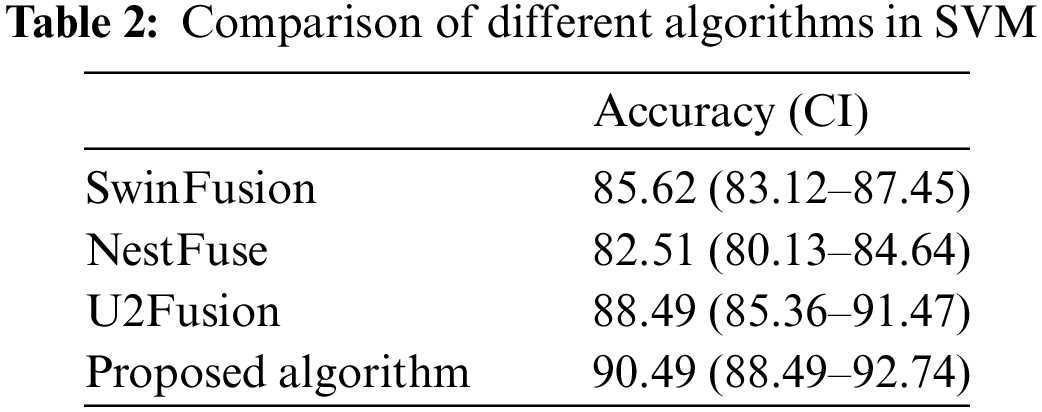
This paper utilizes a dichotomous model support vector machine (SVM) to assess the benefits of the training model, as inspired by the literature [31]. Fused images from each algorithm are used as inputs, and the variance of the area under the curve is calculated along with the 95% confidence interval using a normal distribution function. The 95% confidence interval, a statistical concept, represents the range of uncertainty in estimating parameter results in statistical inference, indicating the reliability of the inferred outcomes. The receiver operating characteristic (ROC) curve is obtained, which in turn gives the area under the curve (AUC) value [32]. An AUC value of 0.9065 can be obtained for the model of this paper, 0.8641 for U2Fusion, 0.7301 for SwinFusion, and 0.7254 for NestFuse. Since there are more methods to compare, only three algorithms were selected for comparison, as shown in Fig. 7. From the AUC results, it can be seen that the model proposed in this paper performs better.

Figure 7: ROC curve
The performance comparison of various machine learning algorithms is shown in Table 2.
In order to verify the effectiveness of the method, Nestfuse [33], Seafusion [34], U2Fusion [35], IGNet [36], SwinFusion [37], DATFuse [38], PAIFusion [39], MetaFusion [40], and YDTR [41] were selected nine typical fusion algorithms are compared. The method’s performance is assessed subjectively and objectively.
Fig. 8 displays the fusion outcomes of combining a collection of infrared and visible photos from the TNO dataset using the nine approaches mentioned above. The infrared target perceives the brightness of (c), (f), (h), and (k) in Fig. 8 as dim and indistinct, particularly inside the area shown in red. Only the basic shape of the window is seen, but individual details are unclear. In Figs. 8d and 8g, although the brightness of the target is high, the colour of the figure is slightly dim in terms of the richness of texture details, and the key features are not highlighted. As can be seen from the green border marked in the figure, in images (e) and (i), although the brightness of the target is high, there are some distortions, especially in the image (i), where there are large black shadows. The original features cannot be accurately displayed. Compared with the target of the fusion image mentioned above, the fusion image target obtained by the model in this paper is bright and clear, which proves that the model can extract more feature information from the source image.
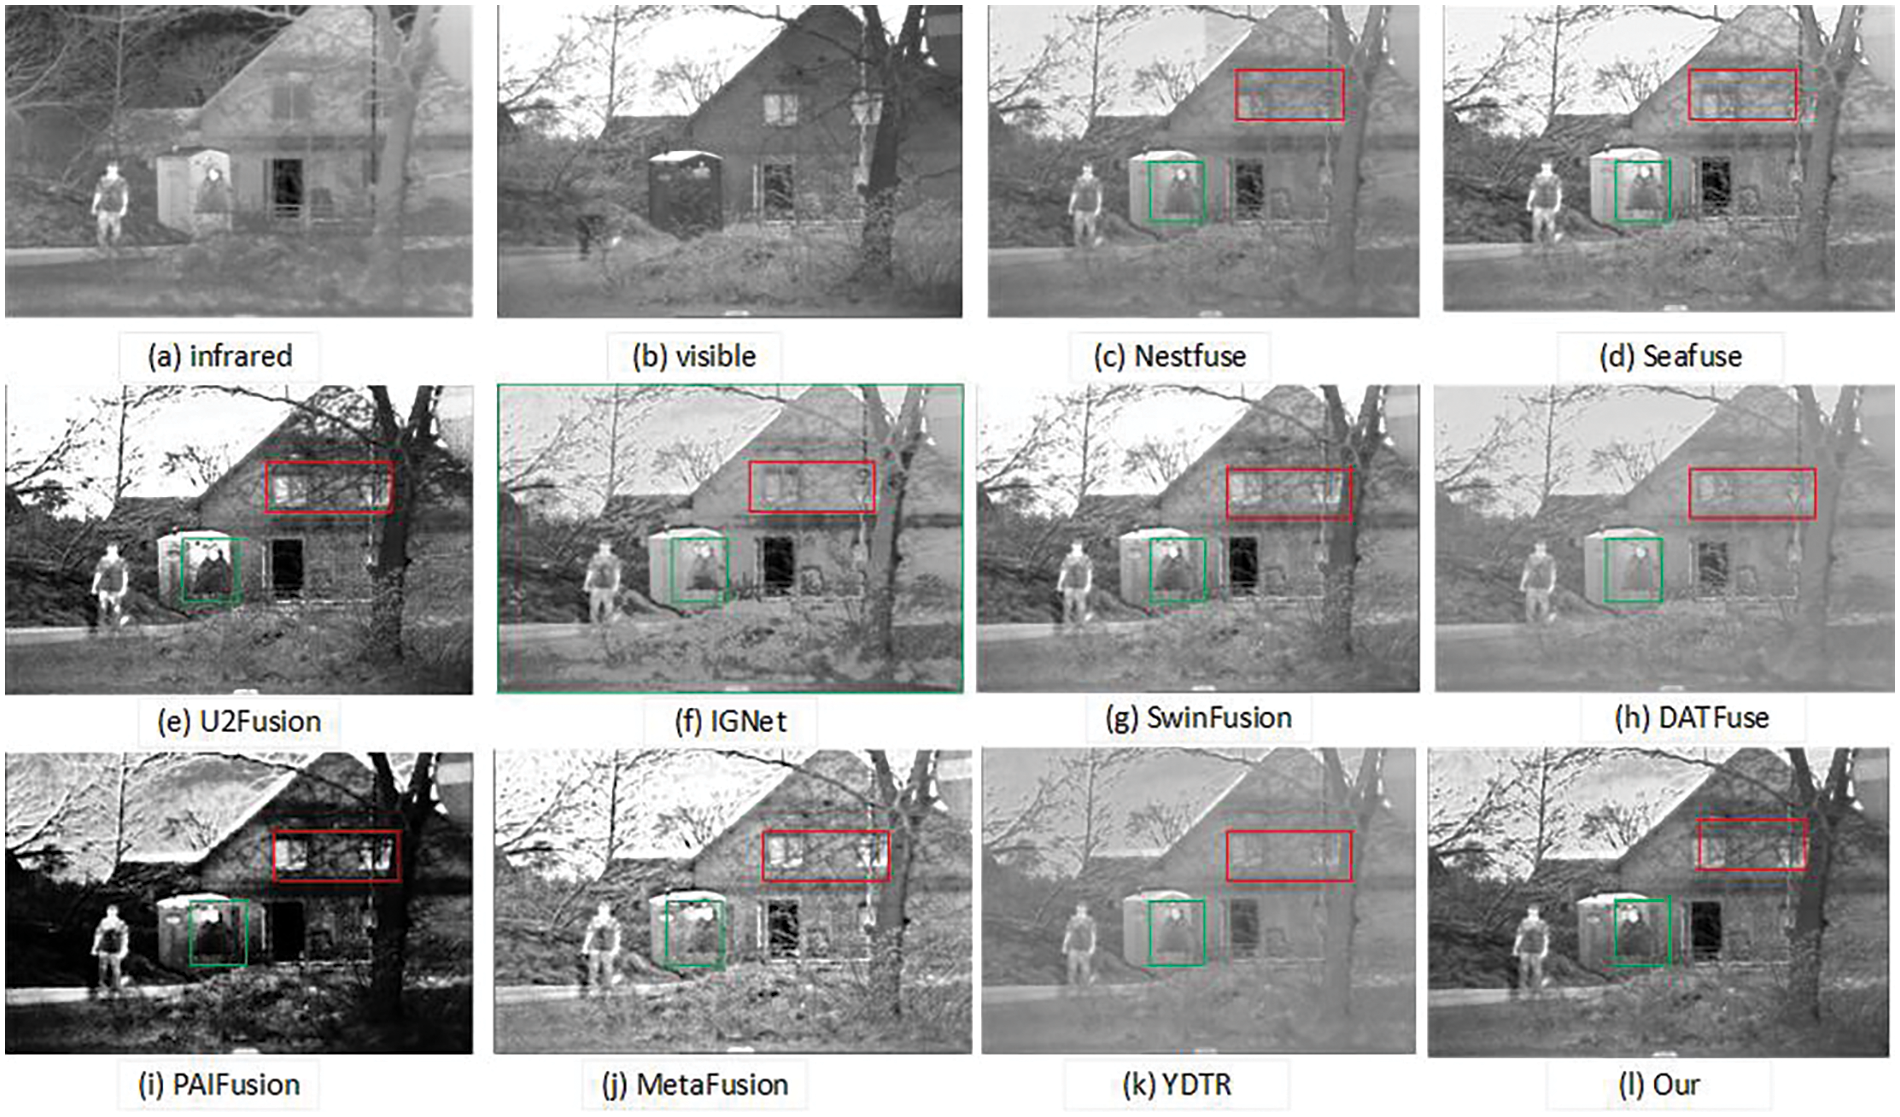
Figure 8: Experimental results on the TNO dataset
Fig. 9 displays the fusion outcomes of an infrared and visible picture pair using several techniques in the NIR dataset. The target brightness of images (c), (f), (h), and (k) in Fig. 9 is notably low, particularly in picture (h). The picture is too fuzzy, almost distorted, and cannot accurately reflect the texture and detail characteristics of the source image. In images (d), (g) and (j), the brightness effect looks good, but the texture of visible images cannot be well displayed. For example, in the marked red border, the shadow part of the tree is lighter, and the visual effect is unsatisfactory. In images (e) and (i), although the brightness is higher, the image is also clearer, but the tree and the shadow part (green border and red border) are a little too black, and it looks even darker than the colour of the source image, which is also relatively distorted. It can clearly display high brightness and does not excessively make a certain part of the image darker than the image (i). This method of fusion preserves the target features and background characteristics to the fullest extent in the resulting image. Hence, the fusion impact of this approach surpasses that of other comparison methods.

Figure 9: Experimental results of NIR dataset
Fig. 10 displays the fusion outcomes of an infrared and visible picture pair from the FLIR dataset utilizing several techniques. In images (c), (e), (f), (h) and (k), some details of the target are lost, and the target point is almost invisible, especially in the image (e), although the overall image looks bright, the manhole cover in the figure is completely invisible, and the distortion is too serious, which can be seen by the marked red border. Although the target point can be seen in image (i), the overall image is still too black, except for the points marked. Almost all other places are black. In images (d), (g) and (j), although the overall image looks bright, the license plate in the figure is partially lost, and the texture details are not completely presented. In summary, it can be seen that the image fused by the method of this paper has a bright target, rich background and better quality.

Figure 10: Experimental results of FLIR dataset
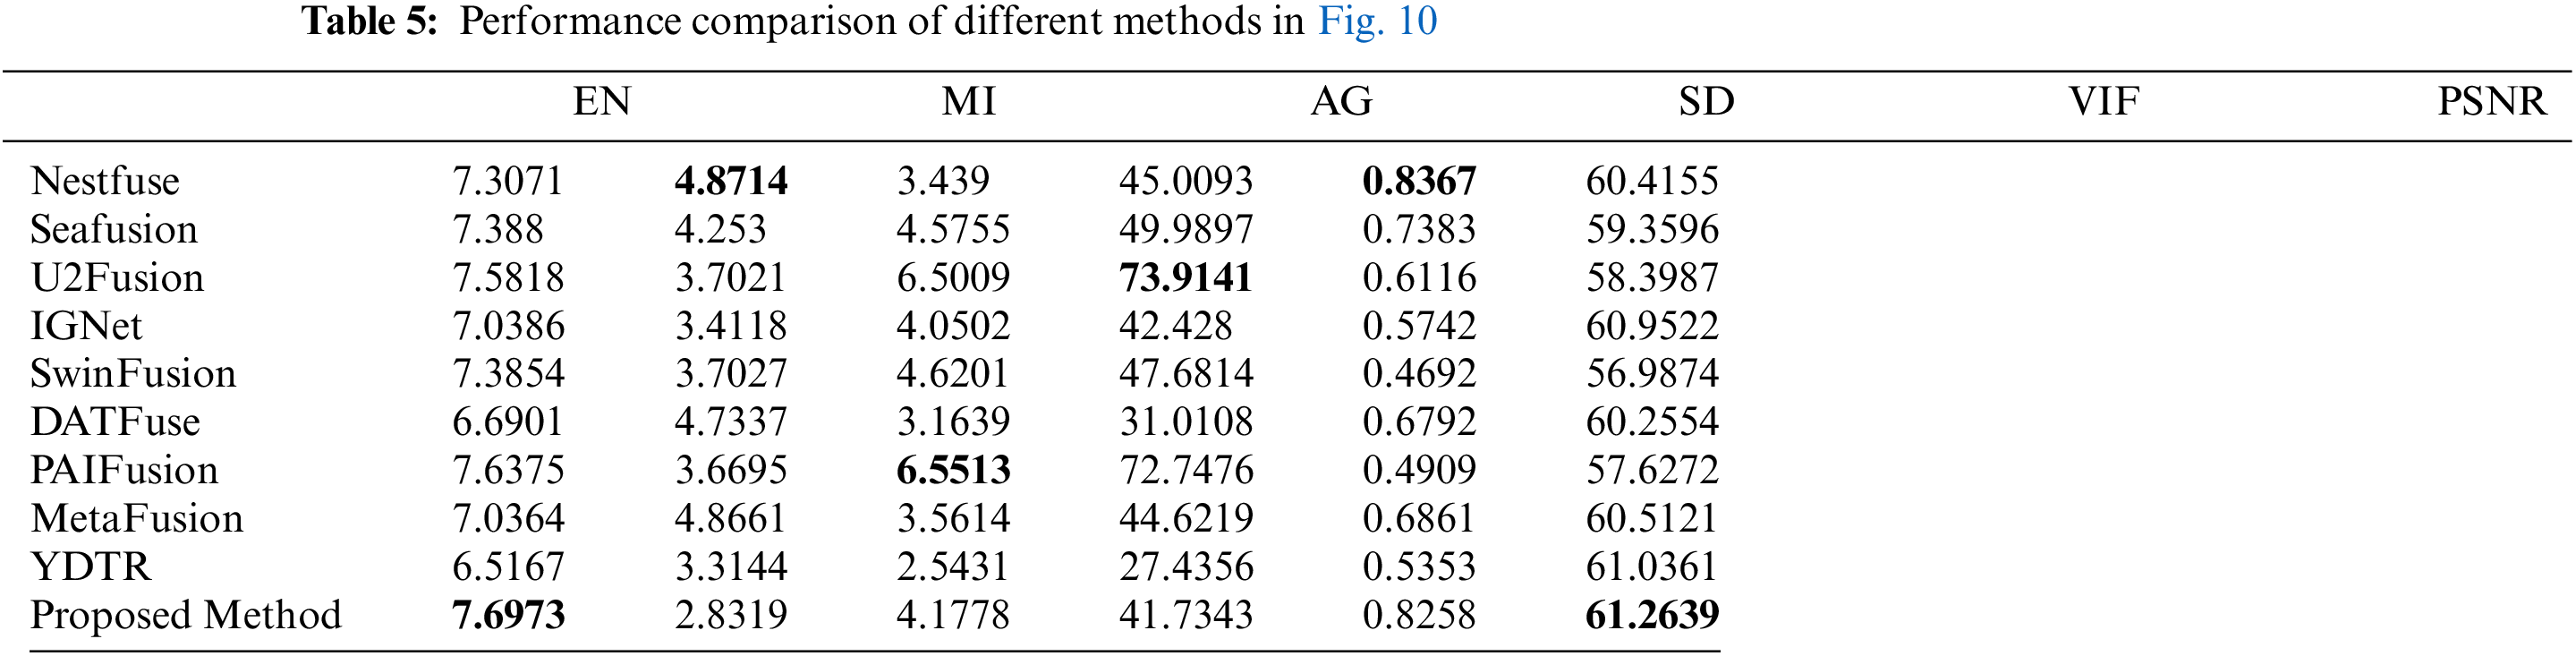
The data metrics acquired by each algorithm in different datasets are presented in Tables 3–5 to confirm the benefits of the strategy suggested in this work.
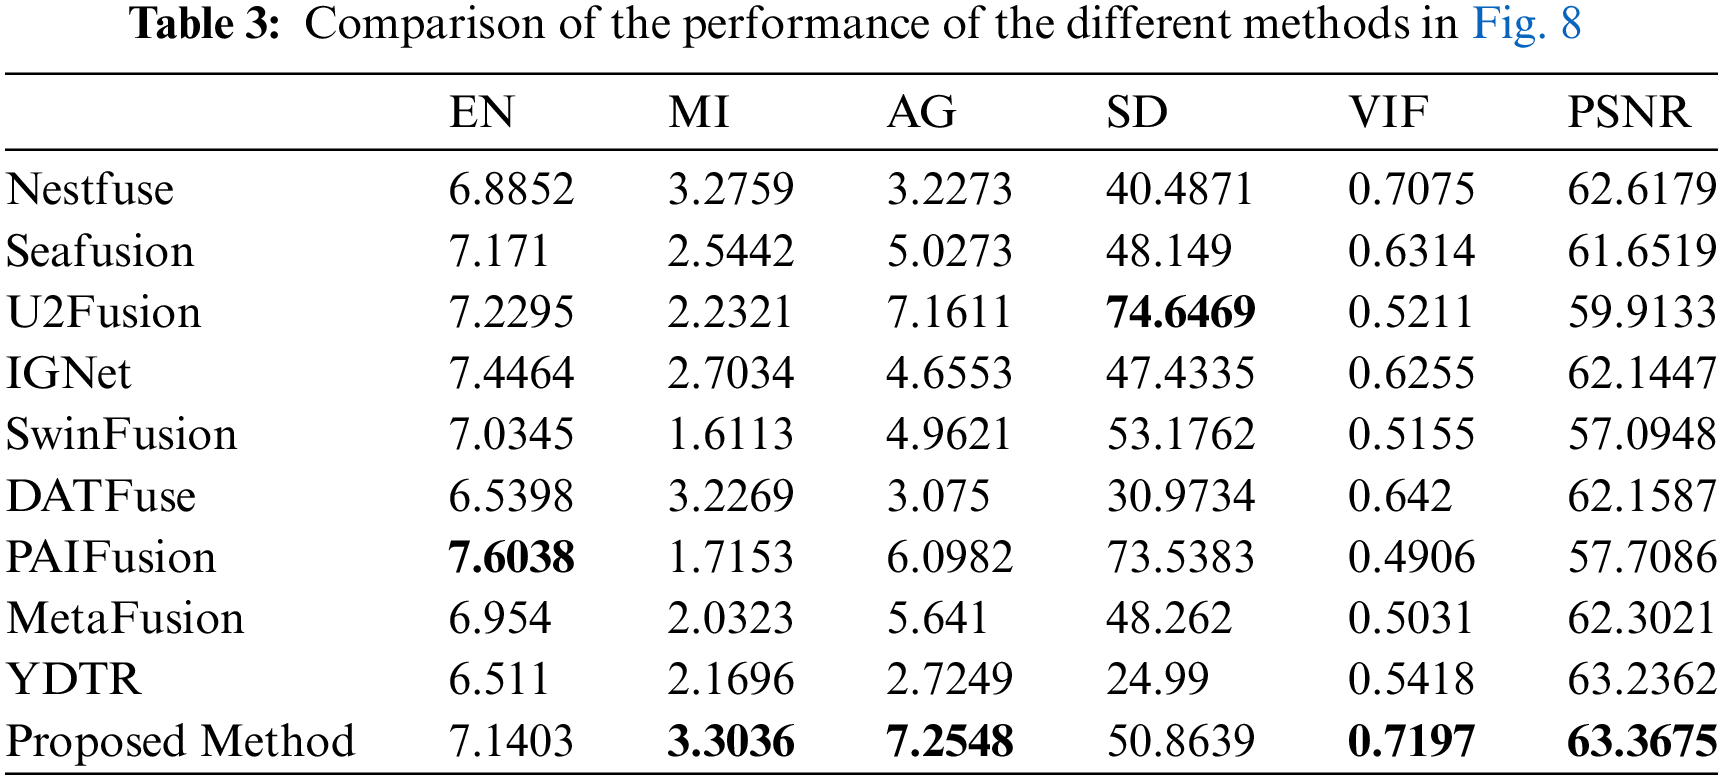

The approach presented in this study demonstrates the most effective results based on the objective assessment metrics of fusion pictures in Table 3 and Fig. 8. The approach achieves the four highest fusion indicators of MI, AG, VIF, and PSNR among the six data indicators. In the AG index, the value is 7.2548, and the AG value of YDTR is 2.7249, which is 4.5299 greater than the AG value. This indicates that the picture has more edge features and demonstrates the success of the edge enhancement module. Furthermore, the MI and VIF values are greater compared to other methods, aligning with subjective perception. The fusion picture target seems brilliant, with rich local information and a pleasant visual impression. The study demonstrates that the proposed technique may extract additional information and provide a superior fusion effect in the TNO dataset.
Table 4 documents the objective assessment metrics of the fusion pictures produced by the various approaches depicted in Fig. 9. When using evaluation measures EN, the value may not be much greater compared to other techniques, but it can still indicate the level of similarity or information overlap between the original picture and the fused image. The MI value is 0.9708, more than the PAIFusion value of 3.897, indicating a higher level of feature information from the original picture. It indicates that the NIR data set yields more information and a higher correlation between the fused image and the source image. This approach effectively integrates picture information, texture, contrast, and visual effects, aligning with subjective judgment better than previous algorithms.
The benefits of this paper’s approach are less noticeable in Table 5 when compared to the first two datasets. However, it does showcase some advantages in certain aspects. For instance, the EN value of this paper is 7.6973, whereas DATFuse is 6.6901, resulting in a difference of 1.0072. The fused image contains more information compared to the DATFuse algorithm. Additionally, the PSNR achieved the highest value, indicating that the fused image has more correlation or similarity with the source image in the FLIR dataset, resulting in better quality. This demonstrates the advantages of the method presented in the paper.
The data above shows that the fusion method suggested in this study completely integrates picture information compared to the other approaches. The fusion image comprises the most complimentary information from the source image and effectively preserves the edge texture details, demonstrating the benefits of the suggested approach.
This article proposes a novel infrared and visible light image fusion autoencoder-decoder based on the Res2Net-Transformer structure. Firstly, most existing methods in image fusion either solely utilize CNN’s convolution layers or apply emerging transformer models for feature extraction. In contrast, the proposed algorithm combines the Res2Net model for deep feature extraction with the Transformer model to incorporate global feature extraction, thereby improving the fusion quality. An edge extraction module is created to enhance the capture of edge characteristics in pictures, facilitating the extraction of more authentic edge features. A novel fusion approach has been developed based on optimizing the disparity between the infrared and visible light feature maps. The procedure assigns weights to pixels in feature maps based on their importance to guarantee the fused image retains crucial properties from the original photos adaptively. The autoencoder fusion architecture excels at merging infrared and visible light images, as demonstrated by subjective judgments and objective evaluation criteria. Pixel-level fusion aims to achieve high-quality fused pictures and support tasks like item identification and recognition. Hence, the subsequent action may involve creating a multitasking neural network capable of efficiently executing tasks like object identification while producing superior fused pictures.
Acknowledgement: The authors would like to express their gratitude to the members of the research group for their support.
Funding Statement: The authors received no specific funding for this study.
Author Contributions: Study conception and design: Chunming Wu; data collection, analysis, and interpretation of results: Wukai Liu; draft manuscript preparation: Xin Ma. All authors reviewed the results and approved the final version of the manuscript.
Availability of Data and Materials: The experimental data supporting the study’s conclusions may be obtained from the corresponding author upon request.
Conflicts of Interest: The authors declare that they have no conflicts of interest to report regarding the present study.
References
1. S. C. Wang, X. S. Li, W. Y. Huo, and J. You, “Fusion o infrared and visible images based on improved generative adversarial networks,” in 2022 3rd Int. Conf. Info. Sci., Parallel. Distr. Syst. (ISPDS), Guangzhou, China, Jul. 2022, pp. 247–251. [Google Scholar]
2. Z. S. Wang, W. Y. Shao, Y. L. Chen, J. W. Xu, and X. Q. Zhang, “Infrared and visible image fusion via interactive compensatory attention adversarial learning,” IEEE Trans. Multimedia., vol. 25, pp. 7800–7813, Dec. 2022. doi: 10.1109/TMM.2022.3228685. [Google Scholar] [CrossRef]
3. R. X. Su, L. Sun, and J. L. Wang, “Comparison of remote sensing image fusion rules based on the laplacian pyramid transformation,” in 2021 IEEE Int. Conf. Data. Sci. Comput. Appl. (ICDSCA), Dalian, China, 2021, pp. 670–674. [Google Scholar]
4. K. Lakshmi and R. Nanamran, “Development of wavelet packet transform based image fusion technique with iMPROved PSNR on medical images for simultaneous evaluation in comparison with wavelet transform based image fusion technique,” in 2022 14th Int. Conf. Math., Act. Sci., Comput. Sci. Stats. (MACS), Karachi, Pakistan, 2022, pp. 1–5. [Google Scholar]
5. S. K. Panguluri and L. Mohan, “Otsu thresholding based image fusion framework using contour-let transform,” in 2021 6th Int. Conf. Invent. Comput. Technol. (ICICT), Coimbatore, India, Jan. 2021, pp. 686–693. [Google Scholar]
6. R. H. Liu, H. Wang, S. Du, and Y. Liu, “A visible and infrared image fusion framework based on dual-path encoder-decoder and multi-scale discrete wavelet transform,” in 2023 IEEE Int. Conf. Image. Proc. (ICIP), Kuala Lumpur, Malaysia, Oct. 2023, pp. 1995–1999. [Google Scholar]
7. Z. L. Gu, M. Z. Zhu, W. B. Zhu, C. Gu, Q. D. Zhu and H. Z. Wang, “Infrared image and visible image fusion technology based on multi-scale visual weight processing discrete wavelet transform,” in 2023 Panda. Forum. Pwr. Energy. (PandaFPE), Chengdu, China, Apr. 2023, pp. 1233–1237. [Google Scholar]
8. Z. Q. Zhou, B. Wang, S. Li, and M. J. Dong, “Perceptual fusion of infrared and visible images through a hybrid multi-scale decomposition with Gaussian and bilateral filters,” Info. Fusion, vol. 30, no. 1, pp. 15–26, Jul. 2016. doi: 10.1016/j.inffus.2015.11.003. [Google Scholar] [CrossRef]
9. H. Li, X. J. Wu, and J. Kittler, “MDLatLRR: A novel decomposition method for infrared and visible image fusion,” IEEE Trans. Image. Pro., vol. 29, pp. 4733–4746, Feb. 2020. doi: 10.1109/TIP.2020.2975984 [Google Scholar] [PubMed] [CrossRef]
10. H. Lv, B. Deng, and X. R. Li, “Research on image fusion technology of infrared and visible image based on MST and CNN,” in 2022 IEEE 4th Int. Conf. Civil. Aviation. Safety. Info. Technol. ( ICCASIT), Dali, China, Oct. 2022, pp. 1395–1399. [Google Scholar]
11. H. F. Li, Y. L. Cen, Y. Liu, X. Chen, and Z. T. Yu, “Different input resolutions and arbitrary output resolution: A meta learning-based deep framework for infrared and visible image fusion,” IEEE Trans. Image. Pro., vol. 30, pp. 4070–4083, Apr. 2021. doi: 10.1109/TIP.2021.3069339 [Google Scholar] [PubMed] [CrossRef]
12. J. Y. Ma, L. F. Tang, M. L. Xu, H. Zhang, and G. B. Xiao, “STDFusionNet: An infrared and visible image fusion network based on salient target detection,” IEEE Trans. Instrum. Meas., vol. 70, pp. 1–13, 2021. doi: 10.1109/TIM.2021.3075747. [Google Scholar] [CrossRef]
13. H. Li, X. J. Wu, and J. Kittler, “Infrared and visible image fusion using a deep learning framework,” in 24th Int. Conf. Pattern. Recognit. (ICPR), Beijing, China, IEEE, Aug. 2018, pp. 2705–2710. [Google Scholar]
14. L. Zhang, Z. H. Chen, J. Q. Tao, K. Y. Zhang, Z. D. Huang and H. Ding, “A convolutional neural network based infrared-visible image fusion method and its application in aerospace measurement and control,” in 2022 IEEE 34th Int. Conf. Tools. Artif. Intell. (ICTAI), Macao, China, Oct. 2022, pp. 867–872. [Google Scholar]
15. C. W. Tang, X. L. Wu, and C. G. Dai, “Infrared and visible image fusion based on CNN and saliency detection,” in 2022 3rd Int. Conf. Big Data., Artif. Intell. Internet. Things. Eng. (ICBAIE), Xi’an, China, Jul. 2022, pp. 697–705. [Google Scholar]
16. S. C. Wang, X. S. Li, W. Y. Huo, and J. You, “Fusion of infrared and visible images based on improved generative adversarial networks,” in 2022 3rd Int. Conf. Info. Sci. Parallel. Distr. Syst. (ISPDS), Guangzhou, China, Jul. 2022, pp. 247–251. [Google Scholar]
17. J. Y. Ma, W. Yu, P. W. Liang, C. Li, and J. J. Jiang, “FusionGAN: A generative adversarial network for infrared and visible image fusion,” Info. Fusion, vol. 48, no. 4, pp. 11–26, Aug. 2019. doi: 10.1016/j.inffus.2018.09.004. [Google Scholar] [CrossRef]
18. H. Liu and L. Ma, “Infrared image generation algorithm based on GAN and contrastive learning,” in 2022 Int. Conf. Artif. Intell. Comput. Info. Technol. (AICIT), Yichang, China, Sep. 2022, pp. 1–4. [Google Scholar]
19. Q. Li et al., “Coupled GAN with relativistic discriminators for infrared and visible images fusion,” IEEE Sens. J., vol. 21, no. 6, pp. 7458–7467, Mar. 2021. doi: 10.1109/JSEN.2019.2921803. [Google Scholar] [CrossRef]
20. F. C. Ataman and G. B. Akar, “Visible and infrared image fusion using encoder-decoder network,” in 2021 IEEE Int. Conf. Image. Proc. (ICIP), Anchorage, AK, USA, Sep. 2021, pp. 1779–1783. [Google Scholar]
21. K. Wang, L. Zhou, H. Yu, and Z. Wang, “DDRICFuse: An infrared and visible image fusion network based on dual-branch dense residual and infrared compensation,” in 2022 Int. Conf. Artif. Intell. Comput. Info. Technol. (AICIT), Yichang, China, Sep. 2022, pp. 1–5. [Google Scholar]
22. A. Vaswani et al., “Attention is all you need,” Adv. Neural. Info. Proc. Syst., Jun. 2017. doi: 10.48550/arxiv.1706.03762. [Google Scholar] [CrossRef]
23. Y. L. Hu, S. S. Wei, P. Gao, and X. L. Shi, “Automatic detection of transformer respirator based on image processing,” in 2017 CN. Automa. Congress. (CAC), Jinan, China, Oct. 2017, pp. 511–515. [Google Scholar]
24. J. Y. Liang, J. Z. Cao, G. L. Sun, K. Zhang, L. V. Gool and R. D. Timofte, “SwinIR: Image restoration using swin transformer,” in 2021 IEEE/CVF Int. Conf. Comput. Vis. Workshops. (ICCVW), Montreal, BC, Canada, Oct. 2021, pp. 1833–1844. [Google Scholar]
25. Z. S. Wang, Y. L. Chen, W. Y. Shao, H. Li, and L. Zhang, “SwinFuse: A residual swin transformer fusion network for infrared and visible images,” IEEE Trans. Instrum. Meas., vol. 71, pp. 1–12, Jul. 2022. doi: 10.1109/TIM.2022.3216413. [Google Scholar] [CrossRef]
26. S. Ioffe and S. Christian, “Batch normalization: Accelerating deep network training by reducing internal covariate shift,” in Proc. 32nd. Int. Conf. Machine. Learning., Lille, France, Jul. 2015, pp. 448–456. [Google Scholar]
27. C. Szegedy, V. Vanhoucke, S. Ioffe, J. Shlens, and Z. Wojna, “Rethinking the inception architecture for computer vision,” in 2016 IEEE. Conf. Comput. Vis. Pattren. Recognit. (CVPR), Las Vegas, NV, USA, Jun. 2016, pp. 2818–2826. [Google Scholar]
28. C. Szegedy, S. Ioffe, V. Vanhoucke, and A. Alemi, “Inception-v4, inception-ResNet and the impact of residual connections on learning,” in Proc. AAAI. Conf. Artif. Intell., San Francisco, California, USA, Feb. 2017, pp. 4–12. [Google Scholar]
29. S. Xie, R. Girshick, P. Dollar, Z. W. Tu, and K. M. He, “Aggregated residual transformations for deep neural networks,” in Proc. IEEE. Conf. Comput. Vis. Pattren. Recognit., Honolulu, HI, USA, Jul. 2017, pp. 1492–1500. [Google Scholar]
30. S. H. Gao, M. M. Cheng, K. Zhao, X. Y. Zhang, M. H. Yang and P. Torr, “Res2Net: A new multi-scale backbone architecture,” IEEE Trans. Pattern. Analysis. Machine. Intell., vol. 43, no. 2, pp. 652–662, Feb. 2021. doi: 10.1109/TPAMI.2019.2938758 [Google Scholar] [PubMed] [CrossRef]
31. G. Altan, Y. Kutlu, and N. Allahverdi, “Deep learning on computerized analysis of chronic obstructive pulmonary disease,” IEEE J. Biol. Health. Info., vol. 24, no. 5, pp. 1344–1350, May 2020. doi: 10.1109/JBHI.2019.2931395 [Google Scholar] [PubMed] [CrossRef]
32. G. Altan, “DeepOCT: An explainable deep learning architecture to analyze macular edema on OCT images,” Eng Sci. Technol., Int. J., vol. 34, no. 23, pp. 101091, Oct. 2022. doi: 10.1016/j.jestch.2021.101091. [Google Scholar] [CrossRef]
33. H. Li, X. J. Wu, and T. Durrani, “NestFuse: An infrared and visible image fusion architecture based on nest connection and spatial/channel attention models,” IEEE Trans. Instrum. Meas., vol. 69, no. 12, pp. 9645–9656, Dec. 2020. doi: 10.1109/TIM.2020.3005230. [Google Scholar] [CrossRef]
34. L. F. Tang, J. T. Yuan, and J. Y. Ma, “Image fusion in the loop of high-level vision tasks: A semantic-aware real-time infrared and visible image fusion network,” Info. Fusion, vol. 82, no. 10, pp. 28–42, Jun. 2022. doi: 10.1016/j.inffus.2021.12.004. [Google Scholar] [CrossRef]
35. H. Xu, J. Y. Ma, J. J. Jiang, X. J. Guo, and H. B. Ling, “U2Fusion: A unified unsupervised image fusion network,” IEEE Trans. Pattern. Analysis. Machine. Intell., vol. 44, no. 1, pp. 502–518, Jan. 2022. doi: 10.1109/TPAMI.2020.3012548 [Google Scholar] [PubMed] [CrossRef]
36. J. W. Li, J. S. Chen, J. Y. Liu, and H. M. Ma, “Learning a graph neural network with cross modality interaction for image fusion,” in Proc. 31st ACM. Int. Conf. Multime., Ottawa, Canada, Oct. 2023, pp. 4471–4479. [Google Scholar]
37. J. Y. Ma, L. F. Tang, F. Fan, J. Huang, X. G. Mei and Y. Ma, “SwinFusion: Cross-domain long-range learning for general image fusion via swin transformer,” in IEEE/CAA J. Autom. Sinica, vol. 9, no. 7, pp. 1200–1217, Jul. 2022. doi: 10.1109/JAS.2022.105686. [Google Scholar] [CrossRef]
38. W. Tang, F. Z. He, Y. Liu, Y. S. Duan, and T. Z. Si, “DATFuse: Infrared and visible image fusion via dual attention transformer,” IEEE Trans. Circuits Syst. Video Technol., vol. 33, no. 7, pp. 3159–3172, Jul. 2023. doi: 10.1109/TCSVT.2023.3234340. [Google Scholar] [CrossRef]
39. Z. Liu et al., “Perception-aware infrared-visible image fusion for attack-tolerant semantic segmentation,” in Proc. 31st. ACM. Int. Conf. Multim., Ottawa, Canada, Oct. 2023, pp. 3706–3714. [Google Scholar]
40. W. D. Zhao, S. G. Xie, F. Zhao, Y. He, and H. C. Lu, “MetaFusion: Infrared and visible image fusion via meta-feature embedding from object detection,” in 2023 IEEE/CVF Conf. Comput. Vis. Pattern. Recognit. (CVPR), Vancouver, BC, Canada, Jun. 2023, pp. 13955–13965. [Google Scholar]
41. W. Tang, F. Z. He, and Y. Liu, “YDTR: Infrared and visible image fusion via Y-shape dynamic transformer,” IEEE Trans. Multim., vol. 25, pp. 5413–5428, Jul. 2022. doi: 10.1109/tmm.2022.3192661. [Google Scholar] [CrossRef]
Cite This Article
 Copyright © 2024 The Author(s). Published by Tech Science Press.
This work is licensed under a Creative Commons Attribution 4.0 International License , which permits unrestricted use, distribution, and reproduction in any medium, provided the original work is properly cited.
 Downloads
 Citation Tools