
 Submit a Paper
 Propose a Special lssue
 Open Access
ARTICLE

Efficient Route Planning for Real-Time Demand-Responsive Transit
1 Development Department, Changseol Build System, Daegu, 42601, South Korea
2 Division of Software Convergence, Sangmyung University, Seoul, 03016, South Korea
* Corresponding Author: SeongKi Kim. Email:
(This article belongs to the Special Issue: Intelligent Computing Techniques and Their Real Life Applications)
Computers, Materials & Continua 2024, 79(1), 473-492. https://doi.org/10.32604/cmc.2024.048402
Received 06 December 2023; Accepted 11 February 2024; Issue published 25 April 2024
 View Full Text
 Download PDF
Abstract
Demand Responsive Transit (DRT) responds to the dynamic users’ requests without any fixed routes and timetables and determines the stop and the start according to the demands. This study explores the optimization of dynamic vehicle scheduling and real-time route planning in urban public transportation systems, with a focus on bus services. It addresses the limitations of current shared mobility routing algorithms, which are primarily designed for simpler, single origin/destination scenarios, and do not meet the complex demands of bus transit systems. The research introduces an route planning algorithm designed to dynamically accommodate passenger travel needs and enable real-time route modifications. Unlike traditional methods, this algorithm leverages a queue-based, multi-objective heuristic A* approach, offering a solution to the inflexibility and limited coverage of suburban bus routes. Also, this study conducts a comparative analysis of the proposed algorithm with solutions based on Genetic Algorithm (GA) and Ant Colony Optimization Algorithm (ACO), focusing on calculation time, route length, passenger waiting time, boarding time, and detour rate. The findings demonstrate that the proposed algorithm significantly enhances route planning speed, achieving an 80–100-fold increase in efficiency over existing models, thereby supporting the real-time demands of Demand-Responsive Transportation (DRT) systems. The study concludes that this algorithm not only optimizes route planning in bus transit but also presents a scalable solution for improving urban mobility.Keywords
With the recent development of Internet/Internet of Things technology, more tasks can be performed through portable smartphones, and the emergence of shared bicycles, shared taxis, etc., has also brought revolutionary changes to the way people travel. As a result of these personal devices and the shared mobility, smartphones enable various services for public transportation, which include the schedule-checking, the routes-checking of bus, and the confirmation of the passenger numbers. On the other hands, Demand Responsive Transport (DRT, Demand Responsive Transit is a transit service operating in response to calls from passengers or their agents to the operator, who schedules a vehicle to pick up the passengers to transport them to their destinations) has been welcomed by many passengers for its economical, flexible, and environmentally friendly features, and has also greatly changed the way people travel [1,2]. Initially, DRT refers to a transportation service that can change the itinerary route according to traffic demand, which includes dial-a-ride transit, flexible transport services, and non-emergency medical transport [3]. With the diversification of transportation modes, the recent DRT refers to call-and-answer public transport services provided in areas with rare passenger demand. In these areas, regular bus service is generally not considered economically viable, e.g., in rural and peri-urban areas [4]. In other words, DRT public transport changes the route of each trip according to the passenger’s demand, and the route is determined by the passenger’s demand, without using a fixed route or timetable. Therefore, unlike traditional public transportation, a DRT bus can avoid the drawbacks of fixed routes, low flexibility, and low vehicle occupancy rates [5,6]. Moreover, compared with private transportation based on Mobility on demand (MOD, Mobility on demand is an integrated and connected multi-modal network of safe, affordable, and reliable transportation options that are available and accessible to all travelers), a DRT bus exhibits characteristics such as economy, energy efficiency, and environmental friendliness [7]. However, the achievement of these goals requires an efficient route-planning algorithm capable of real-time responsiveness.
DRT buses are different from the private cars or bicycles in the following aspects. First, the routes of DRT buses are undetermined and continuously vary according to user’s demand. Second, every passenger has a specific origin and destination. As passengers board and disembark, the composition of users is constantly changing, which gives DRT buses a notable multi-origin and multi-destination characteristic during transportation [8]. Traditional single-route planning algorithms, such as shortest path algorithms or heuristic search algorithms, are not applicable to DRT buses due to this difference [9,10]. Besides the multi-origin and multi-destination, the routes with excessive turns, and the balance of passengers’ waiting time, travel time, and detour time (the difference between the time through the DRT bus and the time through with the ordinary bus to reach the destination), need to be considered while planning the route for DRT buses. Consequently, this problem becomes complex and challenging to solve by these factors.
Nevertheless, due to the efforts of numerous scholars over the past several decades, various route planning algorithms have been developed for practical use in public transportation, such as those based on Genetic Algorithm (GA) and those based on Ant Colony Optimization (ACO) or Simulated Annealing (SA) [11,12]. However, these algorithms were not designed to solve the real-time bus route planning problems; rather, their primary purpose was to obtain globally optimal or near-optimal solutions. Therefore, these algorithms typically employ iterative processes to optimize results, frequently at the cost of long search times. Because of this reason, it is difficult to apply them for planning the route for the DRT bus. Although a reduced number of iterations can improve search performance, it may result in wrong routes in many cases [1,13]. In other words, using these algorithms frequently fails to strike the balance between real-time responsiveness and efficiency for the DRT system. In practice, DRT route planning typically involves a trade-off between optimal routes and planning time [14].
To address these issues, this study aims to concretize the research question as follows: How can an optimal route for a bus be planned in a complex road network, given that the number and locations of origins and destinations change dynamically? The contributions of this study can be summarized as follows. First, this paper proposes a novel dynamic route planning algorithm that is real-time, efficient, and logically straightforward. Second, this paper compares the proposed algorithm with popular GA-based and ACO-based route planning schemes under equivalent conditions. Third, through experiment data, the high efficiency and superior performance of the proposed real-time dynamic route planning algorithm were demonstrated.
This paper is organized as follows: In Section 2, current problems encountered in the research process of bus route planning algorithms are described in detail, as well as effective solutions proposed by various researchers, and the content is summarized and analyzed. In Section 3, the basic principle and algorithm of the proposed route planning algorithm is introduced. In Section 4, this paper shows the comparison results of multiple route planning algorithms based on the principle of comparison and confirm the effectiveness and superiority of the proposed real-time dynamic route planning algorithm through specific and detailed data. In Section 5, the proposed algorithm is summarized and evaluated based on the evaluation results, and future directions for improvement and research content of the algorithm are mentioned.
Bus route planning algorithms can be improved using algorithms for the Vehicle Routing Problem (VRP, Vehicle Routing Problem is a combinatorial optimization problem of finding a set of routes for a fleet of vehicles that minimizes travel time) and the Traveling Salesman Problem (TSP, Traveling Salesman Problem is the problem of finding the shortest path that visits a set of customers and returns to the first). The TSP is a special case of the VRP, and it has been proven by Gaery and others that the TSP is an NP-hard problem [15]. Consequently, the VRP is also an NP-hard problem [16]. However, in traditional solutions for both the TSP and VRP, the most representative solutions mainly involve metaheuristic algorithms. These metaheuristic algorithms primarily include GA, SA, ACO, and neural network algorithms [2,17,18]. Because of the criticality of the problem, numerous scholars have continuously researched, tested, evaluated, and optimized these algorithms for several decades.
For example, in an article published by Asih et al., they compared GA, ACO, particle swarm optimization, and SA algorithms with two distinct sets of cases to verify their performance. The results indicated that both ACO and SA algorithms consistently found the shortest distances in the two different case scenarios [19]. In another study led by Hosam and Ashraf, they compared the performance of SA algorithms with the GA and ACO algorithms in terms of execution time and shortest distance. Through testing, they found that SA, ACO, and GA have their advantages and disadvantages. SA demonstrated the shortest execution time, but it was not optimal in terms of the shortest distance measurement, where ACO significantly outperformed GA and SA. This demonstrates that ACO, GA, and SA are mainstream algorithms, each exhibiting its strengths in various aspects [20]. Similarly, Valdez et al. considered the ACO algorithm as a widely recognized efficient route optimization algorithm. They compared GA and SA through data, substantiating their viewpoint [21]. In their research, Osaba, Javier, and others analyzed the advantages and disadvantages of SA, tabu search, and variable neighborhood search in three different scenarios within the Basque region of Spain. According to their conclusion, SA provides optimal solutions for solving the TSP or VRP [22]. However, in a study by Gong and Fu, they focused on the routing problem of vehicles transporting perishable goods, developing a novel solution based on the ACO algorithm and considering factors such as vehicle and transportation costs and shelf-life losses. They termed this algorithm ABC-ACO. Their published research results showed that their algorithm, while meeting the requirements, improved performance by 20.8% and reduced costs by 15.9%, making it a representative successful research case [23]. This is the fundamental reason why this paper chose the ACO algorithm as a comparison object.
After a detailed analysis of the characteristics of the DRT bus route planning problem, this study focuses on multiple origins, multiple destinations, dynamic changes in starting/ending points, and the need to balance user riding time and waiting time as research priorities. This study proposes a novel real-time dynamic route planning algorithm that addresses these issues efficiently while considering user experience. By designing comparative experiments, this paper scientifically compared and analyzed data with widely used GA and SA, thereby demonstrating the effectiveness of the proposed real-time dynamic route planning algorithm.
3 Design and Principles of Algorithm
In this section, a real-time dynamic route planning algorithm suitable for DRT buses is proposed, and the principle of the algorithm is explained in detail. The algorithm is divided into three parts. First, bus stops are mapped based on road network nodes. Second, user-riding demands are dynamically managed through a simple queue design. Finally, starting from the current location of the DRT bus, the algorithm employs a real-time metaheuristic route search based on a multi-objective approach for the target bus stops contained in the queue, ultimately achieving dynamic route planning. The algorithm is illustrated in Fig. 1.

Figure 1: Flowchart of real-time dynamic route planning algorithm
The proposed dynamic route planning algorithm mainly consists of the following four steps:
1. Generate a target queue and place all received user starting stations in the target queue.
2. Use the multi-objective A* algorithm to search for routes in the stations within the target queue.
A) Obtain the current latitude and longitude of the bus to determine its road link node.
B) Calculate the heuristic function
C) Obtain the bus stop with the smallest heuristic value in the target queue as the next stop for the bus and generate the route.
D) Repeat steps A–C to generate the complete bus route between the bus stops.
3. After the bus arrives at the user’s bus stop, remove the user’s starting bus stop from the target queue and add the corresponding destination stop to the target queue collection.
4. Repeat steps 2 and 3 to generate/update routes in real-time.
In the above steps, note that all processing occurs during the bus’s journey. Therefore, the routes generated by the algorithm constantly change based on the received user riding demands. Whenever a new user riding request is received, the algorithm performs a real-time calculation to update the route, ensuring that the bus always travels according to the latest and most optimal route promptly.
3.2 Mapping of Bus Stops and Generation of Weighted Network
The process of mapping bus stops in the road network is necessary before route finding can begin. According to the raw data obtained from the Korean standard node link database, a road in the real world is saved in a bidirectional and segmented manner in the computer database. In other words, a road in the real world is divided into multiple “links” in the positive and negative directions and “nodes” at both ends of the links in the computer world. In addition, bus stops are located adjacent to roads, but their positions are not exactly on the road link nodes. Therefore, the algorithm needs to map the bus stop locations in the road network before effectively planning the route.
In the process of mapping bus stops to the existing road network, as illustrated in Fig. 2, suppose nodes

Figure 2: Schematic of bus station location and road link
This method ensures that a bus stop is accurately mapped to the correct road link, allowing for a more precise representation of the road network structure and ultimately contributing to the efficiency of the proposed dynamic route planning algorithm.
Once the bus stops have been mapped to the road network, the next step is to generate a weighted network for route planning. The weights assigned to the network include travel time, distance, and other factors that may influence route selection, such as traffic conditions or road restrictions. By incorporating these weights into the network, the proposed algorithm can search for the most efficient and optimal routes based on various criteria. In this paper, this study uses the shortest travel time
As a result of the mapping of bus stops and the generation of a weighted network, a simple digital road connectivity network with the shortest travel time as weights is generated. Subsequent steps will then perform route planning based on the target queue using the weighted network. In summary, mapping bus stops to the road network and creating a weighted network are fundamental steps in constructing the proposed real-time dynamic route planning algorithm. These steps enable the algorithm to plan routes accurately based on the actual road network structure and various factors influencing route selection.
3.3 Multi-Objective A* Algorithm Based on Target Queue
The multi-objective A* algorithm based on the target queue is the core component of the proposed real-time dynamic route planning algorithm. It is not a single process but rather a treatment throughout the implementation of the route planning algorithm. In particular, steps 1 and 3 involve dynamic modification of the target queue to meet dynamic user boarding demands.
For example, in the road network shown in Fig. 3, there are four user boarding requests:

Figure 3: Schematic of user’s boarding action and the processing of
1. Add
2. Remove
After
In the real-time dynamic route planning algorithm, besides the real-time and dynamic processing of the target queue (
In this study, considering the characteristics of multiple target bus stops in the target queue, the multi-objective A* algorithm performs the following calculation processing to determine the driving order of bus stops. First, according to the bus stops saved in
As shown in Fig. 4, suppose the current bus position is at

Figure 4: Computing the minimum estimated cost

Figure 5: Overview of the route search process. The bus advances one step, and the algorithm searches for a road node
3.4 Heuristic Function
Because the heuristic function used by the original A* algorithm calculates the distance from the current node to the target node as the estimated cost [26], as shown in Fig. 6 below, based on the Manhattan distance calculation [27], there are various forms of actual routes between the two points A and B, and their Manhattan distances are equal. However, the blue route is the least practical option for the bus due to its excessive turns, which can cause complexity in bus travel, waste of energy, and confusion for passengers, among other issues. In this paper, this study proposes a solution to this problem by modifying the heuristic function

Figure 6: Multiple routes with the same Manhattan distance between
The worst-case scenario for turns is an angle of 180°, i.e., a U-turn is required. In the case of a U-turn, the vehicle returns along the original route, and the estimated cost function becomes twice the original distance. The function

Figure 7: The trend chart of the function
The time

Figure 8: Route changes before and after using the turn weight function. The route generated by the general A* algorithm (left), and the route generated after using the turn weight (right)
To objectively evaluate the proposed real-time dynamic route planning algorithm, this study designed experiments based on the single-variable testing principle according to the requirements of the used scenarios. This study defined the tested scenarios as mixed scenarios. As the name suggests, this scenario includes users who have made reservations to use the vehicle in advance, as well as users who appear during the movement of the vehicle and issue real-time ride requests. In addition to the simulation test, this study also conducted a three-month real test of students riding the shuttle bus of Keimyung University in South Korea from November 2021 to February 2022. This study used real student travel data.
In this paper, this study selects the ride requests of 40 students as the test source. This study uses the ride requests of the first 20 students as reservation users, and the ride requests of the last 20 students are randomly issued after the vehicle operation starts. In this way, the data of 40 students can be used to not only test the algorithm’s response to the reservation scenario but also to test the algorithm’s processing capabilities during the real-time operation of the bus. Based on the ride requests of 40 students, this study provides the latitude and longitude distribution map as shown in Fig. 9 below. The red marked point in the figure can be regarded as the current location of the students, and the blue marked point is the destination.

Figure 9: The distribution of the latitude and longitude coordinates of the starting and ending bus stations in the user’s ride request. The longitude coordinates in the figure are east longitude, and the latitude coordinates are north latitude
For the comparison object and evaluation standard of the algorithm, researchers frequently use different test standards. In their study, Lu et al. mainly focused on the travel distance in the tested items [28]. In their research, Yoon et al. positioned the test items in terms of service rate, average travel time, average detour time, average walking time, and calculation time [29]. The research of Uchimurat et al. is mainly based on travel distance and time [30]. Referring to the experimental design of several papers on similar topics, this study decided to start with five aspects: The length and time of the route generated by the algorithm, the average ride time of users, the average detour time, the average detour rate of the route, and the time cost of calculating the route. The route length and route time are mainly key indicators used to evaluate whether the route generated by the algorithm is economical. To transport the same number of passengers, a shorter route can consume less fuel, which better reflects the economy and practicality of the route planned by the algorithm. The average ride time of users, the average detour time, and the average detour rate of the route are related to the user experience. The average ride time of users is directly related to whether the user can accept the results of the algorithm calculation. If it is too long, the travel time must be unacceptable to users. The average detour time and the average detour rate of the route represent the fit between the overall route of the DRT bus and the route required by the user, which can simultaneously show the economy of the route and the acceptability of the user, it is Composite indicators.
Combined with the description in the second section, this study selected route planning algorithms based on GA and ACO as the comparison objects. Through an objective comparison and analysis of the algorithm on test data, the proposed algorithm can be accurately evaluated. The algorithm calculation environment of this study was conducted in the Windows 10 Edu x64 version environment, with hardware consisting of an Intel Core i7-9700K CPU, 16 GB memory, and an NVIDIA RTX2080Ti graphics card.
As mentioned earlier, this study chose three sets of travel data from 20 students each, out of approximately 300 students’ travel data collected over three months, and organized the data according to travel time to satisfy the three test scenarios. As the proposed real-time dynamic route planning algorithm is based on the multi-objective A* algorithm, this paper referred to the algorithms as “MO A*,” “GA,” and “ACO” for ease of comparison in the experimental data.
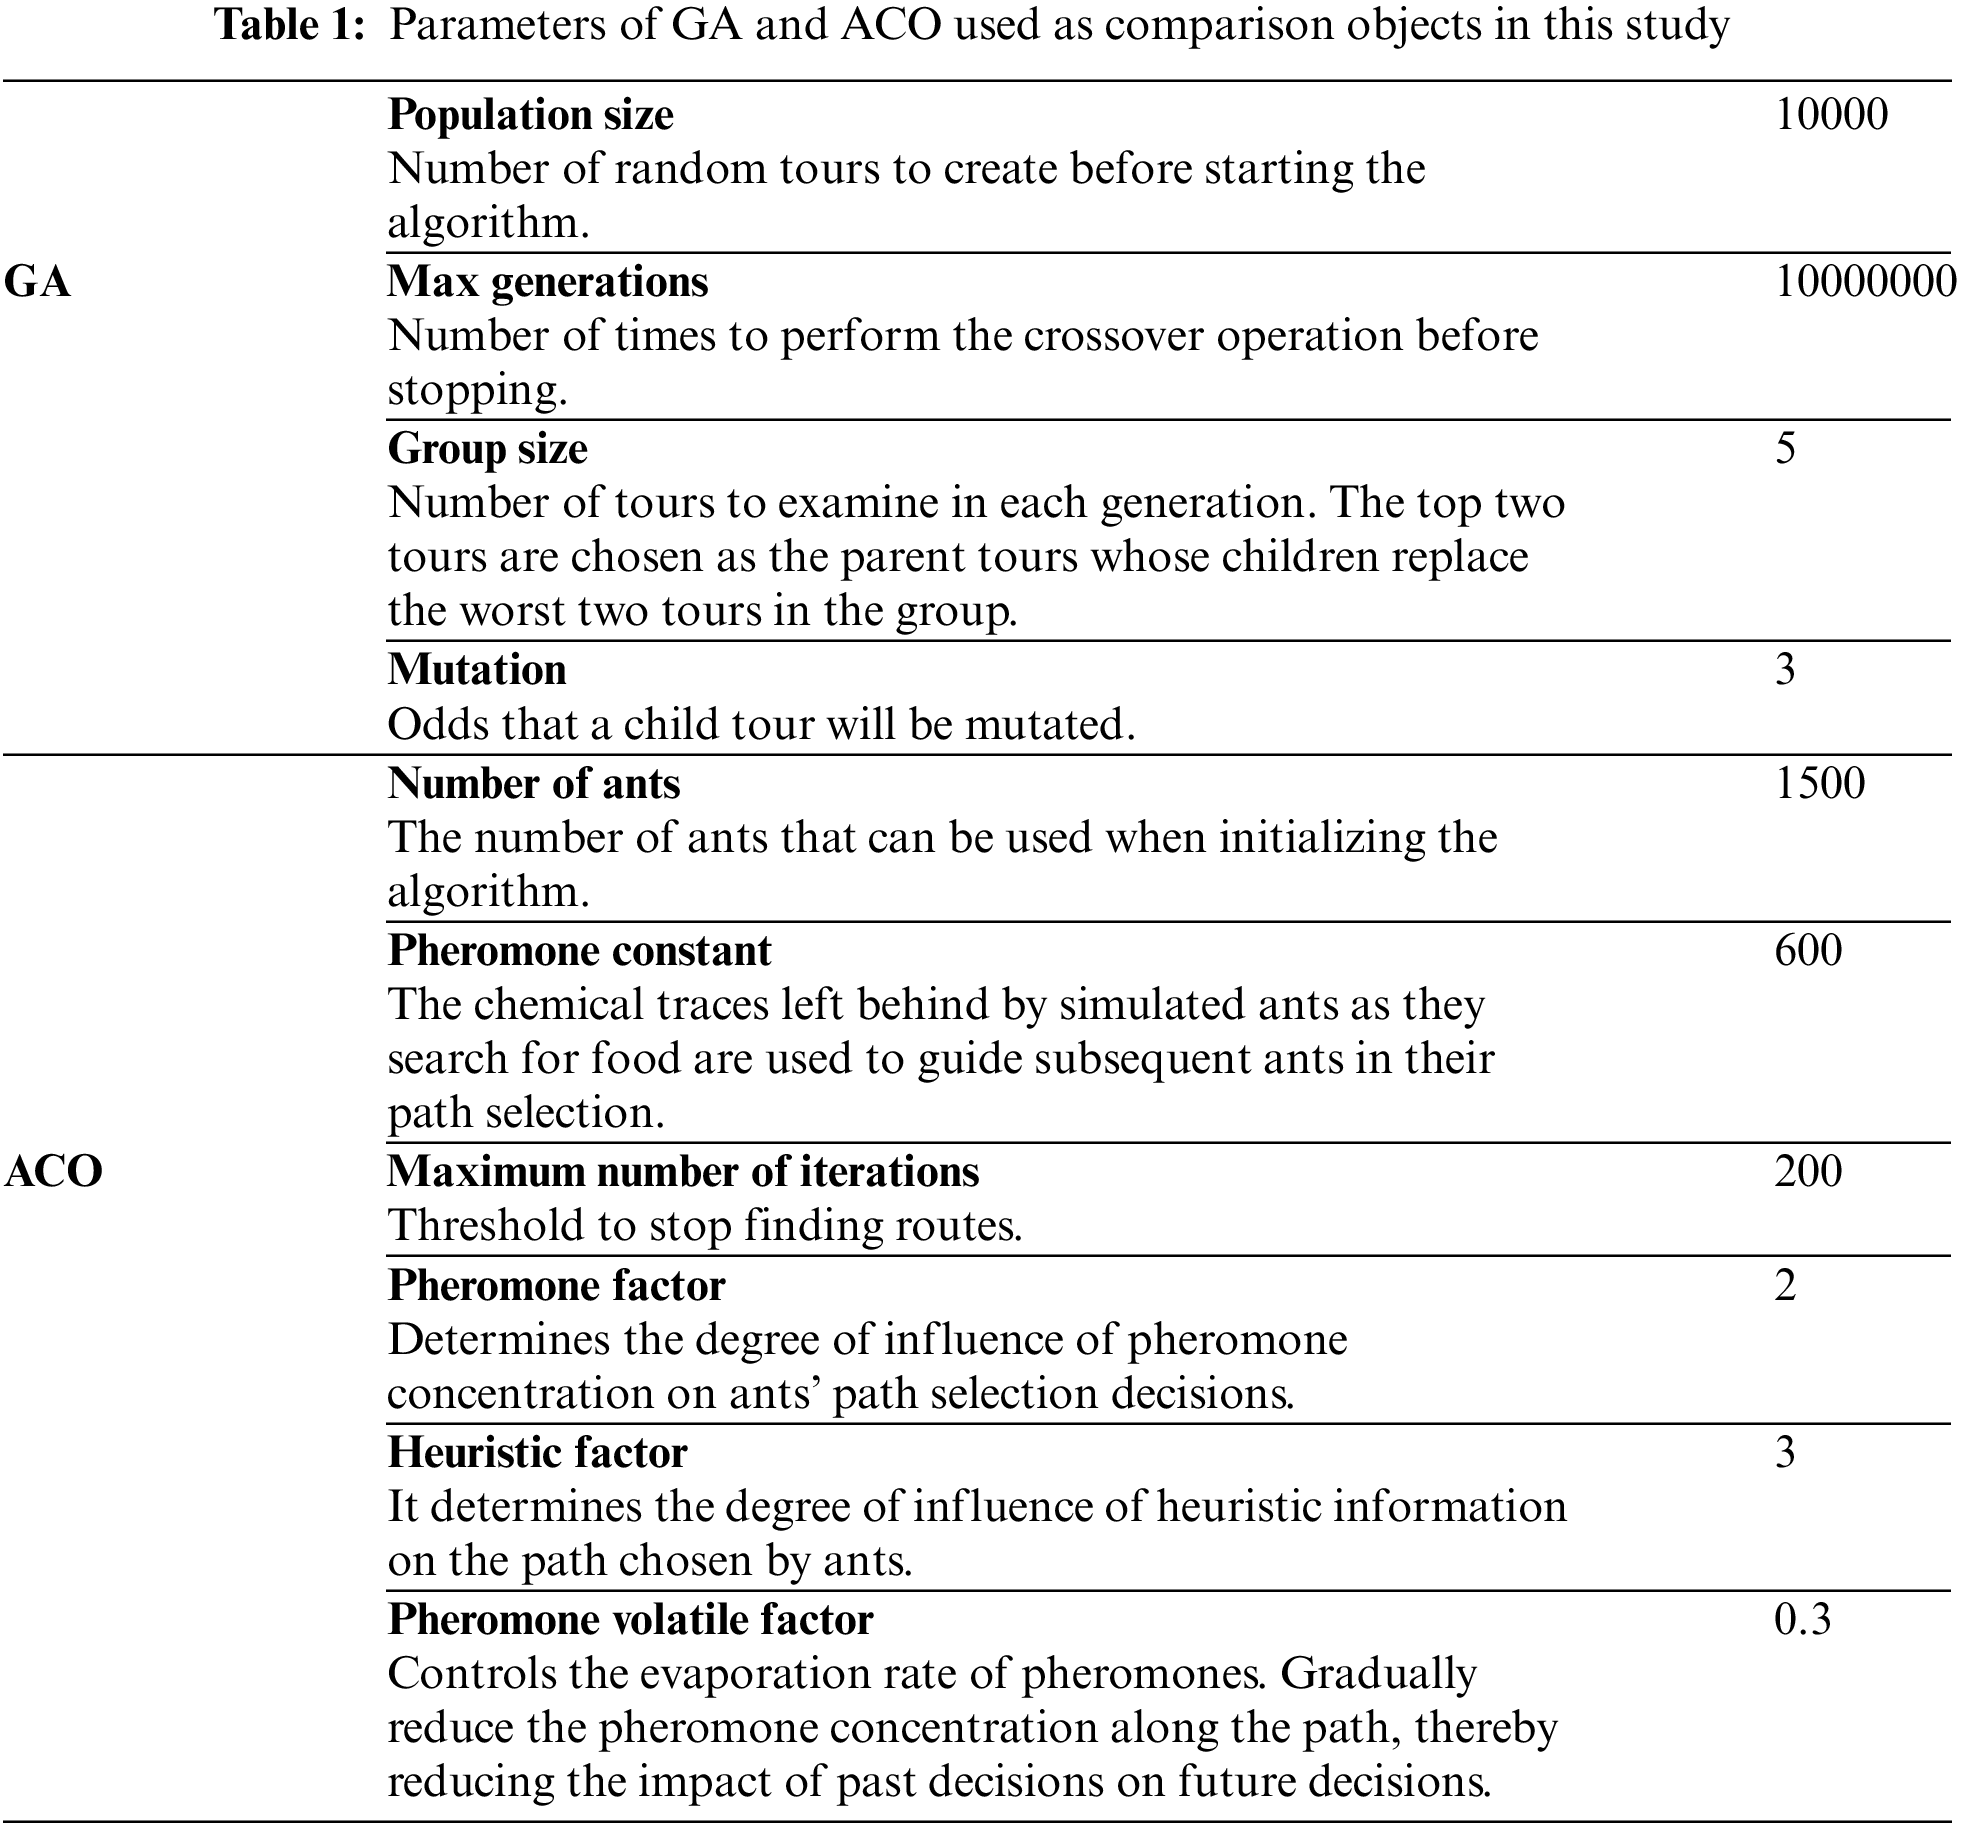
For the GA and ACO used as comparative objects, this study directly implemented the GA by referring to the research on DRT bus planning by Jin et al. [31]. In terms of parameter settings, this study referred to several papers on similar topics, including those by Tamseh and others, and Li Min and others [32,33]. Ultimately, this study conducted tests and comparisons using parameters such as population size, number of generations, crossover rate, and mutation rate, as shown in Table 1. Similarly, for the ACO algorithm, this study referred to research on ACO for bus route planning in urban bus networks by Wei and others, and research on route planning for mobile robots by Zhang and others [13,34]. Based on the basic principles of the algorithm, this study implemented the code and used parameter information about the ACO algorithm for algorithm comparison in this study, as shown in Table 1.
During the testing process, since the purpose of this study is to propose a route planning algorithm that can satisfy DRT services in real time, the dynamic and real-time nature of the algorithm is crucial. Consequently, in the tests in mixed scenarios, this study primarily analyzed and evaluated the computation results within 10 s for each algorithm.
4.1 Comparison of Test Results
In the mixed scenario, this study divided the boarding data of 40 users into two parts: One part accounts for users who made reservations in advance, and the other part for users of boarding requests were received in real-time after the DRT bus departs. In such a test scenario, first, compare the total distance and time of routes planned by different algorithms. As shown in Fig. 10, the routes planned by MO A* and ACO algorithms show good performance in terms of travel time and total distance. In particular, the MO A* algorithm proposed in this study shows its advantages over the other two algorithms, this also indicates that the route planned by the GA algorithm may not be optimal (see the following text for detailed analysis content). Although the route planned by the MO A* algorithm is the “shortest route”, whether it is an “optimized route” needs to be evaluated by comprehensively considering the user’s average travel time, average detour rate, and other criteria.

Figure 10: Overview of length and travel time of routes planned by the three algorithms
In terms of specific data, as depicted in Fig. 10, when
In terms of passenger user experience, as shown in Fig. 11, in the case of 40 passengers taking DRT buses, the average travel time of users using the GA is incomparable with that of the ACO and MO A* algorithms. The per capita travel time of the GA is 2600.149 s (approximately 43.34 min), and the GA cannot fully iteratively calculate within 10 s as mentioned earlier. The average travel time of users with the MO A* algorithm is 1251.677 s (approximately 20.85 min), and the average travel time of users with the ACO algorithm is 1101.72 s (approximately 18.362 min), with a difference of approximately 2.5 min. Such differences result in a completely different user experience for passengers because the per-capita travel time of the GA algorithm is 2.08 times

Figure 11: Average travel time of routes planned by the three algorithms
In terms of the average detour rate of users, the ACO and MO A* algorithms have maintained consistently low detour rates of 3.17 and 2.97, respectively, showing a steady linear upward growth trend. In contrast, the GA has the characteristics of a disorderly rise. To explain in particular, the definition of the user’s average detour rate is defined as the ratio of the actual moving route distance of users taking mobility DRT to the moving route distance of users taking ordinary DRT buses to their destinations, that is:
From Fig. 12, when

Figure 12: The average detour rate of the routes planned by the three algorithms
In terms of the calculation performance of route planning, as depicted in Figs. 13 and 14, the proposed MO A* algorithm is still the fastest. In the case of 40 passengers, the total processing time is 0.129 s, and the average processing time for 40 calculations is 0.06318 s. In contrast to the ACO and GA algorithms, when the ACO algorithm is completed by 40 passengers, the minimum calculation time is 9.268 s and the average processing time for 40 calculations is 5.27655 s, whereas the GA algorithm is 7.299 and 6.20445 s, respectively. If the average processing time of 40 times of the ACO algorithm is used as a benchmark, the processing speed of the MO A* algorithm is 82.52 times

Figure 13: The time spent on the calculation of the three algorithms

Figure 14: The time spent on the calculation of the MO A* algorithm
In addition, the algorithm goal is not only to be able to dynamically handle the user’s request to get on and off the vehicle, but also to meet the requirements of real-time calculation and real-time response. However, judging from the above measurement results, ACO and GA are unable to meet the immediacy of Mobility DRT bus route planning. In contrast, the algorithm proposed in this study can process all data within 0.2 s, fully satisfying the real-time requirements for Mobility DRT bus route planning. Therefore, considering the evaluation criteria from multiple perspectives, the proposed MO A* algorithm can sufficiently meet the needs of DRT bus route planning.
Finally, since the GA algorithm is at a disadvantage in each calculation result, it is necessary for us to analyze the reasons. As mentioned before, this may be because both the ACO algorithm and the GA algorithm are designed to find the optimal solution. In theory, the results generated by these algorithms should improve with the passage of computing time [37,38]; However, in this study, to pursue the real-time response characteristics of the algorithm, the maximum calculation time was set to 10 s. In other words, the main reason why the GA algorithm’s calculation results are at a disadvantage is most likely that the GA algorithm did not find the global optimal solution within the limited calculation time (10 s).
To confirm the aforementioned reasons, this study presents a trend chart of the algorithm results over time for 20 user transportation demands, as illustrated in Fig. 15. From the figure, the GA exhibits a linear downward trend within 10 s, with a slow decline rate and occasional periods of near-horizontal lines, such as between 3.0 and 3.4 s. This indicates that the GA has become trapped in redundant iterative calculations near a local optimal solution. Furthermore, a noticeable change can be observed in the ACO algorithm, which initially presents an almost linear trend but exhibits a rapid decline between approximately 0.3 and 0.5 s; this phenomenon is related to the characteristics of the ACO algorithm. The ACO algorithm searches for optimal routes by releasing pheromones on each path segment. In the early stages of the algorithm, insufficient pheromone release by ants on each path segment results in a slower initial calculation speed [39,40]. As pheromones accumulate on each segment, the convergence speed of the algorithm increases, resulting in a nearly linear downward trend that continually approaches the optimal route. The optimal route is first found after 1.983 s of algorithm execution and is confirmed through repeated iterations, ultimately stabilizing at 2.6 s when no further route changes occur.

Figure 15: The changing trend of the total time for each algorithm to find the route within 10s
To summarize, the proposed real-time dynamic route planning algorithm is always satisfactory in mixed scenarios. Although its planned route is not always the “shortest route,” the distance difference within 3–5 km is acceptable, and it can exhibit excellent performance in other user experience aspects and provide a better user experience. In addition, the performance of the proposed algorithm is fast, 82.5 and 97.2 times faster than the ACO and GA algorithms and it can complete route planning for bus users within 1 s or even 0.2 s. Moreover, the algorithm shows stability of calculation in test scenarios, which is incomparable to GA- and ACO-based route planning algorithms. Based on this result, this study also believes that the MO A* algorithm will be able to handle it perfectly if it is a full reservation scenario or a full real-time request scenario.
Recently, on-demand mobility services have been developed, and it is expected that the demand for the services will further increase with the personal requirements in the future. The on-demand mobility service based on DRT buses will be more widely used due to its more economical and affordable characteristics. For DRT bus services to operate stably and efficiently, it is critical to reasonably allocate and dispatch vehicles, and to conduct real-time route planning according to passenger’s requirements.
In this study, the operating characteristics of DRT buses and the algorithm’s requirements can be summarized as follows: First, it needs to be able to update routes in real time; Second, it needs to be able to dynamically respond to users’ ride requests. Based on the characteristics of DRT buses, this study designed an algorithm (Real-time Dynamic Route Planning Algorithm) and explained its design in detail. Also, this study verified the suggested algorithm based on the real user travel data. To compare its results, a comparative test was conducted with the existing solutions based on the ACO algorithm and the GA algorithm, and both the total length and the generation time of the route, as well as the average travel time and average detour rate of users, were evaluated. The suggested algorithm can implement route planning and vehicle scheduling within 0.2 s. Based on the special structure this study proposed, the efficiency of route planning is improved by 82.5 times and 97.2 times compared with the ACO algorithm and GA algorithm, respectively. It can complete dynamic route planning for 40 passengers in 0.2 s. This calculation performance fully meets the real-time calculation requirements of on-demand DRT buses.
However, the suggested algorithm can be improved further. First, the working principle of the proposed algorithm is mainly based on the queue-based multi-objective A* algorithm. Therefore, with the increase in the number of passengers, the algorithm has to be rerun to plan a new route. This can result in heavy computation and increase more memory consumption when a new user takes public transportation. Second, in the actual operation of the bus, if the bus receives a passenger request from a bus stop less than 100 m ahead, the bus may be driving in the central lane because the bus driver has not made corresponding preparations in advance. Changing lanes to the bus stop can be difficult and dangerous, which may result in the user’s boarding request being ignored or assigned to the next bus. This results in a certain degree of resource waste and a negative user experience, as users may feel ignored when they see the bus drive away without stopping even though they sent a boarding request before the bus arrived. Third, although the algorithm can handle regional-level DRT bus operations, for broader practical operations, it still needs to expand the road network and add multiple DRT buses for joint operation testing to improve the algorithm to enhance the robustness of the algorithm. Besides the issues above, we plan to operate the algorithm in a wider urban transportation network and also plan to apply the algorithm to games in future work.
Acknowledgement: Not applicable.
Funding Statement: Not applicable.
Author Contributions: The authors confirm contribution to the paper as follows: Study concept and design: Hongle Li, SeongKi Kim; Algorithm development and testing: Hongle Li; Manuscript supervision: SeongKi Kim; All authors reviewed the results and approved the final version of the manuscript.
Availability of Data and Materials: Road information data comes from the national standard node link database of the Korean National Transportation Information Center. The source data of the test comes from the travel records of students participating in the test. Under the premise of academic research, the data set can be obtained by contacting the corresponding author (skkim9226@gmail.com).
Conflicts of Interest: The authors declare that they have no conflicts of interest to report regarding the present study.
References
1. B. Maas, “Literature review of mobility as a service,” Sustainability, vol. 14, no. 14, pp. 8962, 2022. doi: 10.3390/su14148962. [Google Scholar] [CrossRef]
2. R. K. Patel, R. Etminani-Ghasrodashti, S. Kermanshachi, J. M. Rosenberger, and A. Foss, “Mobility-on-demand (MOD) projects: A study of the best practices adopted in United States,” Transp. Res. Interdiscip. Perspect., vol. 14, no. 1, pp. 100601, 2022. doi: 10.1016/j.trip.2022.100601. [Google Scholar] [CrossRef]
3. F. Cavallaro and S. Nocera, “Flexible-route integrated passenger-freight transport in rural areas,” Transp. Res. Part A: Policy and Pract., vol. 169, no. 1, pp. 103604, 2023. doi: 10.1016/j.tra.2023.103604. [Google Scholar] [CrossRef]
4. “Demand-responsive transport,” Wikipedia, 2023. Accessed: May 31, 2023. [Online]. Available: https://en.wikipedia.org/w/index.php?title=Demand-responsive_transport&oldid=1156331707 [Google Scholar]
5. L. Sörensen, A. Bossert, J. P. Jokinen, and J. Schlüter, “How much flexibility does rural public transport need?—Implications from a fully flexible DRT system,” Transp. Policy, vol. 100, no. 8, pp. 5–20, 2021. doi: 10.1016/j.tranpol.2020.09.005. [Google Scholar] [CrossRef]
6. B. Zhang, Z. Zhong, X. Zhou, Y. Qu, and F. Li, “Optimization model and solution algorithm for rural customized bus route operation under multiple constraints,” Sustainability, vol. 15, no. 5, pp. 3883, 2023. doi: 10.3390/su15053883. [Google Scholar] [CrossRef]
7. S. Dytckov, “Modelling and simulating demand-responsive transport,” Malmö university, Malmö, Sweden, 2023. [Google Scholar]
8. A. Huang, Z. Dou, L. Qi, and L. Wang, “Flexible route optimization for demand-responsive public transit service,” J. Transp. Eng., Part A: Syst., vol. 146, no. 12, pp. 04020132, 2020. doi: 10.1061/JTEPBS.0000448. [Google Scholar] [CrossRef]
9. S. Cao, “An optimal round-trip route planning method for tourism based on improved genetic algorithm,” Computat. Intell. Neurosci., vol. 2022, no. 2, pp. 1–8, 2022. doi: 10.1155/2022/7665874 [Google Scholar] [PubMed] [CrossRef]
10. O. Dib, L. Moalic, M. A. Manier, and A. Caminada, “An advanced GA-VNS combination for multicriteria route planning in public transit networks,” Expert Syst. Appl., vol. 72, no. 1, pp. 67–82, 2017. doi: 10.1016/j.eswa.2016.12.009. [Google Scholar] [CrossRef]
11. A. Charisis, C. Iliopoulou, and K. Kepaptsoglou, “DRT route design for the first/last mile problem: Model and application to Athens,” Public Transp., vol. 10, no. 3, pp. 499–527, 2018. doi: 10.1007/s12469-018-0188-0. [Google Scholar] [CrossRef]
12. P. Li, L. Jiang, S. Zhang, and X. Jiang, “Demand response transit scheduling research based on urban and rural transportation station optimization,” Sustainability, vol. 14, no. 20, pp. 13328, 2022. doi: 10.3390/su142013328. [Google Scholar] [CrossRef]
13. Y. Wei, N. Jiang, Z. Li, D. Zheng, M. Chen and M. Zhang, “An improved ant colony algorithm for urban bus network optimization based on existing bus routes,” ISPRS Int. J. Geo-Inf., vol. 11, no. 5, pp. 317, 2022. doi: 10.3390/ijgi11050317. [Google Scholar] [CrossRef]
14. M. E. Bruni, F. Guerriero, and P. Beraldi, “Designing robust routes for demand-responsive transport systems,” Transp. Res. Part E: Logist. Transp. Rev., vol. 70, no. 4, pp. 1–16, 2014. doi: 10.1016/j.tre.2014.06.002. [Google Scholar] [CrossRef]
15. D. Wang, J. Jiang, R. Ma, and G. Shen, “Research on hybrid real-time picking routing optimization based on multiple picking stations,” Math. Probl. Eng., vol. 2022, no. 6, pp. 1–15, 2022. doi: 10.1155/2022/5510749. [Google Scholar] [CrossRef]
16. C. Zhu, M. Liu, and C. Wu, “Review of vehicle routing problem in supply chain,” Comput. Integr. Manuf. Syst., vol. 7, no. 11, pp. 1–6, 2001. [Google Scholar]
17. C. Ren, “Applying genetic algorithm for capacitated vehicle routing problem,” in 2nd Int. Conf. Electron. & Mech. Eng. Inf. Technol., Amsterdam, North Holland, Netherlands, 2012, pp. 519–522. [Google Scholar]
18. W. F. Tan, L. S. Lee, Z. Abdul Majid, and H. V. Seow, “Ant colony optimization for capacitated vehicle routing problem,” J. Comput. Sci., vol. 8, no. 6, pp. 846–852, 2012. doi: 10.3844/jcssp.2012.846.852. [Google Scholar] [CrossRef]
19. A. M. S. Asih, B. M. Sopha, and G. Kriptaniadewa, “Comparison study of metaheuristics: Empirical application of delivery problems,” Int. J. Eng. Bus. Manage., vol. 9, 2017. doi: 10.1177/1847979017743603. [Google Scholar] [CrossRef]
20. H. Mukhairez and A. Maghari, “Performance comparison of simulated annealing, GA and ACO applied to TSP,” Int. J. Intell. Comput. Res., vol. 6, no. 4, pp. 647–654, 2015. doi: 10.20533/ijicr.2042.4655.2015.0080. [Google Scholar] [CrossRef]
21. F. Valdez, F. Moreno, and P. Melin, “A comparison of ACO, GA and SA for solving the TSP problem,” in Hybrid Intelligent Systems in Control, Pattern Recognition and Medicine, Cham, Switzerland: Springer Nature Switzerland AG, 2020, vol. 827,pp. 181–189. [Google Scholar]
22. E. Osaba et al., “Solving the open-path asymmetric green traveling salesman problem in a realistic urban environment,” in Intell. Distrib. Comput. XII, 2018, pp. 181–191. doi: 10.1007/978-3-319-99626-4. [Google Scholar] [CrossRef]
23. W. Gong and Z. Fu, “ABC-ACO for perishable food vehicle routing problem with time windows,” in 2010 Int. Conf. Comput. Inf. Sci., Chengdu, China, 2010, pp. 1261–1264. [Google Scholar]
24. S. Aine, S. Swaminathan, V. Narayanan, V. Hwang, M. Likhachev and A. Multi-Heuristic, “Multi-Heuristic A*,” The Int. J. Robot. Res., vol. 35, no. 1–3, pp. 224–243, 2016. doi: 10.1177/0278364915594029. [Google Scholar] [CrossRef]
25. F. Islam, V. Narayanan, and M. Likhachev, “Dynamic multi-heuristic A*,” in 2015 IEEE Int. Conf. Robot. Autom. (ICRA), Seattle, WA, USA, 2015, pp. 2376–2382. [Google Scholar]
26. J. Zhang, J. Wu, X. Shen, and Y. Li, “Autonomous land vehicle path planning algorithm based on improved heuristic function of A-Star,” Int. J. Adv. Robot. Syst., vol. 18, no. 5, 2021. doi: 10.1177/17298814211042730. [Google Scholar] [CrossRef]
27. “Taxicab Geometry,” Wikipedia, 2023. Accessed: May 31, 2023. [Online]. Available: https://en.wikipedia.org/w/index.php?title=Taxicab_geometry&oldid=1157383063 [Google Scholar]
28. Y. Lu, Y. Yang, and F. Lv, “Optimal vehicle routing problem based on fuzzy clustering analysis,” J. Jilin Univ. (Eng. Technol. Ed.), vol. 36, no. 2, pp. 147–151, 2006. [Google Scholar]
29. G. Yoon, J. Y. J. Chow, and S. Rath, “A simulation sandbox to compare fixed-route, semi-flexible-transit, and on-demand microtransit system designs,” KSCE J. Civ. Eng., vol. 26, no. 7, pp. 3043–3062, 2022. doi: 10.1007/s12205-022-0995-3. [Google Scholar] [CrossRef]
30. K. Uchimura, R. Wakabayashu, and S. Sakai, “Real-time scheduling on dial-a-ride vehicle service,” Trans. Inst. Syst., Control Inf. Eng., vol. 15, no. 8, pp. 413–421, 2002. [Google Scholar]
31. W. Jin, X. Guo, and J. Gong, “Based on elitist selection genetic algorithm for demand responsive transit planning,” Highw. Eng., vol. 45, no. 2, pp. 44–49, 2020. [Google Scholar]
32. A. A. Tamseh, A. Osama, M. Hussain, and A. Alsobky, “Multi-objective optimization for BRT routes using genetic algorithm: New cairo case study,” J. Southwest Jiaotong Univ., vol. 58, no. 1, 2023. doi: 10.35741/issn.0258-2724.58.1.60. [Google Scholar] [CrossRef]
33. M. Li, M. Huang, Z. Cheng, and J. Zhou, “Application of genetic algorithm in path planning,” Computer Systems and Applications, vol. 29, no. 8, pp. 255–260, 2020. [Google Scholar]
34. S. Zhang, J. Pu, Y. Si, and L. Sun, “Survey on application of ant colony algorithm in path planning of mobile robot,” Comput. Eng. Appl., vol. 56, no. 8, pp. 10–19, 2020. [Google Scholar]
35. A. M. Aibinu, H. B. Salau, N. A. Rahman, M. N. Nwohu, and C. M. Akachukwu, “A novel clustering based genetic algorithm for route optimization,” Eng. Sci. Technol. Int. J., vol. 19, no. 4, pp. 2022–2034, 2016. doi: 10.1016/j.jestch.2016.08.003. [Google Scholar] [CrossRef]
36. L. Wu, X. D. Huang, J. G. Cui, C. Liu, and W. S. Xiao, “Modified adaptive ant colony optimization algorithm and its application for solving path planning of mobile robot,” Expert Syst. Appl., vol. 215, no. 23, pp. 119410, 2023. doi: 10.1016/j.eswa.2022.119410. [Google Scholar] [CrossRef]
37. S. N. Sivanandam and S. N. Deepa, Introduction to Genetic Algorithms. Berlin, Germany: Springer, 2008, pp. 15–37. [Google Scholar]
38. Y. B. Li, H. Soleimani, and M. Zohal, “An improved ant colony optimization algorithm for the multi-depot green vehicle routing problem with multiple objectives,” J. Clean. Prod., vol. 227, no. 2, pp. 1161–1172, 2019. doi: 10.1016/j.jclepro.2019.03.185. [Google Scholar] [CrossRef]
39. B. Zhang, X. Sun, L. Gao, and L. Yang, “Endmember extraction of hyperspectral remote sensing images based on the ant colony optimization (ACO) algorithm,” IEEE Trans. Geosci. Remote Sens., vol. 49, no. 7, pp. 2635–2646, 2011. doi: 10.1109/TGRS.2011.2108305. [Google Scholar] [CrossRef]
40. S. Zhang, J. Pu, and Y. Si, “An adaptive improved ant colony system based on population information entropy for path planning of mobile robot,” IEEE Access, vol. 9, pp. 24933–24945, 2021. doi: 10.1109/ACCESS.2021.3056651. [Google Scholar] [CrossRef]
Cite This Article
 Copyright © 2024 The Author(s). Published by Tech Science Press.
This work is licensed under a Creative Commons Attribution 4.0 International License , which permits unrestricted use, distribution, and reproduction in any medium, provided the original work is properly cited.
 Downloads
 Citation Tools