
 Submit a Paper
 Propose a Special lssue
 Open Access
ARTICLE

A DDoS Identification Method for Unbalanced Data CVWGG
1 College of Computer and Control Engineering, Qiqihar University, Qiqihar, 161006, China
2 Heilongjiang Key Laboratory of Big Data Network Security Detection and Analysis, Qiqihar University, Qiqihar, 161006, China
* Corresponding Author: Haizhen Wang. Email:
Computers, Materials & Continua 2024, 81(3), 3825-3851. https://doi.org/10.32604/cmc.2024.055497
Received 28 June 2024; Accepted 08 October 2024; Issue published 19 December 2024
 View Full Text
 Download PDF
Abstract
As the popularity and dependence on the Internet increase, DDoS (distributed denial of service) attacks seriously threaten network security. By accurately distinguishing between different types of DDoS attacks, targeted defense strategies can be formulated, significantly improving network protection efficiency. DDoS attacks usually manifest as an abnormal increase in network traffic, and their diverse types of attacks, along with a severe data imbalance, make it difficult for traditional classification methods to effectively identify a small number of attack types. To solve this problem, this paper proposes a DDoS recognition method CVWGG (Conditional Variational Autoencoder-Wasserstein Generative Adversarial Network-gradient penalty-Gated Recurrent Unit) for unbalanced data, which generates less noisy data and high data quality compared with existing methods. CVWGG mainly includes unbalanced data processing for CVWG, feature extraction, and classification. CVWGG uses the CVAE (Conditional Variational Autoencoder) to improve the WGAN (Wasserstein Generative Adversarial Network) and introduces a GP (gradient penalty) term to design the loss function to generate balanced data, which enhances the learning ability and stability of the data. Subsequently, the GRU (Gated Recurrent Units) are used to capture the temporal features and patterns of the data. Finally, the logsoftmax function is used to differentiate DDoS attack categories. Using PyCharm and Python 3.10 for programming and evaluating performance with metrics such as accuracy and precision, the results show that the method achieved accuracy rates of 96.0% and 97.3% on two datasets, respectively. Additionally, comparison and ablation experiment results demonstrate that CVWGG effectively mitigates the imbalance between DDoS attack categories, significantly improves the classification accuracy of different types of attacks and provides a valuable reference for network security defense.Keywords
DDoS [1] attacks are one of the most destructive and common threats to network security. An attacker can cause a target system to become unavailable or even crash by sending a large number of requests to a specific network, system, or service that exceeds its processing capacity. DDoS attack causes a target system to become unavailable by overloading its network bandwidth, processor, memory, or other critical resources, resulting in an inability to process legitimate requests, causing the target system to become unavailable. Currently, DDoS attacks are frequent and growing in size, time, speed and complexity because DDoS attack tools and services are widely available and easy to use, even for less technically qualified attackers. In addition, enterprise data centers, public cloud computing service providers, Internet infrastructure service providers, gaming service providers and Internet infrastructure service providers are the focus of their attacks. DDoS attacks are not easy to detect due to their diverse types, making them even more pervasive.
Distinguishing between the types of DDoS attacks helps to understand more information about the attacks so that more effective countermeasures can be formulated. The disadvantage of existing DDoS attack detection algorithms is that the detection performance is closely related to the selected features and classifiers, which cannot adapt well to the massive data environment. There are rarely studies on DDoS attack type differentiation and the raw traffic data is not balanced. In the proposed unbalanced processing method, the generated data has random noise and instability problems, which affect the DDoS differentiation results.
Based on this, we propose a method for DDoS attack differentiation based on CVWGG, which combines the advantages of CVAE and WGAN, to synthesize the data of the lacking attack types using generative modeling to alleviate the imbalance of the original traffic data and to improve the generalization performance of the model. Not only does it use CVAE as the generator of WGAN to generate high-quality synthetic data, but it also introduces GP to solve the problem of exploding or disappearing gradients that WGAN may encounter during the training process, which makes the training process more stable, thus effectively improving the problem that a few classes will be misclassified and unclassified by the existing detection methods in the face of data imbalance problems. Hence, to differentiate more accurately between DDoS attack types. The main contributions of this paper are as follows:
1. Construct balanced training samples using CVWG. The method uses the CVAE as a generator for WGAN which provides more diverse and higher-quality samples to support adversarial training.
2. The introduction of the GP in the loss function of CVWG significantly alleviates the problems of gradient vanishing and gradient explosion in model training and improves stability.
3. Construct a GRU model to perform feature extraction for DDoS attacks. The model extracts time series information to complete DDoS attack classification and has a low computational cost.
4. Evaluate on the dataset CICDDoS2019 which contains the latest 12 types of DDoS attacks and CICIDS2017 which contains 5 types of DDoS attacks. The experimental results show that this method is compared in terms of accuracy, recall and the experimental results outperform the comparison model.
The rest of the paper is organized as follows. Section 2 briefly describes the related work in this area. In Section 3, the design of the CVWGG model is elaborated. Section 4 provides the performance evaluation of the experiments. Section 5 gives related discussion. Finally, the conclusions of the paper are discussed in Section 6.
DDoS is the most common type of network disruption attack and one of the most serious problems faced by security managers; researchers have been exploring DDoS detection and defense methods. Bhayo et al. [2] designed a detection module using machine learning, which proved to be effective in detecting DDoS attacks in IoT (Internet of Things) environments. Lu et al. [3] proposed an information entropy and deep learning-based DDoS attack detection method. Suspicious traffic is first detected by the information entropy of the controller and then packet-based detection is performed using CNN (Convolutional Neural Networks) models to distinguish normal traffic from DDoS attack traffic. Liu et al. [4] pointed out that a large number of DDoS and its variants and data imbalance leads to the fact that most of the methods in DDoS detection are binary classifications, which are not able to effectively detect a small number of attacks and differentiate between the types of DDoS attacks.
It has been shown that most of the research on intrusion detection and network attack detection focuses on the detection rate of the models [5,6] but the data imbalance problem leads to the classification models favoring the categories with more samples in the attack categories and ignoring the categories with fewer samples. To address this problem, researchers have used generative adversarial networks to generate synthetic data samples of a few categories [7,8], which helps classification models achieve better generalization and lower bias.
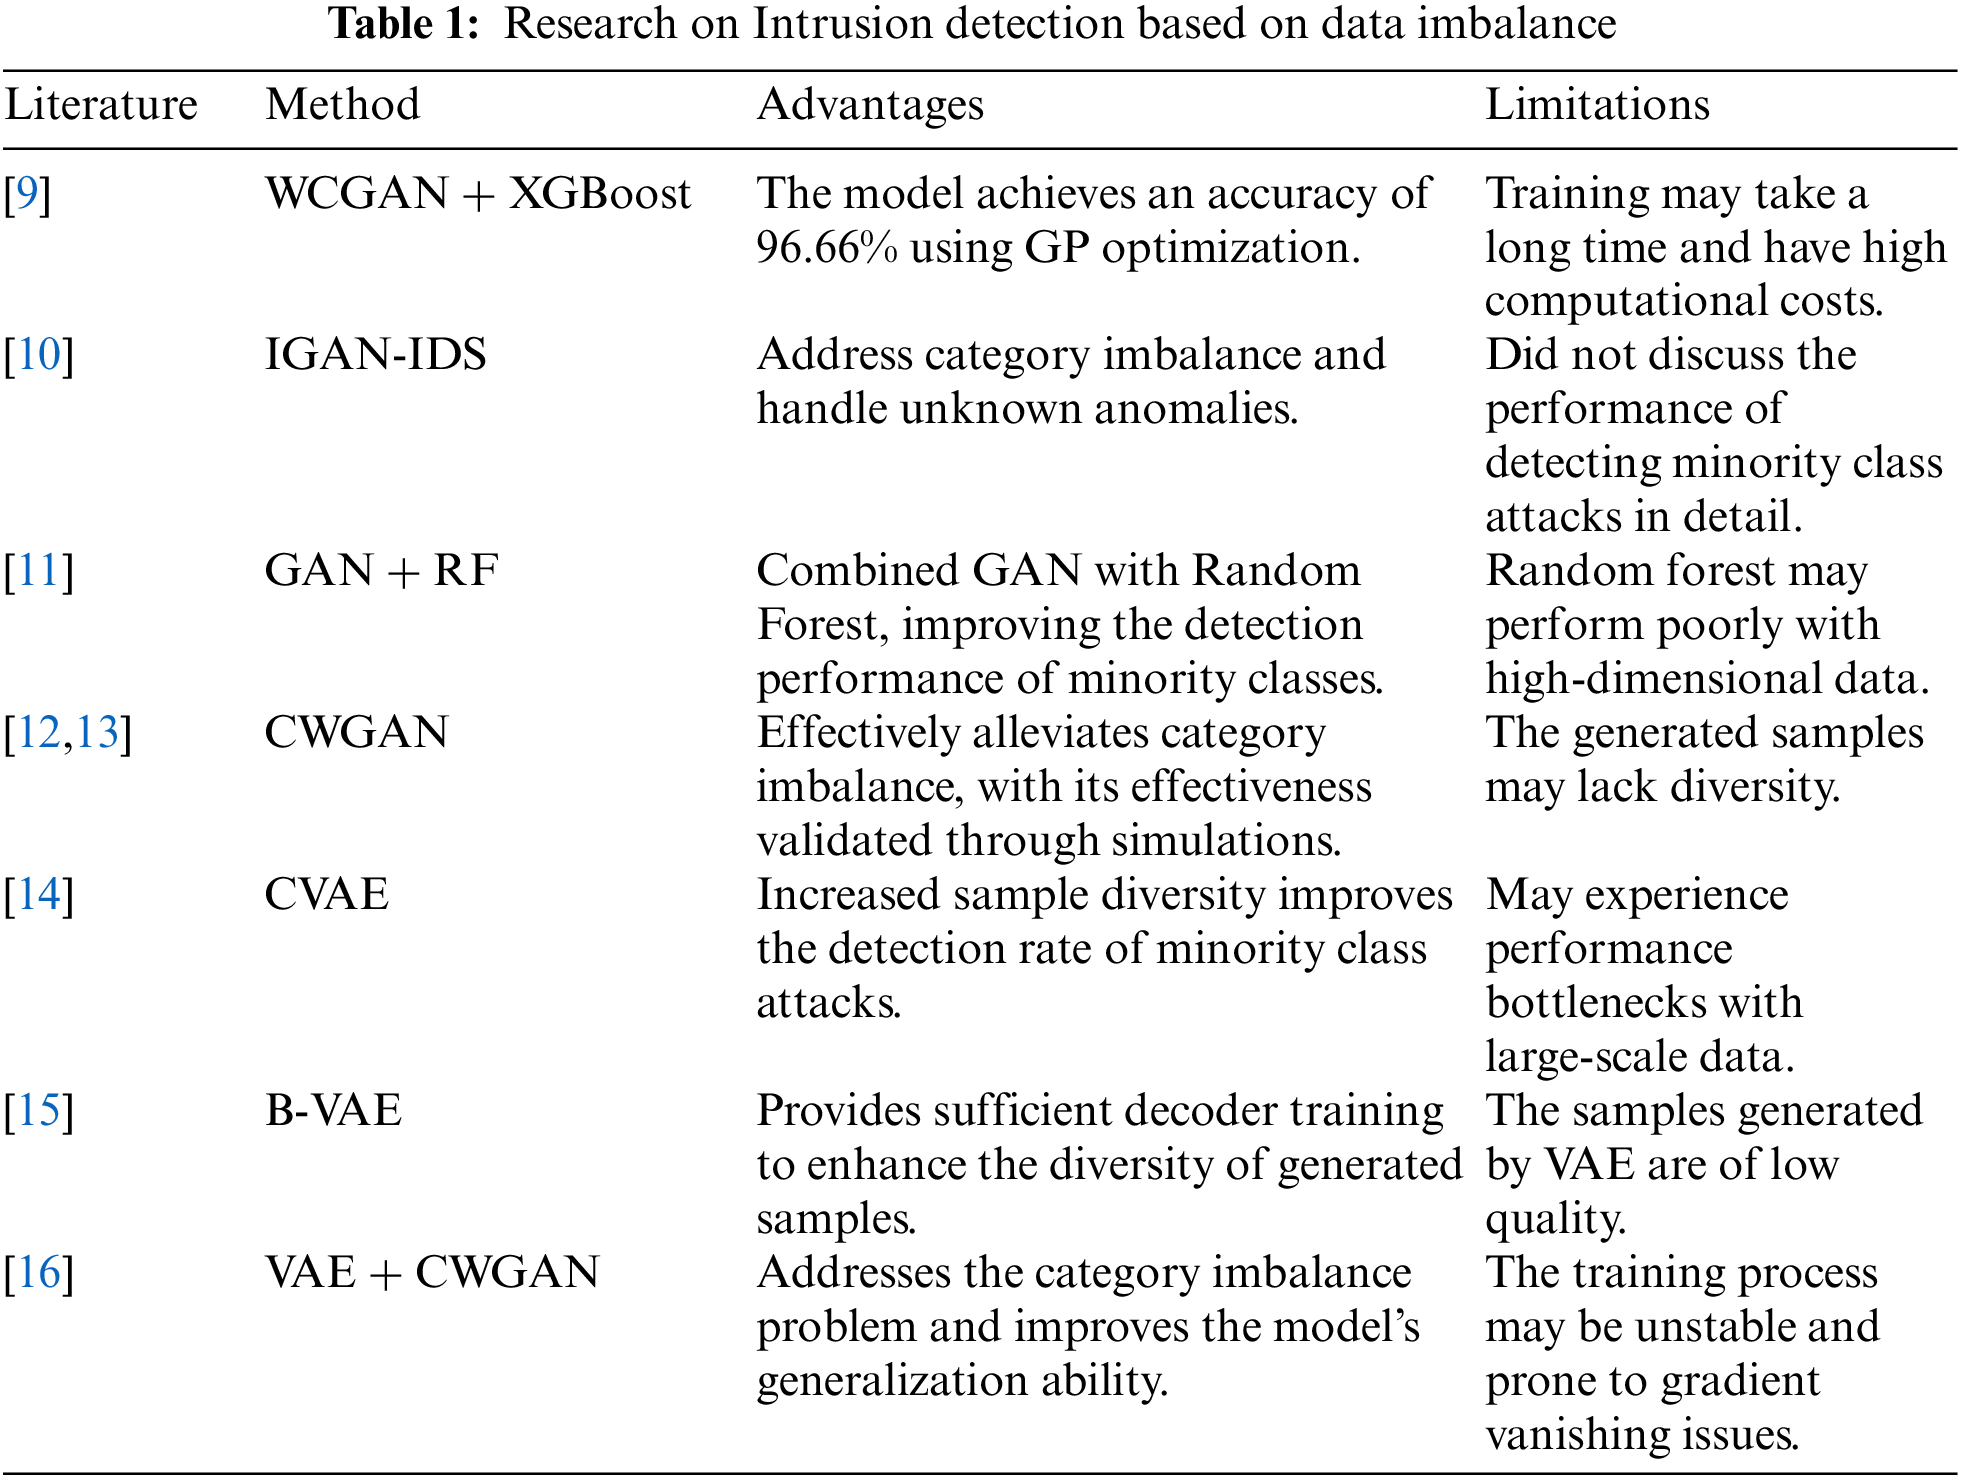
Table 1 presents relevant literature on intrusion detection based on data imbalance. Kumar et al. [9] proposed the WCGAN (Wasserstein Conditional Generative Adversarial Network) in combination with the XGBoost (Extreme Gradient Boosting) classifier. GP is used along with WCGAN for stable learning of the model, and the final model achieves 96.66% accuracy. Huang et al. [10] designed a solution IGAN-IDS using the GAN (Generative Adversarial Network) to solve the category imbalance problem and to simulate the unknown anomalies. Lee et al. [11] proposed a model that combines GAN with Random Forest classification to solve the problem of data imbalance in intrusion detection systems. Literature [12,13], on the other hand, employed CWGAN (Conditional Wasserstein Generative Adversarial Network) to generate new samples for minority class attacks to alleviate the class imbalance problem and validate the effectiveness of the proposed method through simulation experiments. However, the CWGAN network may have limitations in sample patterns when generating data, resulting in the generated samples often lacking diversity. Therefore, literature [14] used an improved CVAE to learn the intrinsic distribution of traffic data to generate specified attack samples, which increases the diversity of samples and thus improves the detection rate of minority class attacks. To address the problem of insufficient VAE decoder training in VAE (Variational Autoencoder) methods, Chuang et al. [15] applied B-VAE (Batch-Variational Autoencoder) to provide sufficient decoder training by replicating data batches and forming multiple VAE batches to train a decoder for each data. Since VAE is trained by maximizing likelihood estimation, the generated samples are usually of poor quality. Therefore, some researchers have gradually combined the two; Liu et al. [16] combined VAE with CWGAN to generate new samples using the VAE-CWGAN model to solve the problem of class imbalance in the dataset so that the classification model is no longer biased towards the majority of the classes, but it also exposes the model to the problem of unstable training.
Therefore, current DDoS detection methods are primarily limited to binary classification, distinguishing only between attack traffic and normal traffic. However, further differentiating between different types of DDoS attacks can help implement targeted defense strategies, and accurately identifying the type of attack can optimize the allocation of defense resources, thereby avoiding unnecessary resource waste. Most existing data balancing methods face issues such as insufficient diversity of generated data, unstable training processes, and gradient vanishing problems. To solve the above problem, this paper proposes a method that combines the CVAE, WGAN with the introduction of a gradient penalty term and finally classifies them by GRU to solve the problem of data imbalance between the classes of the original DDoS attack. By using CVAE as the generator of WGAN, the model can effectively generate diverse attack samples by using the attack types as conditions during the training process, which helps to balance the dataset. The discriminator of WGAN takes advantage of the Wasserstein distance, which can more accurately measure the gap between the generated samples and the real data and enhances the training stability of the generator and the generation of the Authenticity. The introduction of the gradient penalty term further improves the training stability of WGAN and avoids the problems of pattern collapse and unstable training in generative adversarial network training. GRU is an efficient recursive neural network structure that can capture the temporal relationship in the sequential data and better extract features.
This model framework is shown in Fig. 1.
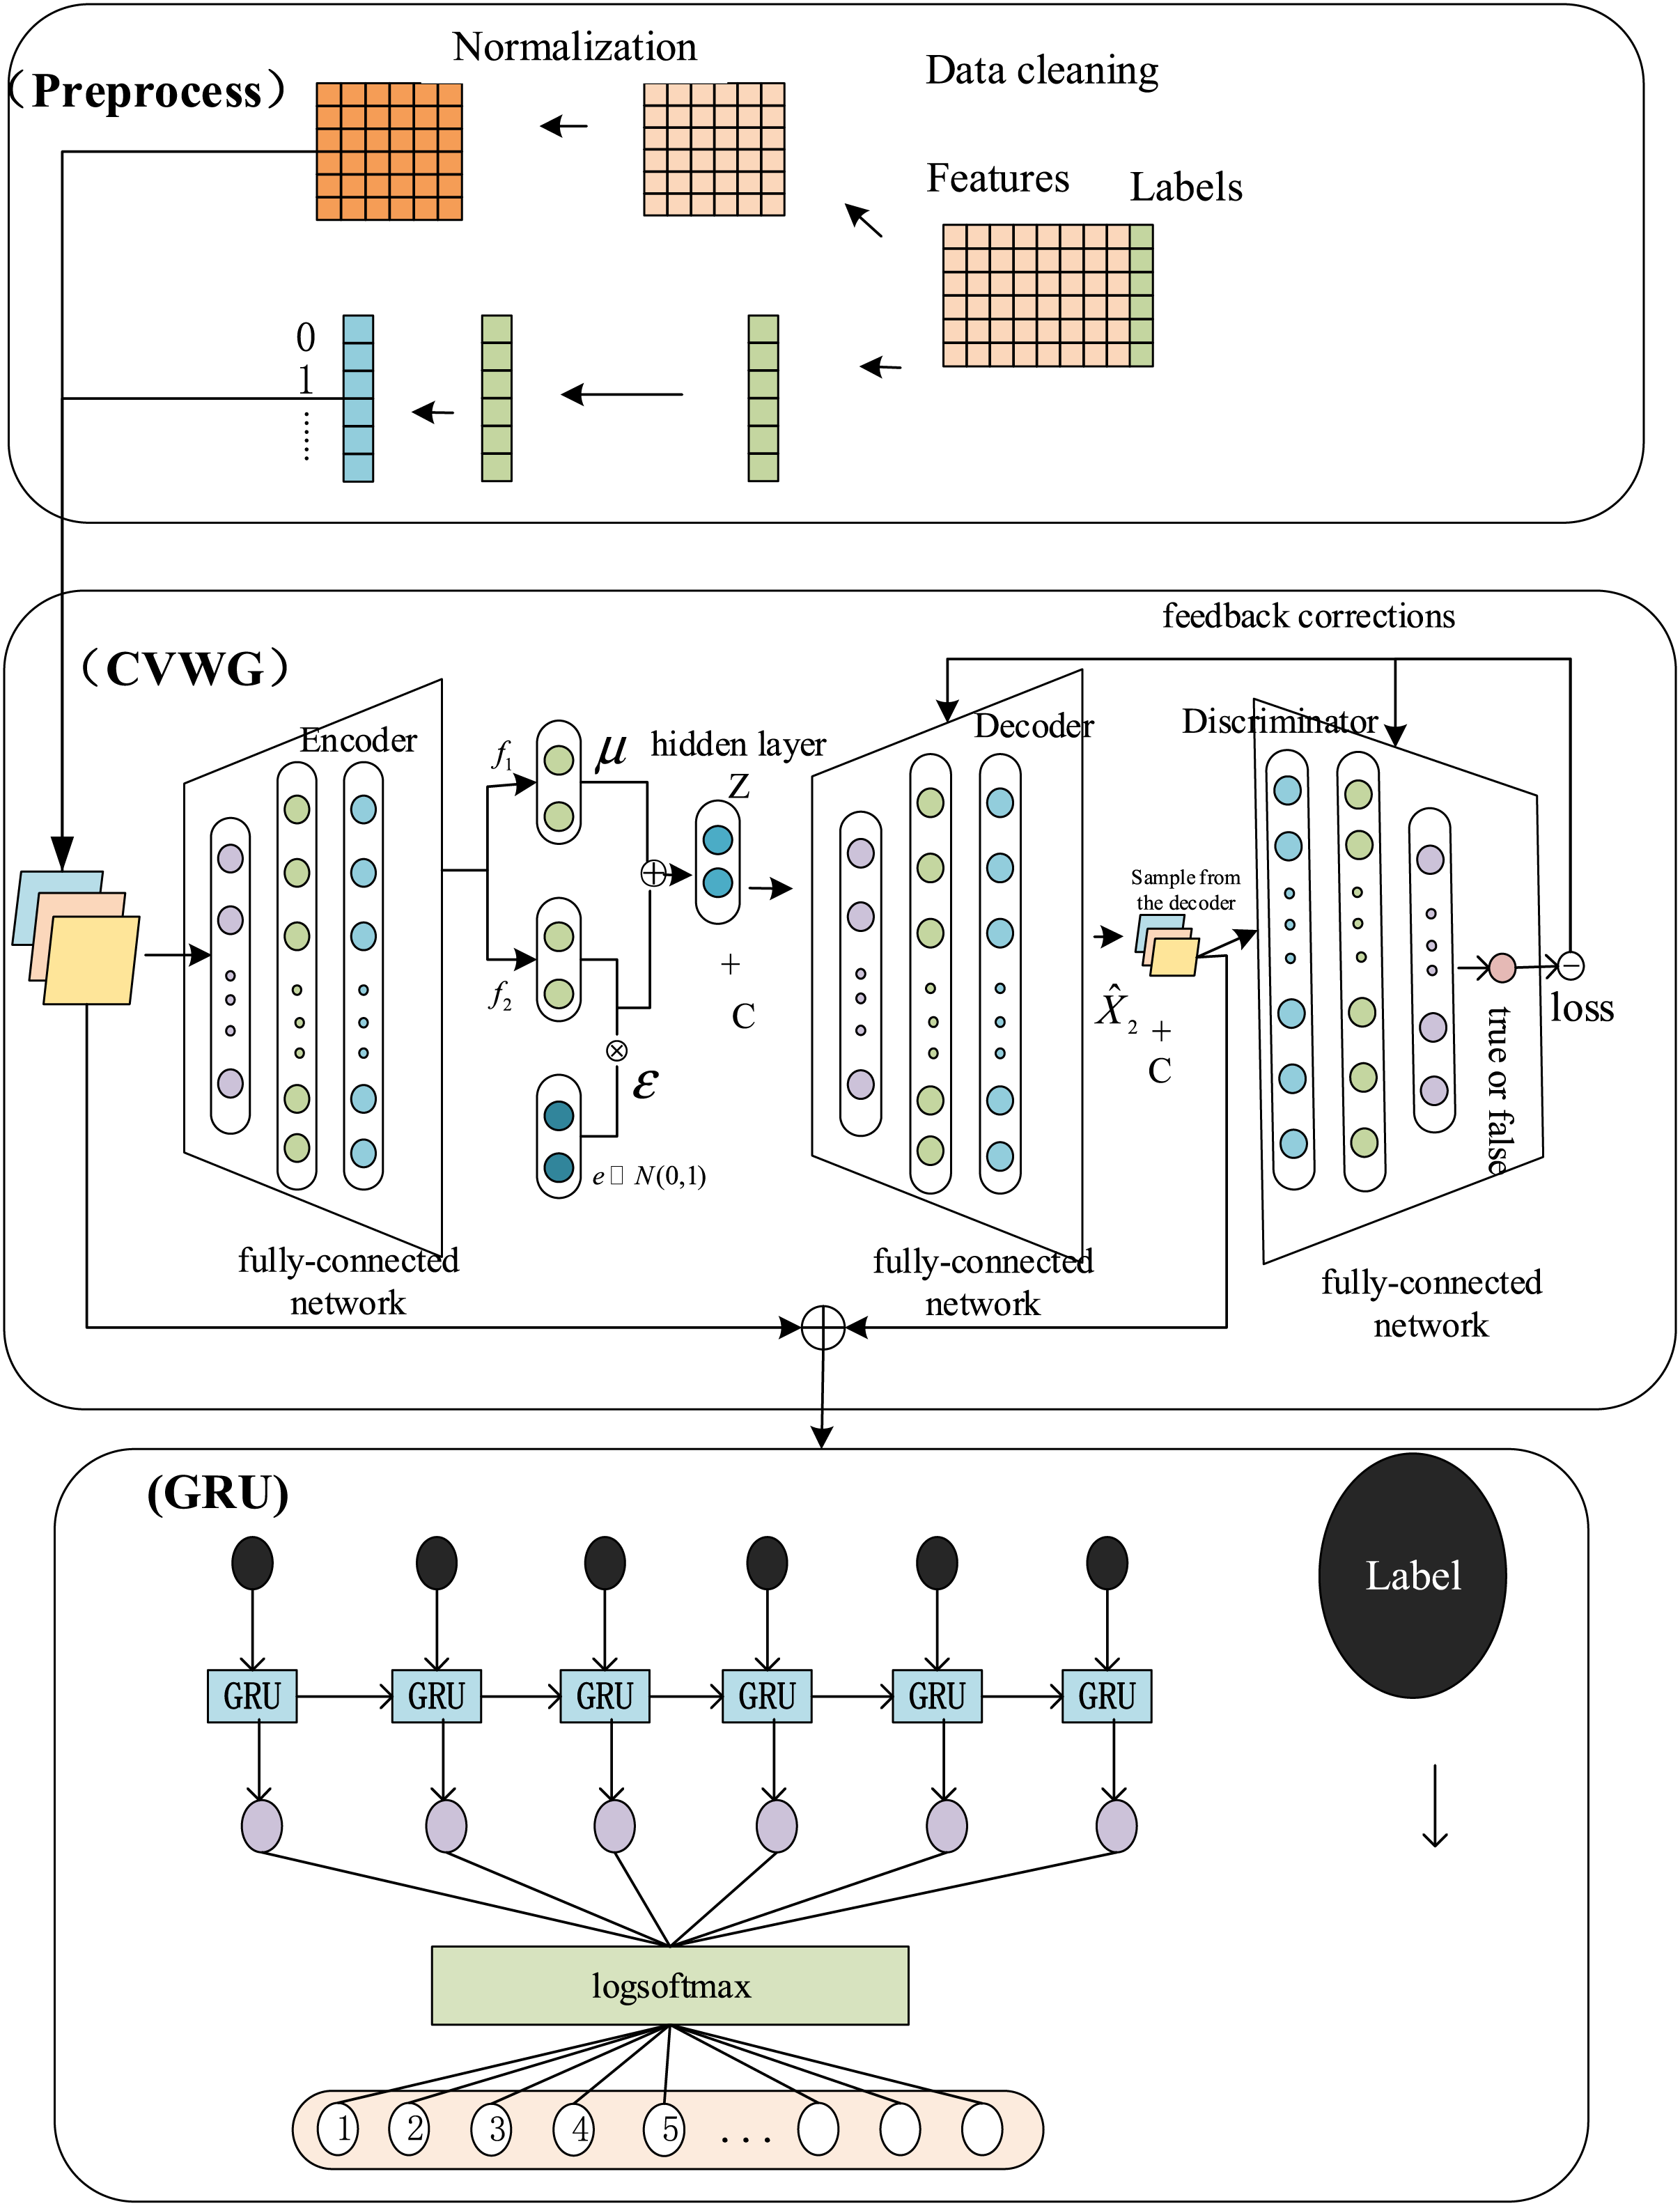
Figure 1: CVWGG model diagram
As shown in Fig. 1, this model contains three main parts: Preprocess, preprocessing operations such as cleaning, coding and normalization of the original data; CVWG (Conditional Variational Autoencoder-Wasserstein Generative Adversarial Network-gradient penalty), data imbalance processing, using CVAE to generate samples of a few categories and balancing the dataset by improving the quality and diversity of the generated samples through WGAN; GRU, passing the balanced data into the GRU and classification, extracting the sequence features and completing the classification.
To improve the data quality and stability of existing methods, we propose the CVWGG method, which is a model that introduces the CVAE into the WGAN network. Doing so effectively solves the problem of modeling when generating data for WGAN networks while using gradient penalty techniques to improve the training difficulty of WGAN. Ultimately, we use the GRU network, which has a small number of parameters and a low computational cost, to complete the differentiation of the types of DDoS attacks, thus improving the accuracy and efficiency of detection.
3.3 Unbalanced Data Processing Method-CVWG
In a primitive GAN network, noise is usually randomly sampled from some distribution, which is then fed into a generator that is adversarially trained to generate fake data. However, these noises usually do not contain information about the valid features, so after passing through the generator, the generated data hardly contains specific information. Even with extensive training, the generated fake data is difficult to match the real data. Autoencoders differ from generative adversarial networks in that they can efficiently extract features from the input data and then decode these features to restore the original data as much as possible. VAE take this a step further by improving on the shortcomings of autoencoders. Autoencoders can only restore data but cannot generate new data. To solve this problem, extracts features from the input data, calculates the mean and variance of these features, and then fits them into a Gaussian distribution. It then samples from this distribution and generates new data through the decoder. This allows the network to generate data that is as similar as possible to the real data while maintaining the diversity and variability of the generated data. Therefore, CVWG is designed by combining the CVAE, WGAN and GP techniques.
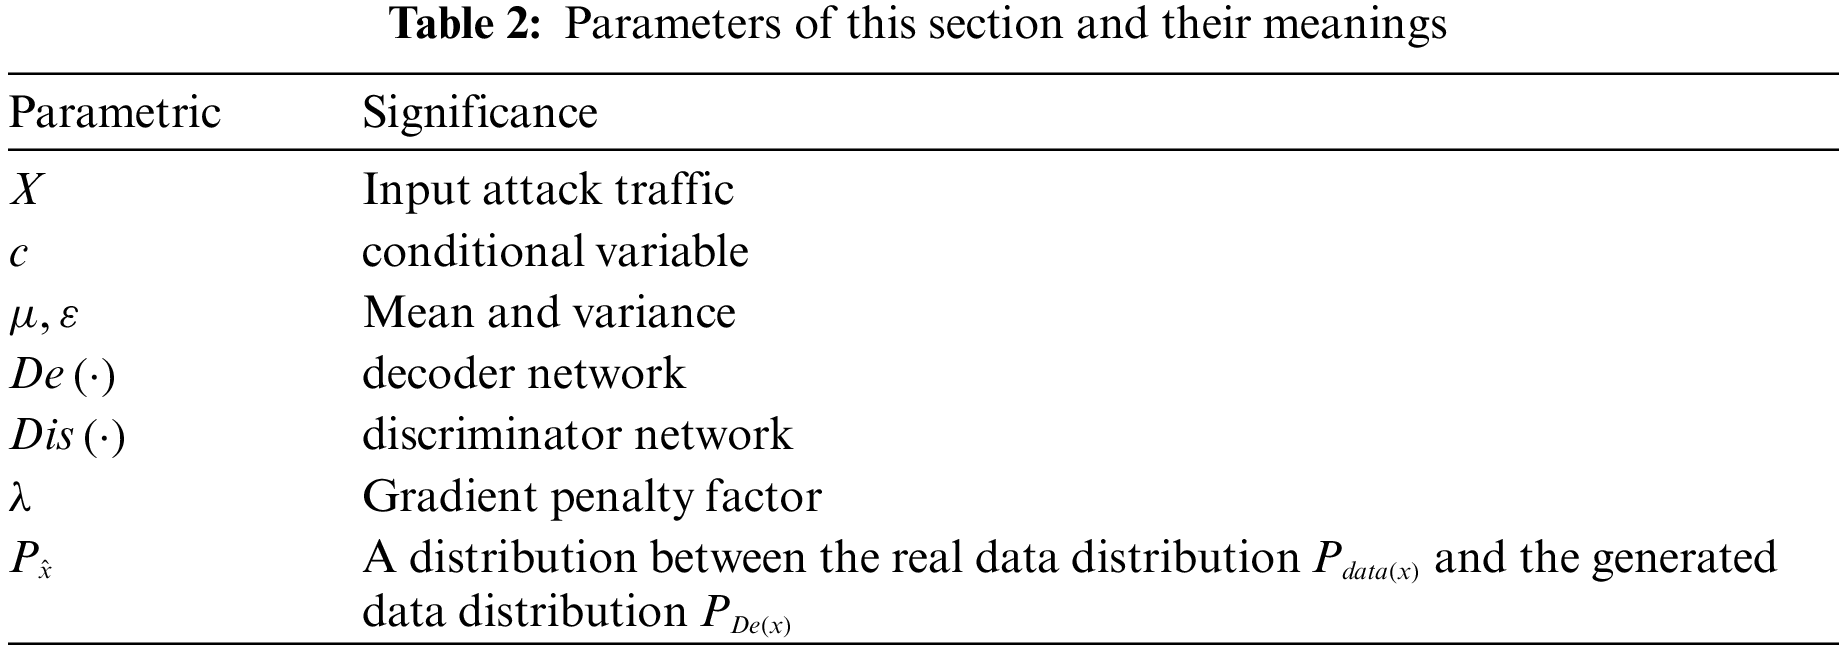
The following section will provide a detailed introduction to the CVWG method, with the symbols used listed in Table 2.
The network structure involved in the CVWG is shown in Fig. 2 below, which mainly includes an encoder, a decoder, and a discriminator. The following provides a detailed introduction to them.
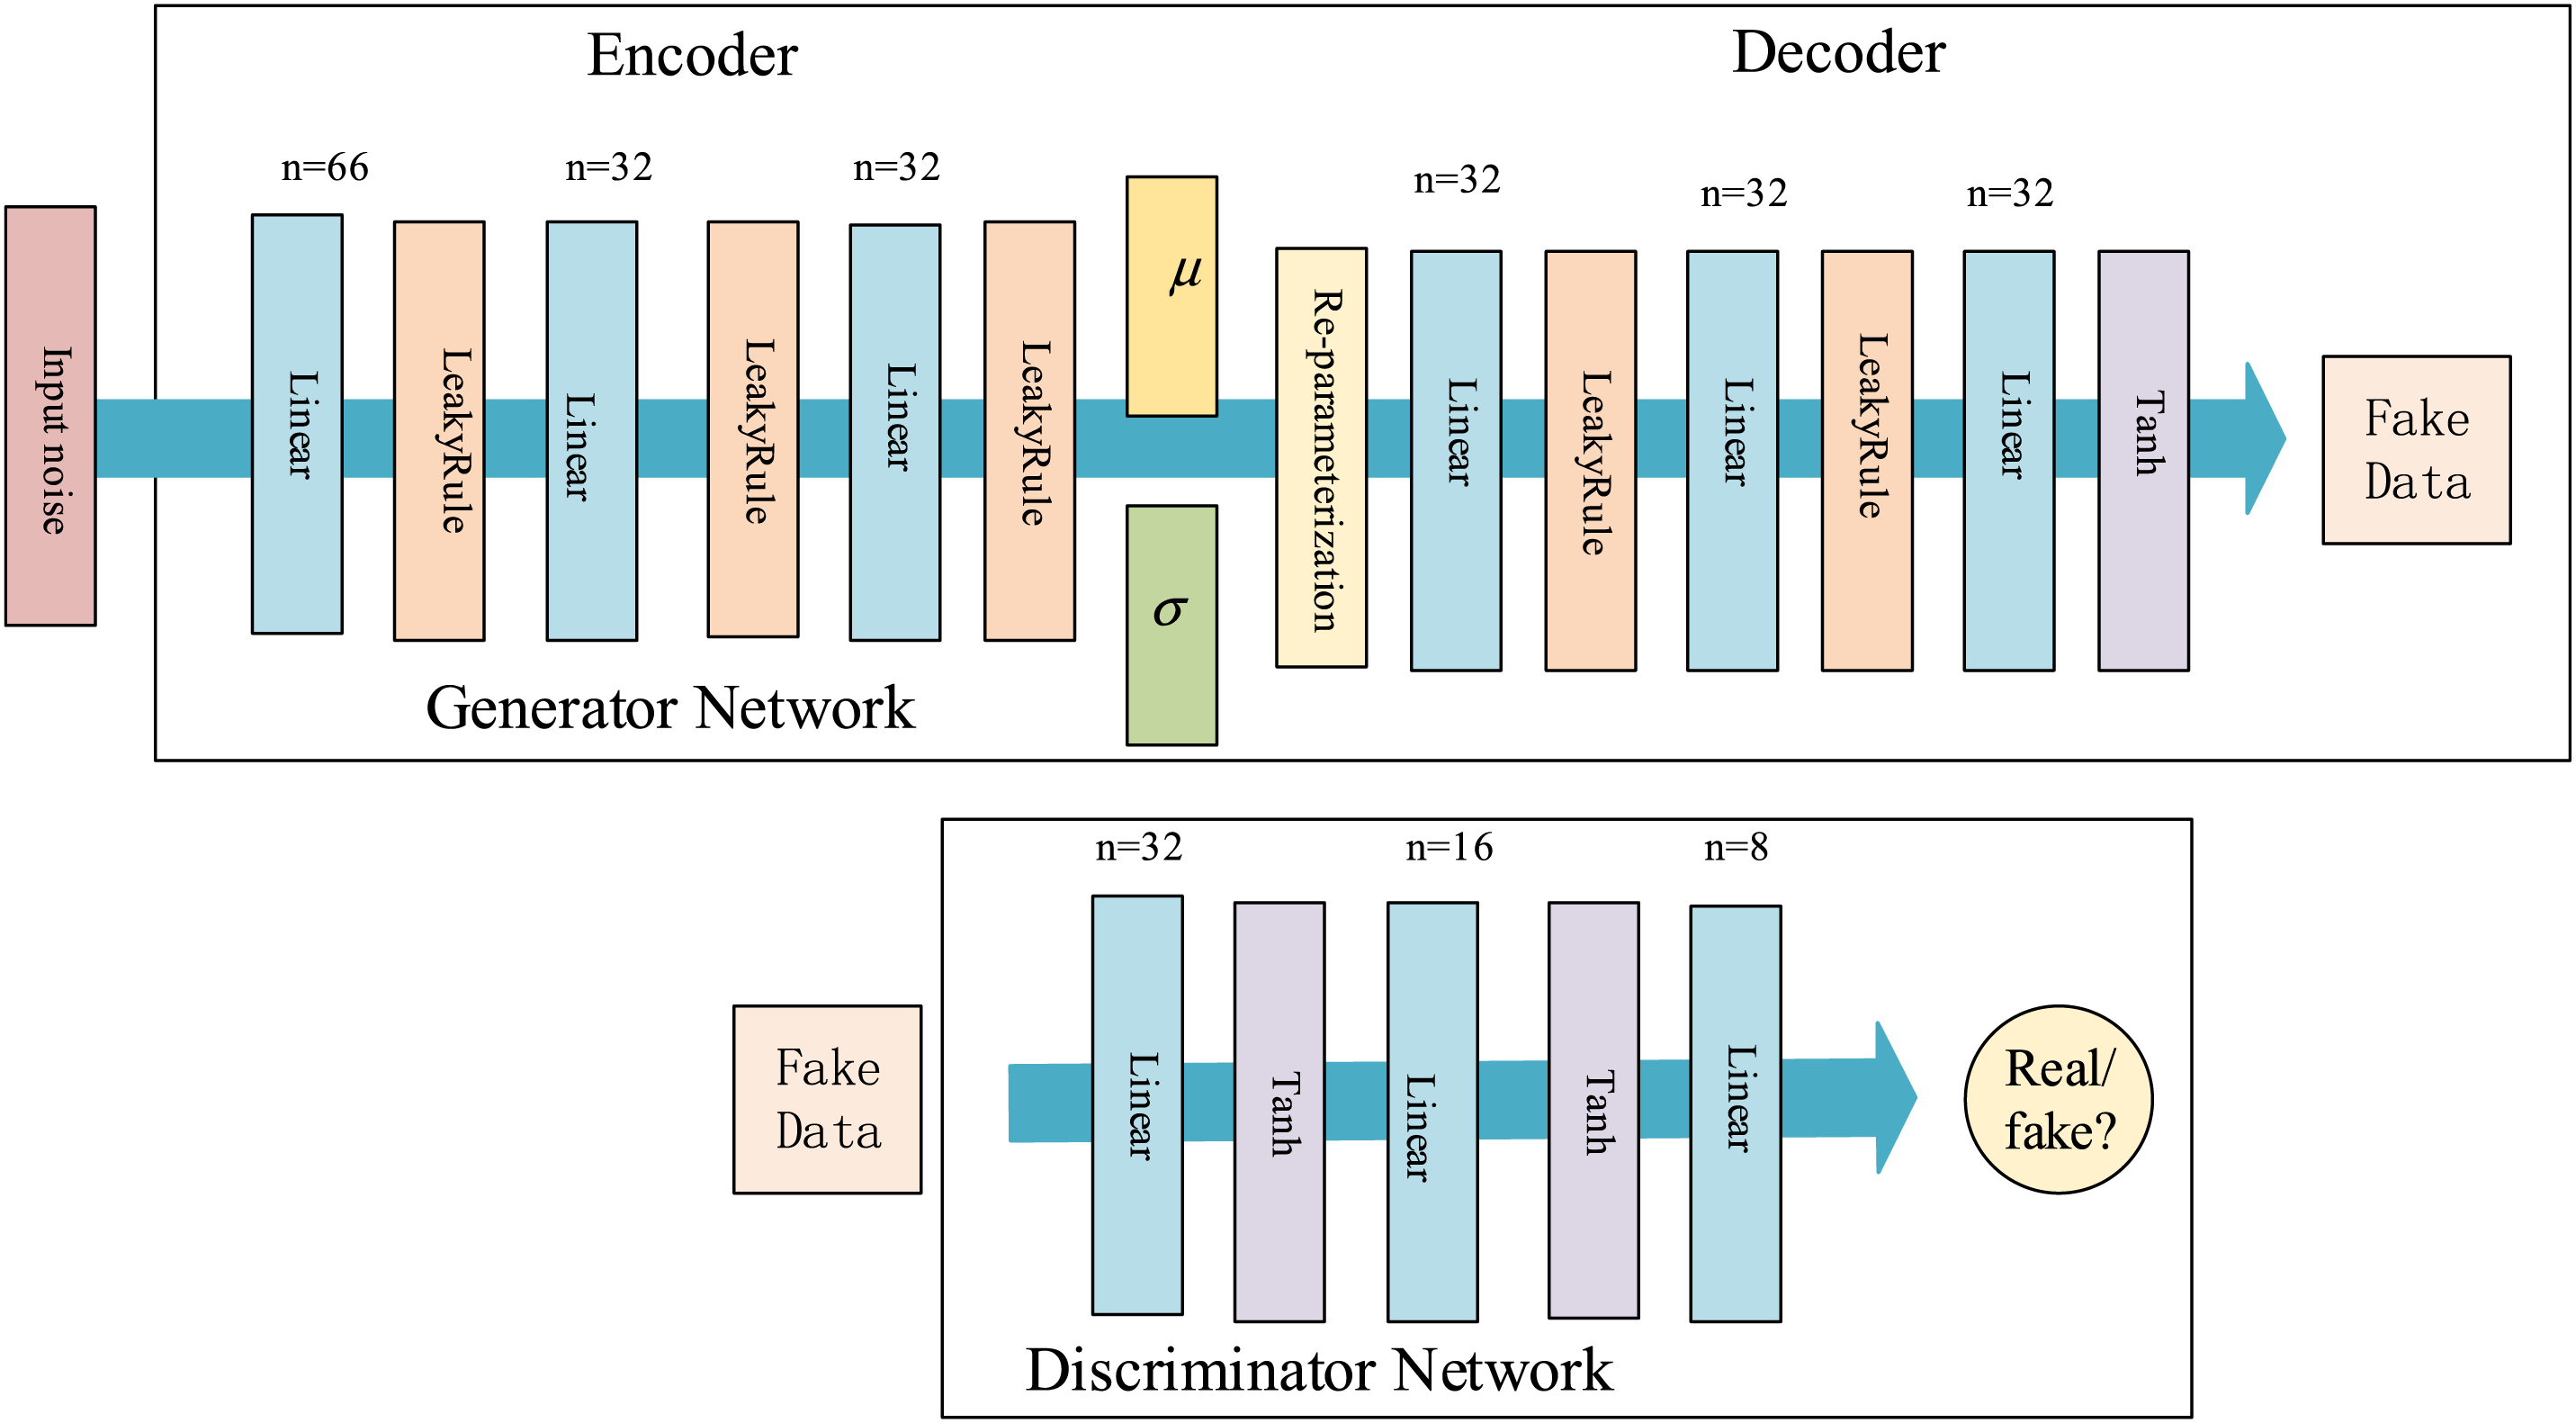
Figure 2: Network structure of CVWG
The encoding network transforms the input data
where
As shown in Eq. (4),
The decoder feeds the hidden layer
To compare the difference between the generated and real samples, the mean square error loss function between the real data
The discriminator inputs the generated samples and generated labels simultaneously with the true labels and outputs the true and false predicted values (As shown in Eq. (9)).
where
The discriminator uses the loss function of WGAN, and the use of the Wasserstein distance instead of the KL scatter of the original GAN network reduces the occurrence of phenomena such as pattern collapse (As shown in Eq. (10)).
where
For the function
As the design
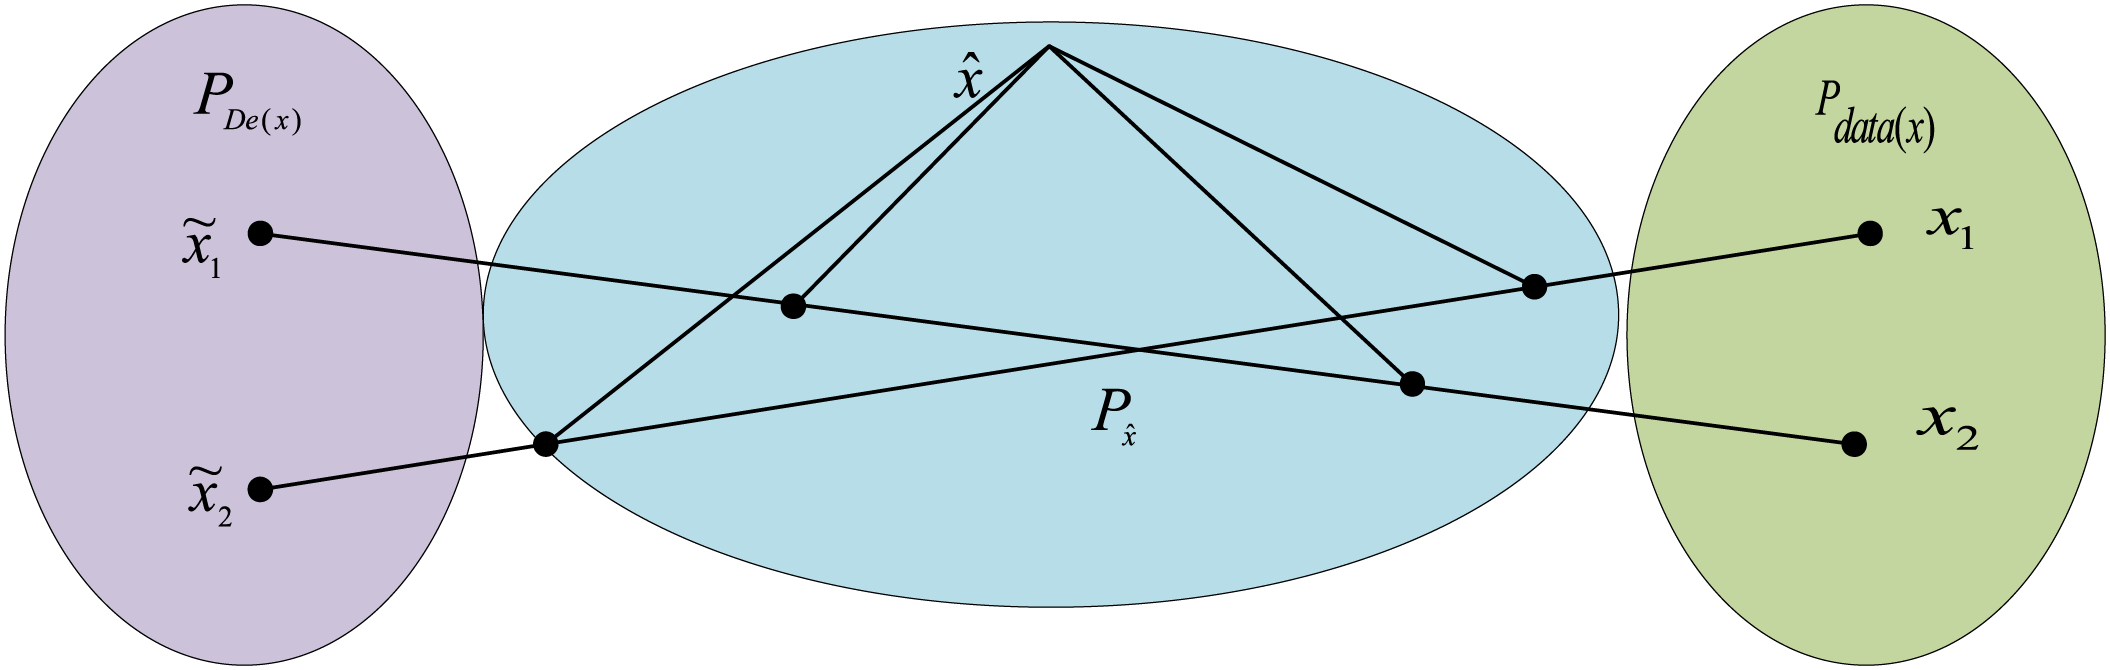
Figure 3: Gradient penalty map
This is done so that a gradient penalty term conforming to
where
Integrating all the functions to be optimized, the final objective loss function to be optimized by CVAE-WGAN-GP is show in Eq. (12).
GRU is a variant of RNN (Recurrent Neural Network) for modeling processing sequence data. GRU is similar to traditional RNN in that it has recurrent connections to capture temporal dependencies in sequences. However, unlike traditional RNN, GRU (see Fig. 4) introduces a gating mechanism to selectively update and pass information through carefully designed gating units. Compared to LSTM (Long Short-Term Memory), GRU has fewer parameters, which means easier training and faster computation. This is useful for processing larger datasets or in resource-limited environments.
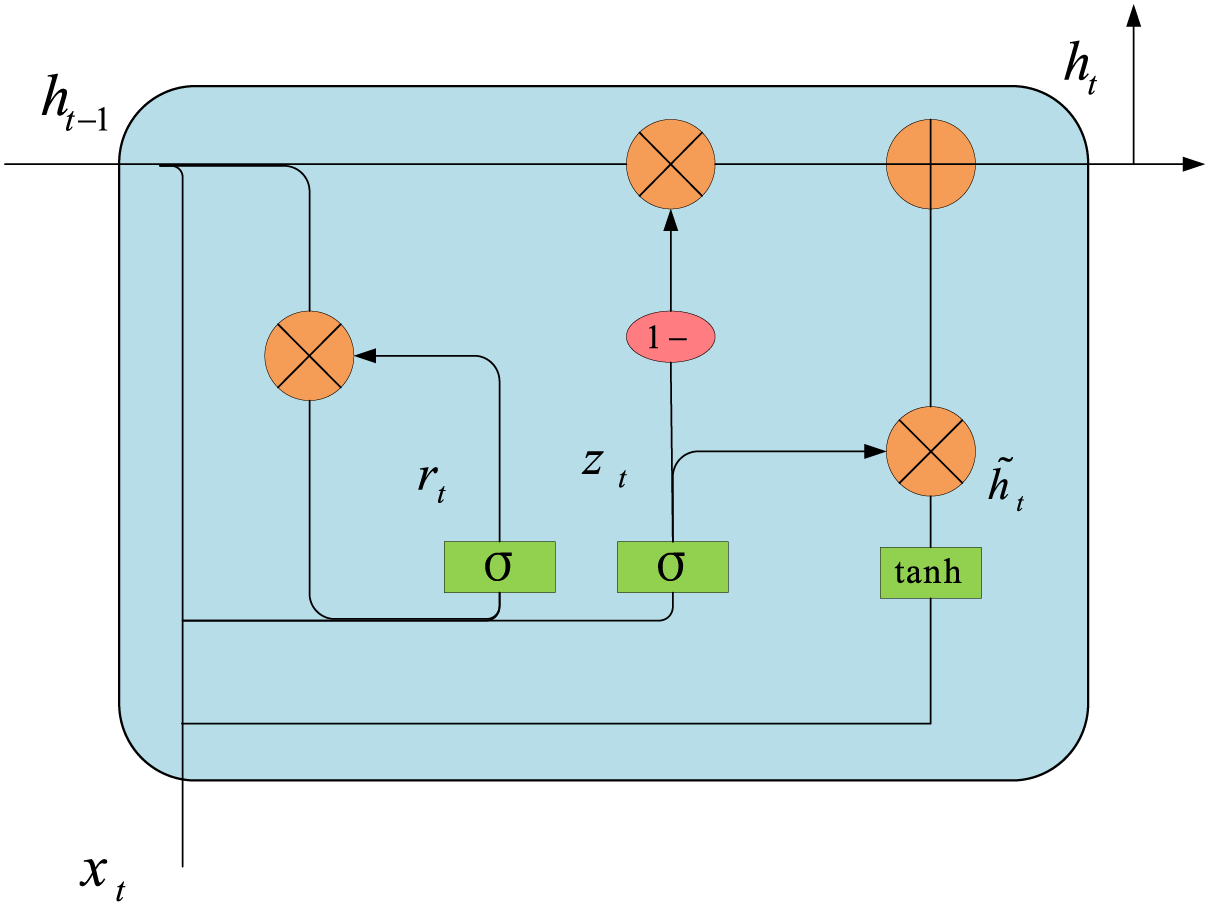
Figure 4: GRU unit structure
We input the data processed by data balancing into the GRU model, the data dimension input into the GRU model is 66 dimensions, meanwhile the model uses a single layer of GRU, through the dropout layer to avoid overfitting, and set the value to 0.5. The time dependence of the traffic data is further processed through the information transfer between the units, and finally the final output is obtained through the logsoftmax layer.
Specifically, GRU introduces two important gating units: reset gate and update gate. The structure of GRU is shown in Fig. 4. The reset gate controls how the past information interacts with the current inputs, while the update gate controls how the new information is retained and updated.
Update Gate: The update gate uses the inputs
where
Reset Gate: The reset gate uses the input of the current position
where
Candidate hidden state: A candidate hidden state is computed based on the activation value of the reset gate. This state combines the information from the current input and the previous hidden states. (As shown in Eq. (15)).
where
Hidden state update: Based on the activation value of the update gate, the candidate hidden state and the hidden state of the previous time step are fused with the information to get the hidden state of the current time step. This hidden state contains the information from the current input and retains the information from the previous time step (As shown in Eq. (16)).
where the hidden state
Output: The hidden state of the last time step after processing the whole sequence is used as a feature representation of the whole sequence, which is fed into the logsoftmax layer for traffic classification
4.1.1 Experimental Evaluation Indicators
In this paper, widely used evaluation metrics are used to assess the performance of classification models. These metrics are Accuracy, Precision, Recall and F1-score, which are defined by Eqs. (17)–(20).
where
Precision is the ratio of correctly identified positive samples to the number of samples predicted as positive, reflecting the accuracy of the model’s positive predictions. F1-score is the harmonic means of precision and recall, considering the balance between the two, and particularly suitable for addressing imbalanced datasets.
4.1.2 Experimental Environment
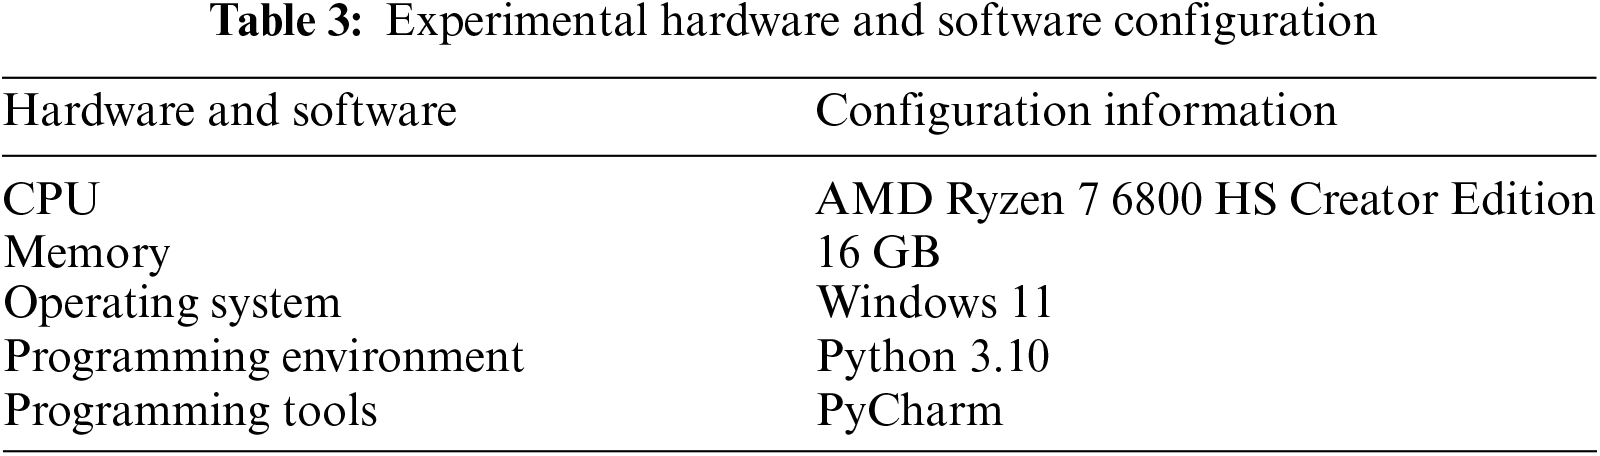
This experiment was conducted under the Windows 11 operating system, using Python 3.6 for programming and modeling; the hardware and software configuration and hyperparameter configuration are shown in Table 3.
The datasets used in this paper are CICDDoS2019 [17] and CICIDS2017 [18]. The most DrDoS_NTP in the CICDDoS2019 dataset has 120,000 entries, the least has only 51 entries, the most in CICIDS2017 has 44,081 entries, and the least has only 11 entries. This huge gap in the number leads to a few categories of types that are not adequately trained due to the limitation of the amount of data, and the accuracy rate is very low. Before conducting the experiments, given the unbalanced nature of the original data, we processed the dataset numerically and normalized it. The following are the detailed processing steps:
(1) Data cleaning: First, we removed missing and incomplete data. Specific operations included deleting rows containing “nan” entries and replacing numbers containing “infinity” with “−1”. The purpose of this step was to remove invalid values from the data in order to improve its accuracy.
(2) Data condensation: Attack flow datasets usually contain a large amount of socket information, such as flowID, target IP, secure IP, etc. To facilitate model training, we condense this information to reduce the complexity of the data.
(3) Randomization of samples: To ensure the randomness of the samples, we randomly deleted records while importing the dataset to complete the streamlining of the data. This step helps to eliminate any bias and interference in the data and ensures the randomness of the data.
(4) Feature selection: We removed some attributes in the dataset because they only contained “0” values and did not contribute to model training.
(5) Normalization: In the final stage of preprocessing, the data are normalized. Use Eq. (21) to scale the data into [0, 1].
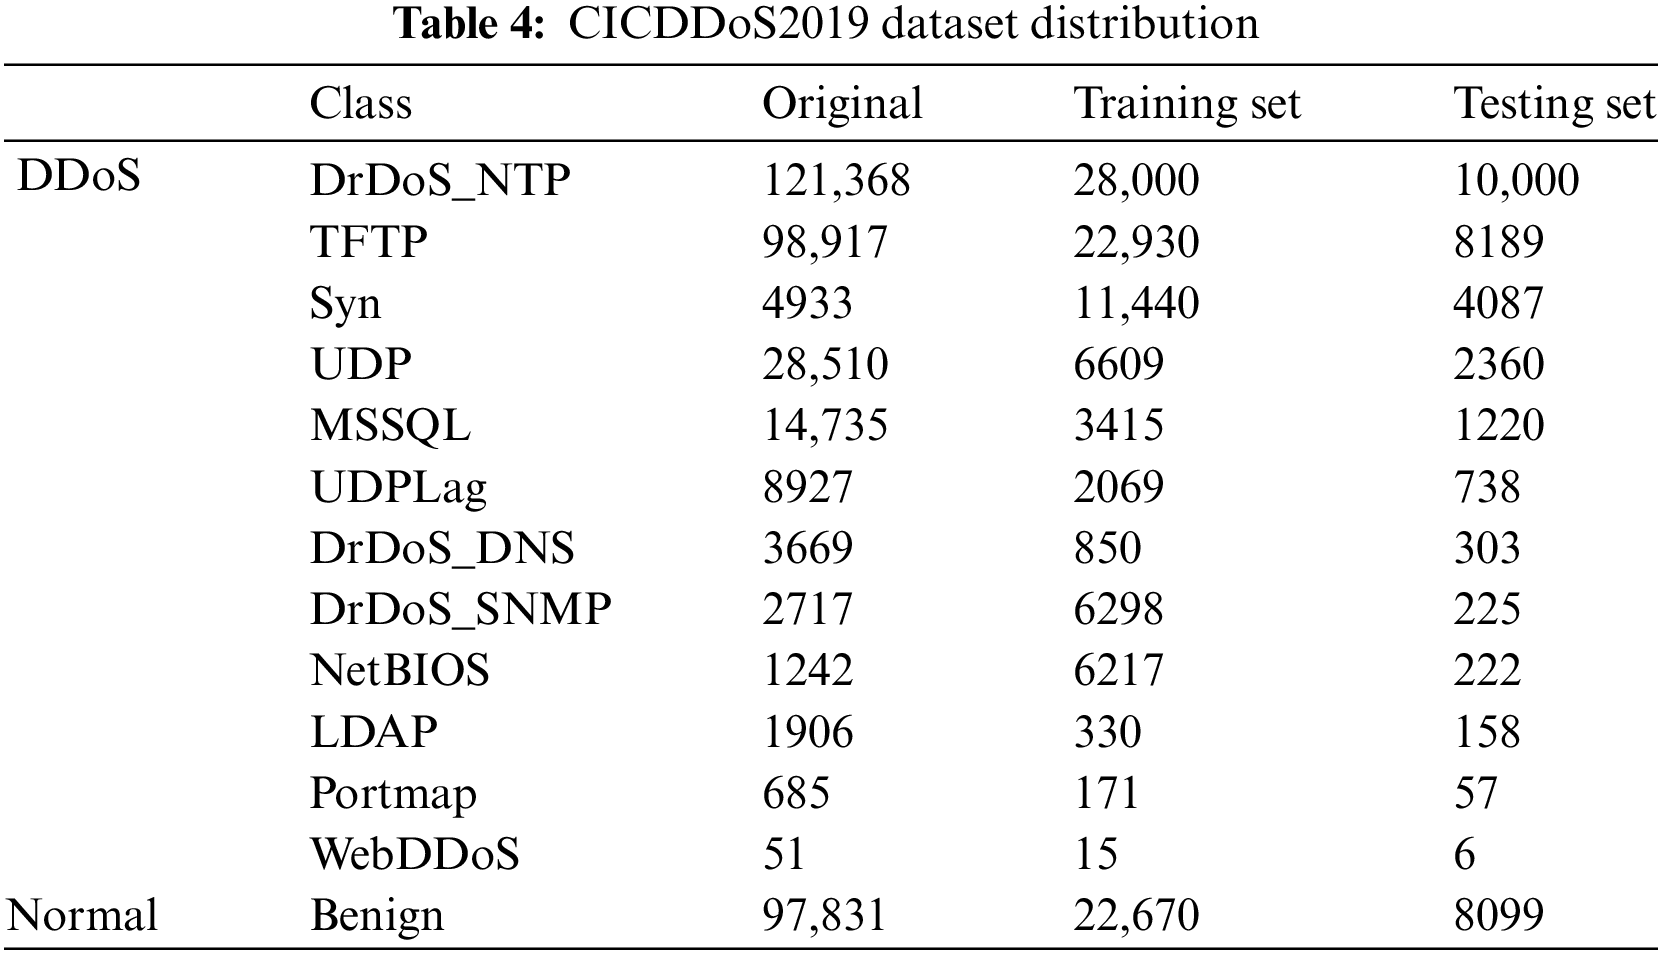
In this paper, to better verify the effect of data generation, we extract data in accordance with the proportion of the original data distribution. In the CICDDoS2019 dataset, we scaled 100,000 data items from the data distribution for the training set and 30,000 data items for the test set. After construct the training set, the data was balanced by expanding the data from a few categories to the same 28,000 entries as the maximum number of categories, DrDoS_NTP. Table 4 demonstrates the specific number of entries in the data distribution.
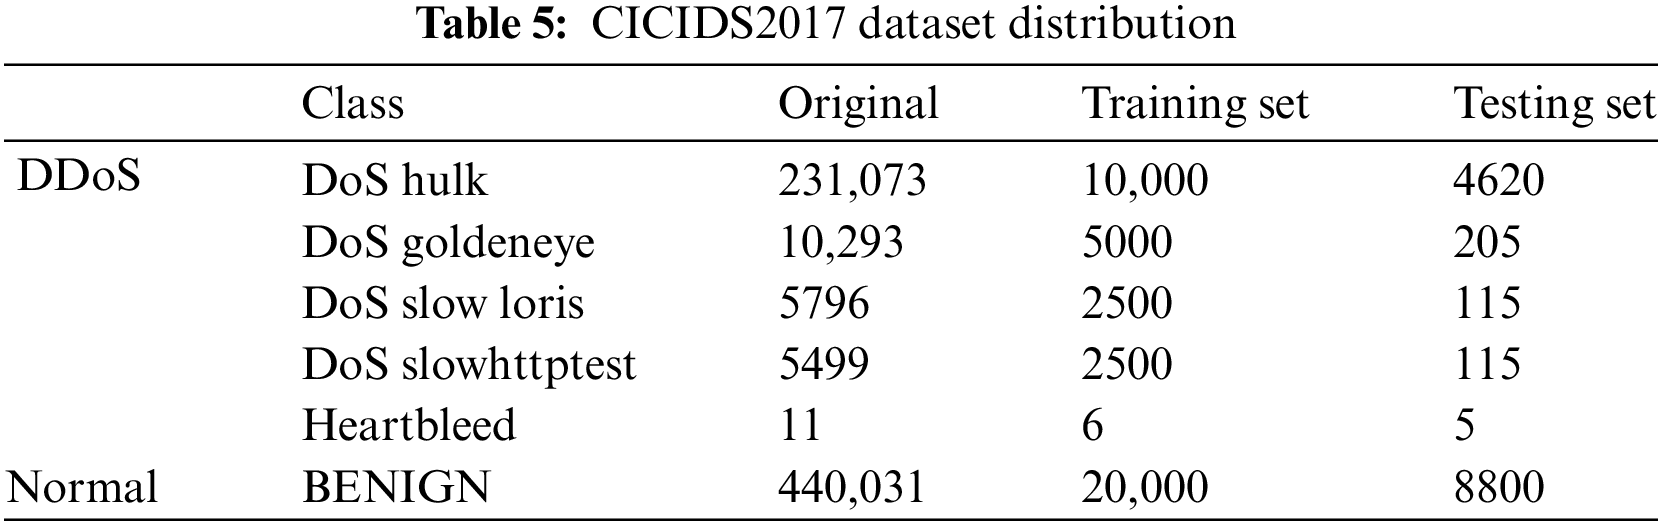
In the CICIDS2017 dataset, 40,006 entries were first extracted as the training set and 13,860 entries as the test set according to the original data distribution. To balance the training set, the sample size of a few categories was expanded to 20,000 entries. The data distribution is shown in Table 5.
In this paper, the lesser data in the original category of CICDDoS2019 is enhanced to the same number as the most DrDoS_NTP. To prove that the distribution of the generated data is similar to the distribution of the original data, the TSNE (T-Distributed Stochastic Neighbor Embedding) technique is used to visualize the generated data with the original data, and the results are shown in Fig. 5, from which it can be seen that the distribution of the original data concentrates between −100 and 150, and the generated data also concentrates between −100 and 150, which conforms to the combined original distribution and proves that the generated data is valid.
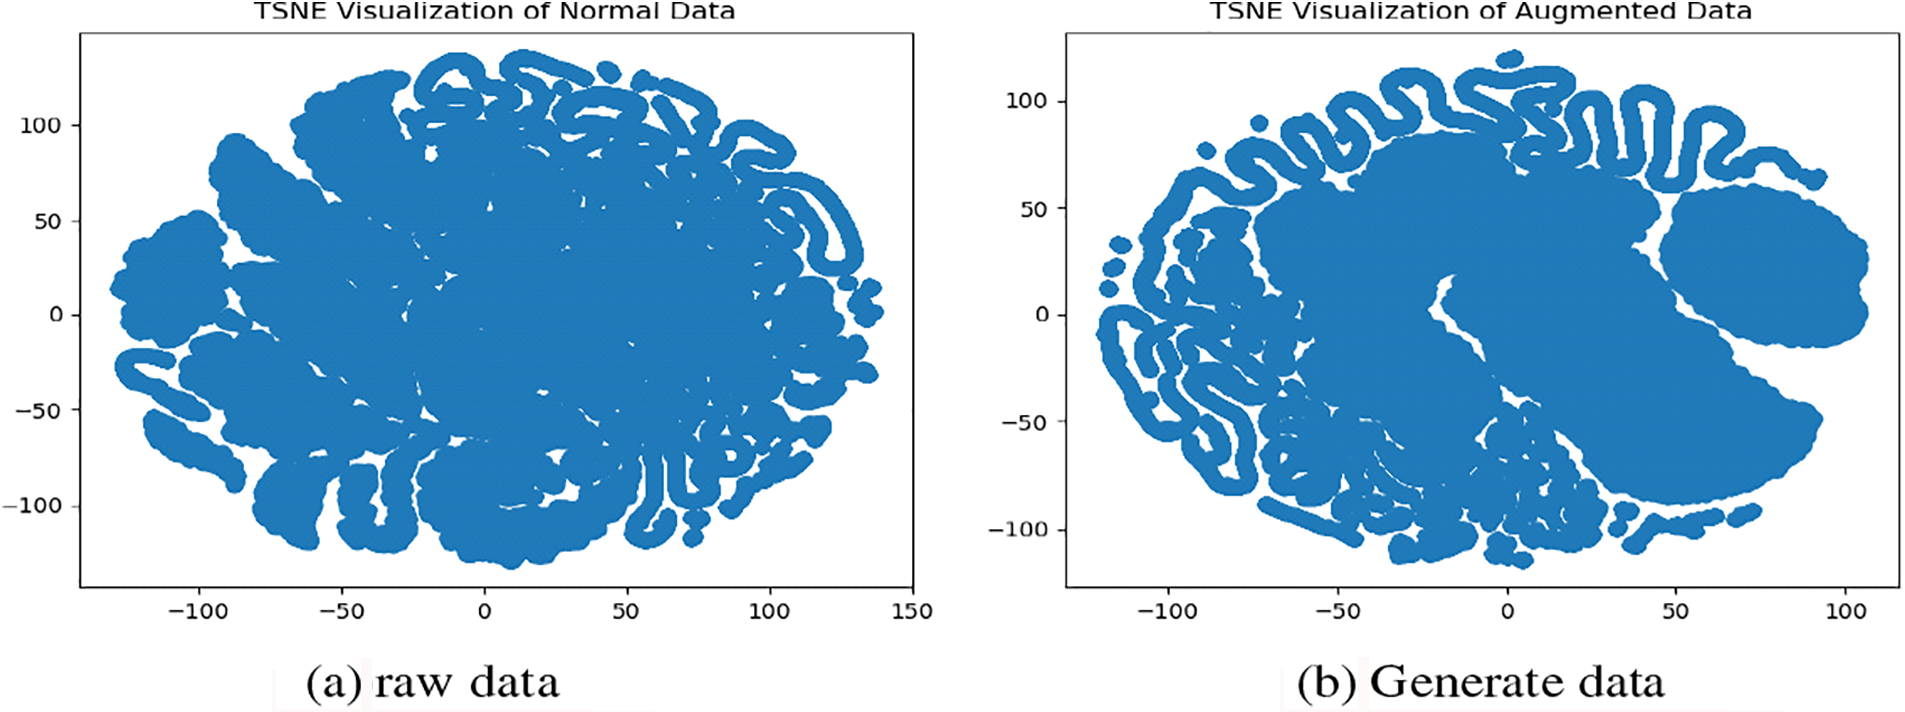
Figure 5: Distribution of CVWG generated data vs. original data on CICDDoS2019
The tanh activation function is applied to the decoder output, normalizing the output to the range of −1 to 1. After experimental validation, the model uses WGAN-GP’s optimizer RMSprop, the learning rate is set to 0.0002, and the batch size is set to 1000 to get the best experimental results, and the training loss diagram of CVWG’s model is shown in Fig. 6.
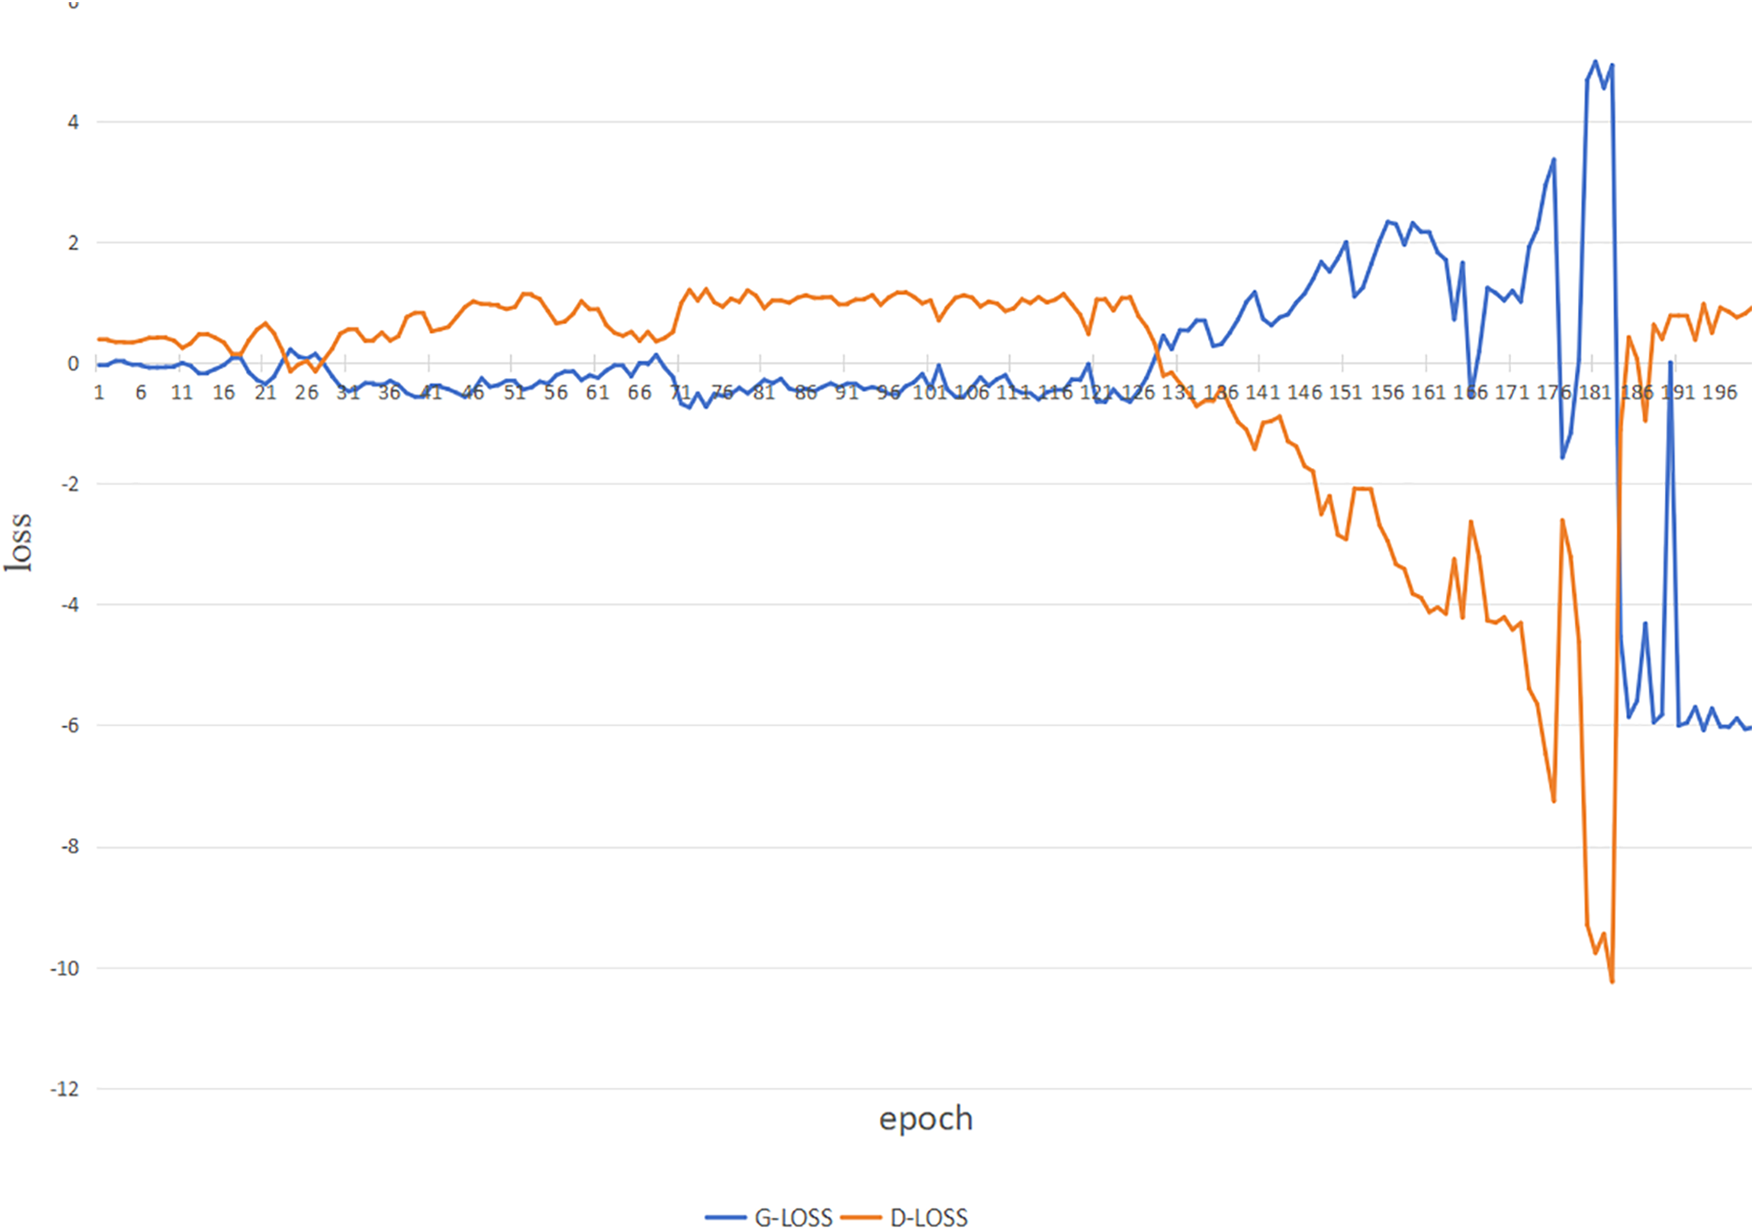
Figure 6: Training loss diagram for CVWG
As shown in Fig. 6, the loss is divided into the discriminator loss and the generator loss, which are in a game with each other, and when they finally meet the threshold value we set at the same time, i.e., when they meet the threshold value we set, then we can use them. Game, and finally, when both meet the threshold value we set, i.e.,
This section gives the classification results and confusion matrix of the data before and after balancing the training set, as shown in Table 6 and Fig. 7, which shows that before balancing in CICDDoS2019, due to the huge difference in the number of data categories, the lowest category’s indexes are 0, and the precision rate of DrDoS_NTP with the most entries is only 0.42, and the indexes of the classification after balancing are significantly improved, and the precision rate and recall rate of most categories can reach 1. The precision and recall of most categories can reach 1.
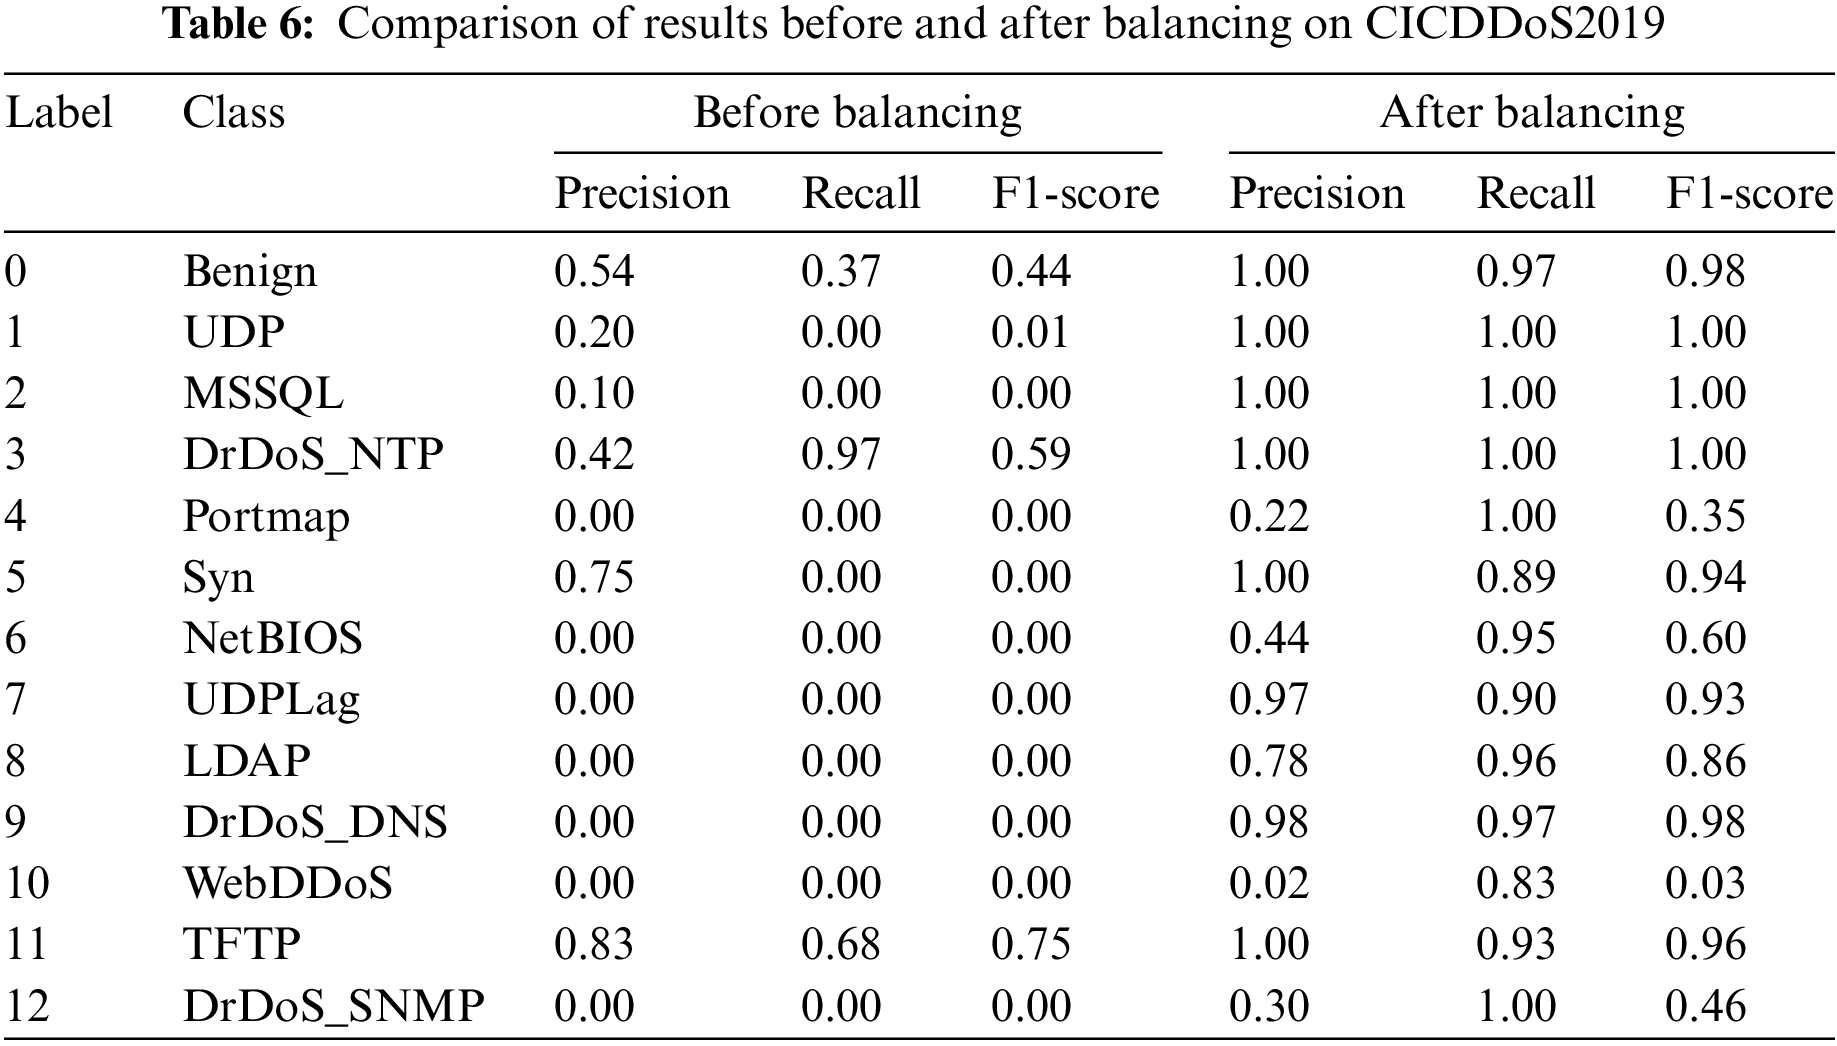
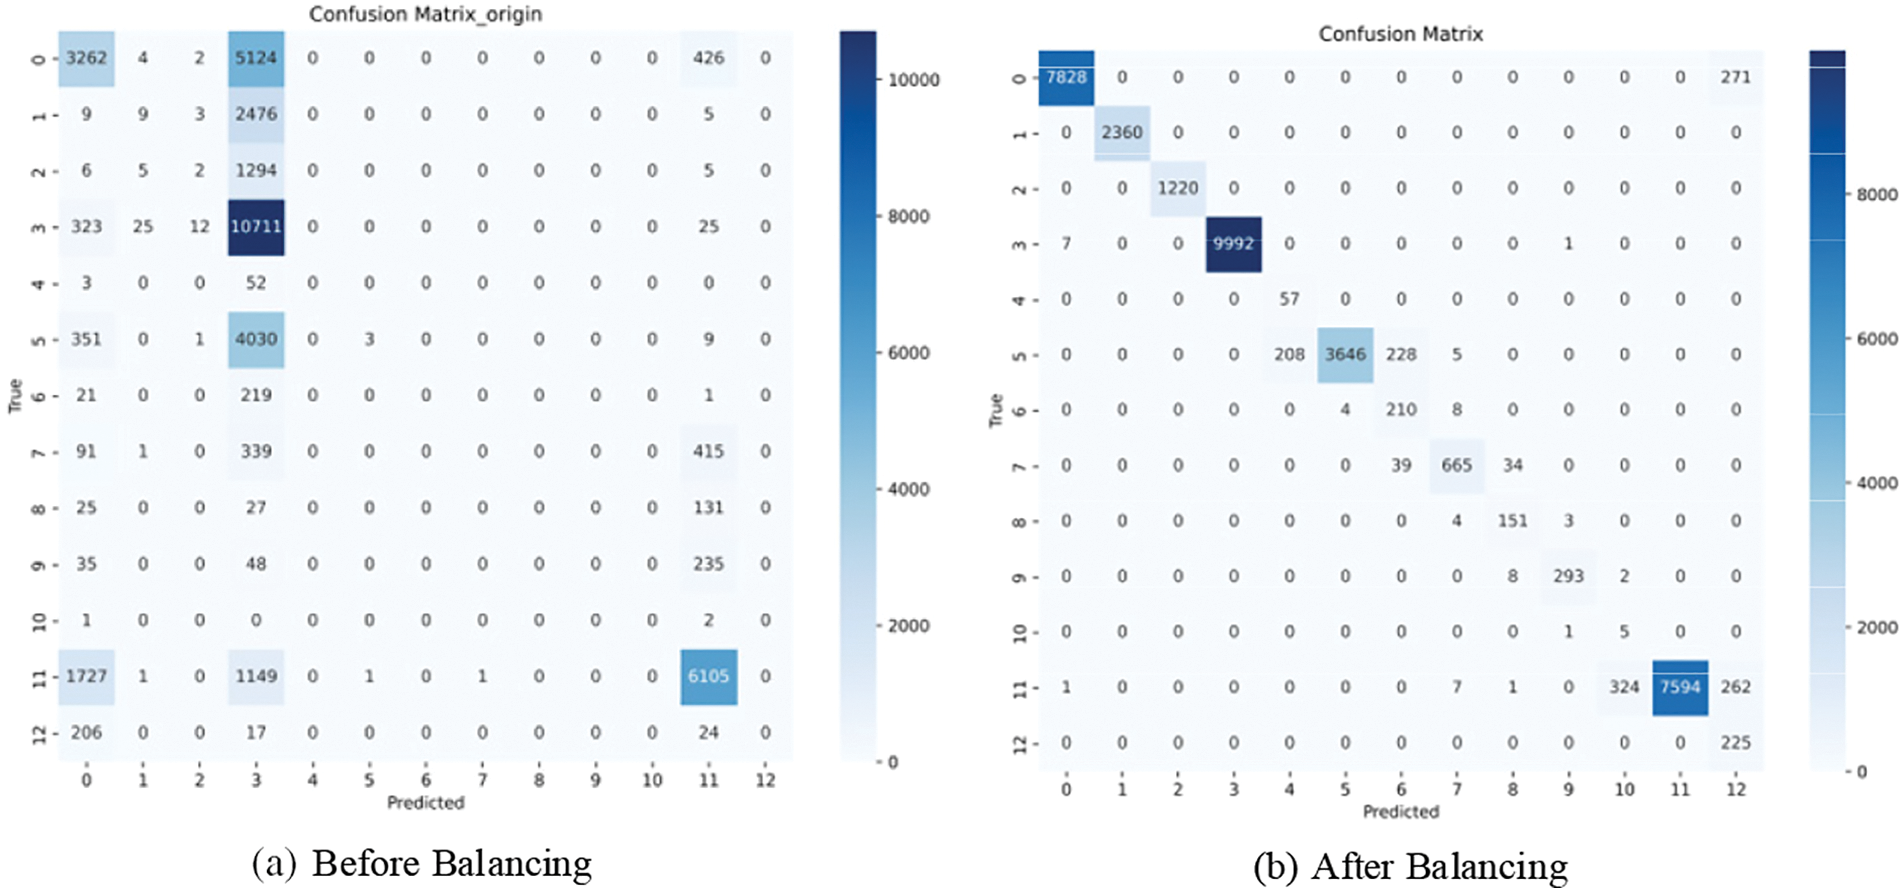
Figure 7: Confusion matrix before and after balancing on CICDDoS2019
As shown in Table 7 and Fig. 8, the indicators of each category increased after balancing in CICIDS 2017, which proves that this model has a better effect on the detection effect.
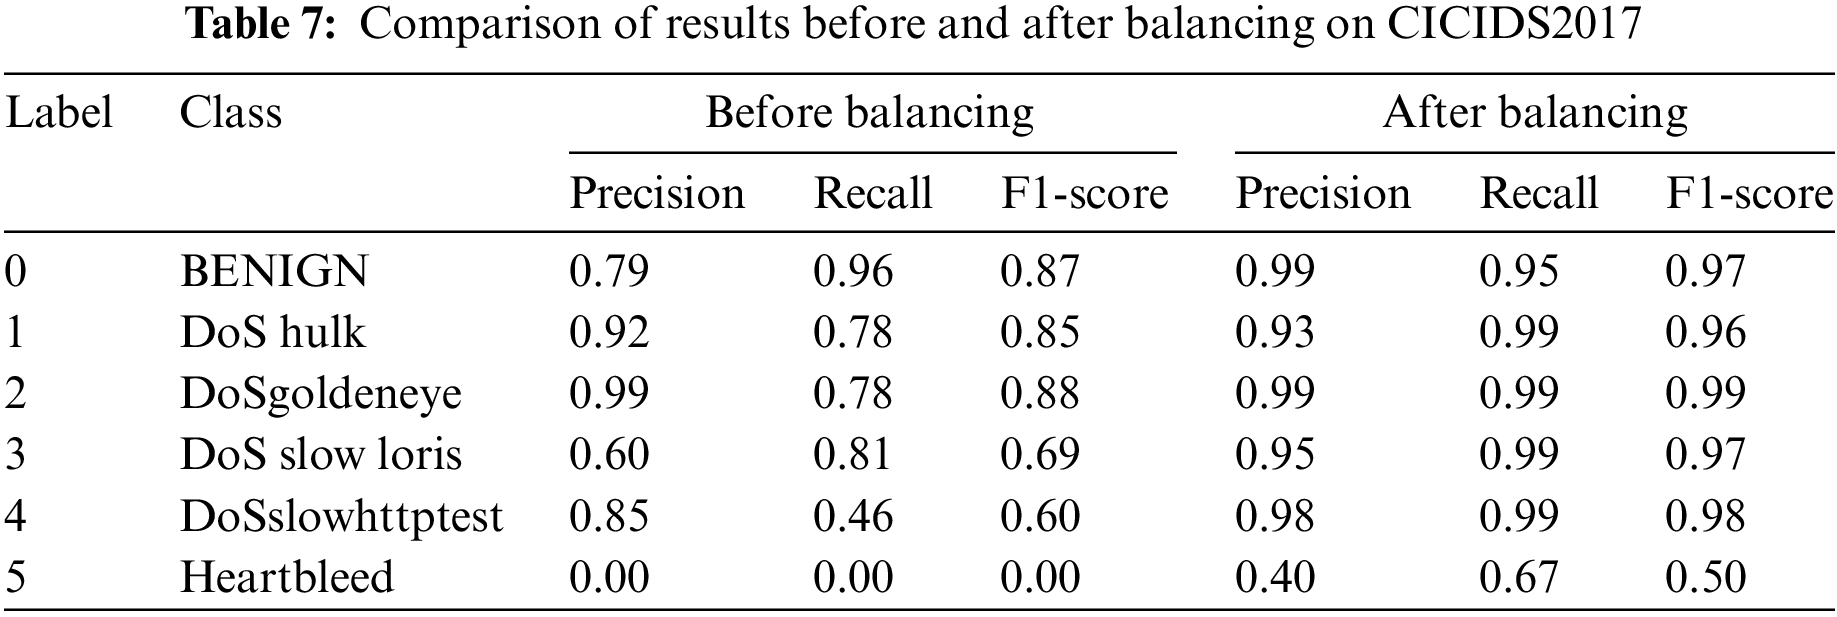
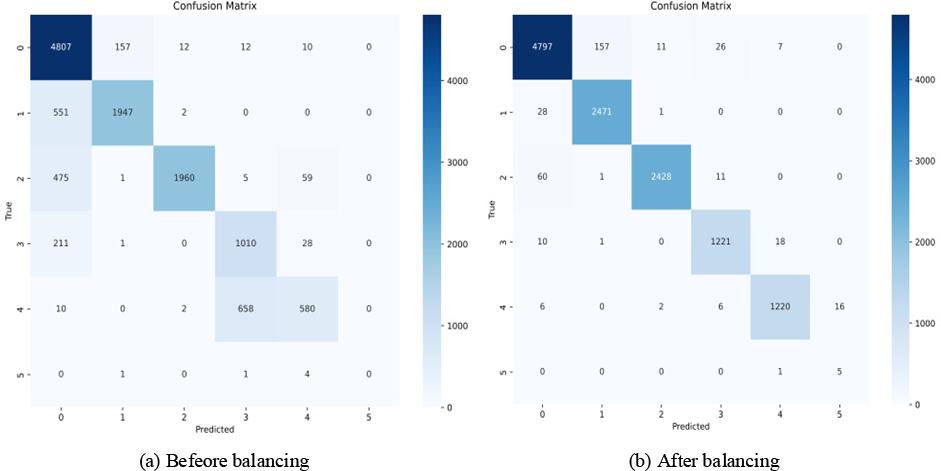
Figure 8: Confusion matrix before and after balancing on CICIDS2017
To verify the performance of each part of the CVWG, this section analyses the contribution of different modules of the CVWG model to the overall performance through ablation experiments, and the final classifiers are all selected from GRU, specifically CVAE, WGAN, GP. The ablation experimental results on the two datasets are shown in Tables 8 and 9, Figs. 9 and 10.
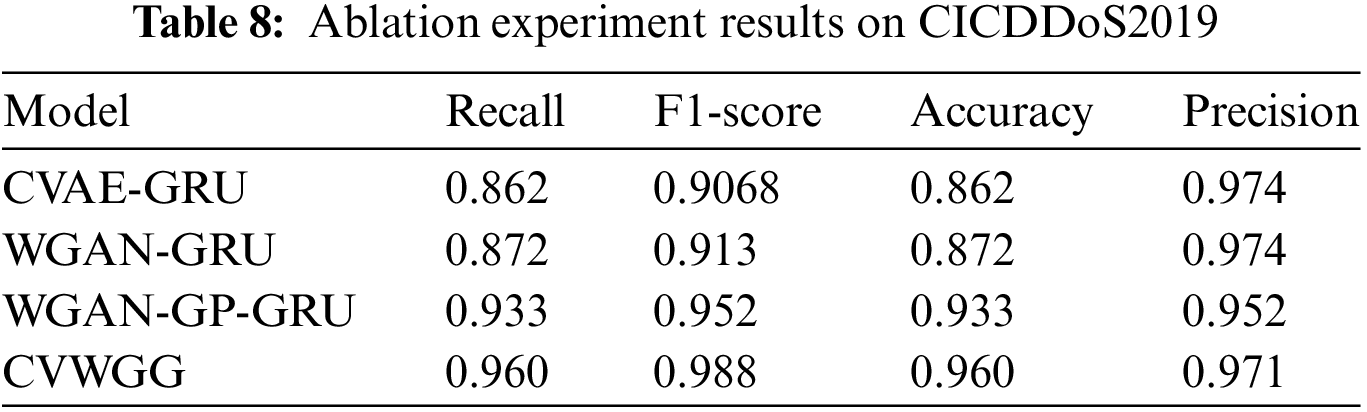
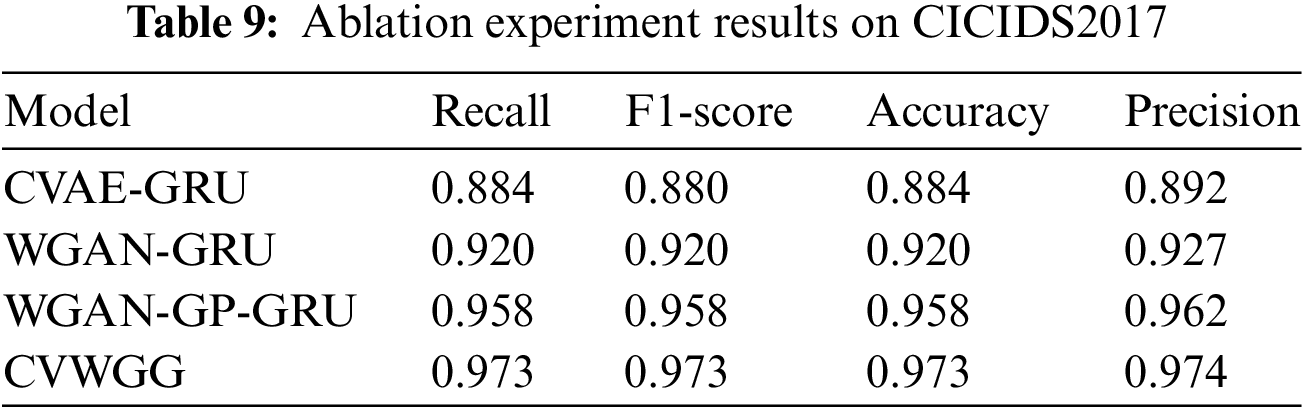
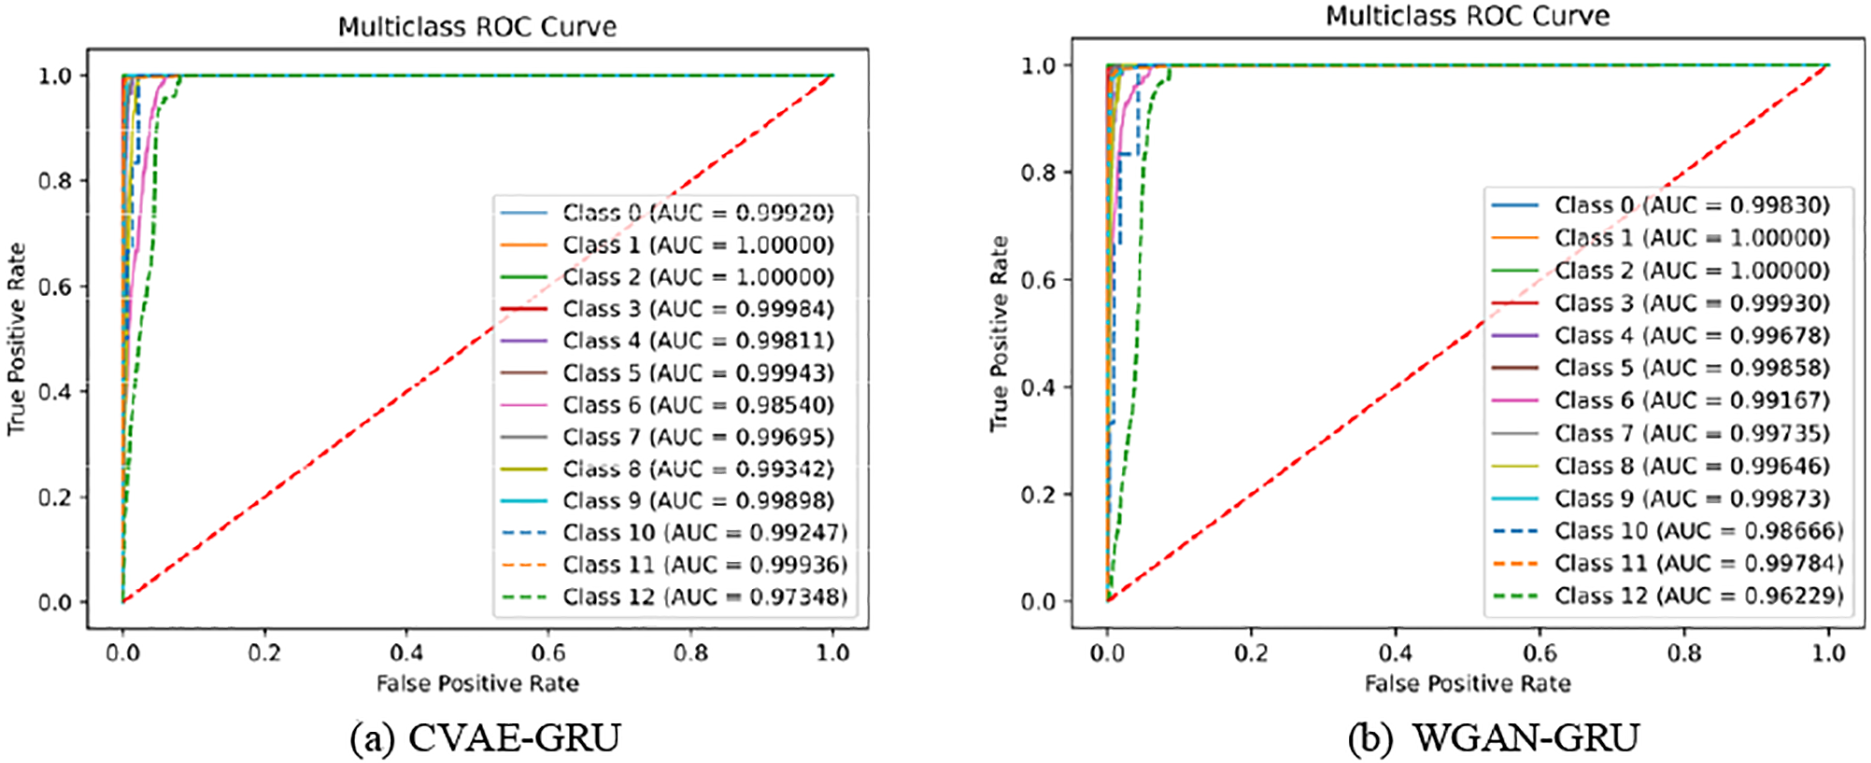
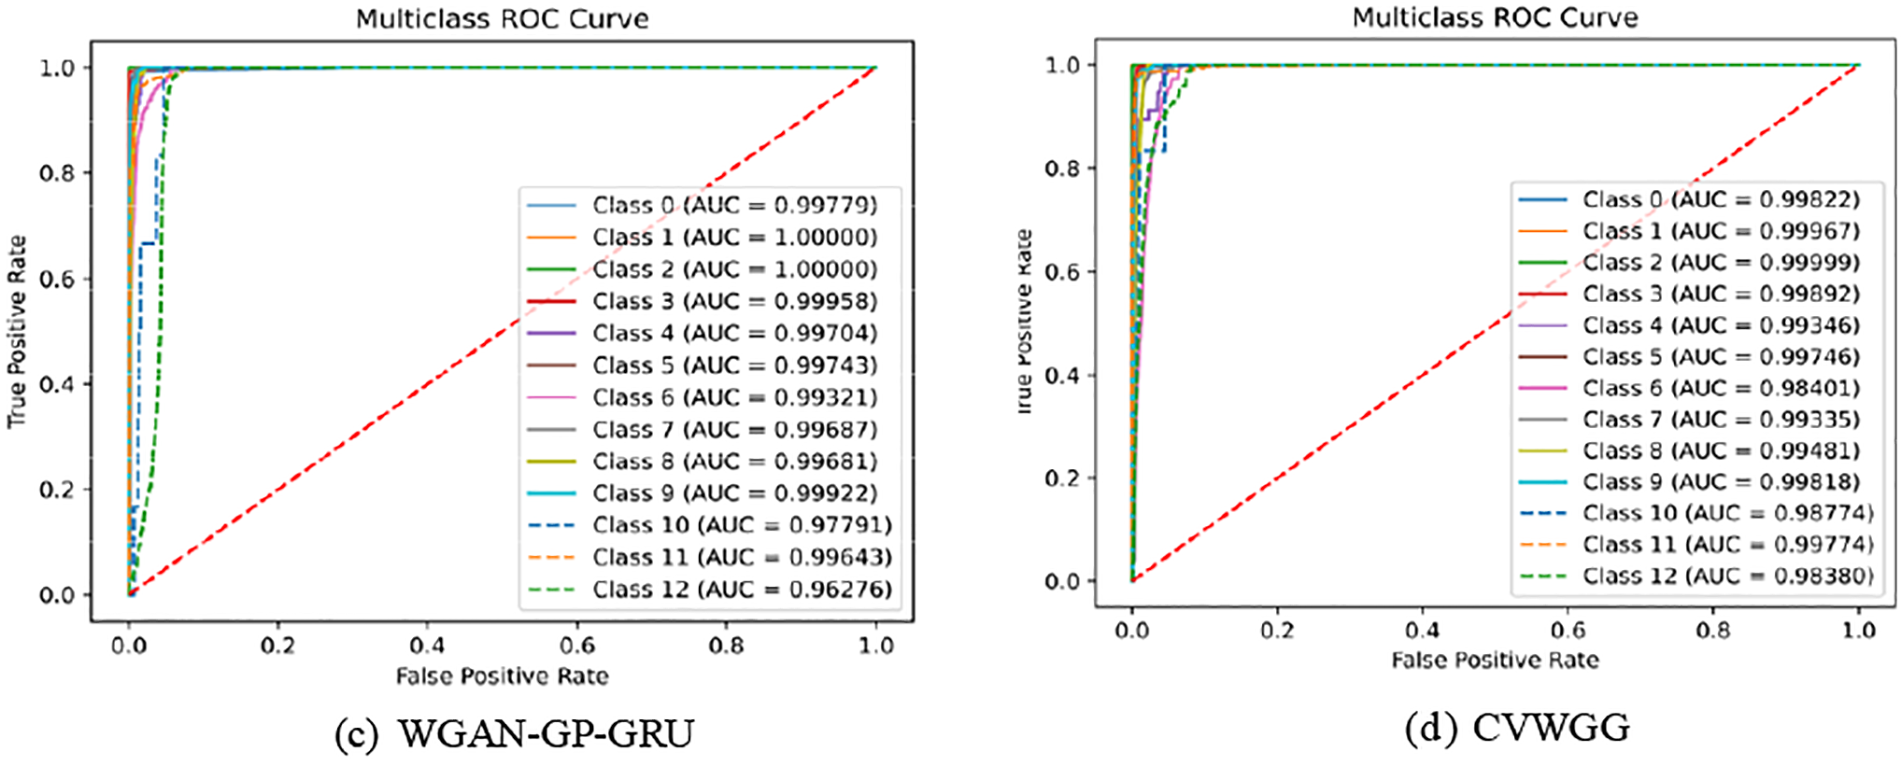
Figure 9: Ablation experiment result on CICDDoS2019
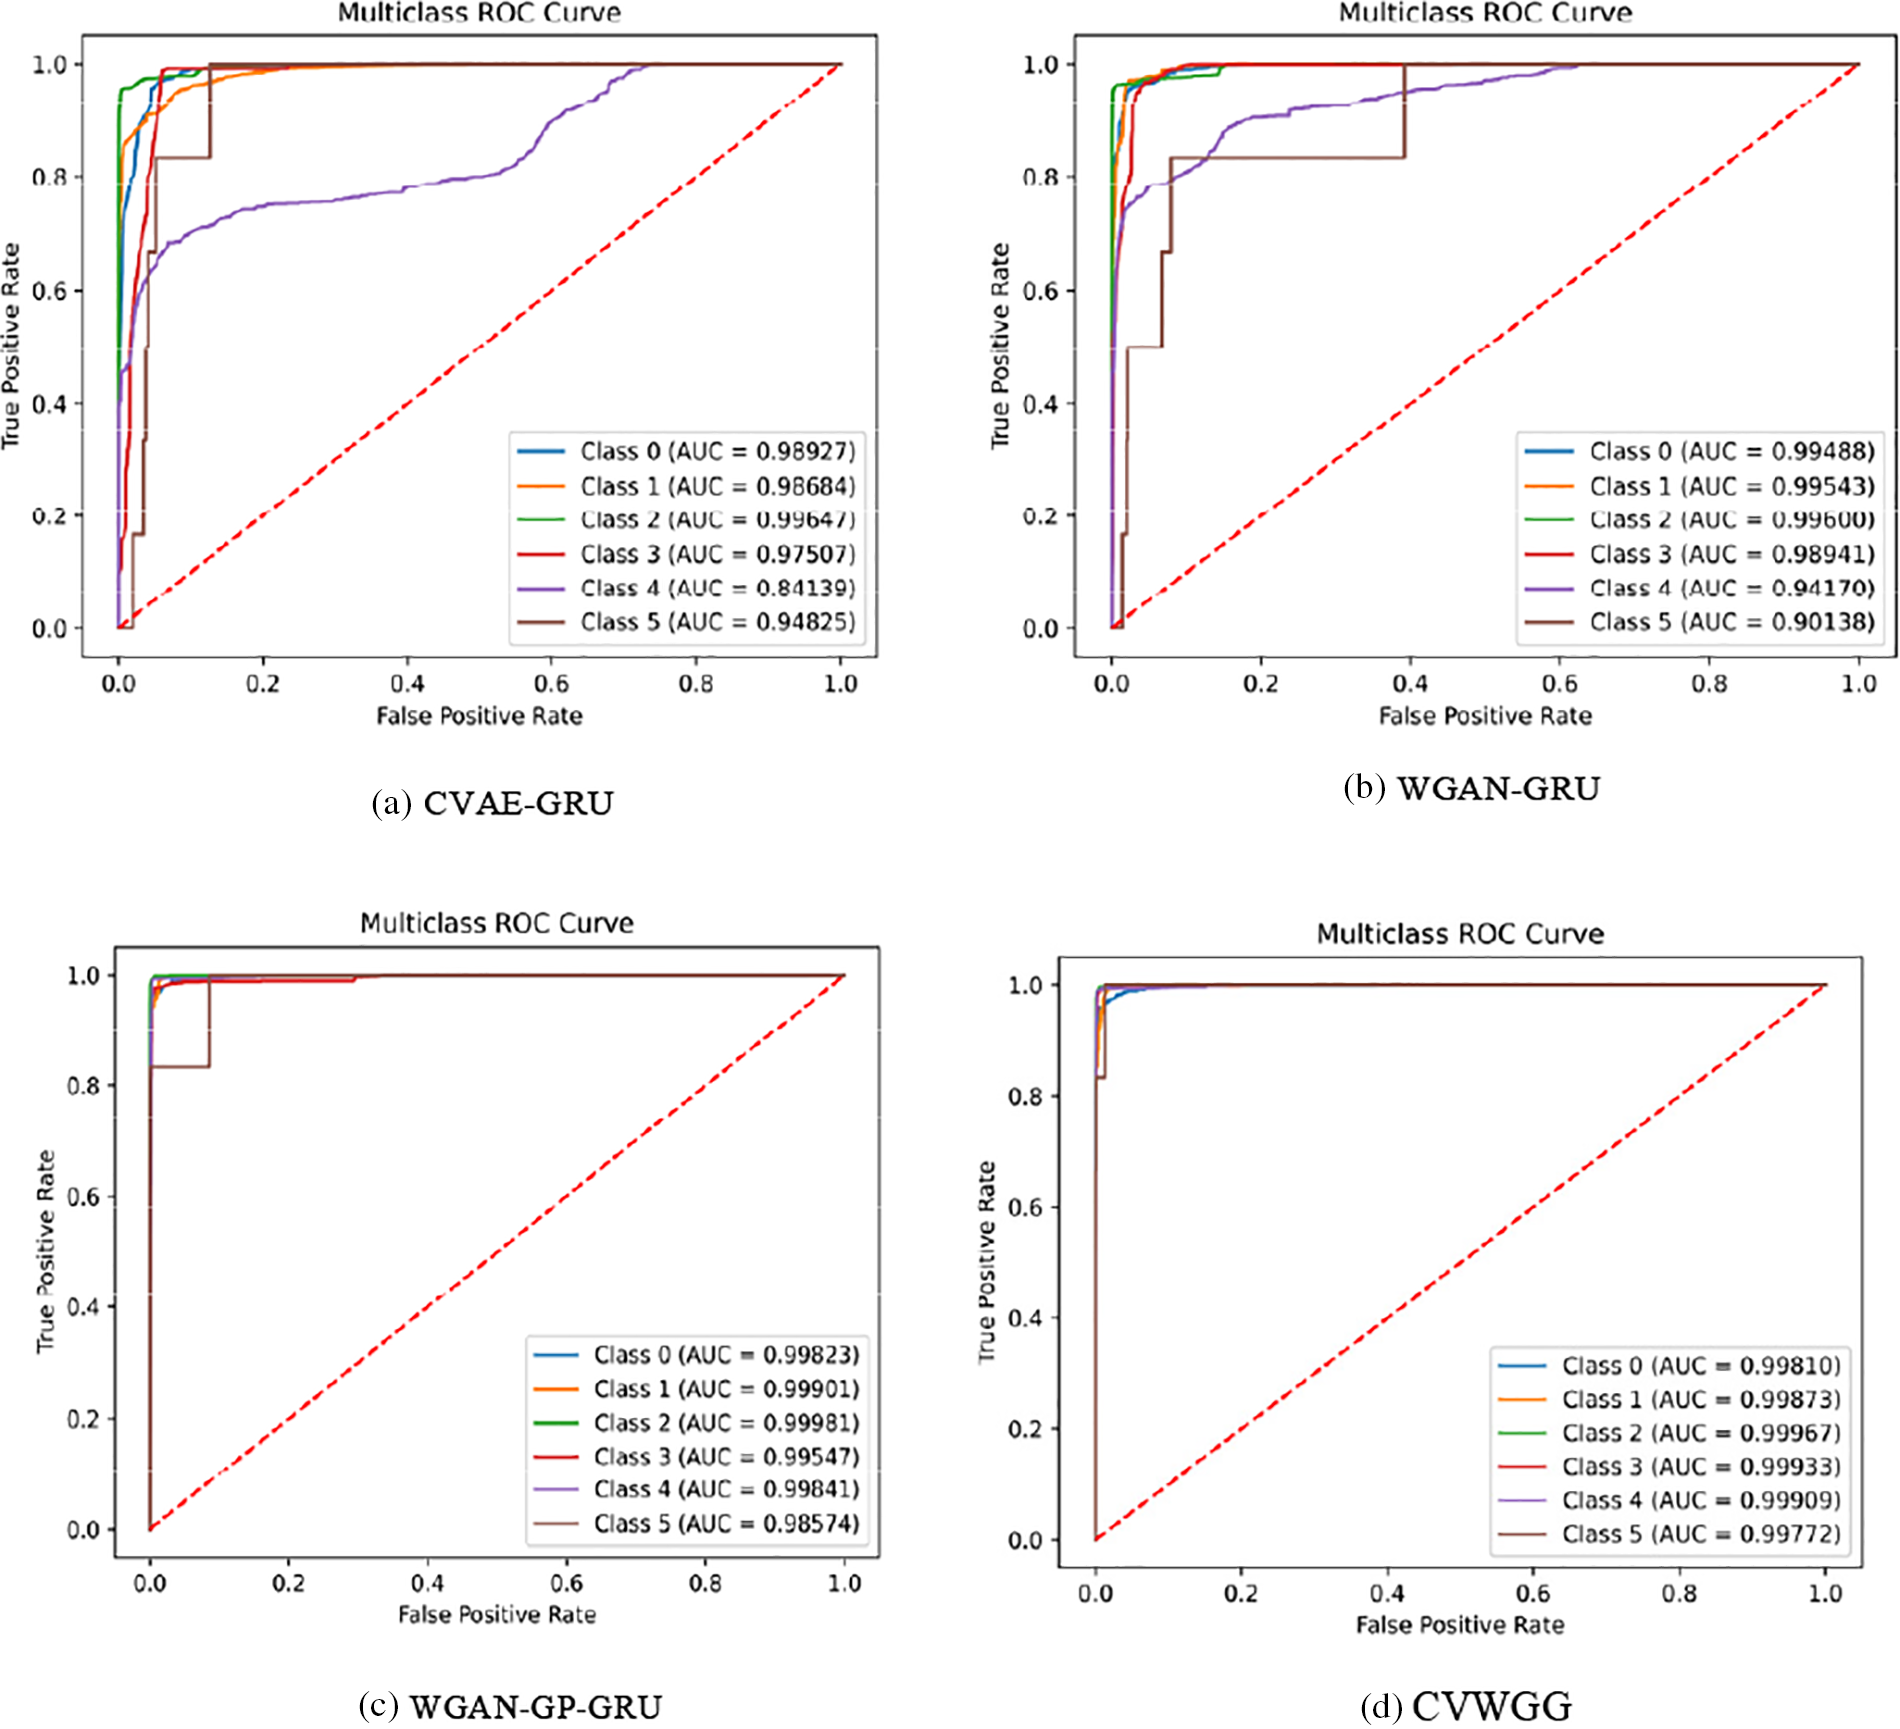
Figure 10: Ablation experiment result on CICIDS2017
As can be seen, on CICDDoS2019, the classification accuracy was 0.862 when using only CVAE and 0.872 when using only WGAN. on CICIDS2017, the classification accuracy was 0.884 when using only CVAE and 0.920 when using only WGAN. After incorporating the CVWG model, all index values of the model have improved, indicating that the combination of the CVAE, the WGAN and the GP techniques significantly enhances the model’s accuracy. In this paper, we combine the WGAN and GP techniques to address data imbalance, demonstrating that this approach is the most effective.
The impact of the CVWG-based data enhancement algorithm CVWGG with B-GAN [19], LCVAEGAN [20], WGAN-DIV-XGBoost [21], WCGAN-GP-XGBoost [22] and ADASYN [23] data enhancement methods on the model performance of DDoS attack detection is compared. The GRU model is trained using the balanced training set of the above data enhancement algorithms, and the detection effect of the model is shown in Tables 10 and 11, Figs. 11 and 12.
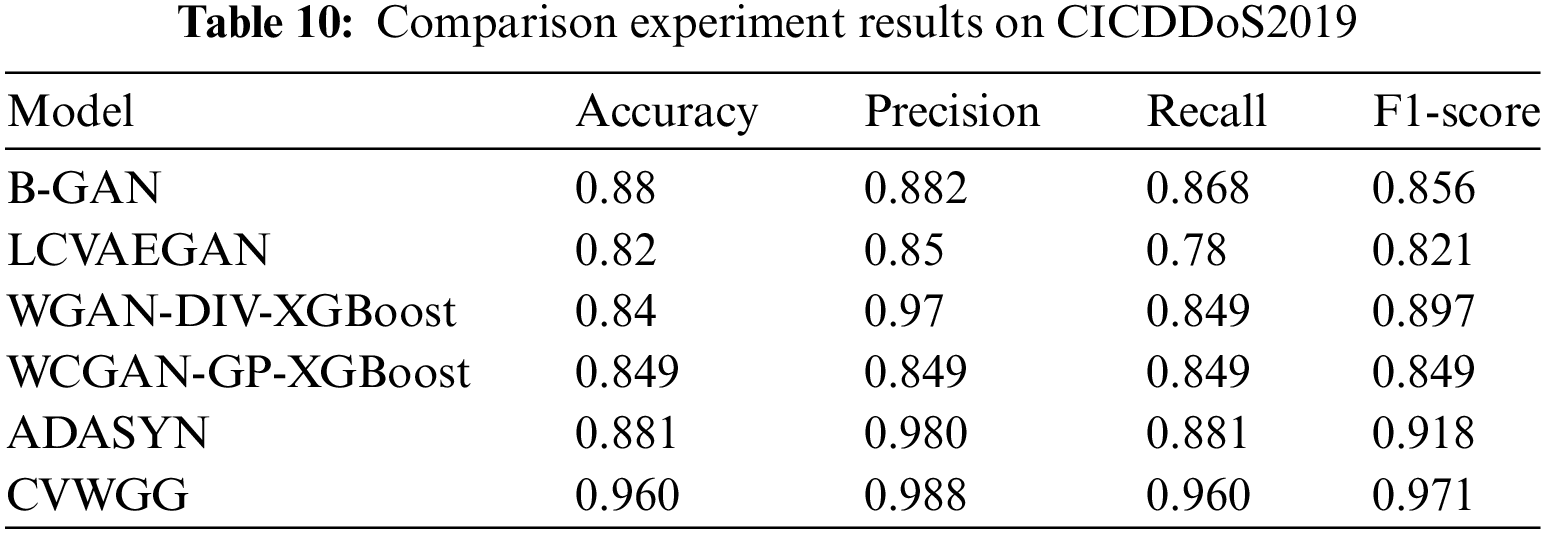
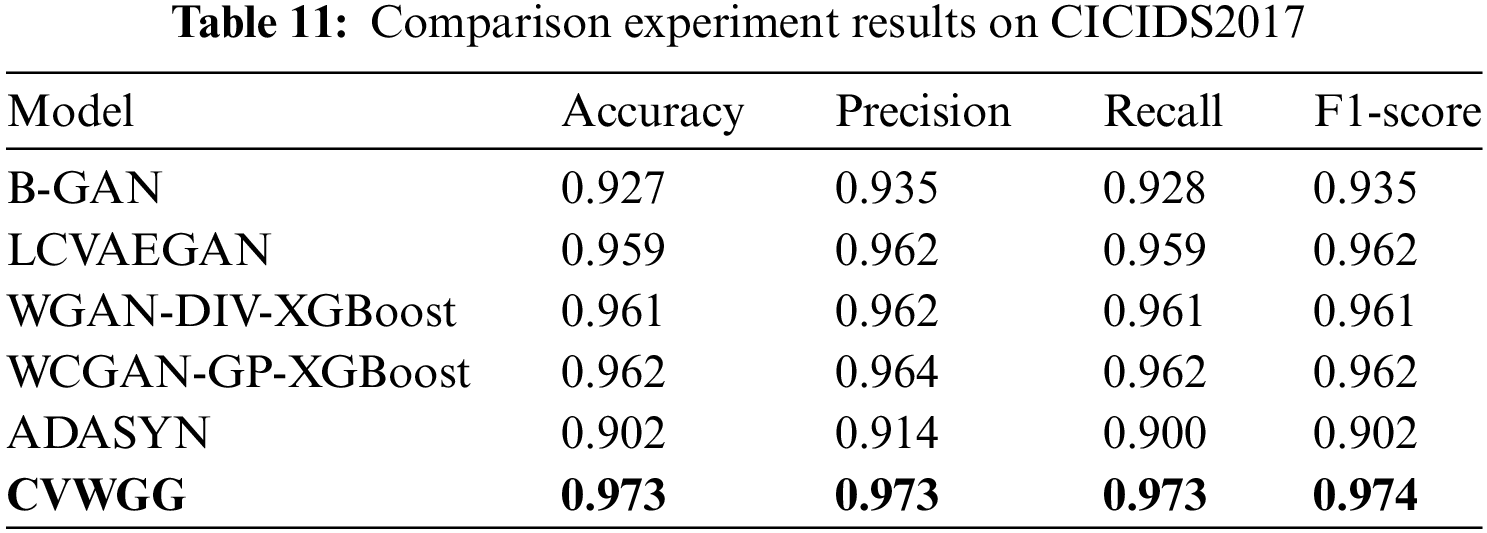
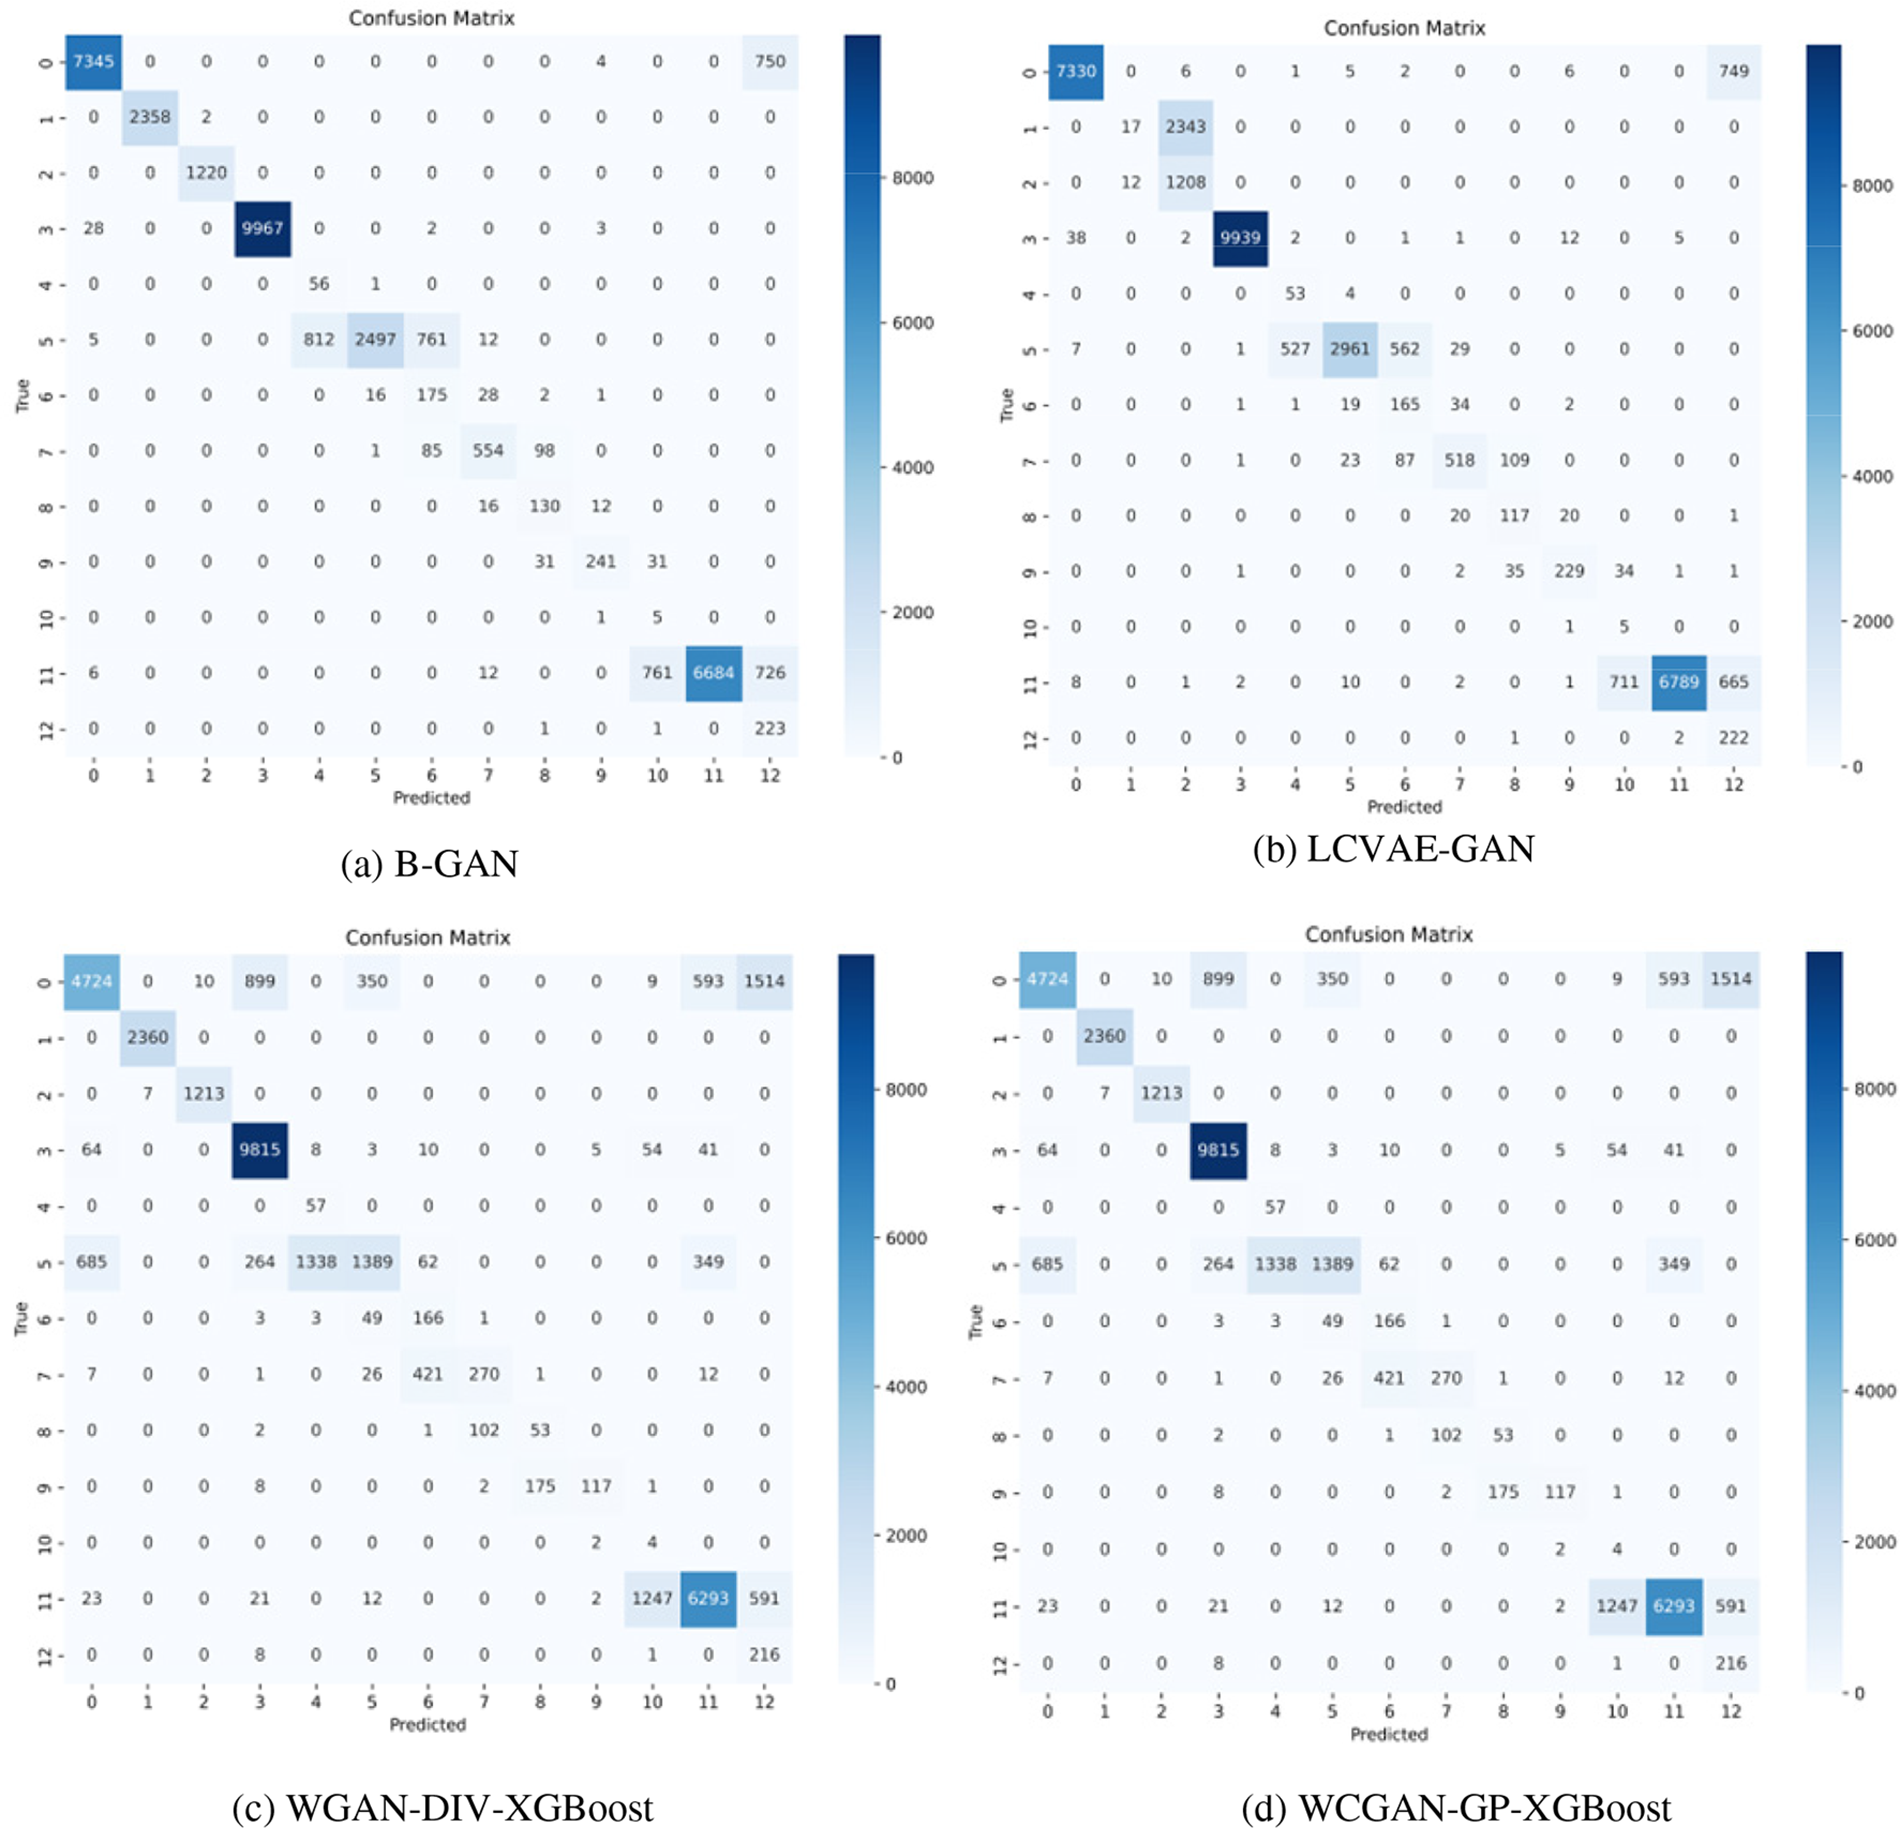
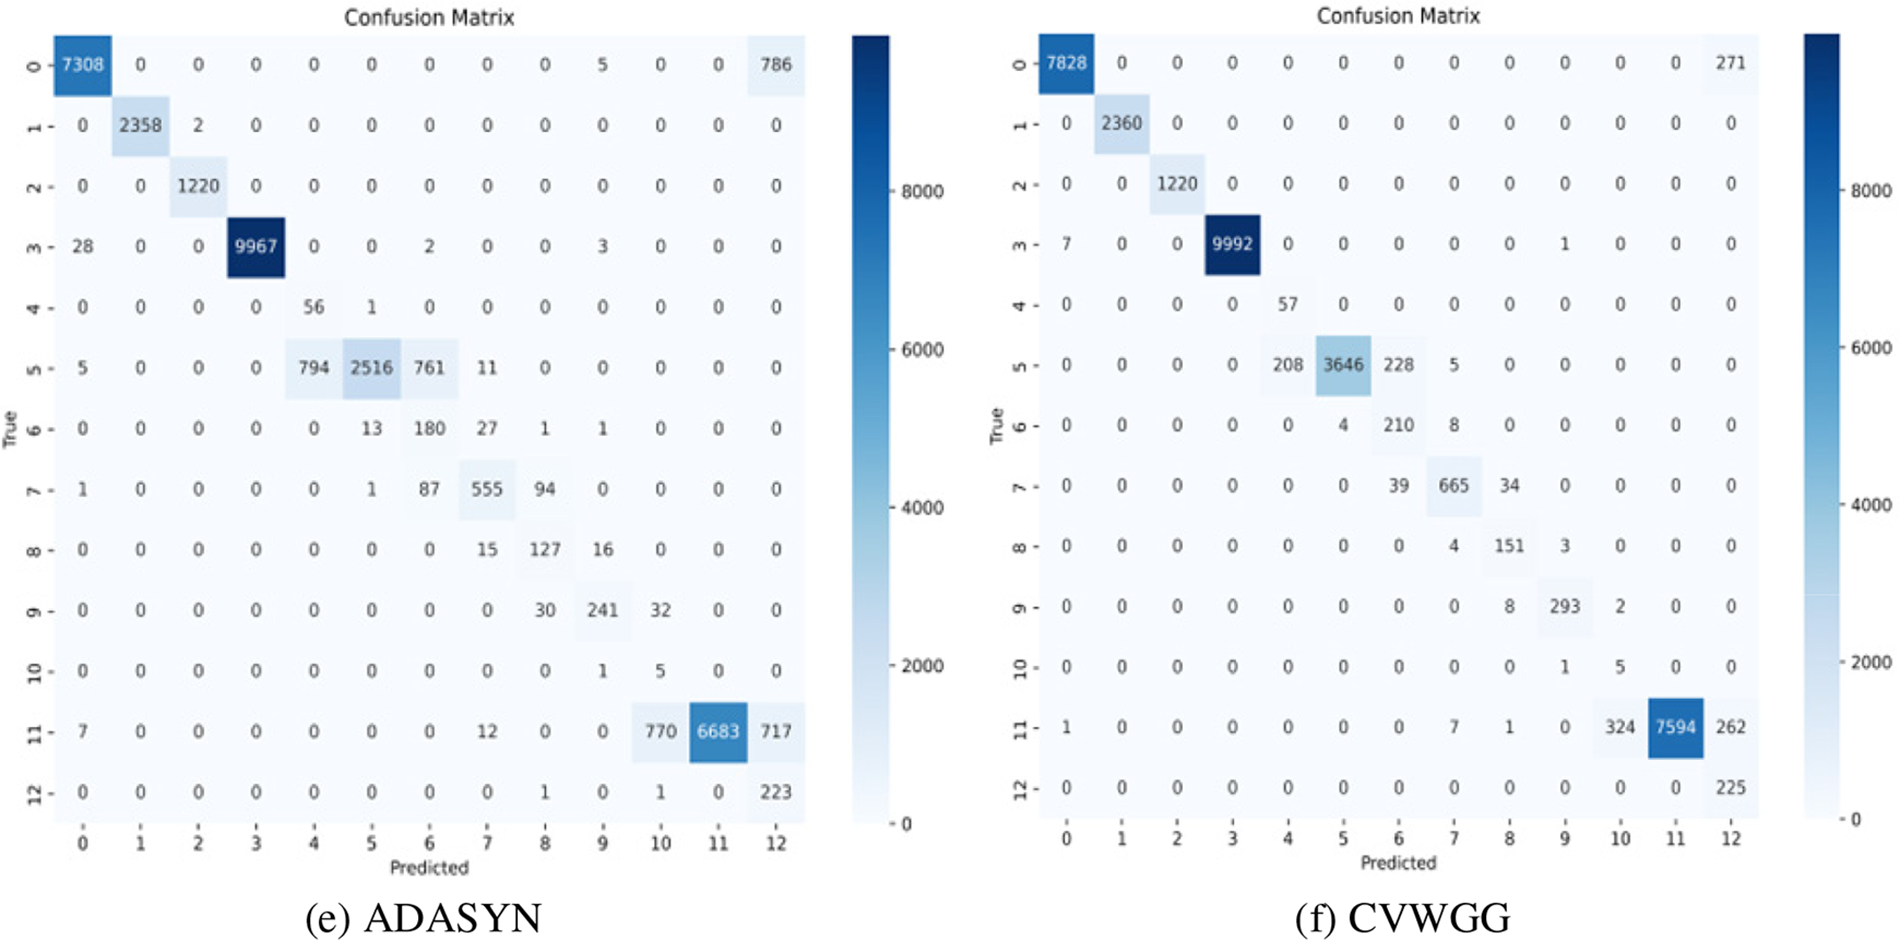
Figure 11: Comparison experiment results on CICDDoS2019
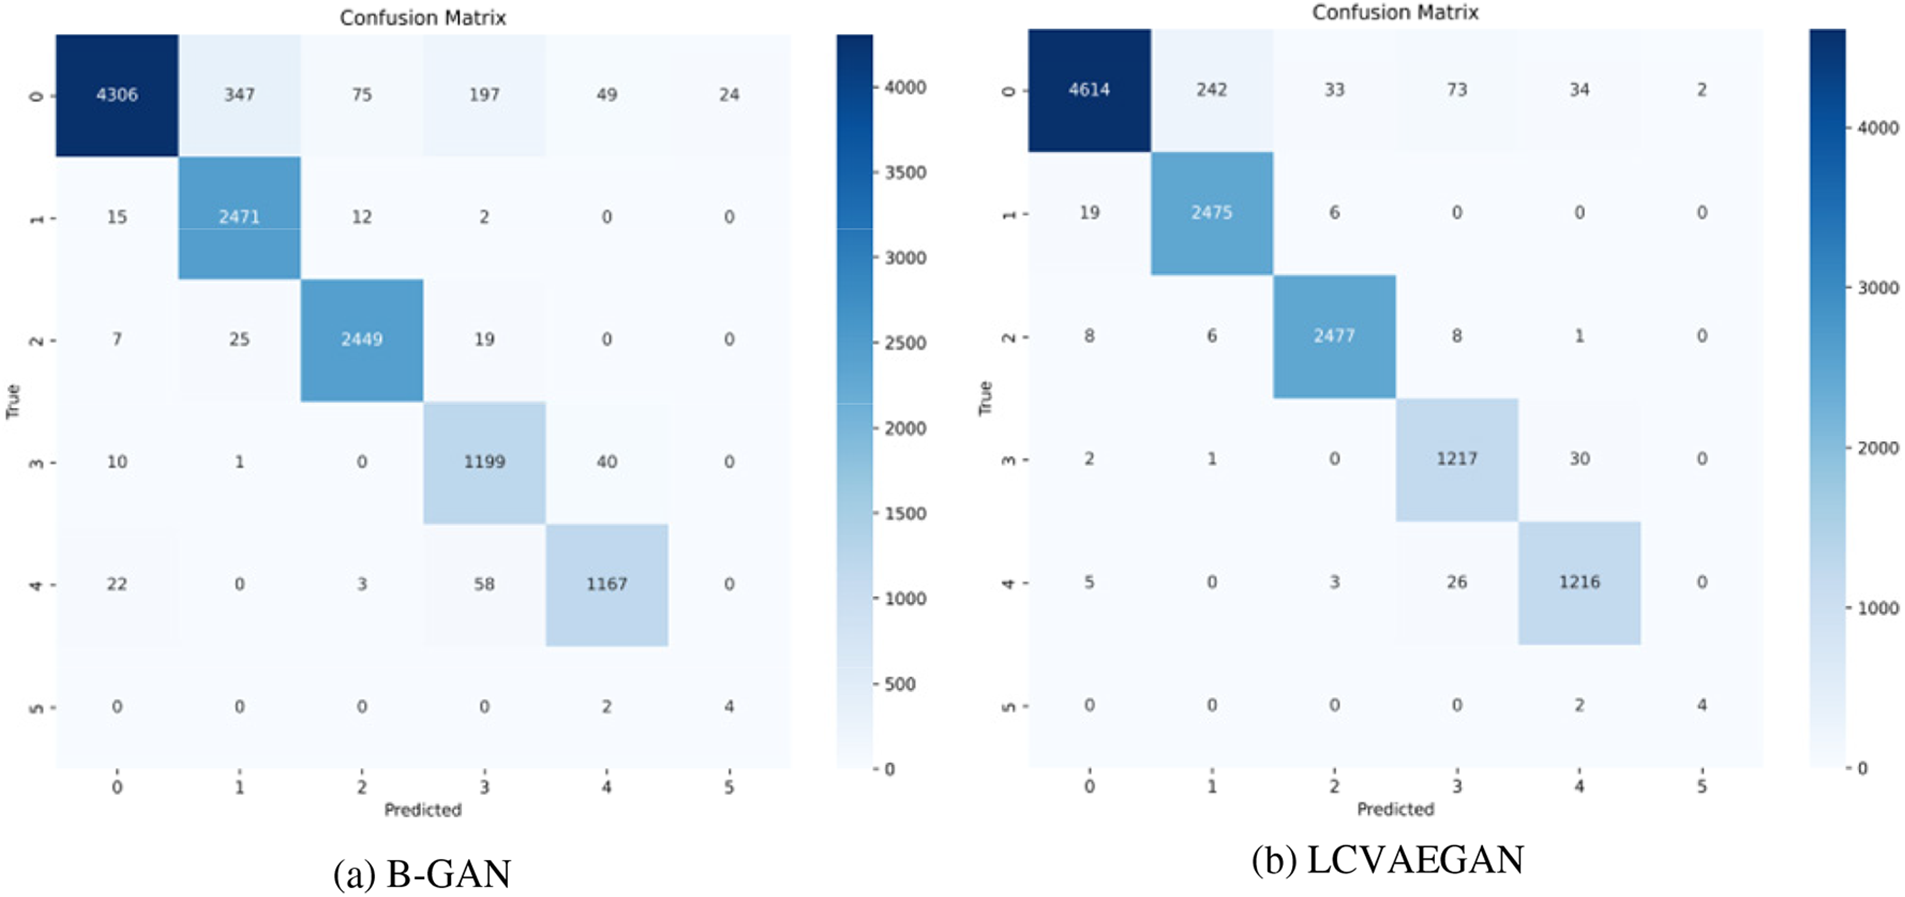
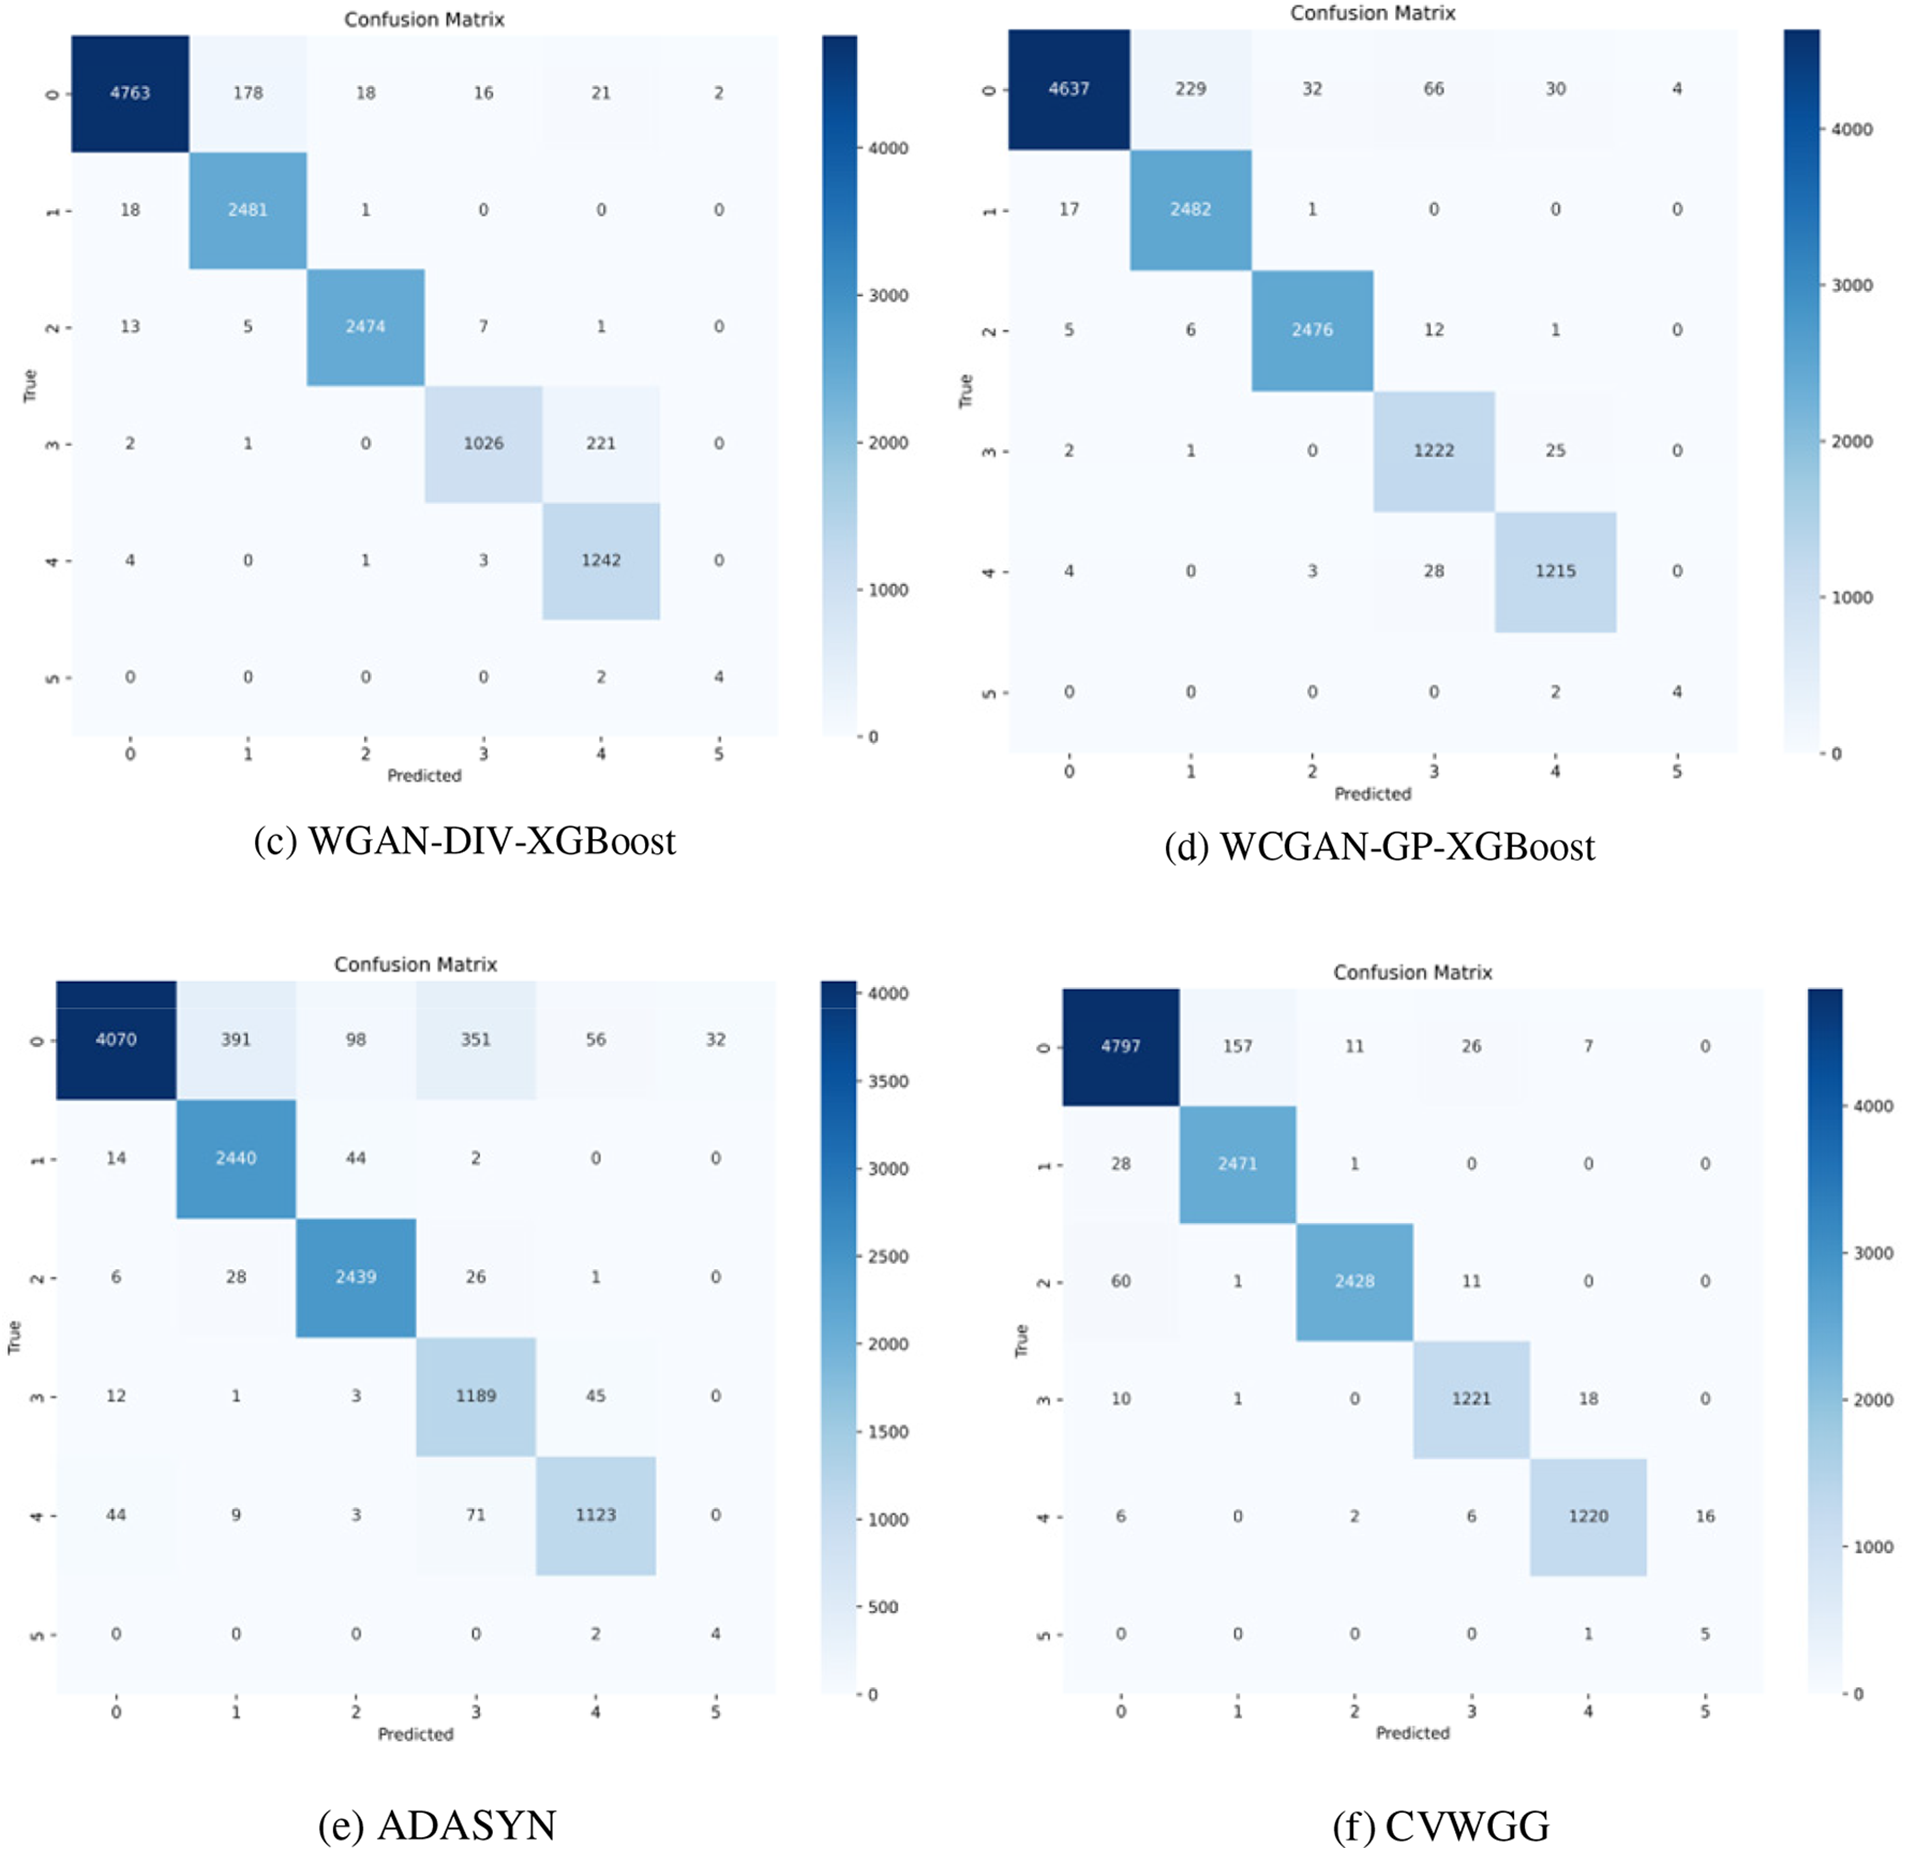
Figure 12: Confusion matrix for comparison experiments on CICIDS2017
From the results of CICDDoS2019 experiments, the model CVWGG, enhanced using CVWG model data, achieves better results in terms of accuracy, precision, F1-score, and recall, with an accuracy rate that is eight percentage points higher than that of using BGAN, 14 percentage points higher than that of LCVAEGAN, 12 percentage points higher than that of WGAN-DIV-XGBoost,11.1 percentage points higher than that of WCGAN-GP-XGBoost and 7.9 percentage points higher than that of ADASYN.
It can be obtained from the experimental results of CICIDS2017 in Table 11 and Fig. 12 the model CVWGG, which was enhanced using the CVWG model data, achieved better results in terms of accuracy, precision, F1 score and recall, with an accuracy rate that was 4.6 percentage points higher than that of using BGAN, 1.4 percentage points higher than that of LCVAEGAN, 1.2 percentage points higher than that of WGAN-DIV-XGBoost, 1.1 percentage points higher than that of WCGAN-GP-XGBoost, and 7.1 percentage points higher than that of ADASYN. It can be concluded that this model can achieve good results in the differentiation of DDoS on the two datasets.
4.2.5 Model Accuracy and Loss Experiments
This model training was conducted on CICDDoS2019 and CICIDS2017, the loss and accuracy are shown in Figs. 13 and 14. It can be seen that the loss is less than 0.05, the accuracy can reach 0.96 on CICDDoS2019, and the loss is less than 0.1, the accuracy can reach 0.973 on CICIDS2017.
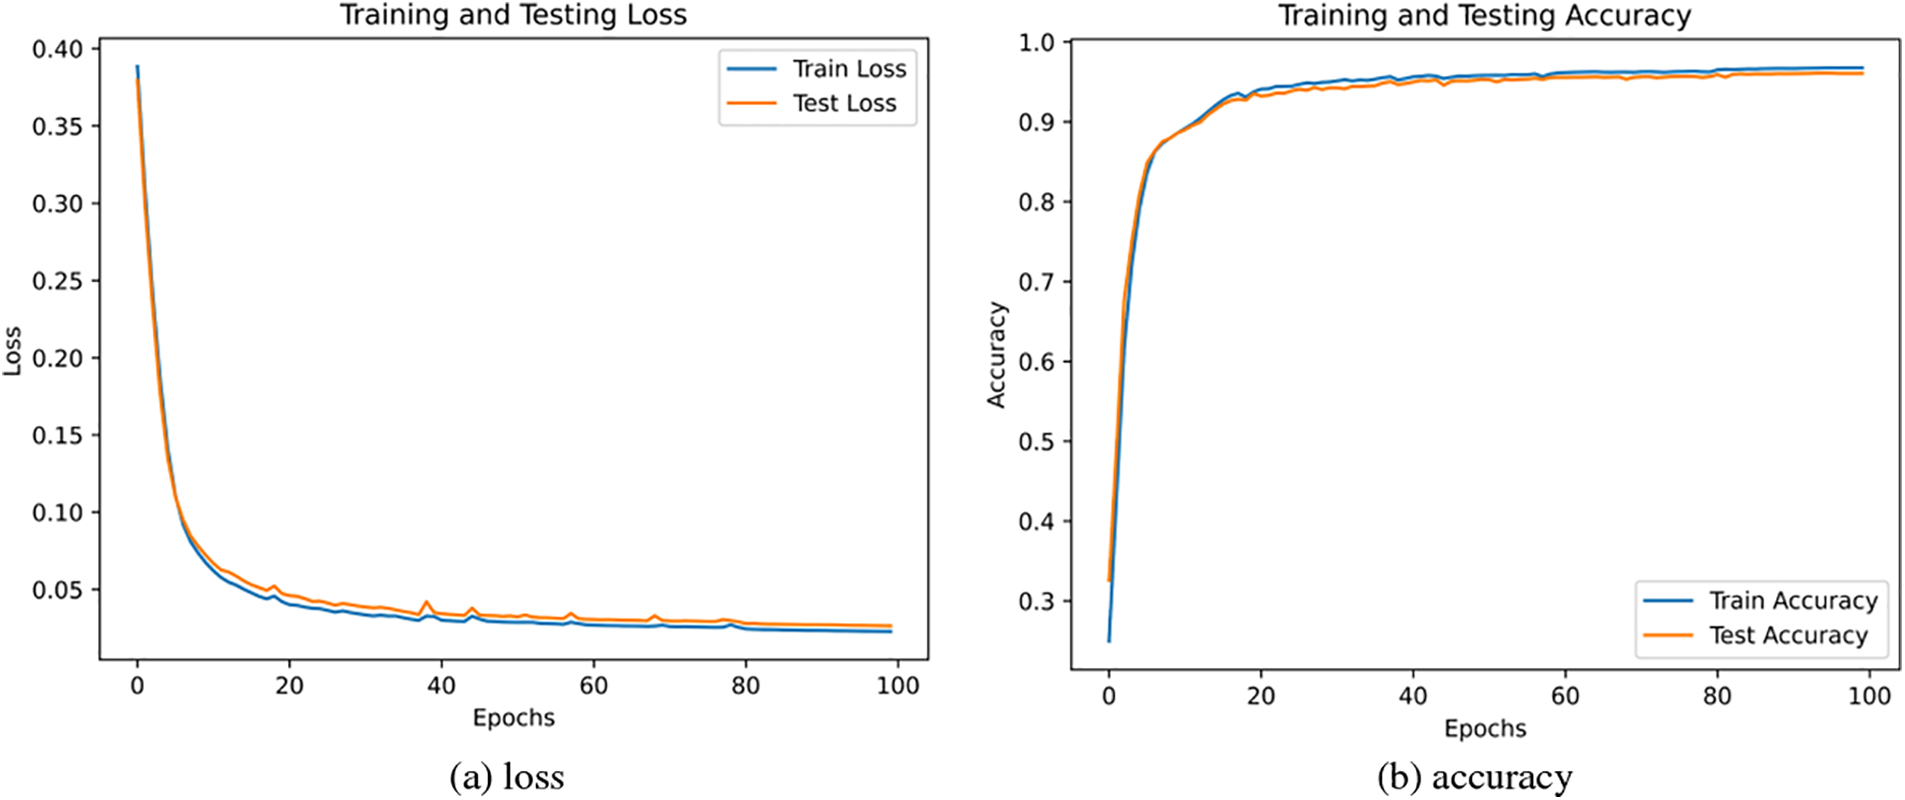
Figure 13: Loss and accuracy on CICDDoS2019
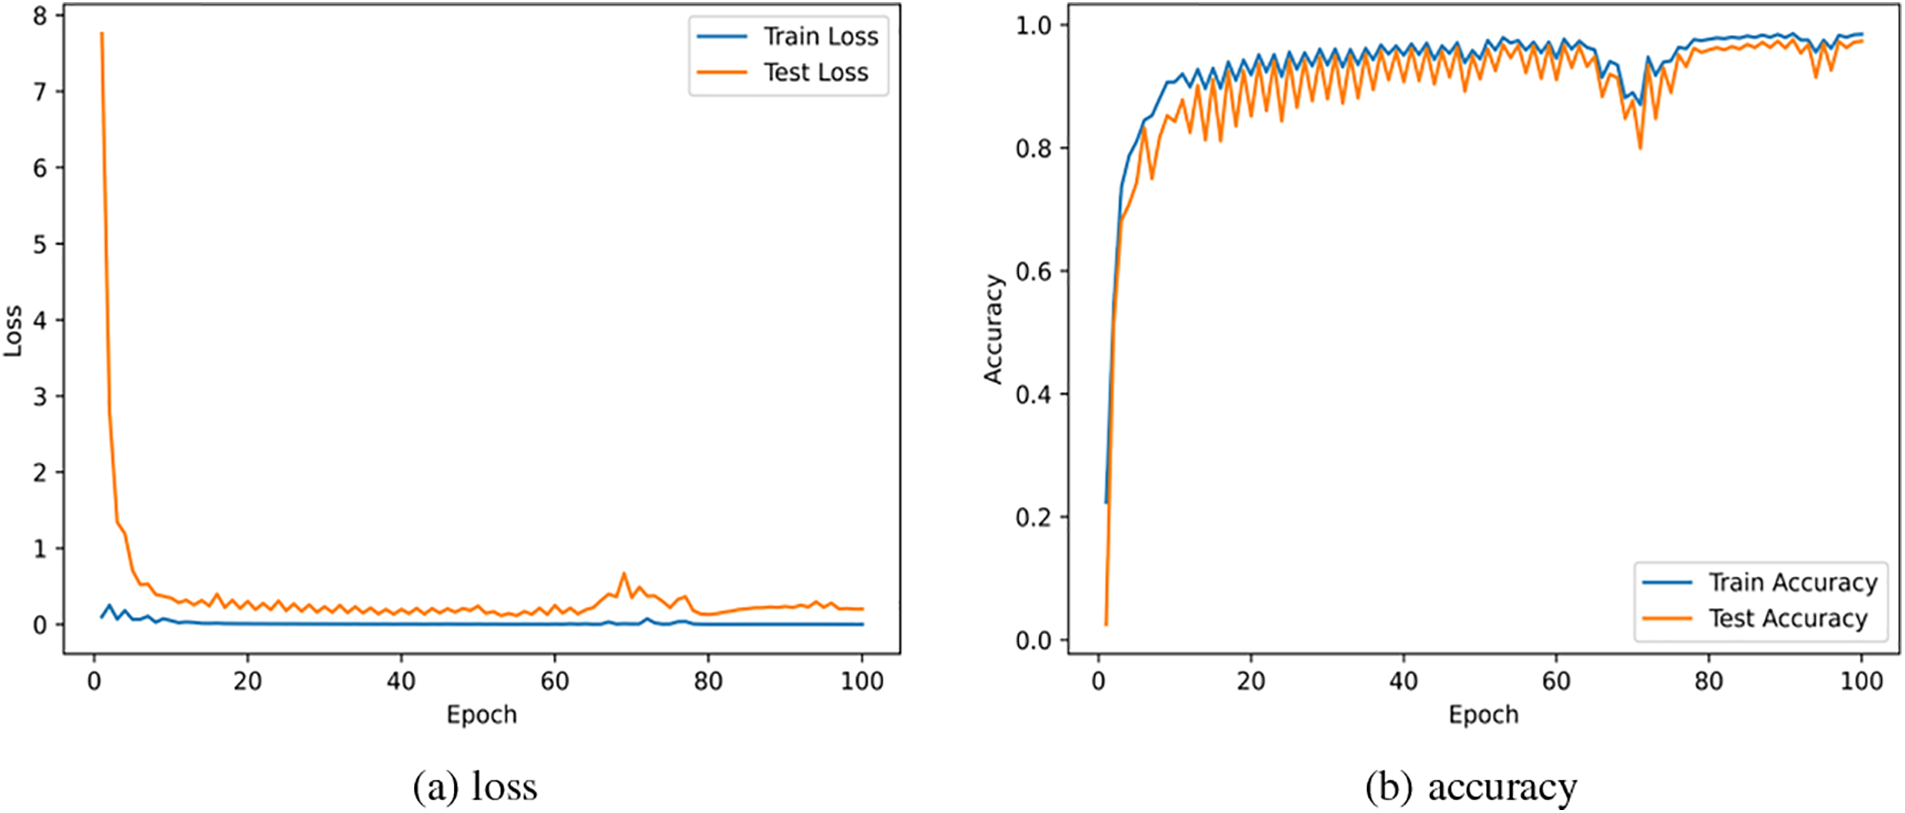
Figure 14: Loss and accuracy on CICIDS2017
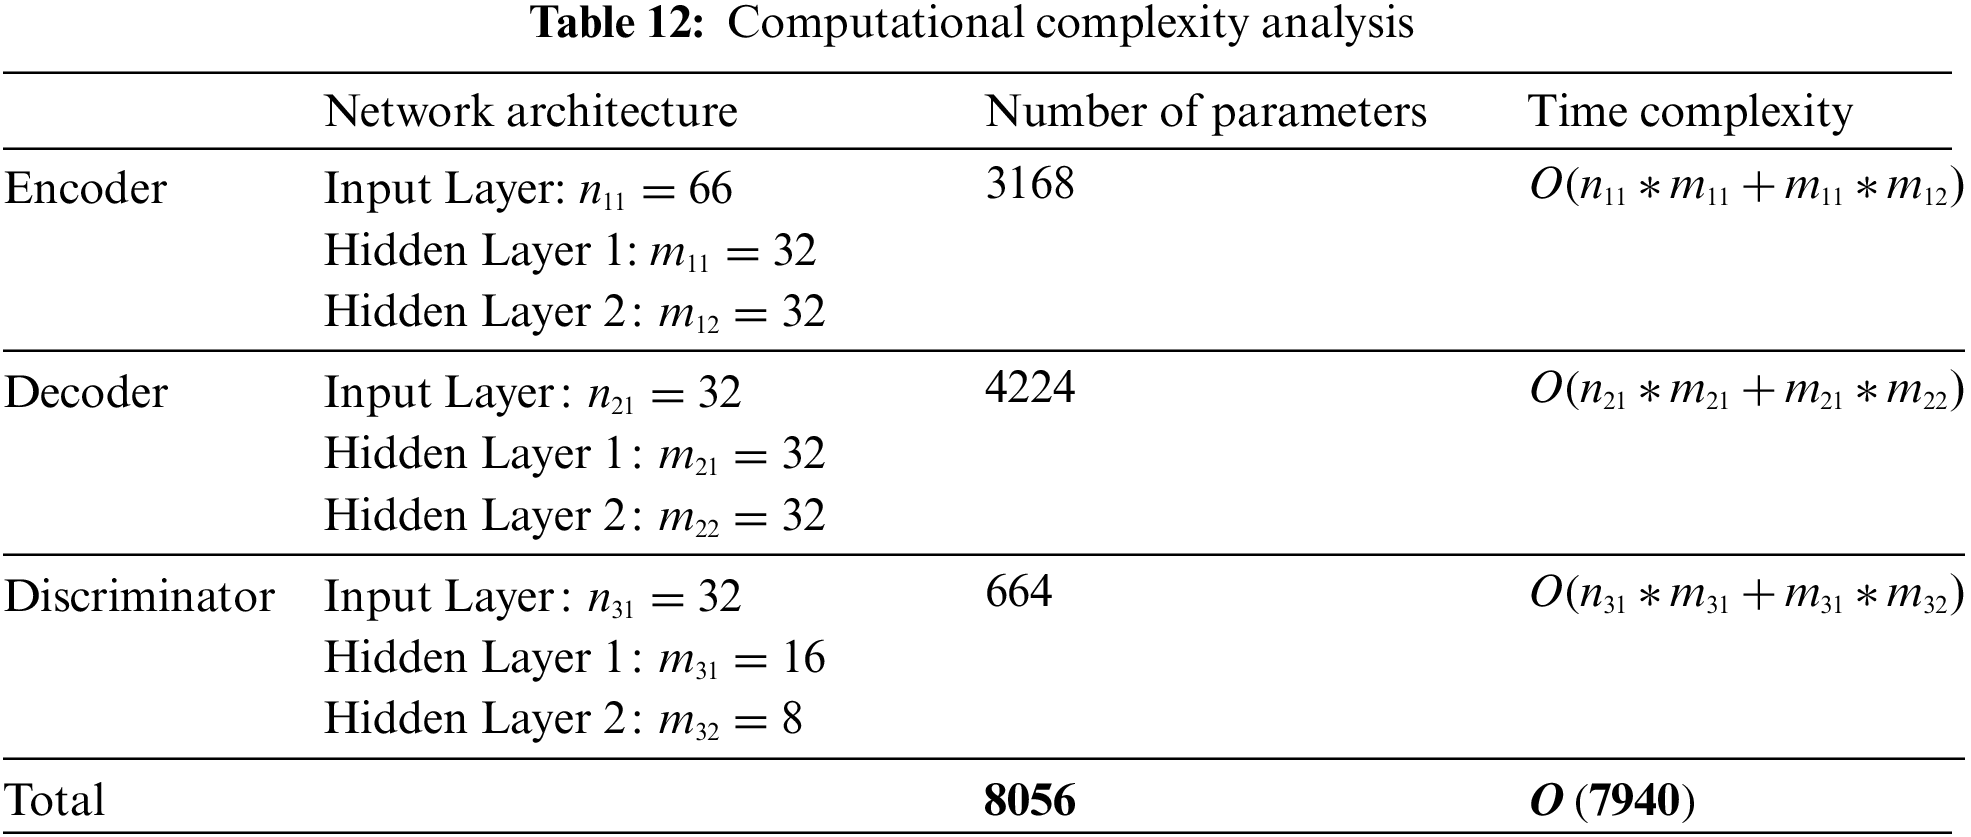
The complexity of our model mainly depends on the CVWG method. Therefore, we discuss the complexity according to the specific network structures, parameter counts, and time complexities for the encoder, decoder, and discriminator in Fig. 2. As shown in Table 12, the total time complexity of the model is
5.2 Decision-Making Discussion
To show the decision-making process of the model, this paper quantifies the contribution of each feature to the model’s output by calculating SHAP (SHapley Additive exPlanations) values, thereby helping to identify which features are most important for prediction results. SHAP values provide a game-theoretic measure for each feature, illustrating its role and positive or negative influence in specific predictions. The Fig. 15 shows the top 20 features that most significantly impact the output for each category on the CICIDS2017 dataset. These features reveal how the model utilizes them to make classification decisions through the magnitude and direction of their SHAP values.
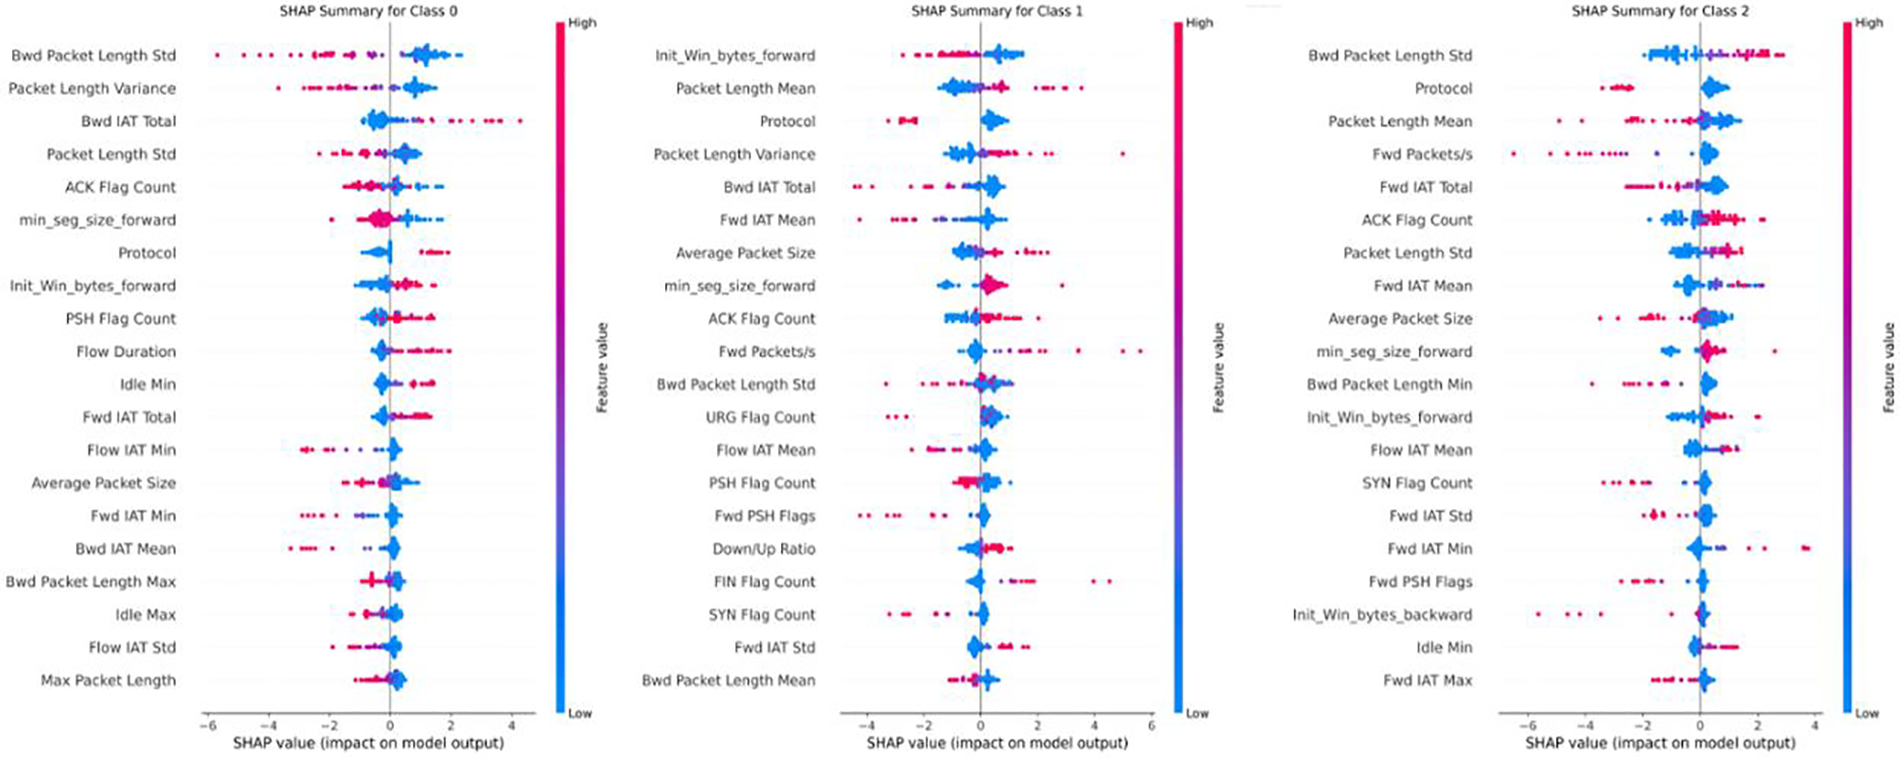
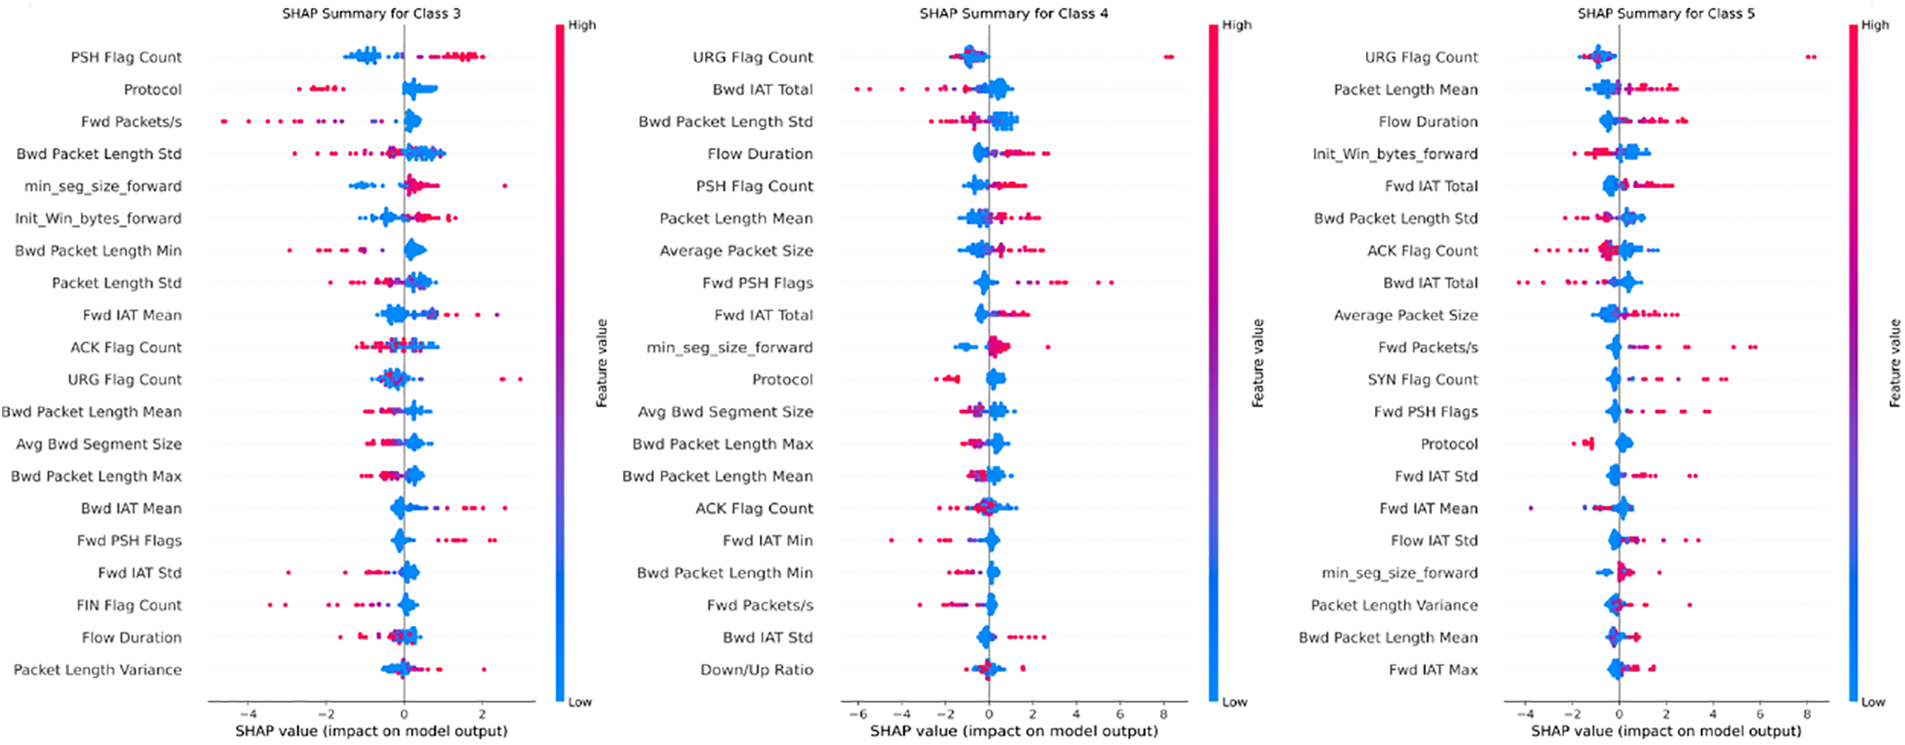
Figure 15: Feature importance map for each class on CICIDS2017
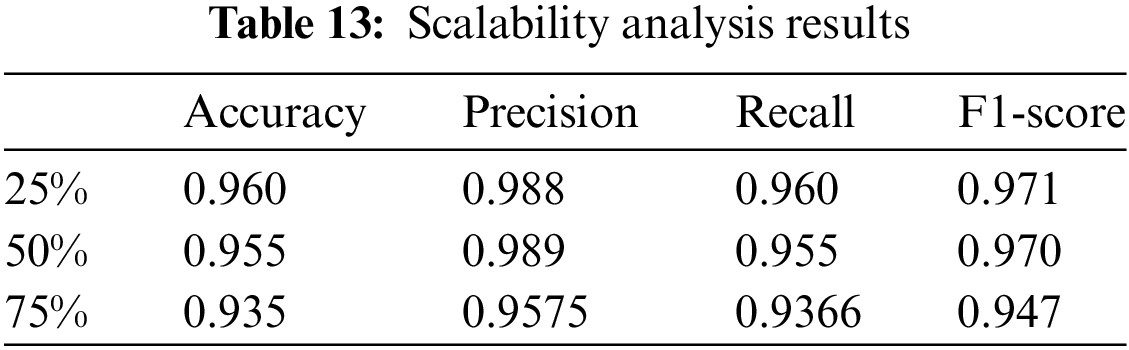
To verify the applicability of the proposed model on large-scale datasets, we trained the model using 25%, 50%, and 75% of the original data, with results shown in the Table 13. As the data volume increased, the model may not have reached optimal performance due to computer memory limitations. Although there was a slight decline in performance with the increase in data volume, the decrease was not significant. This indicates that the model maintains relatively stable performance when handling large-scale data, demonstrating a certain degree of robustness.
In this paper, we have proposed a data imbalance handling method, CVWGG; CVAE can handle data imbalance problems by introducing conditions (e.g., attack types) in training; It can learn and generate various attack samples that help to balance the dataset. Combined with WGAN, the generator can be better trained to produce more realistic traffic data, making that data more representative of real network traffic. It makes the generated data closer to the actual data and solves the problem of category imbalance that exists in the original dataset. The experimental results show that the differentiation of DDoS attack types can be achieved after the expansion of a few categories. Using PyCharm and Python 3.10, multiple metrics were evaluated on the CICDDoS2019 and CICIDS2017 datasets, including accuracy, precision, recall, F1- score, ROC curve and confusion matrix. The results show that the CVWGG method outperforms the comparison methods B-GAN, LCVAEGAN and ADASYN in DDoS detection accuracy, achieving accuracy rates of 96.0% and 97.3%, respectively. Therefore, the proposed method can more effectively distinguish between different types of DDoS attacks, reduce the likelihood of false positives and false negatives, and assist network security personnel in implementing targeted defense measures, thereby preventing economic losses caused by network service disruptions, data loss and other related issues.
Despite the significant achievements of the CVWGG method in addressing data imbalance and DDoS attack detection, some limitations remain. Firstly, the model has a high training complexity, requiring considerable training time and computational resources, especially when dealing with large-scale datasets. Future research will focus on exploring more efficient generative model architectures to enhance the quality of sample generation and training efficiency, thereby better addressing these challenges.
Acknowledgement: None.
Funding Statement: The financial support from the Fundamental Research Funds for Higher Education Institutions of Heilongjiang Province (Grant No. 145209126) and the Research and Innovation Platform Project (Grant No. 145309314) is acknowledged.
Author Contributions: The authors confirm their contribution to the paper as follows: Study conception and design: Haizhen Wang; Data collection: Na Jia, Yang He; Analysis and interpretation of results: Pan Tan; Draft manuscript preparation: Na Jia. All authors reviewed the results and approved the final version of the manuscript.
Availability of Data and Materials: The data and codes that support the findings of this study are available from the corresponding authors upon reasonable request.
Ethics Approval: Not applicable.
Conflicts of Interest: The authors declare no conflicts of interest to report regarding the present study.
References
1. M. M. Salim, S. Rathore, and J. H. Park, “Distributed denial of service attacks and its defenses in IoT: A survey,” J. Supercomput., vol. 76, no. 8, pp. 5320–5363, 2019. doi: 10.1007/s11227-019-02945-z. [Google Scholar] [CrossRef]
2. J. Bhayo, S. A. Shah, S. Hameed, A. Ahmed, J. Nasir and D. Draheim, “Towards a machine learning-based framework for DDoS attack detection in software-defined IoT (SD-IoT) networks,” Eng. Appl. Artif. Intell., vol. 123, 2023, Art. no. 106432. doi: 10.1016/j.engappai.2023.106432. [Google Scholar] [CrossRef]
3. W. Lu and Y. Liu, “A DDoS attack detection method based on information entropy and deep learning in SDN,” presented at IEEE 4th Inf. Technol. Netw. Electr. Autom. Control Conf. (ITNECChongqing, China, 2020, pp. 1084–1088A. [Google Scholar]
4. G. Liu et al., “A CGAN-based DDoS attack detection method in SDN,” in 2021 Int. Wirel. Commun. Mobile Comput. (IWCMC), Harbin, China: IEEE Press, 2021, pp. 1030–1034. [Google Scholar]
5. Y. Qing, X. Liu, and Y. Du, “Mitigating data imbalance to improve the generalizability in IoT DDoS detection tasks,” J. Supercomput., vol. 80, pp. 9935–9960, 2024. doi: 10.1007/s11227-023-05829-5. [Google Scholar] [CrossRef]
6. M. P. Novaes, L. F. Carvalho, J. Lloret, and M. L. Proença Jr., “Adversarial deep learning approach detection and defense against DDoS attacks in SDN environments,” Future Gener. Comput. Syst., vol. 125, no. 1, pp. 156–167, 2021. doi: 10.1016/j.future.2021.06.047. [Google Scholar] [CrossRef]
7. T. K. Boppana and P. Bagade, “GAN-AE: An unsupervised intrusion detection system for MQTT networks,” Eng. Appl. Artif. Intell., vol. 119, 2023, Art. no. 105805. doi: 10.1016/j.engappai.2022.105805. [Google Scholar] [CrossRef]
8. S. Balaji and S. S. Narayanan, “Dynamic distributed generative adversarial network for intrusion detection system over internet of things,” Wirel. Netw., vol. 29, pp. 1949–1967, 2023. doi: 10.1007/s11276-022-03182-8. [Google Scholar] [CrossRef]
9. V. Kumar and D. Sinha, “Synthetic attack data generation model applying generative adversarial network for intrusion detection,” Comput. Secur., vol. 125, 2022, Art. no 103054. doi: 10.1016/j.cose.2022.103054. [Google Scholar] [CrossRef]
10. S. Huang and K. Lei, “IGAN-IDS: An imbalanced generative adversarial network towards intrusion detection system in ad-hoc networks,” Ad Hoc Netw., vol. 105, 2020. doi: 10.1016/j.adhoc.2020.102177. [Google Scholar] [CrossRef]
11. J. H. Lee and K. H. Park, “GAN-based imbalanced data intrusion detection system,” Pers. Ubiquitous Comput., vol. 25, pp. 121–128, 2021. doi: 10.1007/s00779-019-01332-y. [Google Scholar] [CrossRef]
12. G. Zhang, X. Wang, R. Li, Y. Song, J. He and J. Lai, “Network intrusion detection based on conditional Wasserstein generative adversarial network and cost-sensitive stacked autoencoder,” IEEE Access, vol. 8, pp. 190431–190447, 2020. doi: 10.1109/ACCESS.2020.3031892. [Google Scholar] [CrossRef]
13. Z. Ma, J. Li, Y. Song, X. Wu, and C. Chen, “Network intrusion detection method based on FCWGAN and BiLSTM,” Comput. Intell. Neurosci., vol. 2022, 2022, Art. no. 6591140. doi: 10.1155/2022/6591140. [Google Scholar] [PubMed] [CrossRef]
14. Y. Yang, K. Zheng, C. Wu, and Y. Yang, “Improving the classification effectiveness of intrusion detection by using improved conditional variational autoencoder and deep neural network,” Sensors, vol. 19, 2019, Art. no. 2528. doi: 10.3390/s19112528. [Google Scholar] [PubMed] [CrossRef]
15. P. Chuang and P. Huang, “B-VAE: A new dataset balancing approach using batched variational AutoEncoders to enhance network intrusion detection,” J. Supercomput., vol. 79, pp. 13262–13286, 2023. doi: 10.1007/s11227-023-05171-w. [Google Scholar] [CrossRef]
16. T. Liu, Y. Fu, K. Wang, and X. Duan, “Network intrusion detection method based on VAE-CWGAN and fusion of statistical importance of feature,” (in ChineseJ. Commun., vol. 45, no. 2, pp. 54–67, Feb. 2024. doi: 10.11959/j.issn.1000-436x.2024013. [Google Scholar] [CrossRef]
17. I. Sharafaldin, A. H. Lashkari, S. Hakak, and A. A. Ghorbani, “Developing realistic distributed denial of service (DDoS) attack dataset and taxonomy,” in Proc. of the IEEE 53rd Int. Carnahan Conf. Secur. Technol., Chennai, India, 2019. doi: 10.1109/CCST.2019.8888419. [Google Scholar] [CrossRef]
18. I. Sharafaldin, A. H. Lashkari, and A. A. Ghorbani, “Toward generating a new intrusion detection dataset and intrusion traffic characterization,” in 4th Int. Conf. Inform. Syst. Secur. Privacy (ICISSP), Portugal, Jan. 2018. doi: 10.5220/0006639801080116. [Google Scholar] [CrossRef]
19. L. Yuan, S. Yu, Z. Yang, M. Duan, and K. Li, “A data balancing approach based on generative adversarial network,” Future Gener. Comput. Syst., vol. 141, pp. 768–776, 2023. doi: 10.1016/j.future.2022.12.024. [Google Scholar] [CrossRef]
20. G. Chen, “Research on smart home network intrusion detection algorithm based on data enhancement,” M.S. thesis, Beijing Jiaotong Univ., China, 2023. doi: 10.26944/d.cnki.gbfju.2022.003568. [Google Scholar] [CrossRef]
21. D. Li, D. Kotani, and Y. Okabe, “Improving attack detection performance in NIDS using GAN,” in 2020 IEEE 44th Ann. Comput., Soft., Appl. Conf. (COMPSAC), Madrid, Spain, 2020, pp. 817–825. doi: 10.1109/COMPSAC48688.2020.0-162. [Google Scholar] [CrossRef]
22. A. Srivastava, D. Sinha, and V. Kumar, “WCGAN-GP based synthetic attack data generation with GA based feature selection for IDS,” Comput. Secur., vol. 134, no. 4, 2023, Art. no. 103432. doi: 10.1016/j.cose.2023.103432. [Google Scholar] [CrossRef]
23. H. Chen, C. Jiang, H. Jin, C. Wu, and J. Lu, “An intrusion detection model incorporating improved stacked encoder and multilayer BiLSTM,” (in ChineseComput. Eng. Appl., pp. 1–12, 2024. doi: 10.3778/j.issn.1002-8331.2312-0017. [Google Scholar] [CrossRef]
Cite This Article
 Copyright © 2024 The Author(s). Published by Tech Science Press.
This work is licensed under a Creative Commons Attribution 4.0 International License , which permits unrestricted use, distribution, and reproduction in any medium, provided the original work is properly cited.
 Downloads
 Citation Tools