
 Submit a Paper
 Propose a Special lssue
 Open Access
ARTICLE

YOLO-DEI: Enhanced Information Fusion Model for Defect Detection in LCD
School of Electrical and Information Engineering, Wuhan Institute of Technology, Wuhan, 430000, China
* Corresponding Author: Sheng Zheng. Email:
Computers, Materials & Continua 2024, 81(3), 3881-3901. https://doi.org/10.32604/cmc.2024.056773
Received 30 July 2024; Accepted 12 October 2024; Issue published 19 December 2024
 View Full Text
 Download PDF
Abstract
In the age of smart technology, the widespread use of small LCD (Liquid Crystal Display) necessitates pre-market defect detection to ensure quality and reduce the incidence of defective products. Manual inspection is both time-consuming and labor-intensive. Existing methods struggle with accurately detecting small targets, such as point defects, and handling defects with significant scale variations, such as line defects, especially in complex background conditions. To address these challenges, this paper presents the YOLO-DEI (Deep Enhancement Information) model, which integrates DCNv2 (Deformable convolution) into the backbone network to enhance feature extraction under geometric transformations. The model also includes the CEG (Contextual Enhancement Group) module to optimize feature aggregation during extraction, improving performance without increasing computational load. Furthermore, our proposed IGF (Information Guide Fusion) module refines feature fusion in the neck network, preserving both spatial and channel information. Experimental results indicate that the YOLO-DEI model increases precision by 2.9%, recall by 13.3%, and mean Average Precision (mAP50) by 12.9%, all while maintaining comparable parameter counts and computational costs. These significant improvements in defect detection performance highlight the model’s potential for practical applications in ensuring the quality of LCD.Keywords
Small LCD (Liquid Crystal Display) are vital components in the electronic manufacturing industry. During automated production, defects such as scratches, breakage, bright spots, bright lines, and light leakage may occur due to equipment malfunctions and human errors. These defects significantly impact the performance and lifespan of the products. In the early stages of industrial defect detection, manual inspection is typically employed. However, this method is labor-intensive, inefficient, and highly subjective [1]. With the advancement of computer vision technology, numerous advanced object detection algorithms have been introduced and applied to defect detection, yielding significant results [2].
Currently, mainstream object detection networks are categorized into one-stage and two-stage detection methods. Two-stage detection networks, such as SPP-Net [3], Fast R-CNN [4], and Cascade R-CNN [5], first generate candidate regions and then perform classification and regression on these regions. Although two-stage detection networks offer higher accuracy, their two-part process poses challenges for real-time detection. To enable efficient real-time detection, one-stage networks perform classification and regression in parallel, streamlining the model to enhance computational speed. Examples include SSD [6], RetinaNet [7], and the YOLO series. Among these, YOLOv8 employs an anchor-free mechanism, making it one of the most popular object detection models in recent years due to its efficiency, strong generalization ability, and high integration. Despite its strong performance on natural image datasets like COCO, its effectiveness diminishes on LCD defect datasets. This decline is primarily attributed to the model’s inadequate feature extraction capability for specific defect datasets and its inability to effectively fuse the various defect features present in LCD screens, resulting in lower detection performance on LCD screen defect datasets.
In our study, while LCD defect detection falls under the broader category of target detection, it presents greater challenges compared to other detection tasks. Firstly, point defects in LCD are considered small targets, with minimal pixel presence in images, making it difficult for traditional convolutional neural networks (CNNs) to extract effective features. Additionally, the features of small targets gradually degrade during network transmission, ultimately leading to inaccurate object recognition. Secondly, line defects exhibit significant scale variations, often appearing as elongated forms that may span a substantial portion of the image. Furthermore, defects such as scratches and liquid leakage present additional challenges due to their diverse and irregular shapes. Consequently, conventional detection algorithms struggle to adapt to these large-scale and shape variations, thereby affecting detection accuracy. Fig. 1 illustrates some examples of these defects. Therefore, enhancing the network’s ability to extract features from small targets and accurately localize and identify line defects, as well as scratches and liquid leakage, is a significant challenge in LCD defect detection.

Figure 1: Some samples of LCD screen defects
To address this issue, we propose an LCD defect detection model named YOLO-DEI. This model incorporates an improved IGF (Information Guide Fusion) module to enhance feature fusion capabilities, thereby capturing rich contextual information more effectively. Additionally, we introduce a new feature extraction module, CEG (Contextual Enhancement Group), designed to gather multi-scale defect information. Finally, we integrate deformable convolution (DCNv2) to overcome the limitations of restricted receptive fields, enabling the model to better adapt to defect shapes and achieve accurate defect localization. The main contributions of our work are as follows:
(1) Through field visits to industrial production environments, we collected, cleaned, and annotated data, subsequently expanding it through data augmentation. This process allowed us to construct a reliable dataset of LCD defects, providing subsequent researchers with a high-quality public resource.
(2) The IGF (Information Guide Fusion) module is introduced to enhance the neck network by integrating positional and contextual information from shallow features with semantic information from deeper features. This fusion enhances the network’s perceptual capabilities and improves the accuracy of the detection network.
(3) The CEG (Contextual Enhancement Group) module is introduced to enhance the network’s feature extraction capability, allowing for more effective extraction of spatial features for small targets with minimal computational overhead. This improvement boosts overall network performance.
(4) We enhance the network’s backbone by introducing DCNv2 convolution, enabling the model to adapt to different defect sizes and addressing the issue of limited receptive fields.
In this section, we discuss topics relevant to this research, including image processing methods, deep learning techniques, and attention mechanisms.
Image processing methods involve a series of operations and techniques to process, analyze, and transform LCD screen image data to extract useful information or enhance specific features. Common techniques for addressing issues such as repetitive background textures and uneven overall brightness in LCD screens include image denoising, elimination of repetitive texture backgrounds, and background suppression. Zhang et al. [8] employed an image averaging method, which, however, consumes significant storage space and processing time, making it less practical for real-time applications. Taniguchi et al. [9] used grayscale linear mapping to enhance image brightness, but this method tends to lose useful information, reducing its effectiveness. Zhang et al. [10] viewed texture as a high-energy component in the frequency domain and proposed a local two-dimensional discrete Fourier transform algorithm. However, Fourier transforms are not suitable for local analysis, leading to poor results when reconstructing images with locally non-uniform grayscale. Wang et al. [11] effectively suppressed background textures using an image structure extraction method based on the relative total variation model, but this method struggles to accurately detect panel edge defects. Yang et al. [12] used a multi-scale saliency defect extraction algorithm, which is effective for detecting defects of various sizes but exhibits weaker generalization capabilities, limiting its application across diverse datasets.
Based on image processing methods, while they can generally accomplish defect detection, several areas require improvement. Firstly, traditional feature extraction methods and background reconstruction techniques often struggle with defects that have low contrast and small areas. These defects are challenging to detect because they do not stand out against the background. Secondly, these methods heavily rely on feature engineering, which involves costly and time-consuming manual extraction processes. This dependency on manual labor limits scalability and efficiency. Lastly, the expressive capability of features extracted through traditional defect detection methods is limited, leading to lower detection accuracy. These methods often fail to capture the complex variations in defect patterns. Moreover, image processing methods often lack generalizability, being tailored to specific scenes rather than being broadly applicable across various scenarios. This limitation hinders their effectiveness in diverse industrial environments where defect characteristics can vary significantly.
In recent years, deep learning has achieved significant breakthroughs in computer vision tasks. Utilizing deep learning for detection allows for rapid and precise localization of targets. Furthermore, deep learning methods learn feature representations from extensive training data, eliminating the need for manual feature extraction. This autonomous learning capability enables networks to recognize complex patterns and make accurate predictions based on the input data. Additionally, deep learning models can continuously improve their performance as more data becomes available, making them highly adaptable to new and varying conditions.
With the advancement of neural networks, many researchers have begun employing deep learning methods for defect detection tasks. For instance, Song et al. [13] proposed the Res-unetGAN network, based on generative adversarial networks, for unsupervised anomaly detection of stripe and linear Mura; however, its applicability is limited to these specific defect types. Mei et al. [14] introduced a multimodal joint feature representation model for defect feature extraction, which integrates manually extracted features with unsupervised learning features, enhancing defect detection and prediction by effectively acquiring useful Mura features. Dai et al. [15] utilized a convolutional denoising autoencoder to construct multi-scale features for image reconstruction, significantly enhancing model performance through the integration of an L1 loss function. Yang et al. [16] proposed a fully convolutional autoencoder for multi-scale feature clustering, leveraging multiple autoencoders to improve background reconstruction performance.
The attention mechanism is a pivotal technology in deep learning, designed to train models to assign different weights to various parts of the input data. This enables the model to focus more on important parts while minimizing interference from less relevant information. Similar to the human eye’s perceptual process, the attention mechanism adaptively concentrates on crucial areas when processing image data. Woo et al. [17] proposed the CBAM attention mechanism, which integrates channel and spatial attention to capture important information in feature maps more comprehensively, selectively focusing on these maps to enhance the model’s representation. Liu et al. [18] introduced the GAM global attention mechanism, which, like other attention mechanisms, improves the model’s representation. However, unlike others, GAM captures global contextual information, better handling long-range dependencies and improving model performance. Additionally, many researchers have addressed specific challenges by incorporating attention mechanisms into their models. For instance, Liang et al. [19] introduced a graph attention network, enhancing region connectivity during propagation to enable accurate defect localization, though it is complex and less suited for real-time applications. Peng et al. [20] tackled inaccurate defect localization by introducing a multi-scale dual-channel attention module (DWAM). Thus, appropriately incorporating attention mechanisms can significantly enhance network performance.
3 Network Architecture and Convergence Module Improvements
The original YOLOv8 network may struggle to accurately detect and localize LCD defects against complex display backgrounds due to variations in defect shapes, sizes, and scales. To address this issue, we propose the YOLO-DEI network. This network overcomes the limited receptive field problem in the feature extraction phase by introducing the CEG (Contextual Enhancement Group) module, which is based on C2f, and incorporating the DCNv2 convolution module. These enhancements improve the network’s ability to capture features of different defect shapes. Additionally, in the neck network, we introduce the IGF (Information Guide Fusion) module, which selectively integrates information extracted from the backbone to enhance the model’s capability in capturing critical details. This improvement not only increases the model’s accuracy in recognizing targets but also enhances its ability to represent subtle features in complex scenes. Fig. 2 illustrates the overall structure of YOLO-DEI.

Figure 2: Improved YOLO-DEI structure
3.1 Deformable Convolutional Structures
Due to the significant scale variations in defects found in small LCD, standard convolutional layers often fail to effectively capture the entire defective region during feature extraction. Deformable convolutions offer a solution by dynamically adjusting the receptive field based on the spatial distribution of defects. This adaptive mechanism allows the network to focus more precisely on varying defect sizes and shapes, improving the accuracy of defect localization. By incorporating deformable convolution, we aim to enhance the model’s ability to accurately identify and locate large-size defects that would otherwise be missed by ordinary convolutions.
DCNv2 (Deformable Convolutional Networks version 2) [21] is a type of convolutional network widely used in computer vision, especially for object detection tasks. Fig. 3 illustrates the difference between standard convolution and deformable convolution: Fig. 3a shows a standard 3 × 3 convolution, whereas Fig. 3b–d depict the deformable convolution kernel with additional offsets. The orange dots represent the new convolutional sampling locations, and the arrows indicate the direction of these offsets.
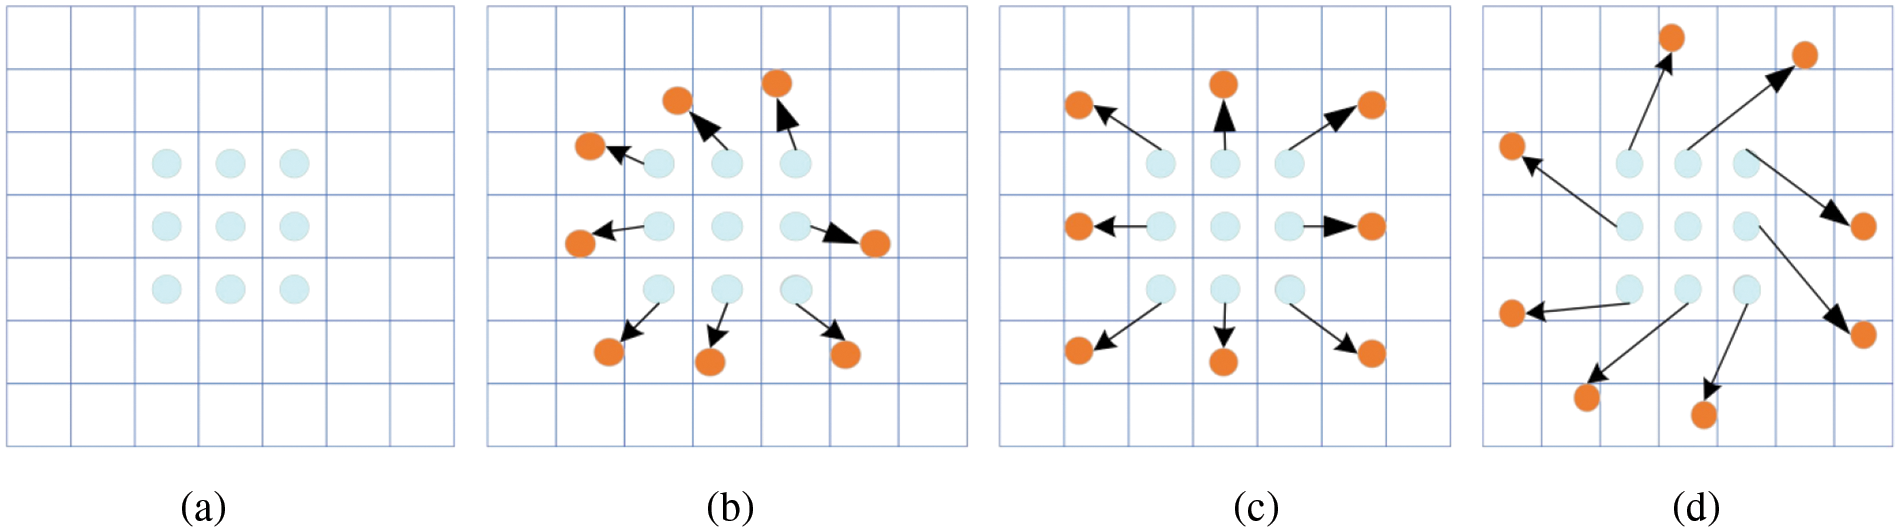
Figure 3: Different sampling methods for standard and deformable convolutions. (a) Standard 3 × 3 convolution operation for capturing basic features. (b) Deformable convolution with a specific shape (e.g., irregular polygon) for capturing particular features. (c) Deformable convolution with a more complex shape (e.g., images with large scale variations) aimed at capturing different features. (d) Deformable convolution with a unique, highly irregular shape, designed for specific scenarios or tasks
This convolution effectively expands the receptive field by introducing a weighting term that penalizes output characteristics on a point-to-point basis, thus addressing the limited receptive field issue present in DCNv1 [22]. Traditional convolutional methods use a fixed kernel size to extract features, limiting their effectiveness in handling spatial transformations. In conventional convolution, a 3 × 3 convolution requires sampling nine positions around the central point
In DCNv2, Deformable convolution enhances conventional convolution by incorporating a learnable positional offset parameter
Despite maintaining the same convolution size after introducing offsets, DCNv2 allows each point to receive an offset corresponding to the feature point at each new position. Even with significant scale transformations of the input image, Deformable convolution can still effectively extract the corresponding features by learning the appropriate offsets, as illustrated in Fig. 4.
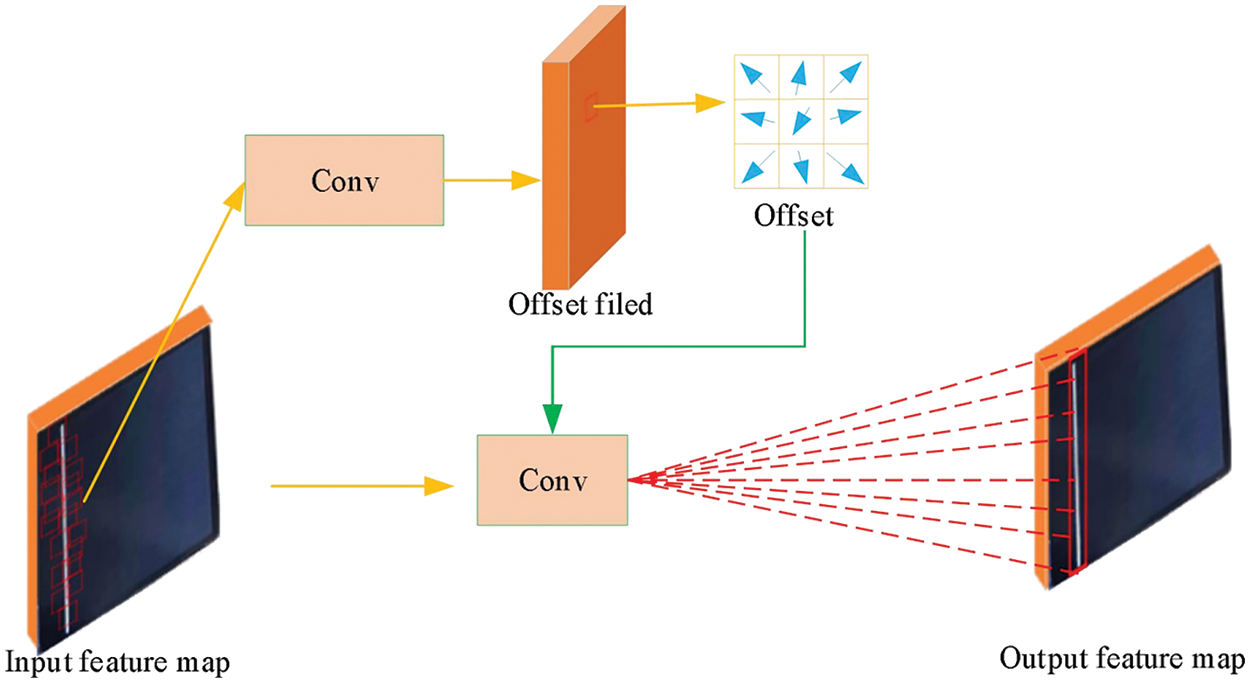
Figure 4: Deformable convolution structure diagram
The key innovation of DCNv2 is its “Deformable convolution” operation, which not only introduces learnable offsets to the sampled positions but also adjusts the importance of each sample through learnable magnitudes. This allows the network to dynamically refine the focus of the convolution operation, determining both “where” to sample (via offsets) and “how” to assign different weights to each sample (via magnitudes). This mechanism provides the network with greater flexibility and finer control, enabling it to more effectively extract and utilize information from the input image. Additionally, DCNv2 enables the network to learn more complex geometric transformations by increasing the number of Deformable convolutional layers or introducing modulation mechanisms, which allow each sample to be shifted relative to image features and modulated by learned weights.
3.2 CEG Feature Extraction Module
To enhance the network’s feature extraction ability for various defects, we propose the CEG (Contextual Enhancement Group) module. This section describes each component of the CEG module and explains its purpose.
In LCD defect data, many defects exhibit irregular geometric shapes, making it challenging for conventional convolution to effectively extract features from these complex forms. To address this issue, the improved CEG module incorporates Ghost convolution [23], as illustrated in Fig. 5. Ghost convolution generates additional feature maps containing positional information from the original feature maps through simple linear operations, which are then concatenated with the original feature maps. This approach enables Ghost convolution to extract richer image features without requiring additional parameters. Assuming the input feature map size is
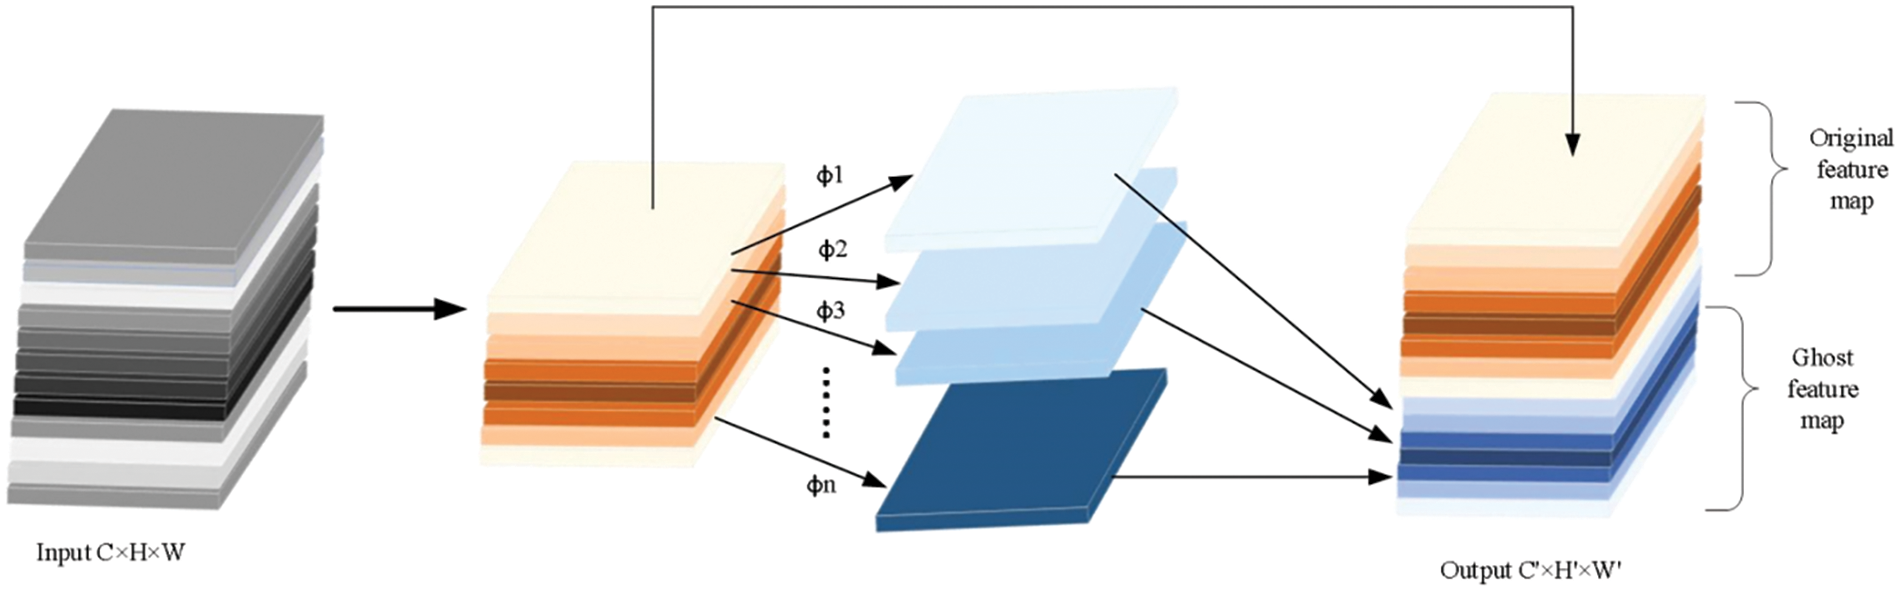
Figure 5: Ghost convolution
The computation cost of the standard convolution:
The computation cost of the Ghost convolution:
When substituting specific numbers, suppose the input feature map size is 32 × 32 × 64, the convolution kernel size
The computation cost of the standard convolution:
The computation cost of the Ghost convolution:
Based on the above calculations, we can conclude that Ghost convolution has significantly lower computational cost compared to standard convolution. Additionally, Ghost convolution generates more effective feature maps, which allows it to capture a greater amount of image feature information. This enhanced feature extraction capability leads to improved detection performance.
The LCD inspection process involves illuminating the screen to detect defects under various backgrounds. Introducing attention mechanisms allows the network to focus on regions of interest, thereby reducing irrelevant interference. This study introduces the Efficient Multi-scale Attention (EMA) structure to enhance the network’s focus on defect regions, as shown in Fig. 6. The EMA structure consists of three components: feature grouping, parallel subnets, and cross-space learning. Feature grouping segments the cross-channel dimensional direction into multiple sub-features to capture different semantics, while parallel subnets facilitate information interaction between channels, encoding channel information to adjust its importance and preserving precise spatial structure within channels. Cross-space learning enhances the convolutional focus on high-level feature maps by modeling long-range dependencies and embedding accurate positional information into EMA. Compared to other attention modules such as CBAM (Convolutional Block Attention Module), Efficient Local Attention (ELA) [24], and Simple Attention Mechanism (SimAM) [25], the EMA module effectively improves network performance with fewer parameters on the dataset used in this study.
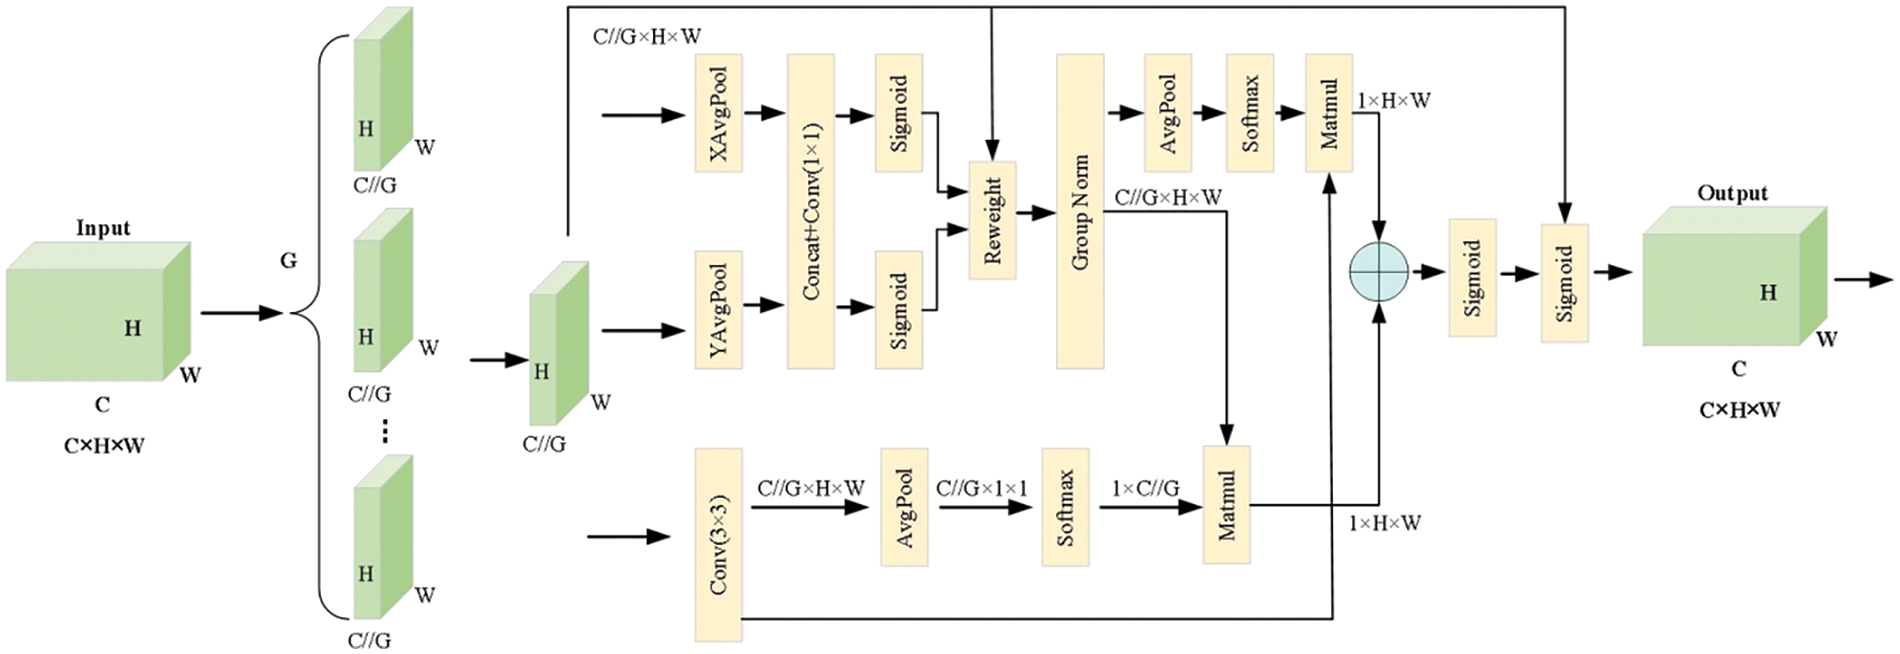
Figure 6: The structure diagram of the EMA attention mechanism
3.2.3 CEG Feature Extraction Structure
To further enhance the network’s feature extraction capability, we improved the C2f module by refining the internal structure of the bottleneck to enrich the model’s gradient flow, enabling more effective extraction of complex defect features. Firstly, we replaced the two conventional convolutions in the original bottleneck with Ghost convolution, allowing the feature extraction model to generate additional feature maps with semantic information at a lower computational cost. Secondly, we incorporated EMA attention into the C2f module, focusing on the regions with the richest gradient flow, which enhances the attention on feature regions during the extraction process. The resulting CEG module is illustrated in Fig. 7. Applying this module to the original model significantly improves the network’s feature extraction capability and enhances defect detection accuracy.
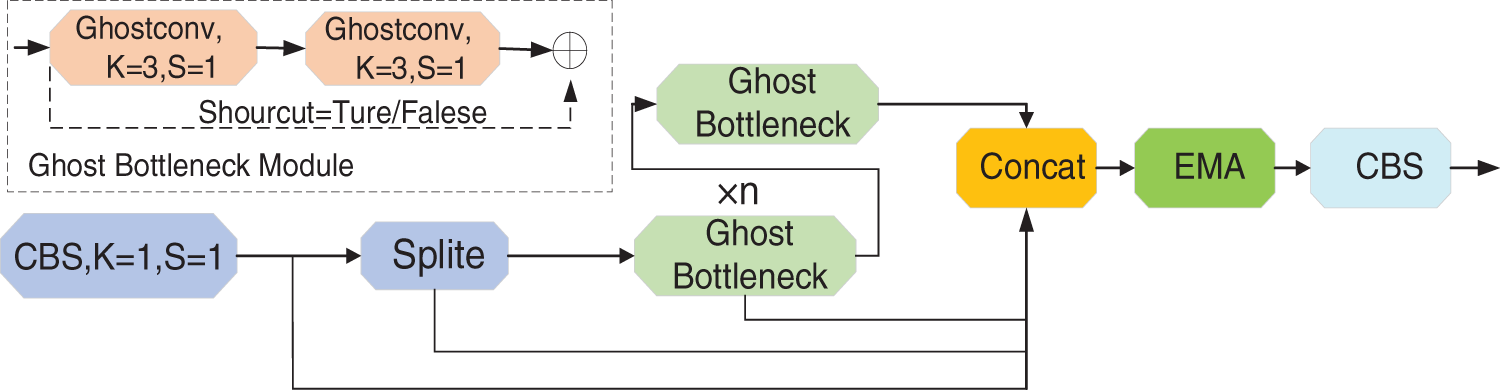
Figure 7: The structure diagram of the CEG
In LCD defect detection, the significant variability in defect shapes, particularly irregularities such as bright lines, complicates the extraction of valuable feature information using the original model’s concatenation operation for fusion. Firstly, the concatenation operation lacks selectivity and does not prioritize critical features, leading to the inclusion of substantial non-critical or irrelevant information in the concatenated feature map. This significantly impairs model comprehension and processing. Secondly, straightforward feature map concatenation can result in information redundancy, where feature maps at different levels may redundantly or similarly encode information at the same positions. This redundancy hinders effective utilization during model training, thereby affecting training efficiency and model performance. To address these challenges, this study proposes an IGF module to replace the concatenation operation, as illustrated in Fig. 8.

Figure 8: The structure diagram of the IGF
To enable the network to more accurately detect defect regions in images, we have innovatively proposed the IGF (Information Guide Fusion) structure, enhancing traditional concatenation operations. This structure efficiently captures multi-scale contextual information by focusing on the interdependencies between distant pixels, thus enhancing the central features of the image. The IGF module first applies average pooling to the input, reducing sensitivity, smoothing features, and minimizing local noise. Subsequently, features are extracted through a 1 × 1 convolutional layer to maintain channel consistency. By utilizing horizontal and vertical convolution operations, the IGF module achieves profound fusion and interaction of features across different levels, ensuring the optimal utilization of key features while minimizing redundant information. This design significantly enhances the network’s capabilities in feature extraction and information fusion, thereby improving the overall performance and accuracy of the defect detection model. The specific principles are illustrated in Eqs. (8)–(11), where
Two different depthwise separable convolutions are employed—one for vertical feature changes and another for horizontal feature changes—to complement each other and enrich feature expression. Compared to traditional
Finally, applying the Sigmoid function maps the values to a range of 0 to 1. The IGF module produces an attention weight that is subsequently used to enhance the output of the IGF module.
For the two parts that need to be fused, we treat them as separate inputs. After passing through the IGF module, these inputs highlight valuable feature information and facilitate deeper interactions. This enhances the feature fusion effect of the neck network, thereby improving the model’s detection accuracy. The specific fusion process is illustrated in Algorithm 1, where

Since the IGF module does not involve any complex operations, the increase in computation and parameters is primarily due to the inclusion of the attention module. This ensures that the use of the IGF module improves accuracy while maintaining a relatively low parameter count.
In this section, we describe the dataset used for the experiments, compare the performance of currently popular networks, and demonstrate the effectiveness of the modules in our proposed network through ablation studies.
4.1 Datasets and Evaluation Metrics
Given the scarcity of publicly available large-scale datasets in this field, we conducted on-site data collection at an intelligent manufacturing facility in Jiangxi, China, to evaluate the performance of our proposed model. The facility’s mature production processes resulted in a relatively small number of defect samples compared to the overall output. To ensure diversity in our datasets, we undertook continuous data collection over a 14-day period, successfully capturing nearly all types of defects, as partially illustrated in Fig. 9. The inspection process was conducted under five monochromatic backgrounds—red, green, blue, white, and black—as well as a mixed background. The colored bands in the figure represent these five stitched background colors. Since our study primarily focuses on identifying and localizing defect types within defective samples to assist the factory in assessing the frequency of various defects during production, our datasets consists exclusively of samples containing defects.
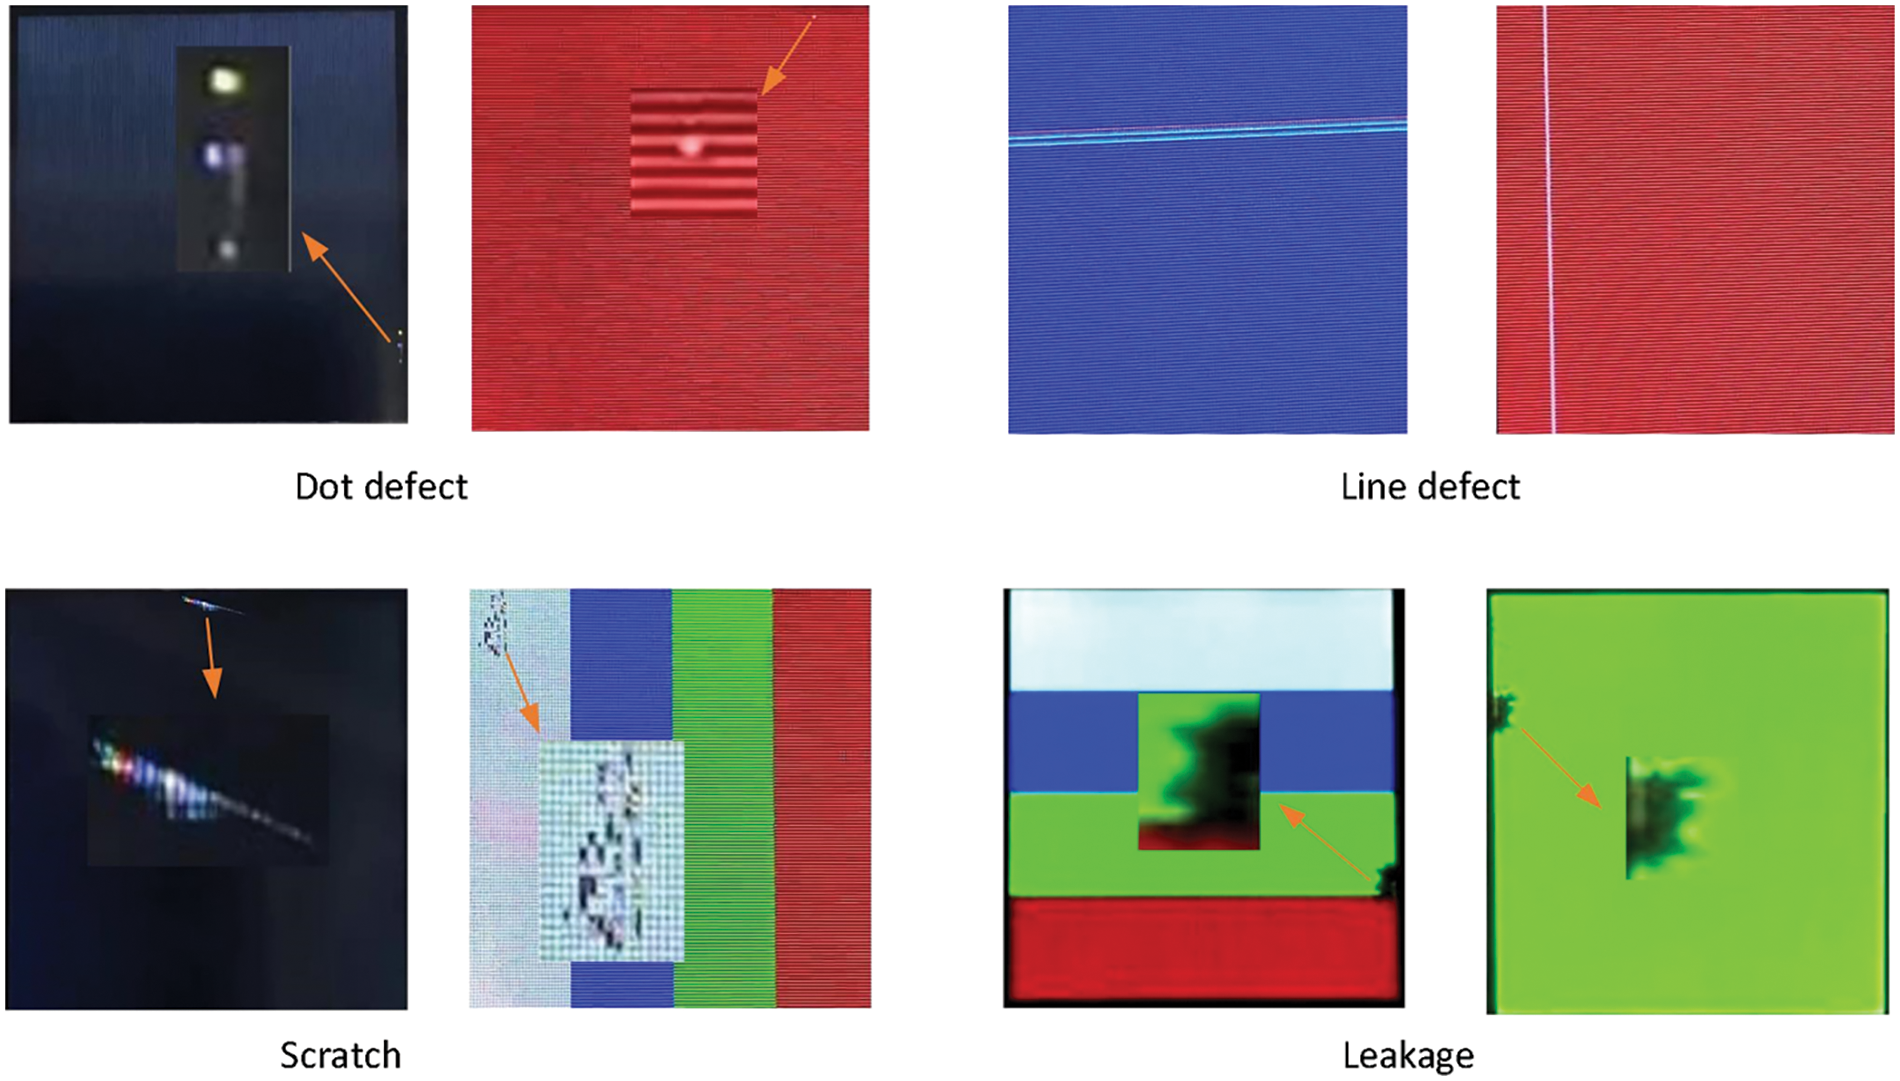
Figure 9: Datasets sample
The datasets comprises 661 defect samples, covering four types of defects: bright spots, bright lines, leakage, and scratches, as shown in Fig. 10. Initially, we divided the datasets into training, validation, and testing sets in a 7:2:1 ratio. Due to the limited sample size and to ensure that the experiments closely simulate real-world production inspection scenarios, we applied data augmentation techniques to the training set to expand it. Specifically, methods such as image flipping, contrast enhancement, and noise addition were utilized. Given the imbalance in defect categories observed in the actual production samples, we performed targeted augmentation to balance the class distribution. The augmented training set is illustrated in Fig. 11. This approach was adopted to rigorously evaluate the feasibility of the trained model.
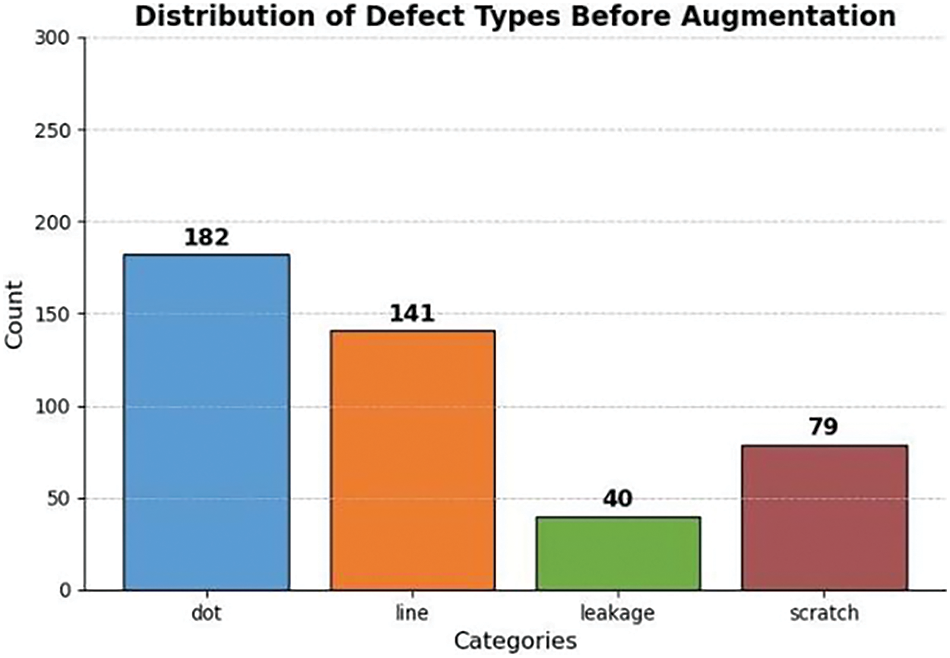
Figure 10: Before augmentation
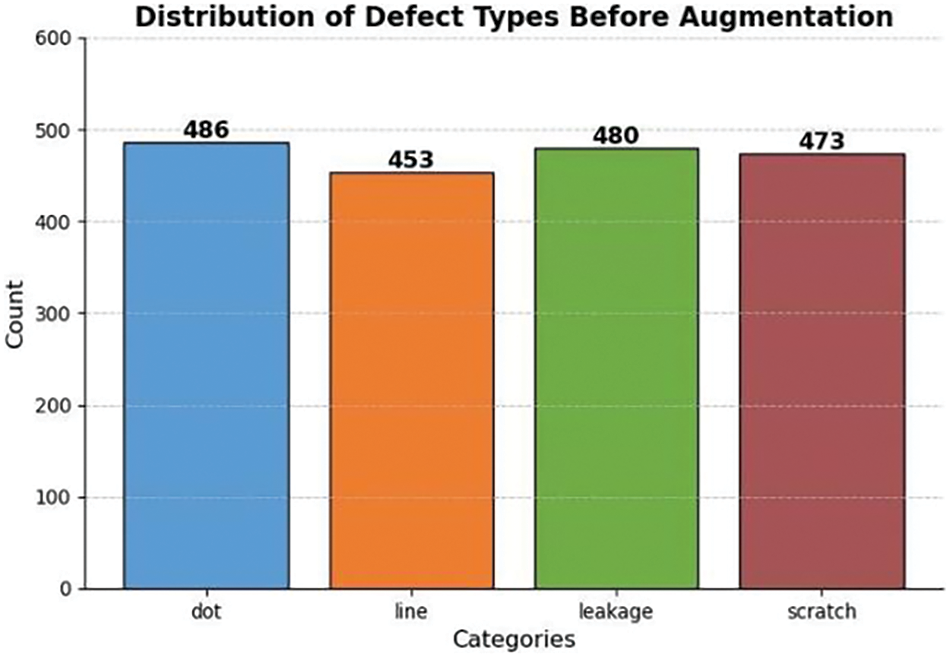
Figure 11: After augmentation
In this study, we employed several metrics to analyze the model’s performance: precision (P), recall (R), mean Average Precision (mAP), number of model parameters (Params), model complexity (GFLOPs), and frames per second (FPS). Specifically, we utilized the mAP50 metric to evaluate the performance of our model. The mAP50 metric calculates the mean average precision at an IoU threshold of 0.5. Specifically, it assesses the balance between precision and recall in the context of detection tasks, thereby providing an overall evaluation of the model’s detection capabilities. In the field of object detection, mAP50 is a widely used and significant evaluation metric, as it not only reflects the model’s ability to identify objects but also gauges its precision in handling object boundary localization. The calculation of mAP50 involves computing the average precision for each class when the IoU between predicted bounding boxes and ground truth annotations is equal to or greater than 0.5, followed by averaging these values across all classes. As such, mAP50 offers a comprehensive and reliable measure of model performance.
In the formulas, TP (True Positive) denotes the number of correctly detected positive samples, FP (False Positive) denotes the number of negative samples incorrectly detected as positive, FN (False Negative) denotes the number of positive samples missed by the detection,
In addition to model accuracy, we considered the practical applicability of the model in production environments by introducing three additional metrics: FLOP (Floating Point Operations), Params, and FPS (Frames Per Second). FLOP measures the computational complexity by quantifying the number of floating-point operations required during inference, with higher values indicating greater resource and time demands. Params reflects the total number of trainable parameters, directly influencing storage needs and inference speed—models with more parameters typically have greater capacity but also higher computational costs. FPS gauges the model’s real-time processing capability, with higher FPS indicating better suitability for real-time applications. By evaluating these metrics, we gain a comprehensive understanding of the model’s computational efficiency and practical deployment potential.
To validate the effectiveness of the algorithm proposed in this paper, we established an experimental platform to ensure that all tests were conducted under consistent conditions. We used Ubuntu 18.04 as the operating system, PyTorch as the deep learning framework, and YOLOv8n as the benchmark network model. The experimental setup included an RTX 3090 GPU (24 GB) and utilized Python 3.8.1 for programming. Uniform hyperparameters were applied across all experiments: an input image size of 640, 300 training epochs, the Adam optimizer with a momentum of 0.937, a learning rate of 0.01, a batch size of 24, and 8 workers.
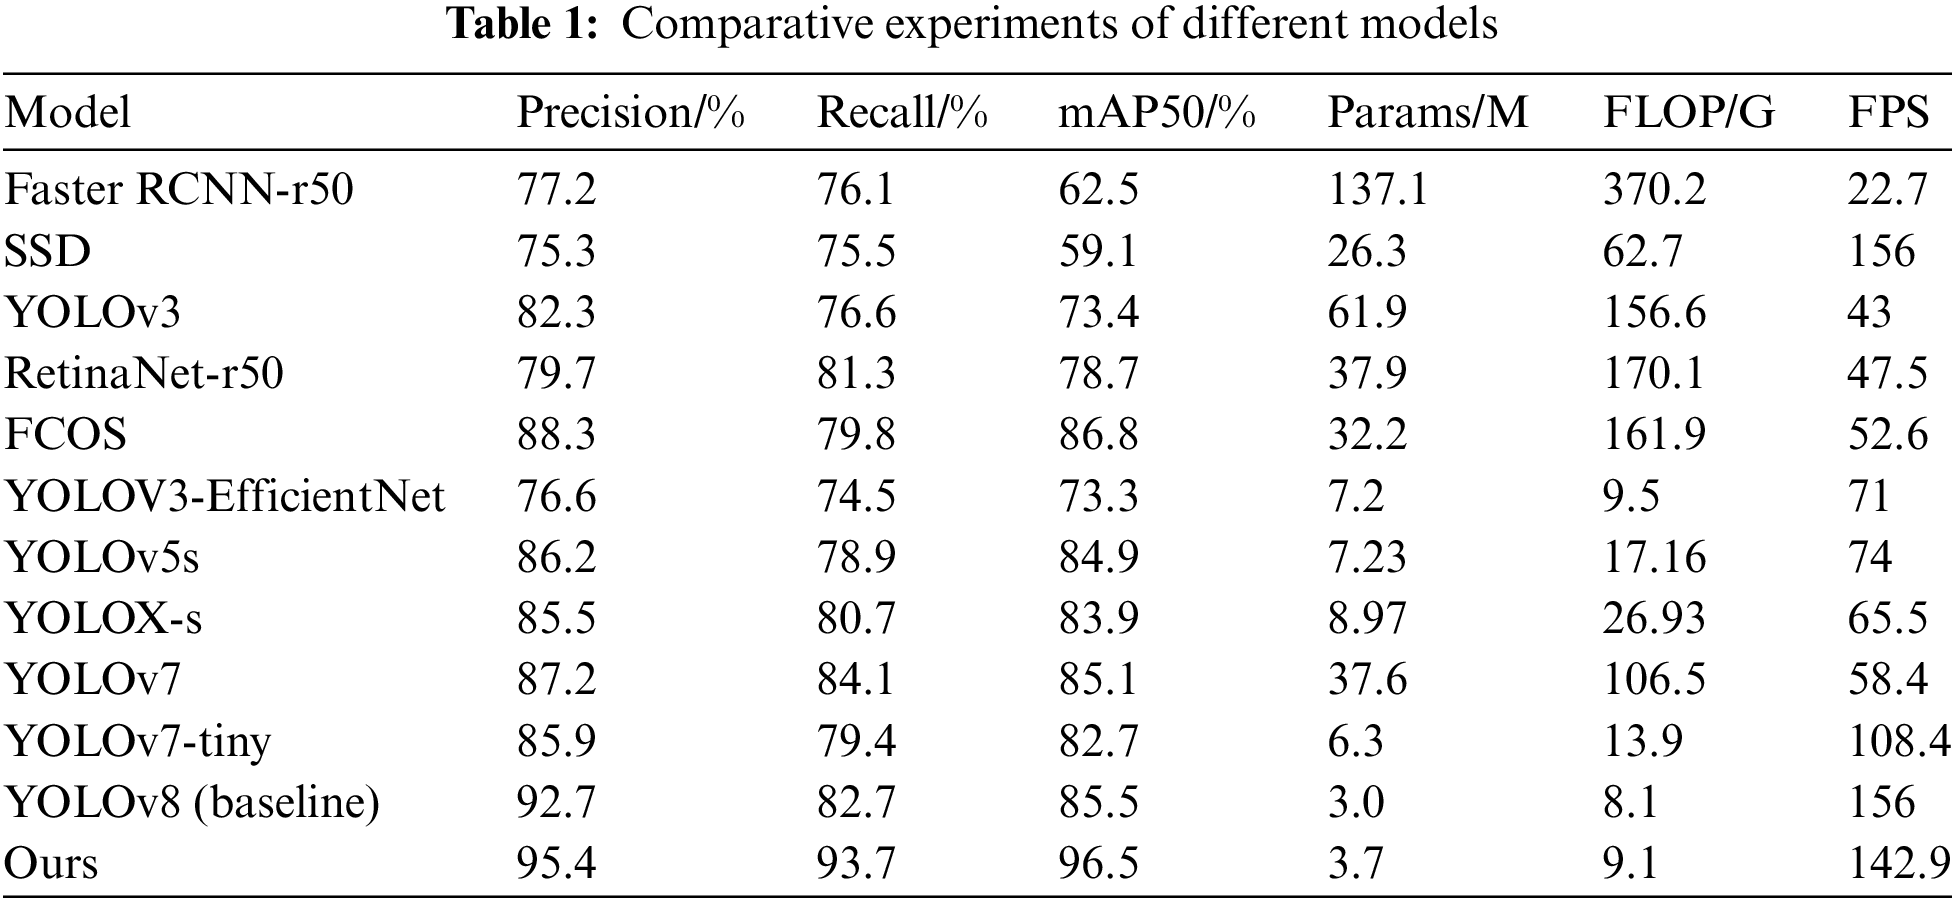
To verify the balance between precision and speed of the LCD screen defect detection algorithm proposed in this paper, we compared it with several advanced target detection algorithms under identical experimental conditions. The results are presented in Table 1. As shown, the two-stage network Faster R-CNN-r50 demonstrates significantly higher accuracy than other first-stage networks of its era. However, its speed is limited due to the need for generating candidate target frames before classification and regression operations, making real-time detection impractical. Additionally, the two-stage network’s parameter count and computational complexity are considerably higher compared to one-stage networks. On the other hand, the SSD algorithm, a standard one-stage network, excels in real-time performance and speed but falls short in detecting small targets compared to the two-stage algorithms, with slightly lower accuracy than Faster R-CNN. First-stage algorithms like YOLOv3, RetinaNet-r50, and FCOS [26] exhibit varying improvements in speed and accuracy. Yet, their complexity and parameter count have increased significantly due to network enhancements and additional parameters, with YOLOv3, for example, having 1.5 to 3 times more parameters and about twice the computational complexity compared to SSD. Later models such as YOLOv3-EfficientNet and YOLOX [27] address the speed and complexity issues of previous models while maintaining high accuracy. Our proposed algorithm outperforms other models in mAP50 and mAP50-95, and while its detection speed is slightly lower than the benchmark model, it still meets real-time requirements for LCD defect detection. Overall, our proposed model for small-scale LCD defect detection significantly outperforms other object detection models in accuracy while maintaining lower computational complexity and fewer parameters. Compared to the baseline model, although the parameter count increased by 0.7M, the mAP@50% improved by 12.9%, and the FPS reached 142.9. With a total processing time of 4.9 milliseconds per image, the model enables high-precision real-time detection.
A confusion matrix is a tool used to evaluate the performance of classification models by comparing the predicted results with the actual labels in a matrix format. It provides a clear visualization of the model’s correct classifications and various types of misclassifications. Figs. 12 and 13 present the confusion matrices for both the original model and the proposed YOLO-DEI model. The comparison clearly demonstrates that our proposed model significantly improves the accuracy in identifying line defects with large variations in scale. It effectively captures the diversity of features, thereby enhancing the overall performance of the model.
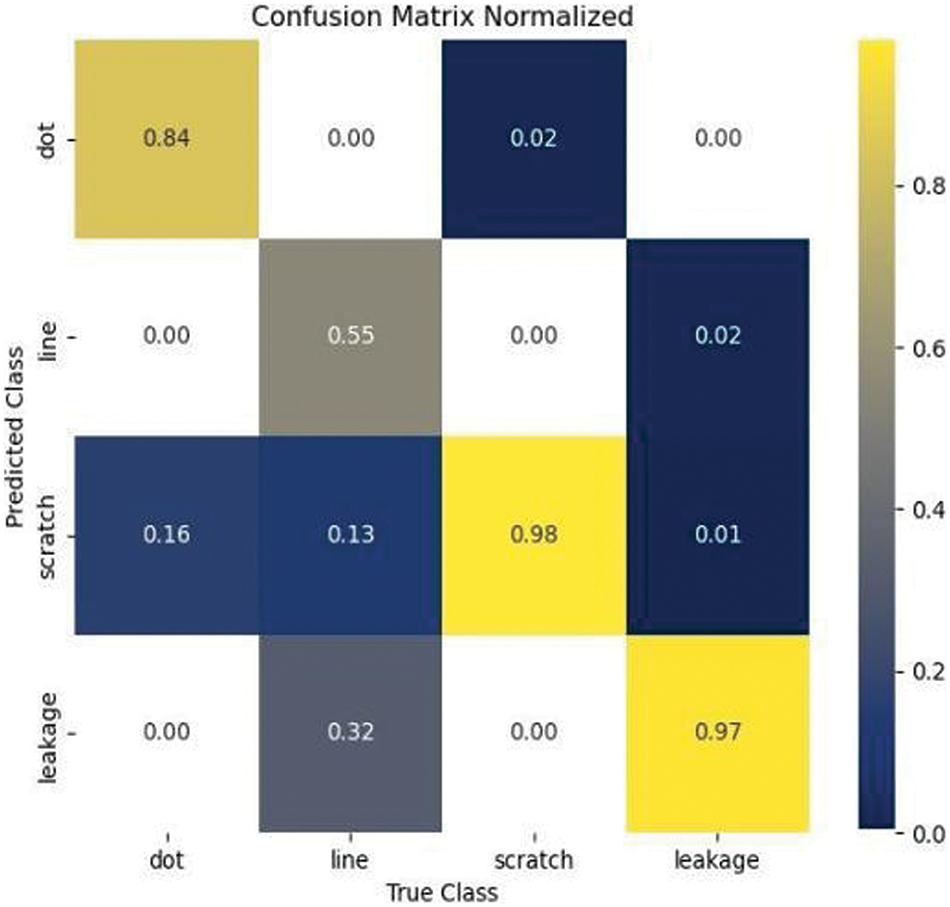
Figure 12: Confusion matrix of the original model

Figure 13: Confusion matrix of the YOLO-DEI
The results presented in Fig. 14 demonstrate the detection capabilities of several models under standardized conditions, where the input size was uniformly set to 640 × 640 to ensure experimental consistency. It is evident from the observations that the two-stage network, Faster R-CNN, exhibits superior accuracy in defect localization. However, its ability to detect small point defects is limited, likely due to its reduced sensitivity to minor feature details. On the other hand, while one-stage networks generally perform well in identifying defect types, they encounter difficulties in adapting to variations in defect shape and scale. This is particularly pronounced in the detection of line defects, which can vary significantly in length and width, sometimes extending across the entire screen. These variations challenge the models’ ability to accurately map the full extent of the defects. Moreover, the benchmark model YOLOv8 occasionally produces overlapping bounding boxes, likely due to substantial background color variations in the display panel, which complicate accurate defect differentiation. In contrast, the YOLO-DEI model proposed in this study addresses these challenges effectively. The incorporation of deformable convolution layers and the IGF module substantially enhances the model’s performance, particularly in detecting challenging point and line defects. The proposed model demonstrates improved accuracy in managing large-scale variations and mitigating issues related to overlapping detections. Overall, the method introduced in this paper exhibits superior performance in LCD defect detection compared to the other models evaluated, highlighting its potential for more accurate and reliable defect identification in complex scenarios.
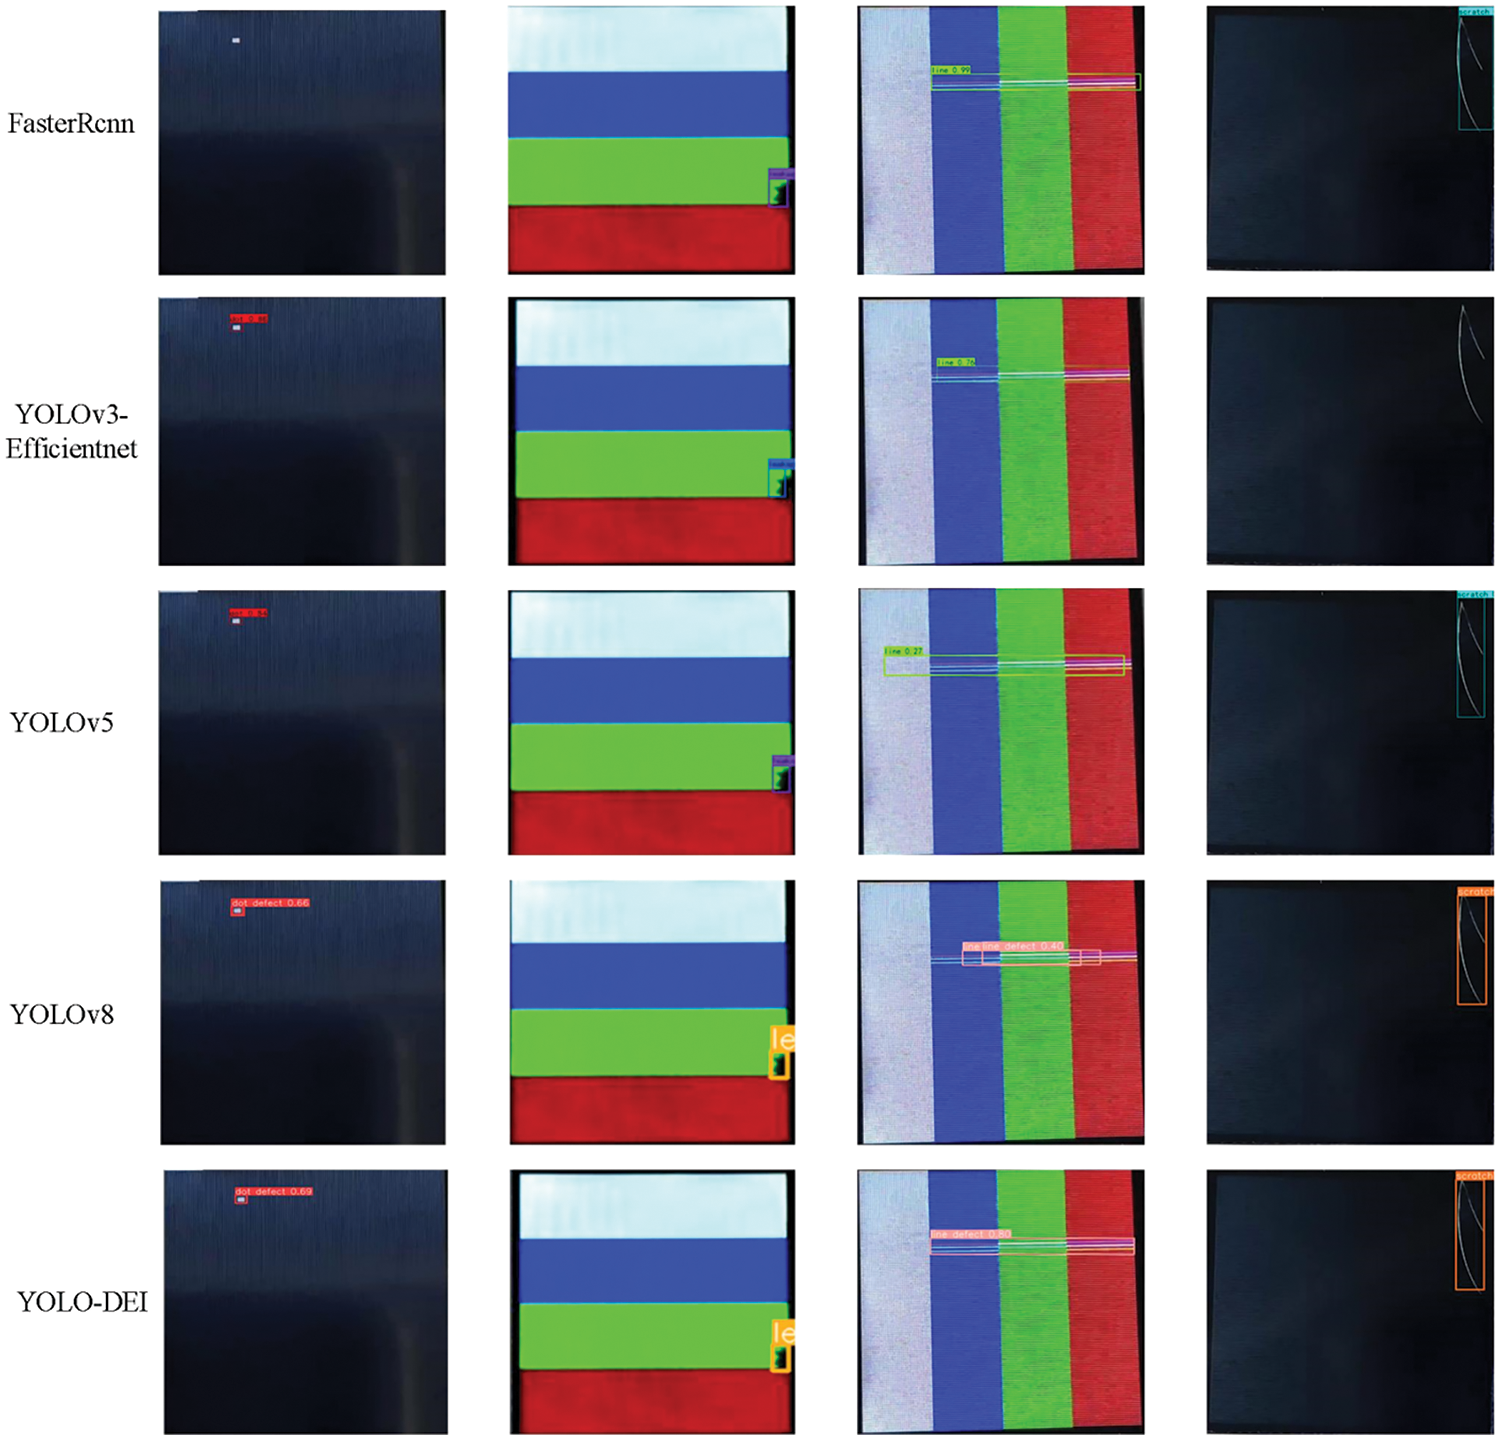
Figure 14: Different model inspection renderings
To further validate and explore the detection performance of the proposed algorithm and assess the effectiveness of the improved modules, this section presents ablation experiments demonstrating the advantages of using these innovations together, as detailed in Table 2. YOLOv8n serves as the benchmark model in these experiments, with consistent hyperparameters and hardware and software environments. ‘√’ indicates the inclusion of a module in each experimental group.
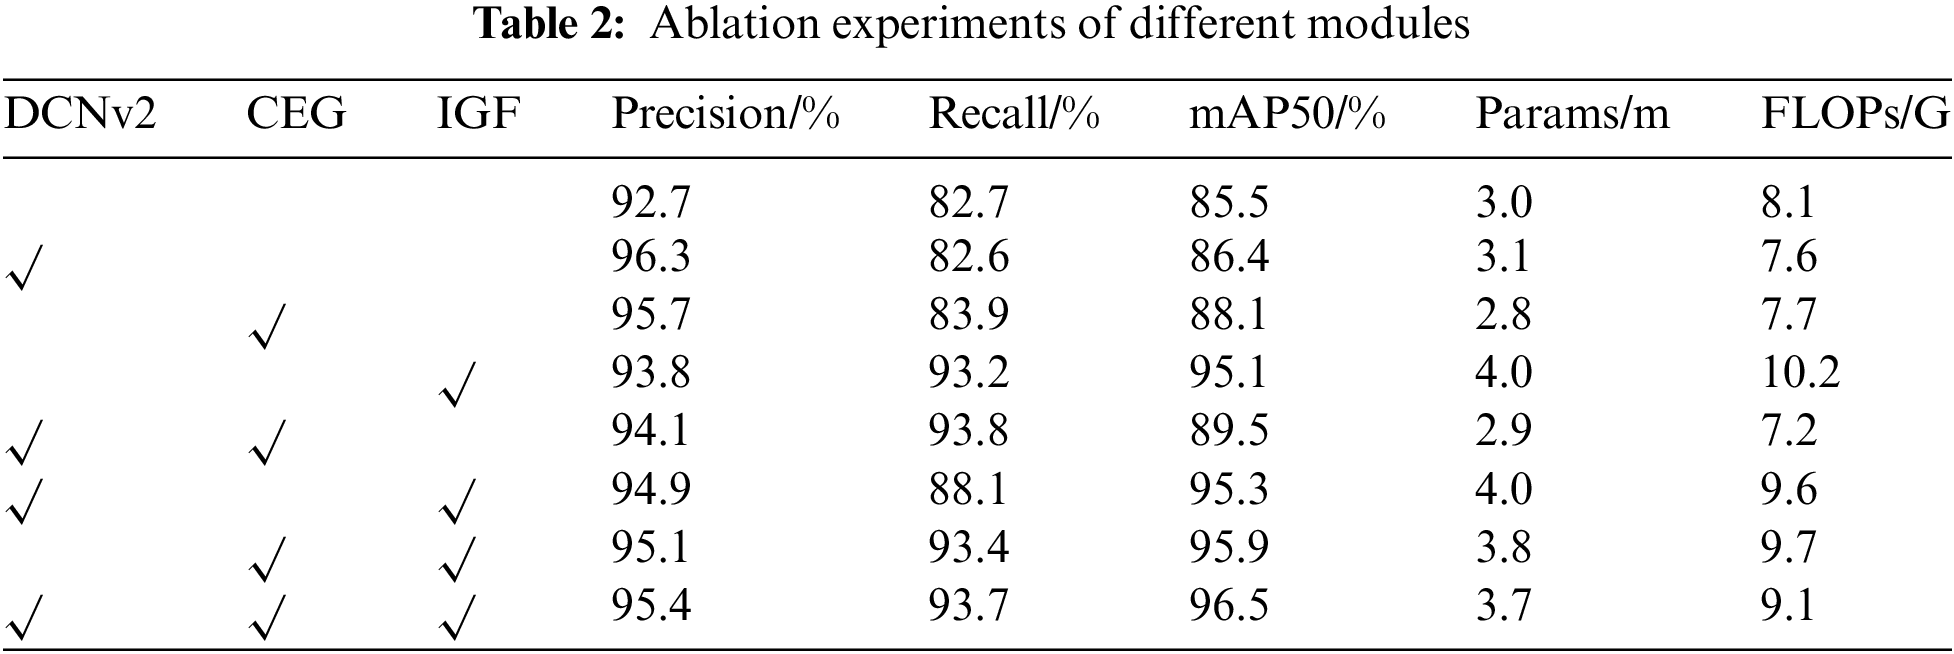
From the experimental data, it is observed that the YOLOv8 benchmark model achieves an accuracy of only 85.5%, which is insufficient for high-precision industrial production detection. Integrating the DCNv2 structure, which uses deformable convolutional kernels, improves feature capture compared to regular convolution, resulting in a modest accuracy increase and reduced computational complexity. The application of the improved CEG module, which generates additional feature maps through simple linear operations, enhances accuracy, parameter count, and complexity. This improvement is due to the minimal increase in parameters and computational simplicity compared to the baseline model. Incorporating the IGF module refines feature fusion by selectively weighting features, which improves the positional and semantic information provided to the detection head. This leads to a significant accuracy boost. The data also indicate a general trend of increasing accuracy with different module combinations. Ultimately, the YOLO-DEI model achieves a 12.9% improvement in mAP values and enhances other evaluation metrics compared to the original model, validating its effectiveness for detecting defects in small LCD screens.
To study the impact of internal feature extraction within the model and explore the degree of attention to specific feature regions by different models, this section investigates the heat maps of the baseline model and the proposed model, as shown in Fig. 15. By weighting the sum of gradient information, we obtain importance scores for each pixel relative to the target category.
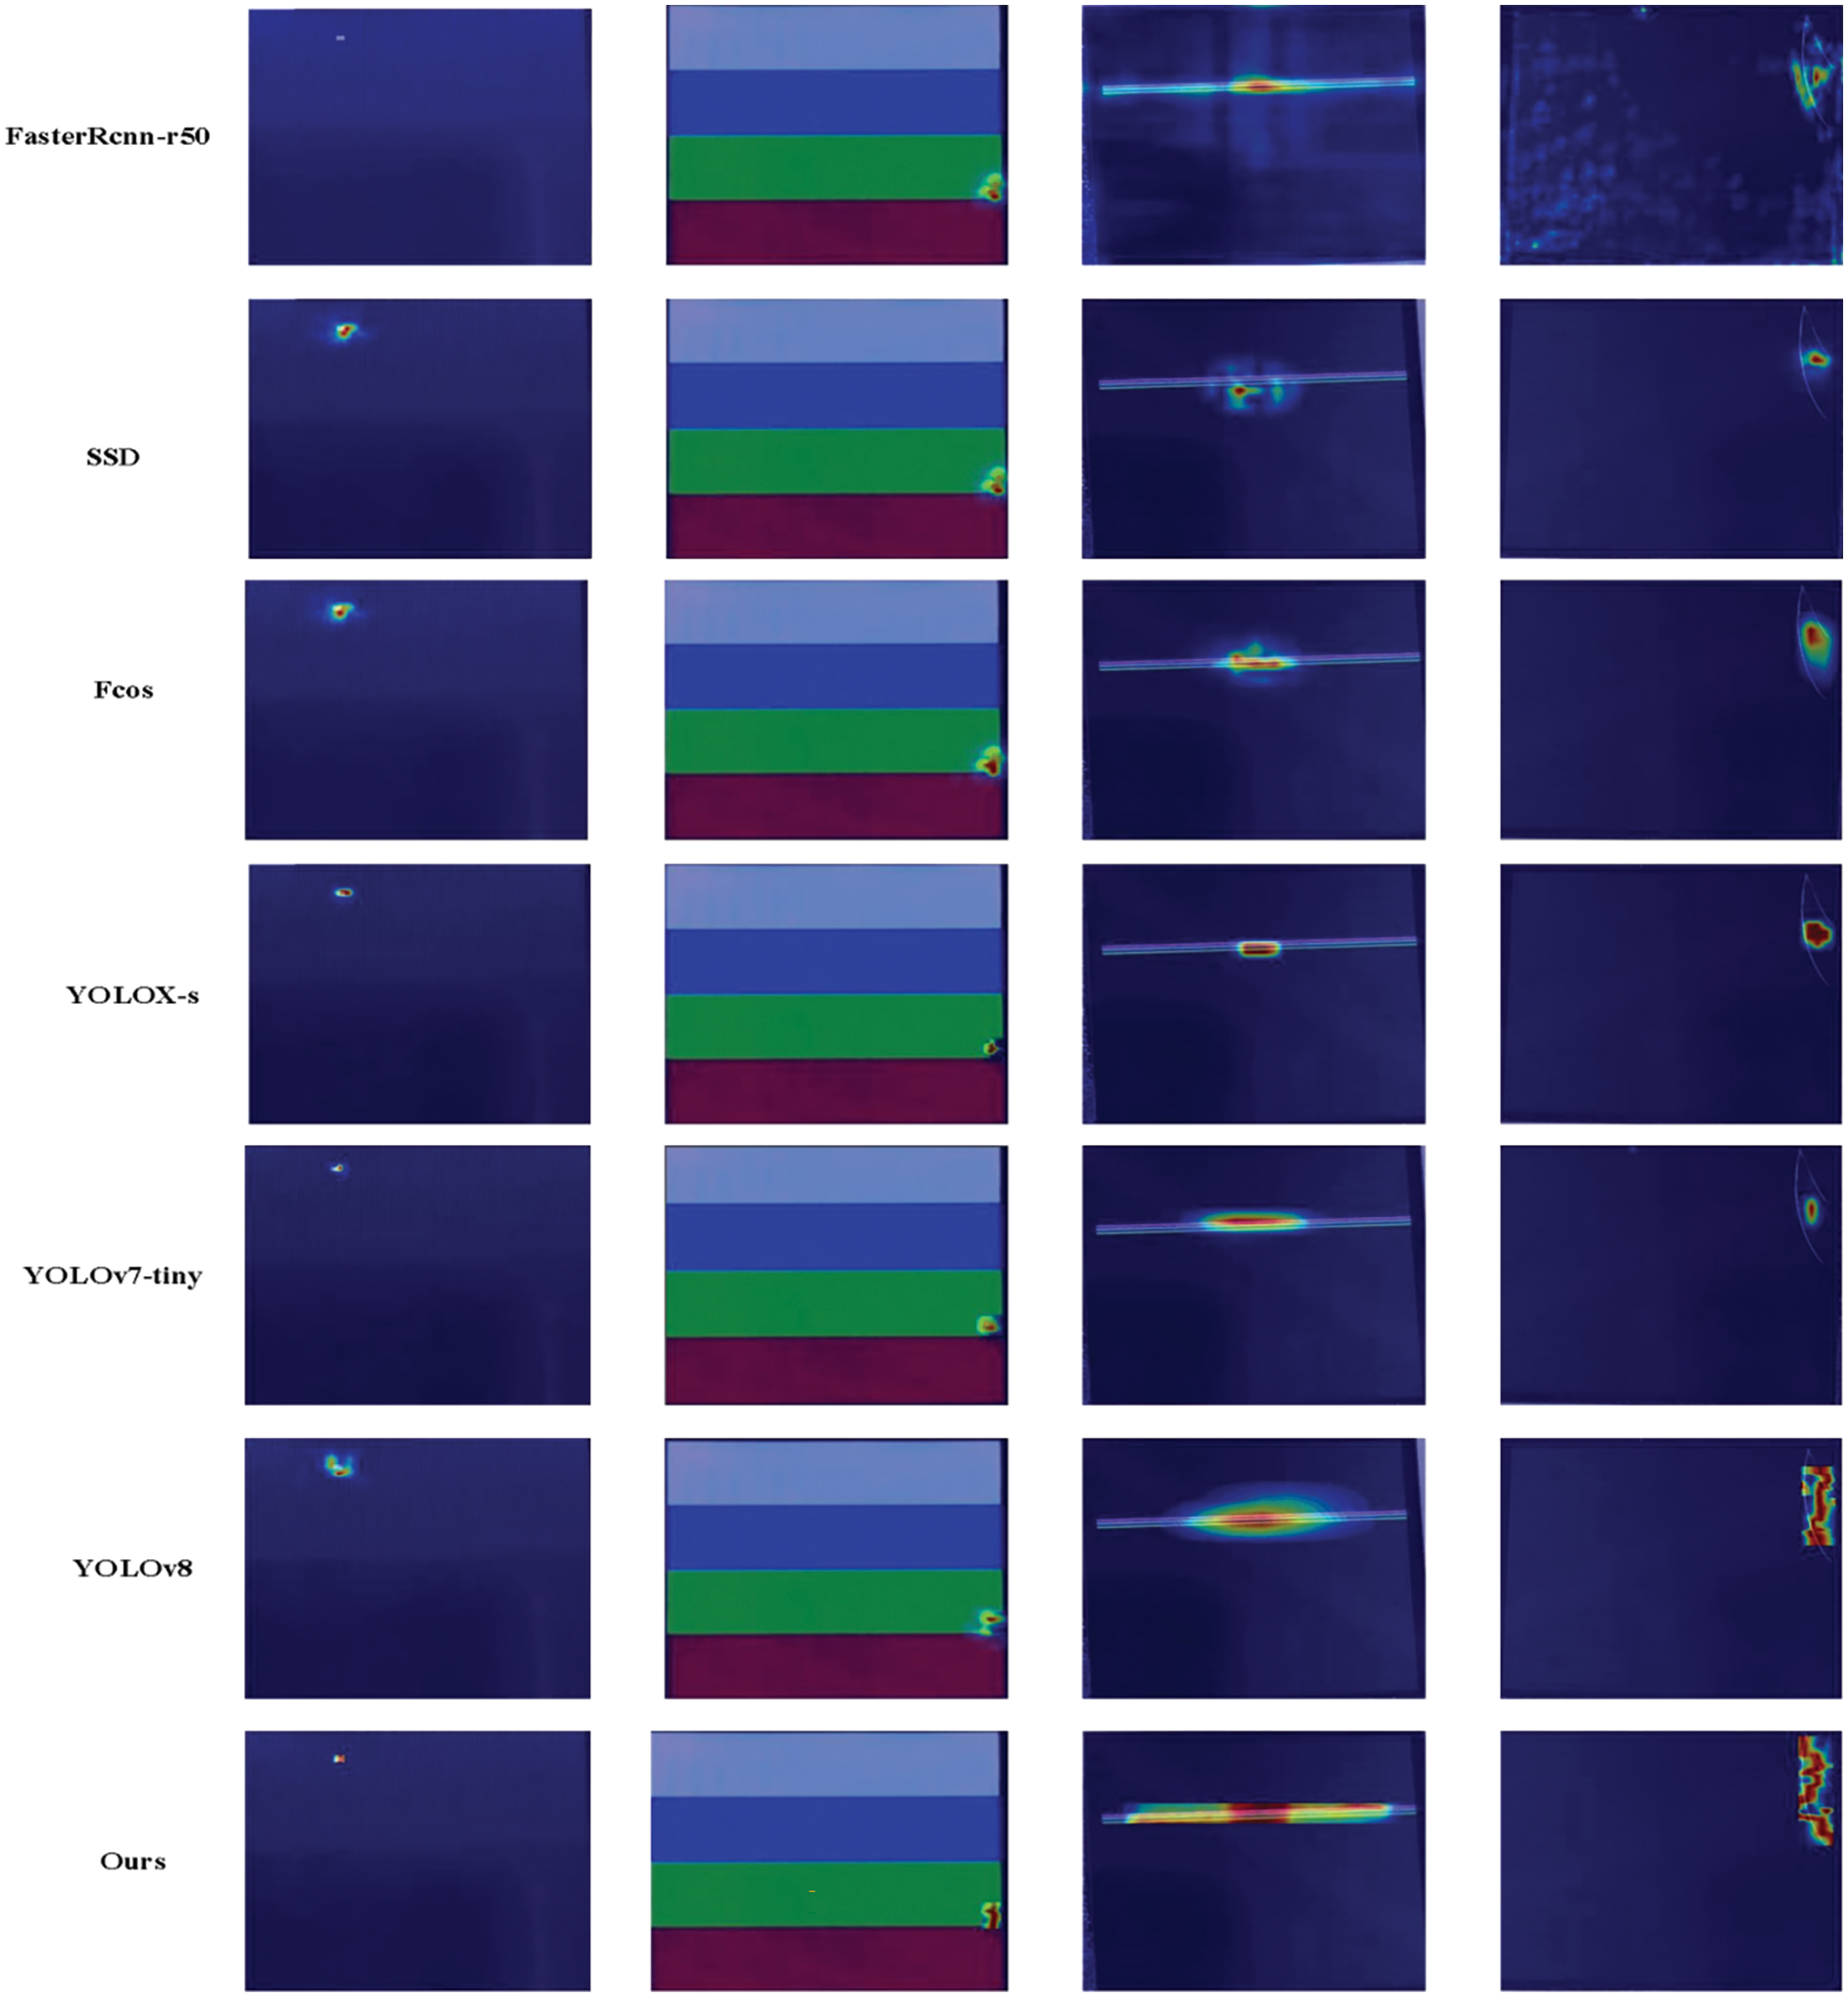
Figure 15: Heat map visualization of different models
The figure clearly shows that the original model fails to accurately identify extremely small point defects. Similarly, for line defects and scratches with significant scale variations, the original model struggles to focus on the entire defect, resulting in considerable discrepancies between the regression box and the ground truth box. In contrast, the proposed YOLO-DEI model accurately identifies various types of defects in the dataset and adapts to different scales of defect features. Specifically, for line defects and scratches, the YOLO-DEI model accurately recognizes the entire shape and size of the defect, thereby improving the precision of regression for the target box and enhancing detection accuracy.
To validate the generalization capability of the proposed YOLO-DEI model, we conducted tests using alternative defect datasets. Specifically, we utilized the NEU-DET steel dataset provided by Northeastern University, which includes both minor corrosion points and larger block defects. This dataset, comprising 1800 samples across six defect categories—crazing, inclusion, patches, pitted_surface, rolled-in_scale, and scratches—offers a robust basis for assessing the model’s generalization performance. Experimental results, as shown in Table 3, indicate that the YOLO-DEI model consistently surpasses the original YOLOv8 model in both mAP50% and mAP50–95% metrics. Notably, the YOLO-DEI model maintains a high detection speed with an FPS of 122 and an image processing time of approximately 7.5 ms, thereby enhancing accuracy without compromising efficiency.
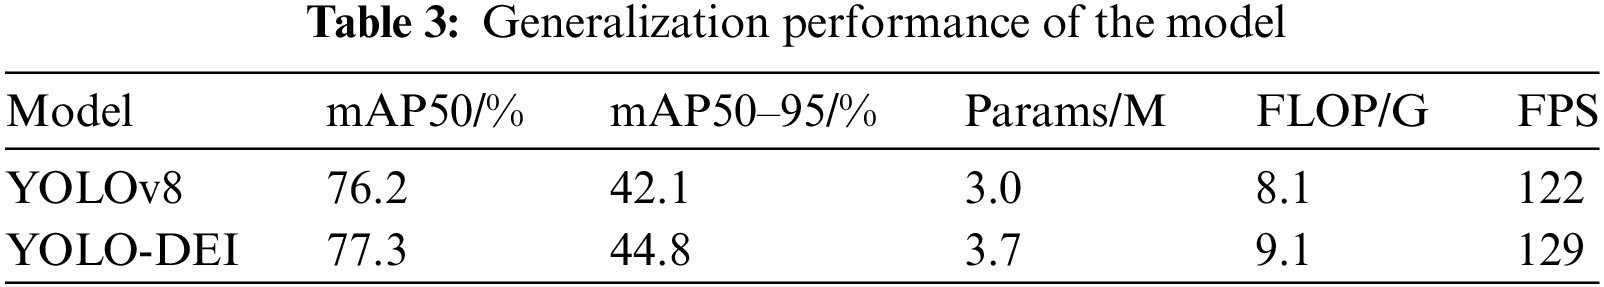
Fig. 16 provides a visual comparison of detection results, demonstrating that the YOLO-DEI model significantly mitigates missed detections, particularly in challenging scenarios with varying target sizes and dark backgrounds, compared to the original model. Although some missed detections remain, the overall miss detection rate is markedly reduced. These findings underscore the model’s high applicability in small LCD screen defect detection and suggest its potential for broader generalization to other defect domains.
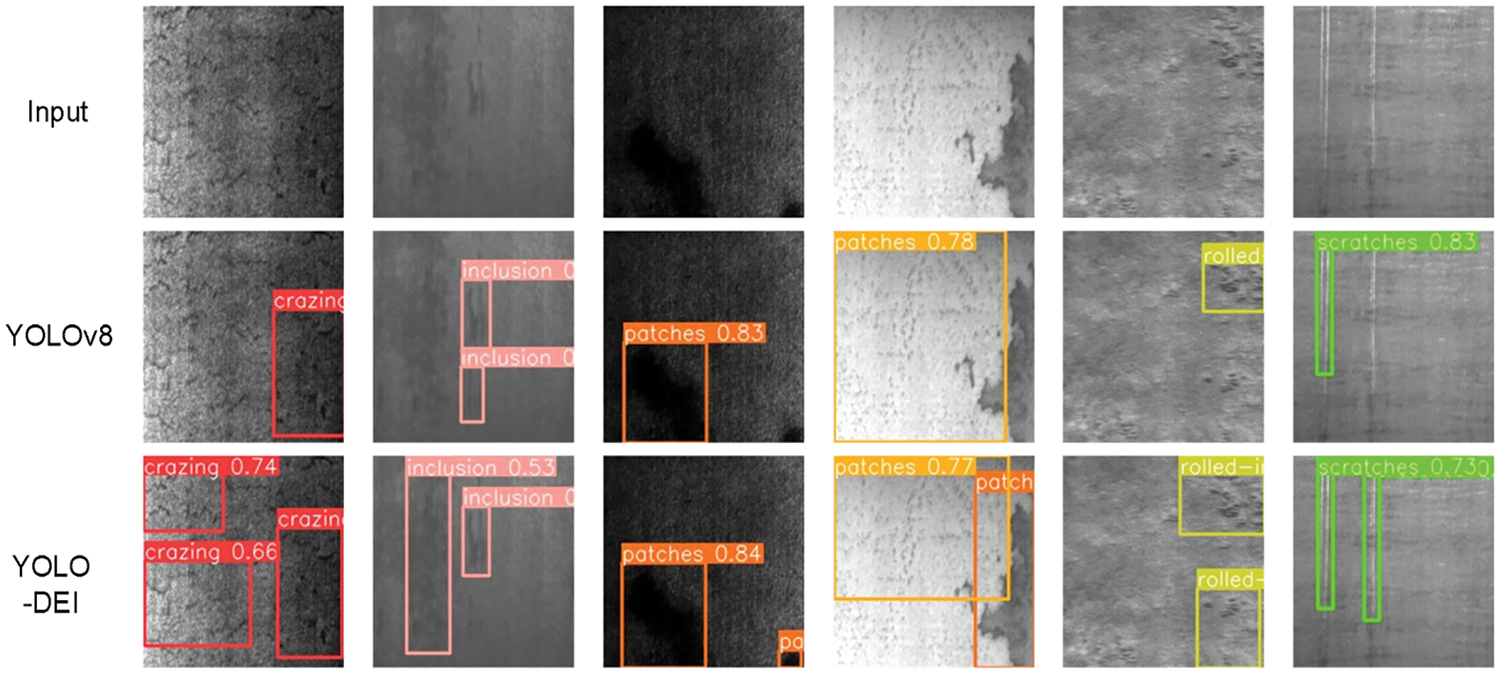
Figure 16: Visualization of generalization experiment results
This paper proposes the YOLO-DEI LCD defect detection algorithm to address issues such as missed detection, false detection, and inaccurate localization in small LCD defect detection. Extensive comparative and ablation experiments demonstrate the algorithm’s ability to effectively solve problems such as large-scale variations in line defects, inaccurate localization, and missed detection of point defects. The algorithm maintains nearly the same number of parameters and computational complexity as the original model, thereby improving accuracy without additional computational costs. We enhance feature extraction by replacing ordinary convolution with DCNv2 deformable convolution, enabling more precise extraction of defect locations and adaptation to defect shapes. Additionally, we propose the CEG feature extraction module to enhance feature reusability without additional costs, and introduce the IGF structure to further integrate crucial information among features, thereby improving the model’s feature fusion. The IGF structure effectively integrates essential information among different features, enhancing the overall performance of the model. Finally, there is considerable room for improvement in the algorithm’s generalization ability. Future work can focus on collecting defect samples of various types and sizes and modifying the model structure to enhance its generalization capability.
Acknowledgement: The authors of this article would like to express our sincere gratitude to the editors and reviewers for their invaluable advice and expert guidance, which significantly enhanced the quality of this research.
Funding Statement: The authors received no specific funding for this study.
Author Contributions: The authors confirm contribution to the paper as follows: study conception and design: Shi Luo; data collection: Shi Luo, Yuxing Zhao; analysis and interpretation of results: Shi Luo; draft manuscript preparation: Shi Luo, Sheng Zheng. All authors reviewed the results and approved the final version of the manuscript.
Availability of Data and Materials: The data that support the findings of this study are available from the corresponding author.
Ethics Approval: Not applicable.
Conflicts of Interest: The authors declare no conflicts of interest to report regarding the present study.
References
1. L. Zhao and Y. Wu, “Research progress of surface defect detection method based on machine vision,” (In ChineseJ. Instrum., vol. 43, no. 1, pp. 198–219, 2022. doi: 10.19650/j.cnki.cjsi.J2108805. [Google Scholar] [CrossRef]
2. X. Gui, S. Liu, L. Li, Q. Qing, and T. Li, “Improved YOLOv8-based pedestrian detection algorithm forscenic areas,” Comput. Eng., vol. 50, no. 7, pp. 342–351, 2024. doi: 10.19678/jissn.1000-3428.0068125. [Google Scholar] [CrossRef]
3. K. He, X. Zhang, S. Ren, and J. Sun, “Spatial pyramid pooling in deep convolutional networks for visual recognition,” IEEE Trans. Pattern Anal. Mach. Intell., vol. 37, no. 9, pp. 1904–1916, 2015. doi: 10.1109/TPAMI.2015.2389824. [Google Scholar] [PubMed] [CrossRef]
4. R. Girshick, “Fast R-CNN,” presented at the IEEE Int. Conf. Comput. Vis., Santiago, Chile, Dec. 7–13, 2015, pp. 1440–1448. [Google Scholar]
5. Z. Cai and N. Vasconcelos, “Cascade R-CNN: Delving into high quality object detection,” presented at the IEEE Conf. Comput. Vis. Pattern Recognit., Salt Lake City, UT, USA, Jun. 18–22, 2018, pp. 6154–6162. [Google Scholar]
6. W. Liu, D. Anguelov, D. Erhan, C. Szegedy, and S. Reed, “SSD: Single shot multibox detector,” in Comput. Vis.–ECCV 2016: 14th Eur. Conf., Amsterdam, The Netherlands, Springer International Publishing, Oct. 11–14, 2016, pp. 21–37. [Google Scholar]
7. T. Y. Lin, P. Goyal, R. Girshick, K. He, and P. Dollar, “Focal loss for dense object detection,” presented at the IEEE Int. Conf. Comput. Vis., Venice, Italy, Oct. 22–29, 2017, pp. 22–29. [Google Scholar]
8. Y. Zhang and J. Zhang, “Application of fuzzy expert system in defect inspection of TFT-LCD,” J. Optoelectron. Laser, vol. 17, no. 6, 2006, Art. no. 719. [Google Scholar]
9. K. Taniguchi, K. Ueta, and H. Onishi, “A method of mura intensity quantification using multi-level sliced images,” in 8th Int. Conf. on Qual. Control by Artif. Vis., Le Creusot, 2007. doi: 10.1117/12.736735. [Google Scholar] [CrossRef]
10. T. D. Zhang, R. S. Lu, and S. Z. Zhang, “Surface defect inspection of TFT-LCD panels based on 2D DFT,” Opto-Electron. Eng., vol. 43, no. 3, pp. 7–15, 2016. [Google Scholar]
11. Y. Y. Wang, J. Hou, M. S. Li, T. Xue, and X. Xiao, “Defect detection of LCD based on texture elimination,” (In ChineseElectron. Meas. Technol., vol. 44, no. 12, pp. 93–96, 2021. doi: 10.19651/j.cnki.emt.2106557. [Google Scholar] [CrossRef]
12. Q. Yang, Y. Q. Zhao, F. Zhang, and M. Liao, “Automatic segmentation of defect in high-precision and small-field TFT-LCD images,” Laser Optoelectron. Prog., vol. 59, no. 12, pp. 314–321, 2022. [Google Scholar]
13. K. Y. Song, H. Yang, and Z. P. Yin, “Multi-scale boosting feature encoding network for texture recognition,” IEEE Trans. Circuits Syst. Video Technol., vol. 31, no. 11, pp. 4269–4282, 2021. doi: 10.1109/TCSVT.2021.3051003. [Google Scholar] [CrossRef]
14. S. Mei, H. Yang, and Z. P. Yin, “Unsupervised-learning-based featurelevel fusion method for mura defect recognition,” IEEE Trans. Semicond. Manuf., vol. 30, no. 1, pp. 105–113, 2017. doi: 10.1109/TSM.2017.2648856. [Google Scholar] [CrossRef]
15. C. D. Dai, G. L. Xu, J. Mao, T. Gu, and J. Y. Luo, “Cell phone screen defect segmentation based on unsupervised networks,” Laser & Optoelectron. Prog., vol. 58, no. 20, pp. 375–384, 2021. doi: 10.3788/LOP202158.2015003. [Google Scholar] [CrossRef]
16. H. Yang, Y. F. Chen, K. Y. Song, and Z. P. Yin, “Multiscale featureclustering-based fully convolutional autoencoder for fast accurate visual inspection of texture surface defects,” IEEE Trans. Autom. Sci. Eng., vol. 16, no. 3, pp. 1450–1467. doi: 10.1109/TASE.2018.2886031. [Google Scholar] [CrossRef]
17. S. Woo, J. Park, J. Y. Lee, and I. S. Kweon, “CBAM: Convolutional block attention module,” presented at the Eur. Conf. Comput. Vis. (ECCV), Munich, Germany, Sep. 8–14, 2018, pp. 3–19. [Google Scholar]
18. Y. Liu, Z. Shao, and N. Hoffmann, “Global attention mechanism: Retain information to enhance channel-spatial interactions,” 2021, arXiv:2112.05561. [Google Scholar]
19. A. Liang, Q. Wang, and X. Wu, “Context-enhanced network with spatial-aware graph for smartphone screen defect detection,” Sensors, vol. 24, no. 11, 2024, Art. no. 3430. doi: 10.3390/s24113430. [Google Scholar] [PubMed] [CrossRef]
20. H. Peng, B. Zhou, and W. Ouyang, “Research on lightweight PCB defect detection based on dual-channel attention,” Optoelectroni. Laser, vol. 35, no. 5, pp. 506–515, 2024. doi: 10.16136/j.joel.2024.05.0707. [Google Scholar] [CrossRef]
21. R. Wang, R. Shivanna, and D. Cheng, “DCN V2: Improved deep & cross network and practical lessons for web-scale learning to rank systems,” presented at the WWW '21: The Web Conf. 2021, Ljubljana, Slovenia, Apr. 19–23, 2021. doi: 10.1145/3442381.3450078. [Google Scholar] [CrossRef]
22. J. Dai et al., “Deformable convolutional networks,” presented at the IEEE Int. Conf. Comput. Vis., Venice, Italy, Oct. 22–29, 2017, pp. 764–773. [Google Scholar]
23. K. Han, Y. Wang, Q. Tian, J. Guo, and C. Xu, “GhostNet: More features from cheap operations,” in Proc. of the IEEE Comput. Soc. Conf. on Comput. Vis. and Pattern Recognit., 2020, pp. 1577–16158. [Google Scholar]
24. W. Xu and Y. Wan, “ELA: Efficient local attention for deep convolutional neural networks,” 2024. doi: 10.48550/arXiv.2403.01123. [Google Scholar] [CrossRef]
25. L. Yang, R. Y. Zhang, L. Li, and X. Xie, “SimAM: A simple, parameter-free attention module for convolutional neural networks,” presented at the Int. Conf. Mach. Learn., Jul. 18–24, 2021. [Google Scholar]
26. Z. Tian, X. Chu, X. Wang, X. Wei, and C. Shen, “FCOS: Fully convolutional one-stage object detection,” presented at the 2019 IEEE/CVF Int. Conf. Comput. Vis. (ICCV), Seoul, Republic of Korea, Oct. 27–Nov. 2, 2019. doi: 10.1109/ICCV.2019.00972. [Google Scholar] [CrossRef]
27. Z. Ge, “Exceeding YOLO series in 2021,” 2021. doi: 10.48550/arXiv.2107.08430. [Google Scholar] [CrossRef]
Cite This Article
 Copyright © 2024 The Author(s). Published by Tech Science Press.
This work is licensed under a Creative Commons Attribution 4.0 International License , which permits unrestricted use, distribution, and reproduction in any medium, provided the original work is properly cited.
 Downloads
 Citation Tools