
 Submit a Paper
 Propose a Special lssue
 Open Access
TECHNICAL REPORT

User Instructions for the Dynamic Database of Solid-State Electrolyte 2.0 (DDSE 2.0)
Advanced Institute for Materials Research (WPI-AIMR), Tohoku University, Sendai, 980-8577, Japan
* Corresponding Author: Hao Li. Email:
Computers, Materials & Continua 2024, 81(3), 3413-3419. https://doi.org/10.32604/cmc.2024.060288
Received 29 October 2024; Accepted 27 November 2024; Issue published 19 December 2024
 View Full Text
 Download PDF
Abstract
The Dynamic Database of Solid-State Electrolyte (DDSE) is an advanced online platform offering a comprehensive suite of tools for solid-state battery research and development. Its key features include statistical analysis of both experimental and computational solid-state electrolyte (SSE) data, interactive visualization through dynamic charts, user data assessment, and literature analysis powered by a large language model. By facilitating the design and optimization of novel SSEs, DDSE serves as a critical resource for advancing solid-state battery technology. This Technical Report provides detailed tutorials and practical examples to guide users in effectively utilizing the platform.Keywords
The Dynamic Database of Solid-State Electrolytes (DDSE) [1,2] is an online platform designed to compile and organize data on inorganic solid-state electrolytes (SSEs) with various cations, including Li+, K+, Na+, Ag+, Mg2+, Ca2+, and Zn2+, sourced from experimental and computational studies (Fig. 1). As of 23 November 2024, DDSE contains 2349 experimental materials (18,309 performance records) and 601 computational materials (802 performance records) from over 748 publications. With the latest update, DDSE 2.0 now includes SSEs based on polymers and metal-organic frameworks (MOFs), expanding its coverage.

Figure 1: The interface of DDSE 2.0. The interactive pie chart allows users to obtain additional information by hovering or clicking
This user-friendly platform offers an array of material properties, such as activation energy (Ea), ionic conductivity (σ), phase transitions, and literature sources. Users can explore these properties through interactive charts, making it easier to identify correlations and trends in the data.
DDSE 2.0 also allows researchers to upload their data for comparison with existing materials and leverages an integrated large language model to mine and analyze references within the database, enhancing the design of innovative SSEs.
Access to the platform is available at: https://www.ddse-database.org/ (accessed on 27 November 2024), where users can explore real-time updates, available materials, and tutorial resources.
The data for DDSE 2.0 were collected from experimental and computational studies published in over 748 peer-reviewed sources. The materials were categorized according to cation type (Li+, K+, Na+, Ag+, Mg2+, Ca2+, and Zn2+) and expanded to include SSEs based on polymers and metal-organic frameworks (MOFs).
Key material properties, including activation energy (Ea), ionic conductivity (σ), and phase transitions, were extracted and recorded for each material. These data were organized to allow users to investigate relationships between different properties using interactive charts available on the platform.
To support innovative research, DDSE 2.0 integrates a large language model that facilitates automated mining and analysis of the references stored within the database. Users can also input their own data, which is stored alongside the existing entries for comparison. The platform’s user interface includes a control panel for navigation, where users can browse materials, access tutorials, and explore various features designed to support their research.
3.1 Navigating to Different Modules
Users can perform specific operations within each module by navigating to different options (i.e., Experimental Data, Computational Data, and Polymers). As shown in Fig. 2, users can select different material properties from the left panel when accessing the “Experimental Data” module. The relationships between these properties will be immediately displayed on the screen and can be adjusted using the control panel. Additionally, other properties can be mapped onto the plot using different colors and sizes. As illustrated in Fig. 2, different colors represent the distribution of monovalent and divalent materials, allowing users to highlight specific material classifications from the legend. Similarly, different conducting cations can be marked in various colors, and users can individually select the distribution of each cation in the legend, as shown in Fig. 3a for Mg2+ and K+.

Figure 2: Experimental data module. This module presents experimental data for the materials in the database, allowing users to screen and sort materials of interest


Figure 3: Material distribution across different screening strategies. The point’s size presents the activation energy value. (a) Distribution of Mg2+ and K+ based materials. (b) Detailed information on Li2.7Er0.7Zr0.3Cl6 displayed in a text box. (c) The relationship between ionic conductivity and 1000/T for Li2.7Er0.7Zr0.3Cl6. (d) The literature source of the corresponding material
The database offers other strategies for screening materials. Users can adjust sliders to obtain materials within a specified temperature range and highlight areas of interest. Detailed information for individual data points is available by hovering over them with the mouse. Fig. 3b shows the distribution and detailed information (in a text box) of the compound Li2.7Er0.7Zr0.3Cl6 within the selected area. Furthermore, users can enter the corresponding chemical formula in the panel to retrieve the materials’ ionic conductivity (Fig. 3c) and data source (Fig. 3d).
In the Computational and Polymers modules, users can perform similar operations to screen materials and visualize their properties. Interestingly, the Computational module offers a feature for visualizing the geometric structures of materials. Upon accessing the Computational Data module (in Fig. 4), users can select compounds from the left-side control panel to check their geometric structures, with the source displayed below the selection box. Additionally, users can interactively manipulate the image and download the structures in VASP file format.

Figure 4: The interactive window for compound MgB12H12·12H2O. This feature is in the computational data module and the display style can be modified through the right panel
3.2 How Can Users Analyze the Properties of Their Materials with Previously Reported Data?
Another important feature of the database is that users can compare and analyze their materials against all compounds in the database. This feature is demonstrated in Fig. 5. The Ea value is obtained using the Arrhenius equation when the temperature and corresponding ionic conductivity are entered in the control panel. Similarly, users can view the distribution of their data with that of the database via the panel (as shown in Fig. 5b). Users can select a material group from the database to compare with their data. As shown in Fig. 5c, the percentage and distribution chart present how the user’s Ea value relates to those previously reported for other materials. The percentage is calculated using the formula (N/N_total * 100%), where N represents the number of Ea values in the database that exceed the user’s value, and N_total is the total number of materials in the database. The table below the distribution chart evaluates the statistical data of the selected group, including the minimum value (Ea_min), maximum value (Ea_max), mean (Ea_mean), median (Ea_median), standard deviation (Ea_std), and variance (Ea_var).
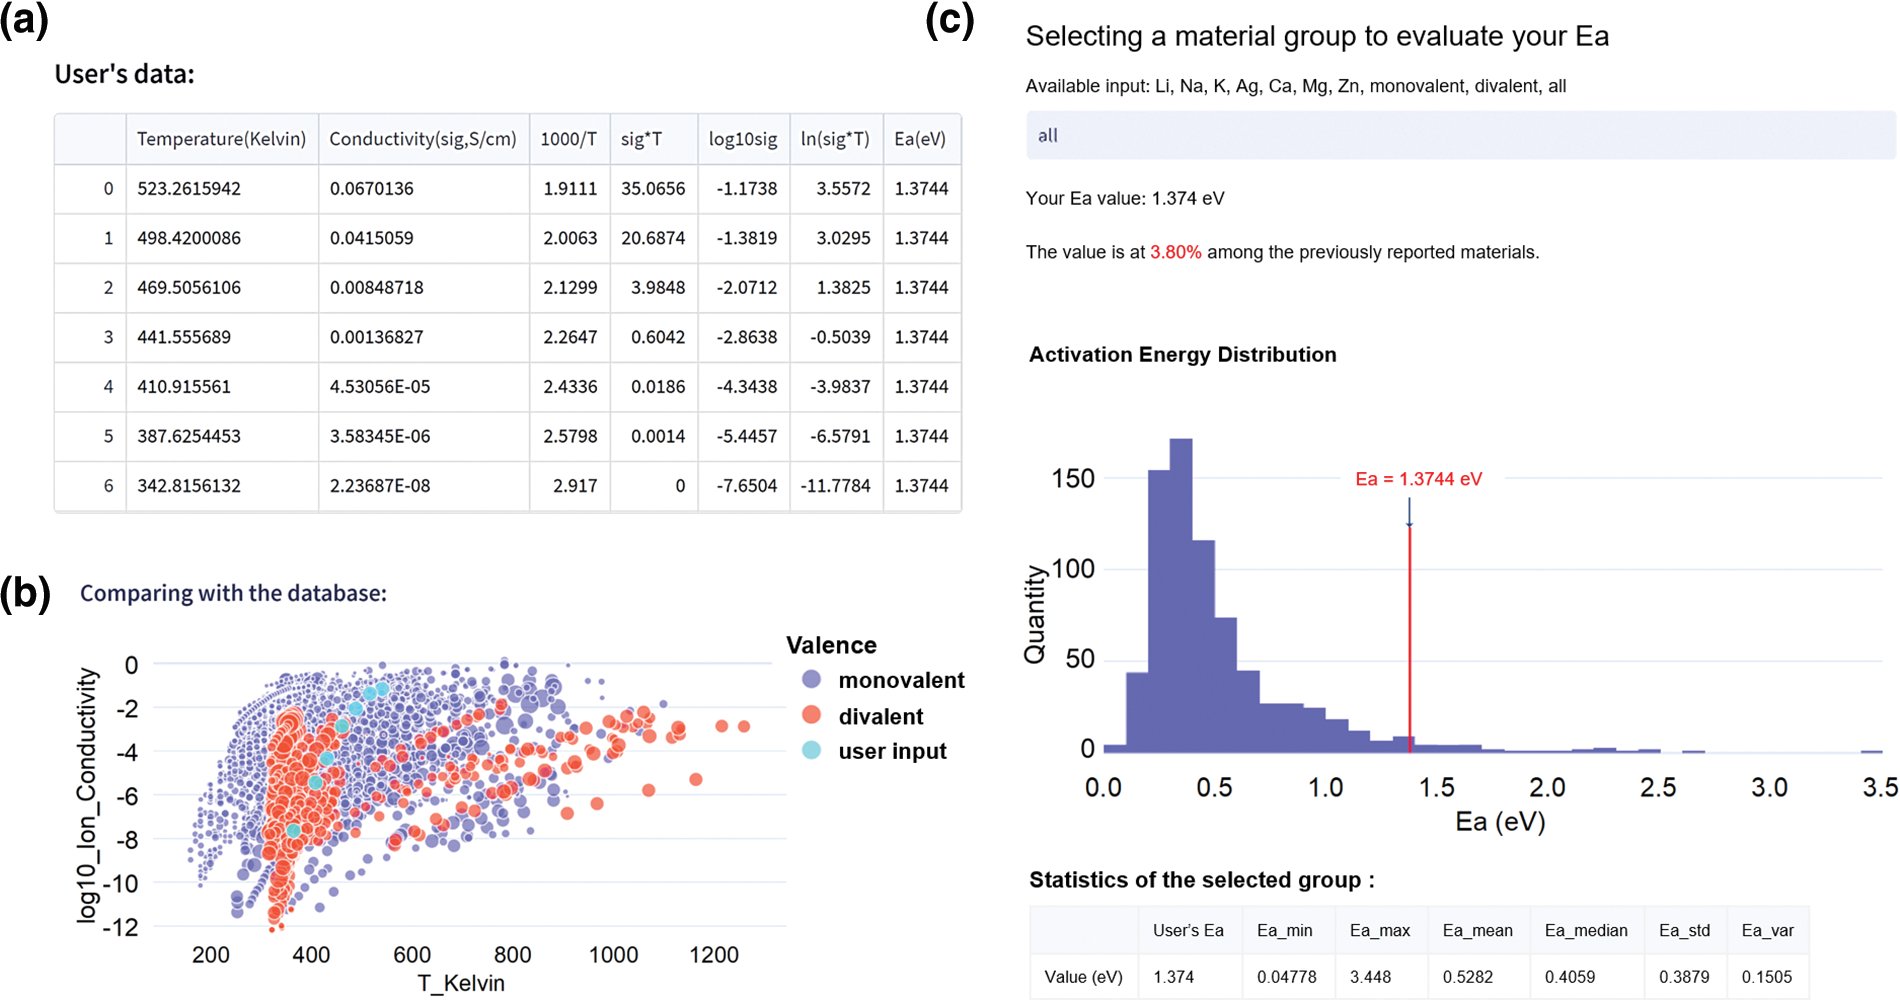
Figure 5: Comparing user data with previously reported materials. (a) Example: A user’s input material information. The corresponding characteristics can be computed by the database. (b) The distribution of ionic conductivity by comparing the user’s data with the previously published data. (c) Ea’s distribution for comparative analysis
3.3 Reading and Analyzing Literature via a Large Language Model
The database also supports an additional key feature: users can utilize a built-in large language model to read and analyze the literature associated with the data. The database has collected literature corresponding to the materials, and users can rapidly obtain abundant information via the large language model. This model can also answer questions and provide suggestions based on the selected literature.
The large language model can be activated by navigating to the Experimental Data module via the left-side control panel, as shown in Fig. 6. Users can utilize the material distribution window to select materials of interest. As depicted in Fig. 3b, hovering over a data point provides the source of the literature (i.e., the DOI of a paper). Users can utilize this DOI to get the corresponding literature in the large language model window for further interpretation.
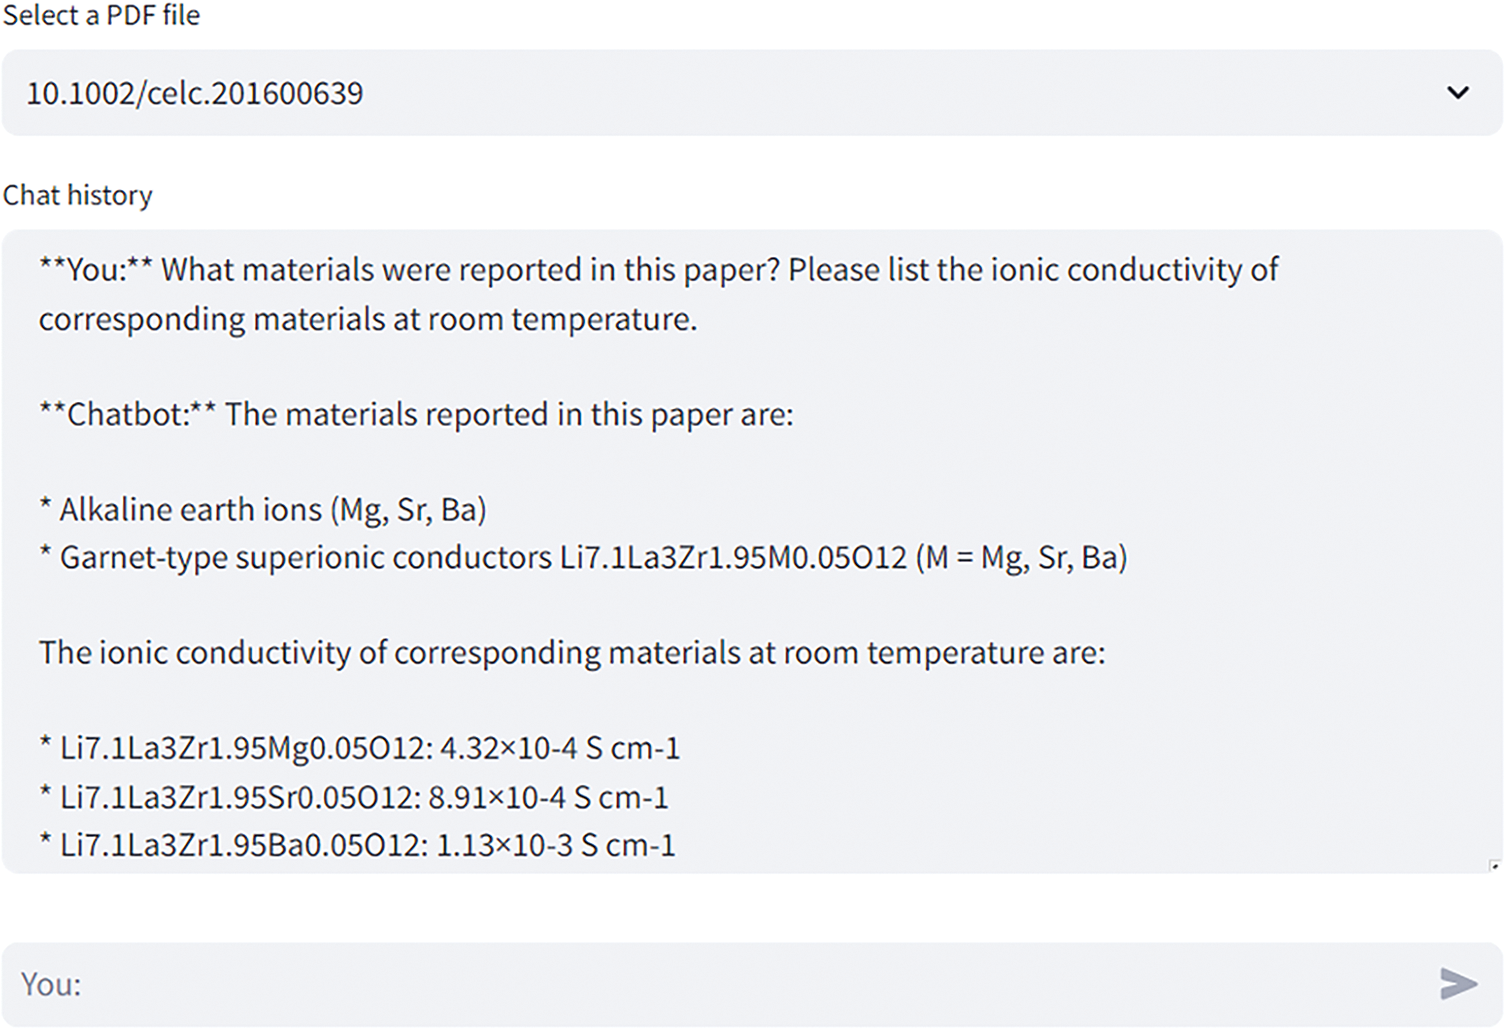
Figure 6: The large language model window. Users can find this function in the experimental data module
The DDSE 2.0 provides an innovative and comprehensive platform for advancing solid-state battery research. By integrating statistical data analysis, interactive visualization tools, user data assessment, and literature analysis powered by a large language model, DDSE 2.0 enables researchers to efficiently explore and optimize SSEs. Its capabilities are particularly well-suited for addressing the complex challenges of SSE design and facilitating data-driven material innovations [3].
This Technical Report has detailed the platform’s features, offering step-by-step tutorials and practical examples to ensure ease of use and maximize its impact on research applications. By bridging data analysis with user-friendly tools, DDSE 2.0 is poised to significantly enhance the development of next-generation solid-state batteries.
Acknowledgement: The authors acknowledge Prof. Shin-ichi Orimo, Prof. Kazuaki Kisu, and Prof. Ryuhei Sato for their contribution in developing the DDSE database.
Funding Statement: The authors received no specific funding for this study.
Author Contributions: Fangling Yang and Qian Wang prepared the figures. Di Zhang maintained the DDSE system. Fangling Yang wrote the paper. Fangling Yang, Eric Jianfeng Cheng and Hao Li revised the paper. Hao Li supervised the project. All authors reviewed the results and approved the final version of the manuscript.
Availability of Data and Materials: The data that support the findings of this study are openly available in The Dynamic Database of Solid-State Electrolyte (DDSE) at https://www.ddse-database.org/. (accessed on 22 October 2024).
Ethics Approval: Not applicable.
Conflicts of Interest: The authors declare no conflicts of interest to report regarding the present study.
References
1. F. Yang et al., “A dynamic database of solid-state electrolyte (DDSE) picturing all-solid-state batteries,” Nano Mater. Sci., vol. 6, no. 2, pp. 256–262, 2024. doi: 10.1016/j.nanoms.2023.08.002. [Google Scholar] [CrossRef]
2. A dynamic database of solid-state electrolyte (DDSE) picturing all-solid-state batteries. 2023. Accessed: Oct. 29, 2024. [Online]. Available: https://doi.org/10.50974/00137195. [Google Scholar] [CrossRef]
3. F. Yang et al., “Data-driven viewpoints for developing next-generation mg-ion solid-state electrolytes,” J. Electrochem., vol. 30, no. 7, 2024, Art. no. 2415001. doi: 10.61558/2993-074X.3461. [Google Scholar] [CrossRef]
Cite This Article
 Copyright © 2024 The Author(s). Published by Tech Science Press.
This work is licensed under a Creative Commons Attribution 4.0 International License , which permits unrestricted use, distribution, and reproduction in any medium, provided the original work is properly cited.
 Downloads
 Citation Tools