
 Submit a Paper
 Propose a Special lssue
 Open Access
ARTICLE

Efficient Data Aggregation and Message Transmission for Information Processing Model in the CPS-WSN
1 College of Engineering, Xi’an International University, Xi’an, 710077, China
2 School of Cyber Science and Engineering, Qufu Normal University, Qufu, 273165, China
* Corresponding Author: Qingqing Yang. Email:
Computers, Materials & Continua 2025, 82(2), 2869-2891. https://doi.org/10.32604/cmc.2024.058122
Received 04 September 2024; Accepted 24 October 2024; Issue published 17 February 2025
 View Full Text
 Download PDF
Abstract
The Cyber-Physical Systems (CPS) supported by Wireless Sensor Networks (WSN) helps factories collect data and achieve seamless communication between physical and virtual components. Sensor nodes are energy-constrained devices. Their energy consumption is typically correlated with the amount of data collection. The purpose of data aggregation is to reduce data transmission, lower energy consumption, and reduce network congestion. For large-scale WSN, data aggregation can greatly improve network efficiency. However, as many heterogeneous data is poured into a specific area at the same time, it sometimes causes data loss and then results in incompleteness and irregularity of production data. This paper proposes an information processing model that encompasses the Energy-Conserving Data Aggregation Algorithm (ECDA) and the Efficient Message Reception Algorithm (EMRA). ECDA is divided into two stages, Energy conservation based on the global cost and Data aggregation based on ant colony optimization. The EMRA comprises the Polling Message Reception Algorithm (PMRA), the Shortest Time Message Reception Algorithm (STMRA), and the Specific Condition Message Reception Algorithm (SCMRA). These algorithms are not only available for the regularity and directionality of sensor information transmission, but also satisfy the different requirements in small factory environments. To compare with the recent HPSO-ILEACH and E-PEGASIS, DCDA can effectively reduce energy consumption. Experimental results show that STMRA consumes 1.3 times the time of SCMRA. Both optimization algorithms exhibit higher time efficiency than PMRA. Furthermore, this paper also evaluates these three algorithms using AHP.Keywords
Cyber-Physical Systems (CPS) represent a new generation of intelligent systems that integrate physical and digital technologies to achieve more efficient automation, control, and decision-making across various applications. CPS incorporates sensors, processors, actuators, communication networks, and cloud computing to create systems capable of sensing, analyzing, and responding to changes in their physical environments in real-time. Beyond merely integrating physical and digital technologies, CPS relies on advanced algorithms and software to analyze vast amounts of data in real-time, make predictions and decisions based on this data, and optimize their behavior to achieve specific goals [1].
CPS supported by Wireless Sensor Networks (WSN) have attracted widespread attention due to their ability to integrate physical and computational elements for real-time data collection and analysis. WSN plays a vital role in CPS, facilitating the collection of sensory data, enabling inter-connectivity, and supporting seamless communication between physical and virtual components [2].
In WSN, data aggregation is crucial for reducing the amount of transmitted data. Large-scale industrial applications are primarily based on wireless sensor nodes. In a real-time physical environment, sensors operate with minimal power, encompassing sensing, communication, and data processing. Data aggregation is the process of summarizing and combining sensor data to reduce the amount of data transmitted across the network. Sensor nodes are energy-constrained devices, and energy consumption is often correlated with the amount of data collected, as communication is typically the most energy-intensive activity. This paper investigates the relationship between energy and the data aggregation process and proposes the Energy-Conserving Data Aggregation Algorithm (ECDA).
CPS is the foundation of modern smart factories. The CPS can explore new information and communication technologies to improve production, service, and energy management. According to information and communication technology, these factories can monitor all parts of production in the time they are connected in the cloud [3]. Assembly lines play an important role in industrial production. Assembly lines not only reduce the working time of workers but also reduces the human losses. Besides, assemble lines can also improve the efficiency and success rate of overall production and manufacturing. However, assembly lines require sensors to meet the requirements of high precision and accuracy.
With the advancement of application technologies and the improvement of hardware performance, the number of sensor devices cannot meet the demand for information collection [4]. To achieve more accurate information sensing, analysis, and decision-making, CPS requires more sensors to support the entire system. Due to the large number of nodes, high distribution density, and certain dynamic characteristics of sensor networks, data redundancy and resource waste are prone to occur in receiving data. This requires a decision on whether to use or discard the obtained information [5]. Mukhopadhyay et al. [6] mentions that sensors are an indispensable part of an automated chemical plant. However, a lot of sensing devices transmitting to a single receiving device at the same time will easily cause data loss. Working on an assembly line requires to satisfy the six conditions in Fig. 1. Especially in the environment of intelligent factories, the completeness and regularity of the received information are the most important during the process of assembly line.
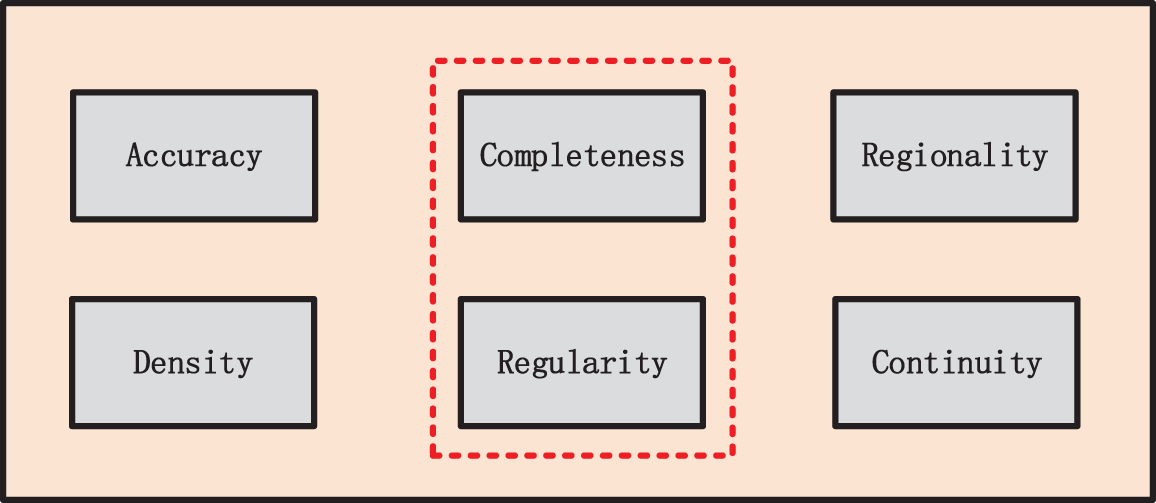
Figure 1: Information conditions
To reduce energy consumption and avoid incompleteness and irregularity of data transmission, this paper studies the information processing model in CPS-WSN. It mainly has four contributions:
(1) We propose the Information processing model to enhance the efficiency of data transmission and reception.
(2) We investigate the relationship between energy and data aggregation in sensor networks and propose an Energy-efficient Data Aggregation Algorithm (ECDA).
(3) We develop an Efficient Message Reception Algorithm (EMRA), including PMRA, STMRA, and SCMRA. These three algorithms are respectively applicable to message reception at any time, the shortest time, and under specific conditions.
(4) We evaluate the comprehensive performance of EMRA using the Analytic Hierarchy Process (AHP). AHP represents an innovative method to simplify data transmission.
Overall, the rest of the article is divided into five sections. The rest of this article is organized as follows. Section 2 represents related works. Then, Section 3 is the problem description. And the system methods are introduced in Section 4. Furthermore, Section 5 compares and analyzes the performance of the proposed algorithms. Finally, the conclusion is in Section 6.
The IoT can receive and transmit information through devices such as infrared sensors, radio frequency identification (RFID) [7], and global positioning systems. The IoT will realize efficient information interaction, information exchange, and communication in the network. It’s a network which can realize intelligent identification, positioning, tracking, monitoring, and management.
IoT sensors play an important role in improving operational efficiency, reducing production costs, enhancing safety of worker, and providing early warning to prevent crashes of system. Karunanithy et al. [8] propose a data collection system that utilizes IoT and WSN for continuous monitoring of wild species in the area. An intelligent health detection system is designed for data collection with the help of a wireless sensor network [9]. Belfkih et al. [10] focuse on sensor database methods used in WSN. Sutiarittham et al. [11] develop a system that uses artificial intelligence to predict student attendance. In addition, it performs optimal room allocation for courses to minimize space waste.
Reference [12] defines Industry 4.0 as the fourth industrial revolution, which goes digital through automated data exchange in manufacturing technology. To compare with the characteristics of traditional production lines of factory, smart factory enables accurate information tracking, which improves resource utilization. Besides, sensors connect various devices, which enable multiple machines to communicate and track each device. Therefore, integrating sensors into industrial environments can improve automation and sustainability. Time series data have become ever-present within manufacturing systems with the proliferation of affordable and robust sensors available in the market. Hence, time series analytics have experienced significant progress in Industry 4.0 [13].
Virtual sensing, in combination with physical sensors, has great potential in establishing a reliable and informative sensing environment. Assembly lines heavily rely on the sensor network to collect operational data. Virtual sensing, in combination with physical sensors, has great potential in establishing a reliable and informative sensing environment. However, virtual sensors are subject to their model uncertainties arising from input physical sensor errors and changes in system operations [14]. Although sensor networks are widely used in industry, real-time monitoring, and decision-making face great challenges for heterogeneous and large-scale data. This is particularly evident in time-sensitive industrial environments. Therefore, data and time are particularly important for the development of IoT. The delay is the time it takes for the packet to traverse the network from the source to the target. Connected to both the amount of energy consumption and the longevity of the network, packet delay can increase energy consumption in the network and reduce life cycle of network.
Reference [15] proposes a system which integrates various data processing techniques. Continuous casting steel lines integrates technology on the same Team Center platform. The results show that the solution can be well used in real-world industrial environments. However, the problem of data loss will occur in an environment with too much sensor data in a specific area. This issue requires further study and clarification. Fortunately, when the technology of IoT is introduced into the production process, the status of information management is gradually increasing. For example, even if the transmission frequency of each sensor is different, there will be no loss of information and data.
Currently, there is an issue of data loss in information processing. This paper proposes an Efficient Message Reception Algorithm for Sensors (EMRA), considering the message reception scenarios of different time series. The time series considered in algorithm include series under specific conditions, arbitrary time series, and the shortest time series.
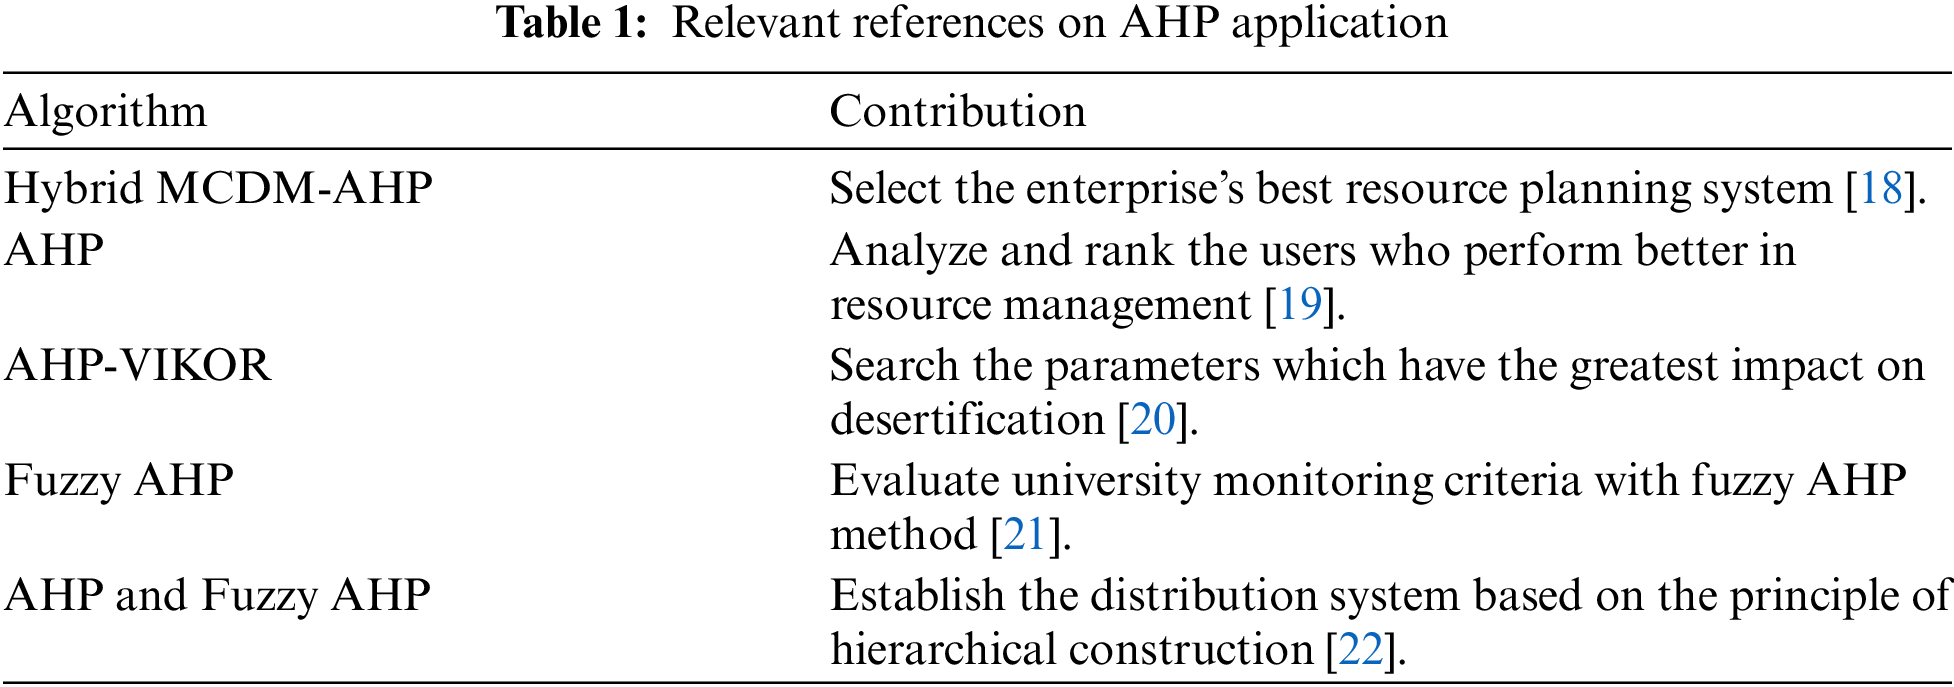
AHP is a comprehensive evaluation method of systems analysis and decision-making founded by Saaty [16]. Statistics involving data collected over decades show that the most used method worldwide is AHP [17]. It presents for a full study of human thought processes. Also, AHP is a quantitative processing process to solve qualitative problems. This paper summarizes the relevant paper in recent years, as shown in Table 1. AHP is widely used in the following fields as an effective comprehensive evaluation method for experimental result analysis. This paper will use AHP to evaluate the experimental results of the three proposed transmission algorithms.
Due to the inherent redundancy in raw data collected by sensor nodes, within-network aggregation can usually reduce the communication cost by eliminating redundancy and forwarding only smaller aggregated information. In a sensor network, the benefit of data aggregation increases if the intermediate sensor node performs data aggregation incrementally when the data is forwarded to the base station [23].
Currently, WSN is facing four major issues namely power management, routing, localization and deployment techniques. Out of these in power management, energy conservation is the major constraint due to irreplaceable and limited power sources of the sensor nodes. Therefore, efficient cluster formation is very challenging in WSN by considering the energy consumption of cluster heads. The WSN area is divided into multiple clusters, with one node designated as the Cluster Head (CH). As shown in Fig. 2, CH collects data from all cluster nodes, performs aggregation, and routes the aggregated data to BS through direct transmission or with the help of adjacent CH nodes.
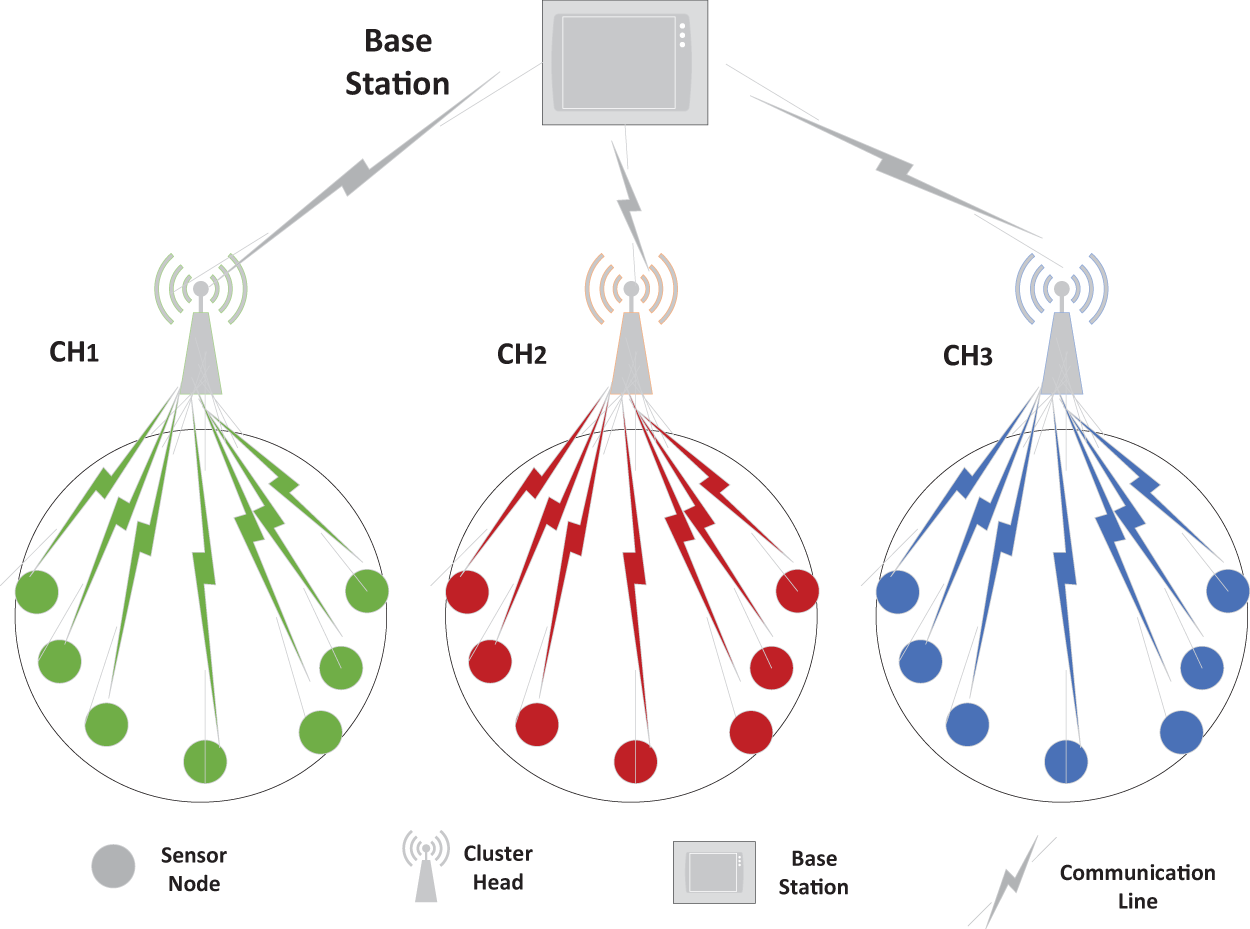
Figure 2: Wireless sensor network
The biologically inspired selection of cluster heads (CH) has always been an important topic in the research of all clustering-based data aggregation methods. The choice of CH is usually based on the following parameters, including the proximity to BS, the hop distance of cluster nodes, the residual energy of the considered nodes, the computational and communication loads, and the cluster density [24].
However, the challenge lies in determining the metrics for CH selection and deriving the optimal mix to select the most suitable CH for a given application. This leads to a multi-objective optimization problem. In IoT applications where the nodes are mobile, the transmission energies required by a node varies widely. Therefore, estimation of residual energies of nodes and their hop-count to the BS is nondeterministic.
Hierarchical protocols play a crucial role in improving energy efficiency and prolonging network lifetime within Wireless Sensor Networks (WSNs) [25]. The LEACH is a popular clustering protocol for WSNs that helps in reducing energy consumption by allowing nodes to form clusters and electing cluster heads. However, some downsides of LEACH include the potential for CHs with low energy reservation to deplete quickly, the lack of scalability in large networks, and the use of random cluster head selection. They may not always result in optimal choices. To address this issue, Reference [26] proposes a solution where hybrid particle swarm optimization (HPSO) is paired with improved low-energy adaptive clustering hierarchy (HPSO-ILEACH) for CH selection in cases of data aggregation to increase energy efficiency and maximize the network stability of the WSN. Reference [27] proposes an Energy-Aware Routing protocol for Homogeneous and Heterogeneous WSNs called MAX LEACH. The proposed protocol improves the total network lifetime. PEGASIS follows greedy algorithm to organize the nodes in the form of a chain. The simulation results show that PEGASIS protocol is less effective when the long chain of sensor nodes is formed. More energy is consumed to transmit data over the long chain and introduces lot of delay. Reference [28] proposes E-PEGASIS protocol for enhanced energy-efficient data transmission based on PEGASIS protocol.
Sensor nodes consume a significant amount of energy during data transmission in network operations, emphasizing the importance of energy efficiency and network longevity [25]. The above article has made various improvements in reducing energy consumption. This paper further studies the two cluster-based data aggregation algorithms, LEACH and PEGASIS, as well as the recent improvements of the two algorithms through simulation experiments.
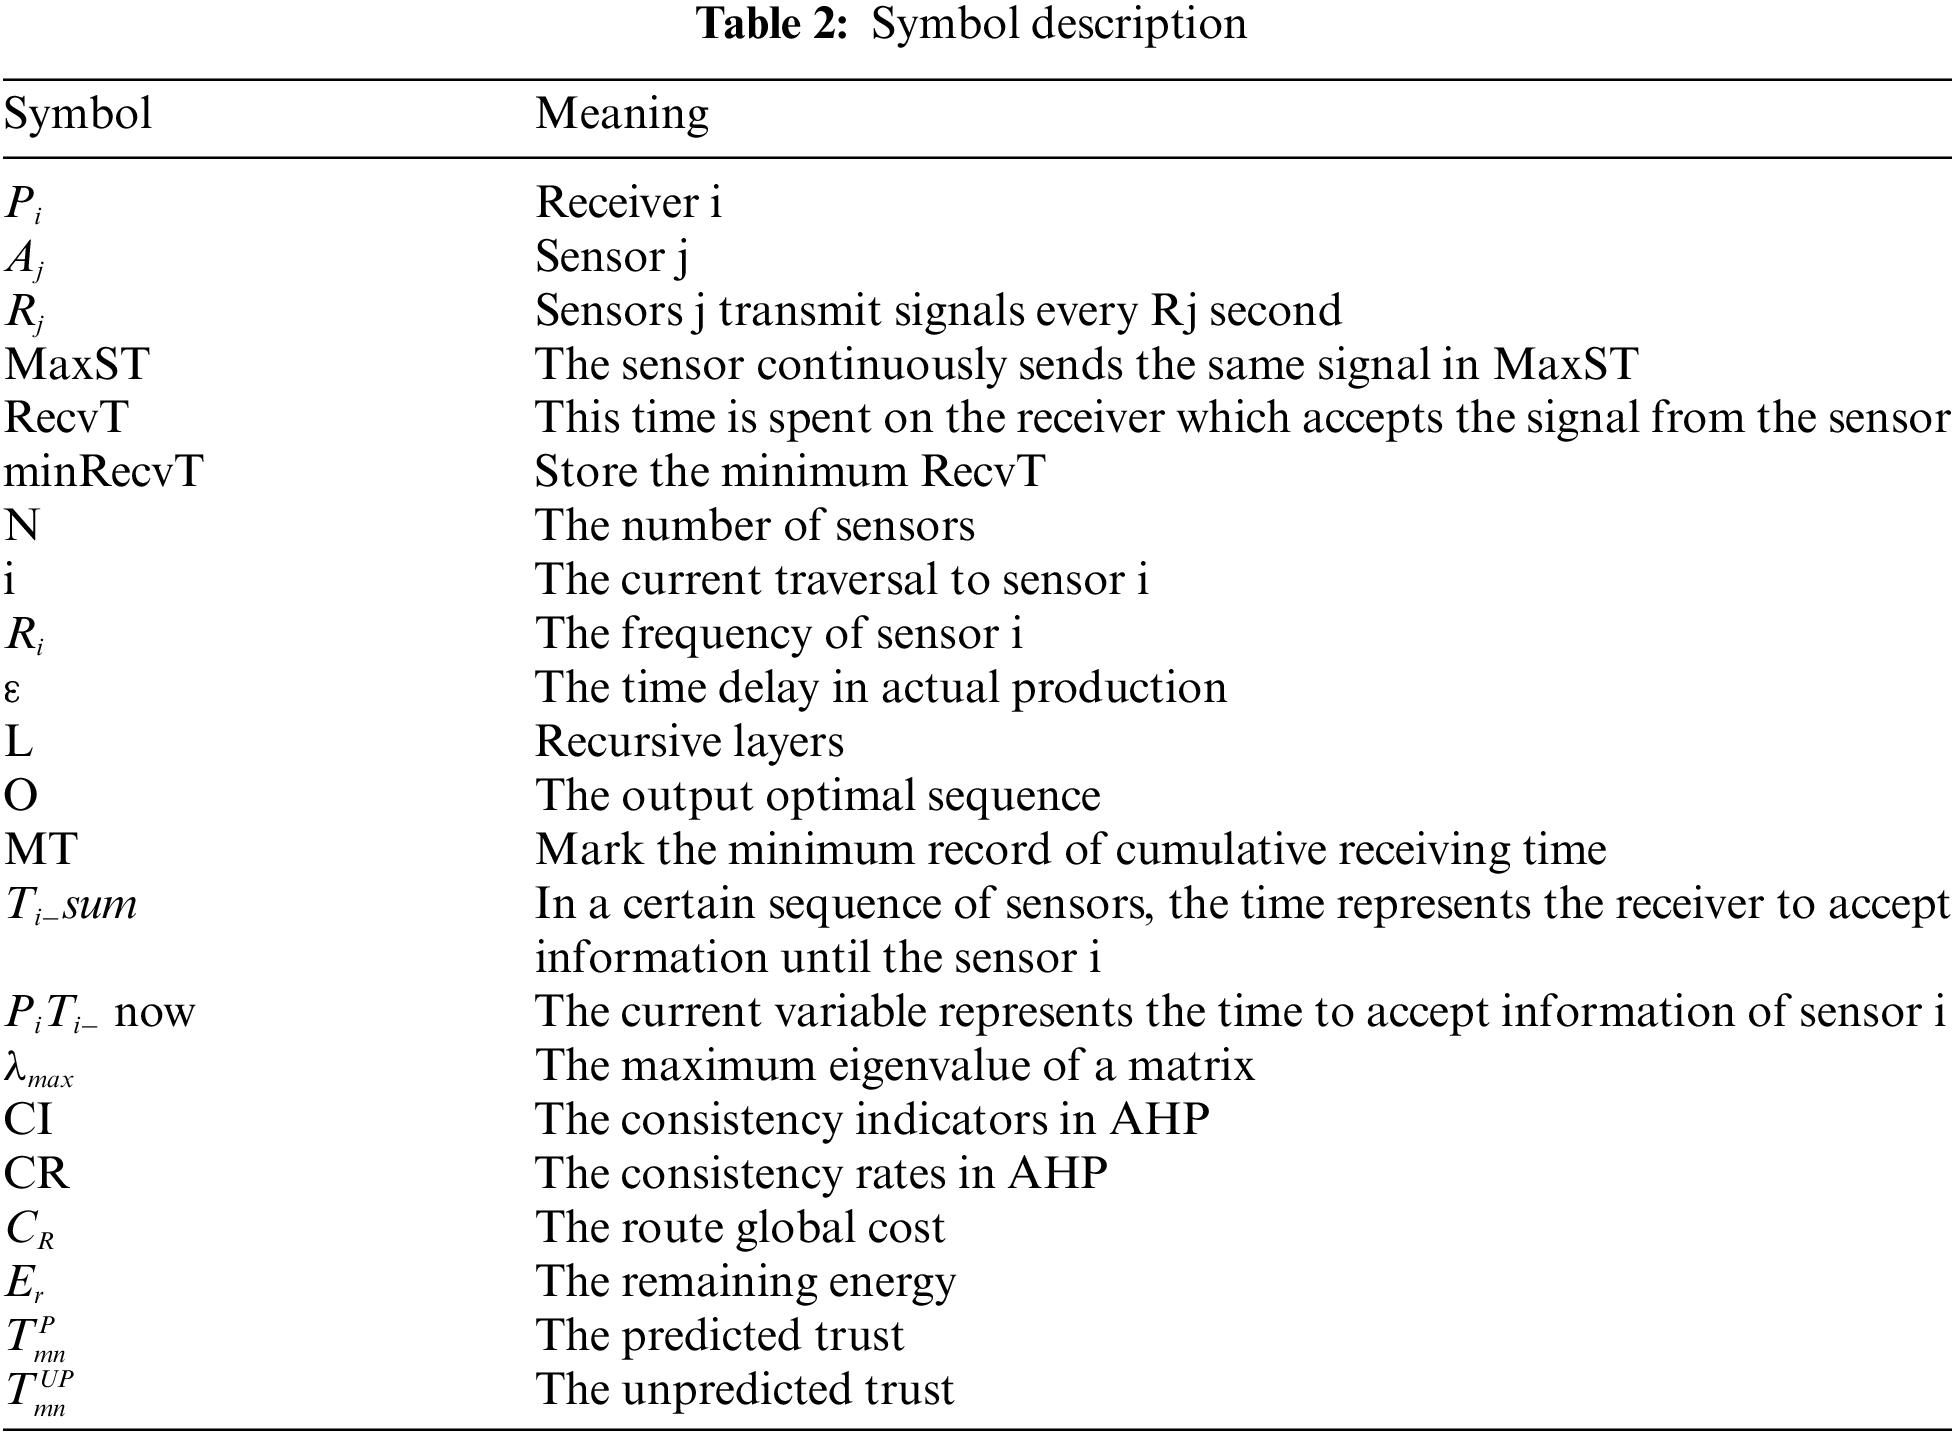
Based on the characteristics of assembly line and sensor devices, the sensor group is divided into multiple segments to achieve the integrity and regularity of information reception. Each segment does not interfere with each other. They can work simultaneously. There is one sensor task group A within each segment. Each sensor task group contains multiple sensors that send information in parallel. The specific values of sensors are input by the user. The sensor task group transmits information to the receiving device in a regular and continuous manner. The direction is from left to right. The receiver remains in a receiving state. Sensor task group A can be represented by Formula (1). Table 2 shows related symbols with corresponding meanings.
Information transmission frequency (Ri). Sensor group A sends a signal to the receiver every Rj seconds. The number of sensor group A has limited range. Each sensors have different models. Therefore, this article specifies the value of Ai in the experiment, as shown in Formula (2). ASCII (Ai) represents the ASCII code of every sensor. The value of k represents the sensor information parameter that is related to the experimental settings.
Signal repetition period (MaxST). The sensor group has a unified MaxST. As shown in Formula (3).
Time consumption (RecvT). Formula (5) represents the time it takes for the receiver group to receive information from the sensor group in this environment. Formula (4) indicates that the time of receiving the sensor i information is equal to the sum of the frequency of the sensor i and the delay in the actual production.
Current minimum time consumption (MinRecvT). Formula (6) represents the shortest time for the receiver group to receive information from the sensor group in this environment. The experimental verification shows that this time is generated by the first sequential sequence of all sensor combination sequences.
Based on the background of the above issues and the characteristics of sensors, it is particularly important to verify the integrity of information, improve reception efficiency, and conform to different reception requirements. There are two corresponding problems as below. (1) Verify whether the receiver can receive all the signals sent by the group sensor within the MaxST. (2) Arrange the receiving order for the group sensor and find a specific receiving order scheme, so that the receiver can receive the signals sent by the group sensor according to the receiving scheme. In addition, it satisfies the minRecvT.
4 System Architecture and Methods
As shown in Fig. 3, the CPS based on WSN is composed of an information layer and a physical layer. The factory assembly line at the physical layer is equipped with sensor groups and information receiver groups. The sensor groups are primarily responsible for converting effective information into electrical signals during the factory production process. The receiver groups integrate information from the sensor groups.
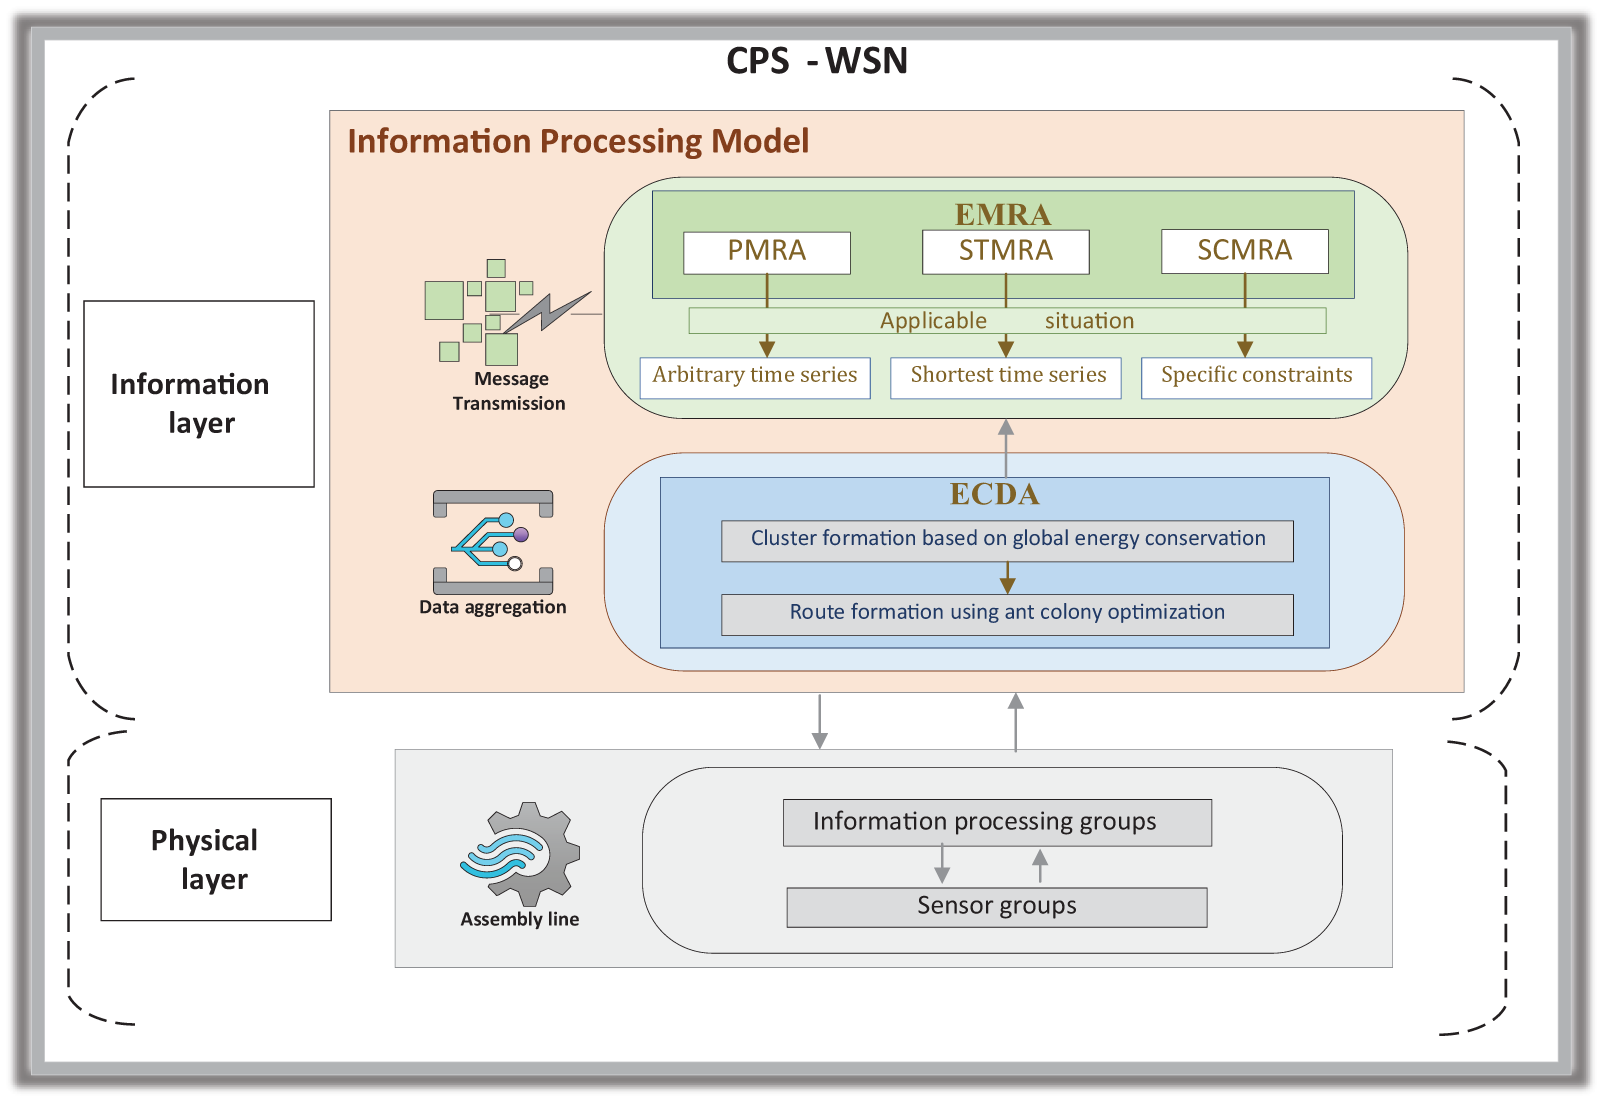
Figure 3: Wireless sensor network
In the information layer, this paper proposes the IPM that encompasses an Energy-Conserving Data Aggregation Algorithm (ECDA) and an Efficient Message Reception Algorithm for Sensors (EMRA).
The ECDA is divided into Energy conservation based on the global cost and data aggregation based on ant colony optimization. The algorithm in the first step is based on a cluster formation of a global energy-saving algorithm considering the cost. The algorithm in the second step is to use ant colony optimization for route formation. Finally, the aggregated data is transmitted to the Effective Message Reception Algorithm for Sensors (EMRA).
EMRA comprises PMRA, STMRA, and SCMRA. Also, EMRA analyzes the regularity of sensor signal transmission. Subsequently, according to specific factory environments, the PMRA, STMRA, and SCMRA message transmission algorithms are employed to meet the varying needs of factories. PMRA is suitable for any time series. STMRA is applicable to the shortest time series. SCMRA is suitable for specific constraints in the factory.
4.2 Energy-Conserving Data Aggregation Algorithm ( ECDA)
To reduce energy consumption and extend the service life of sensors, this paper proposes an Energy-Conserving Data Aggregation Algorithm (ECDA). This energy-saving method is used to transmit information about trust and residual energy without increasing communication traffic. The proposed energy-saving algorithm first calculates the global routing cost of the energy-saving route, and then the source node compares and finds the global routing cost of the effective forwarding route between the source and destination.
The residual energy is computed as the remaining energy Er of the sensors Aj which is expressed as. The residual energy of the sensor set is the ER, as shown in Formula (7). Use the routing global cost expression calculation as shown in Formula (10). Formula (7) represents the calculation of the remaining energy Er of sensor Aj. Formula (8) shows the predicted trust. Also, Formula (9) represents the unpredictable trust. In Formula (10), WHC mentions the WHC weight of hop count.
The proposed energy conservation model will reduce the energy of a homogeneous node by proper selection of obvious residual energy.
This algorithm completes the whole process in two phases. In Phase 1, The energy-saving algorithm aims to reduce the energy loss of the wireless sensor network during the data aggregation between the sensor nodes and the central base station. Phase 2 is liable for both setting up optimized path using ant optimization and dependable delivery of packets to sink.
Phase 1: Optimize data aggregation through energy efficient cluster.
Take the data calculated by Formulas (7)–(10) and the sensor ID as input. For each sensor node, add the data to its neighbor list. Each node compares the remaining energy of all its adjacent nodes. It selects the neighbor with high remaining energy as its cluster head (CH). Secondly, each node checks whether the received CH ID is the same as its own ID. If so, it adds the corresponding sender, i.e., its member list. The role of CH rotates in each round to balance energy consumption. The clustering round depends on the clustering period. Cluster formation based on global energy conservation is shown in Fig. 4.
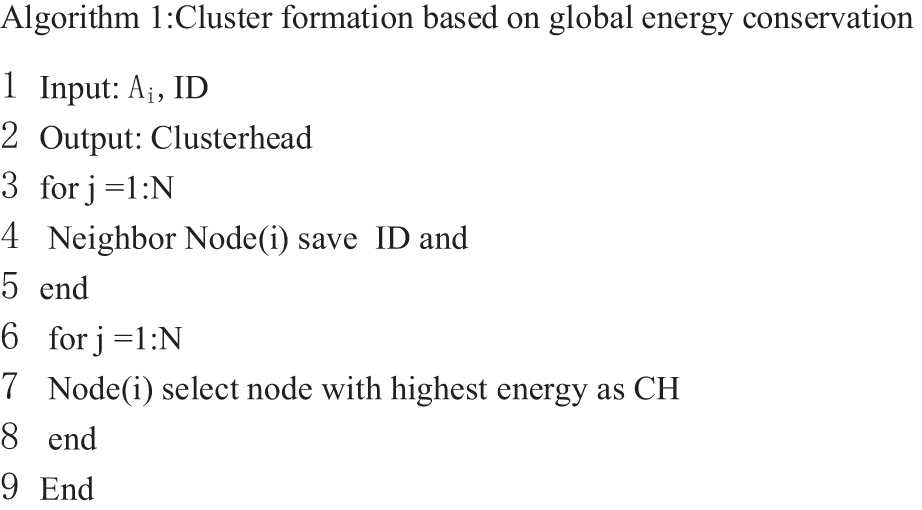
Figure 4: Code for Algorithm 1
Phase 2: Optimize data aggregation through ant colony.
Ant Colony Optimization (ACO) has the advantages of strong robustness and good convergence. It has a good effect in solving large-scale and complex optimization problems [29]. In ACO, ants forward to their nearest neighbors, which then forward the ants to one-hop, two-hop, and three-hop for neighbors to find an optimized route. Ultimately, the node with the highest pheromone value and the highest energy is selected as the next intermediate node. During the search process, ants release pheromones on the path, forming positive feedback of information to influence subsequent ants. Each node communicates only with the nearest neighbor nodes and forwards data to the BS. Therefore, the ant algorithm minimizes the energy used in one round [28].
Here, data may be collected in preparation for transmission to reduce the energy wasted in the process. The ant colony optimization is then used to choose the route once for the data which has been aggregated. Suppose there are ants randomly distributed in cities. When ants move from their current city to the next one, the probability is calculated according to Formula (11).

Figure 5: Code for Algorithm 2
The basic process of the ant colony algorithm includes steps such as ants constructing paths and updating pheromones. For a problem with N nodes on the graph, each ant needs to traverse the entire network for selecting the next node in each iteration. As each ant requires an average of M nodes to visit to construct a complete solution, there are A ants participating in the search. The complexity of a single iteration is roughly O(AMN). Considering that each ant searches for a path in parallel and independently, the total time consumption during actual execution is much less than O(AMN).
Fault detection is an essential pre-requisite for any data aggregation mechanism. A common mechanism to detect faults is to periodically assess the health status of the sensor nodes. A watch-dog timer is often used to detect node faults, where the nodes periodically broadcast “I AM ALIVE” message to proclaim that they are healthy. Non-receipt of such message from a node is an indication for its neighbors that the node is dead or faulty [24].
4.3 Effective Message Reception Algorithm (EMRA)
Based on the finite area of the assembly line, the role of sensors is particularly tremendous. The reason is that sensors can receive information efficiently and completely. Therefore, this paper develops EMRA that includes three algorithms to satisfy different requirements in the production of assembly line.
4.3.1 Polling Message Reception Algorithm
Polling Message Reception Algorithm (PMRA) is suitable for the situation of arbitrary time series as shown in Fig. 6. PMRA includes function A and time sorting algorithm. The function A compares the leaf node of the solution space tree and the recursive layers with the number of sensors. If the number of the leaf node is equal to the recursive layers, stop recursion. If not, continue with the recursive algorithm. Then, by comparing RecvT and MaxST, it can be determined whether the generated sequence is reasonable. If RecvT is less than MaxST, the current generated sequence is feasible and superior. Then update the time sorting algorithm to generate the sequence and RecvT.
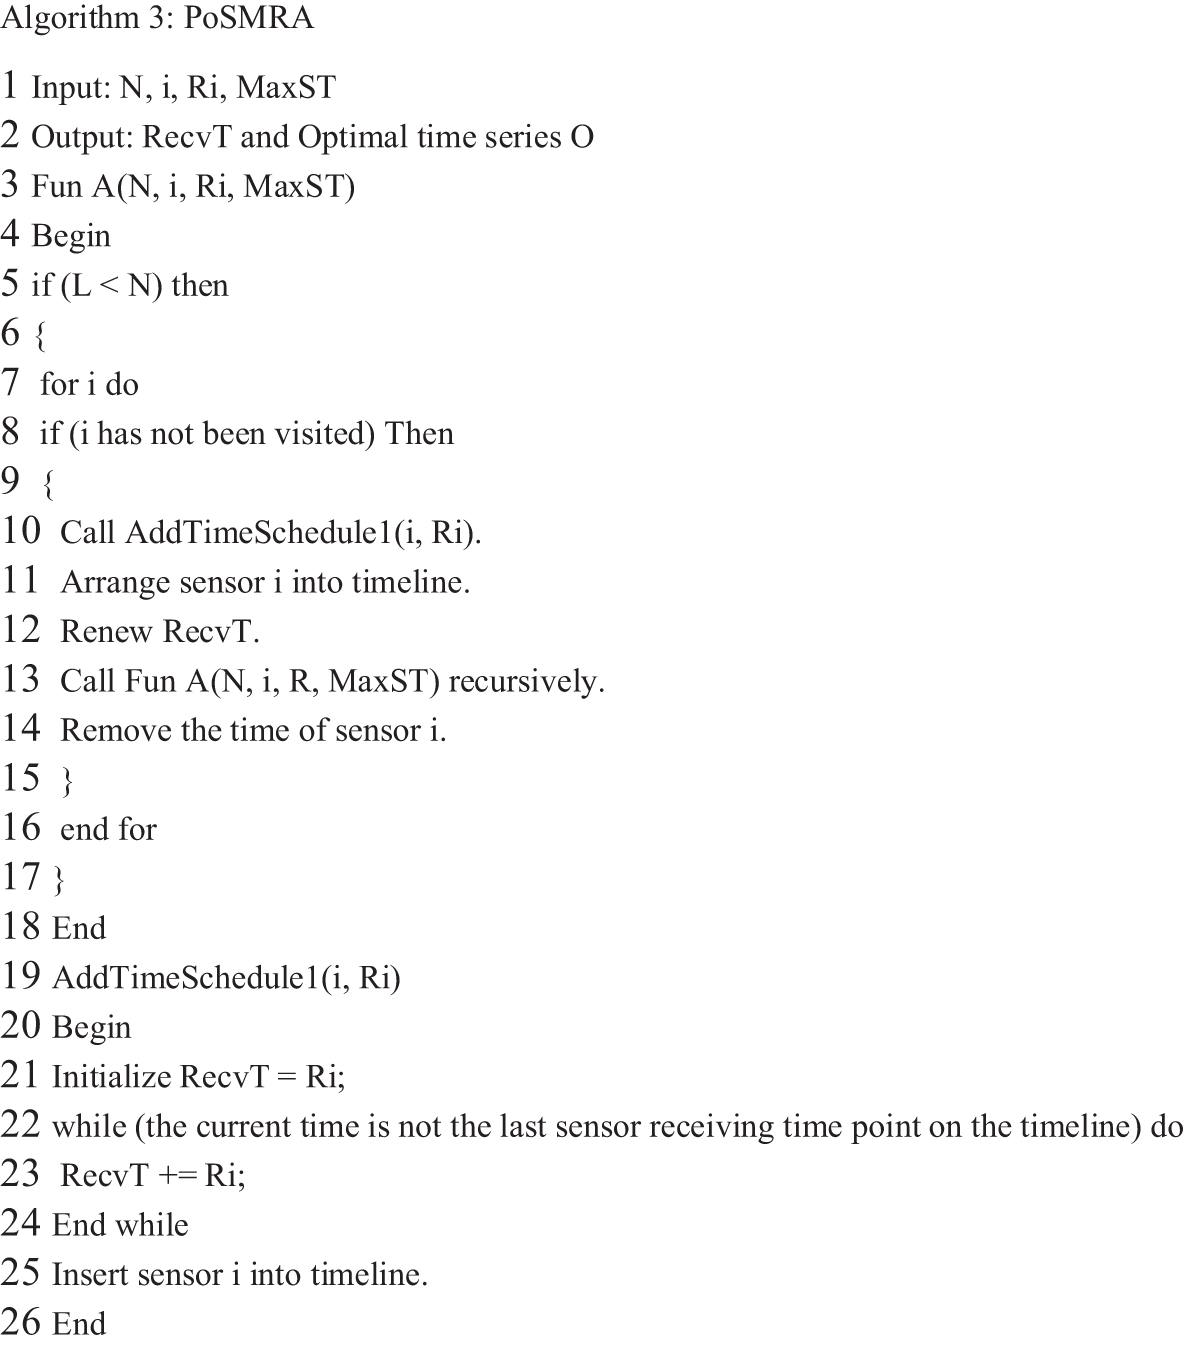
Figure 6: Code for Algorithm 3
4.3.2 Shortest Time Message Reception Algorithm
Shortest Time Message Reception Algorithm (STMRA) can satisfy the demand of the shortest time series as shown in Fig. 7. STMRA prunes sequences which do not have the possibility of being the optimized solution. While traversing various sorting schemes, the optimization process introduces MinRecvT for pruning.
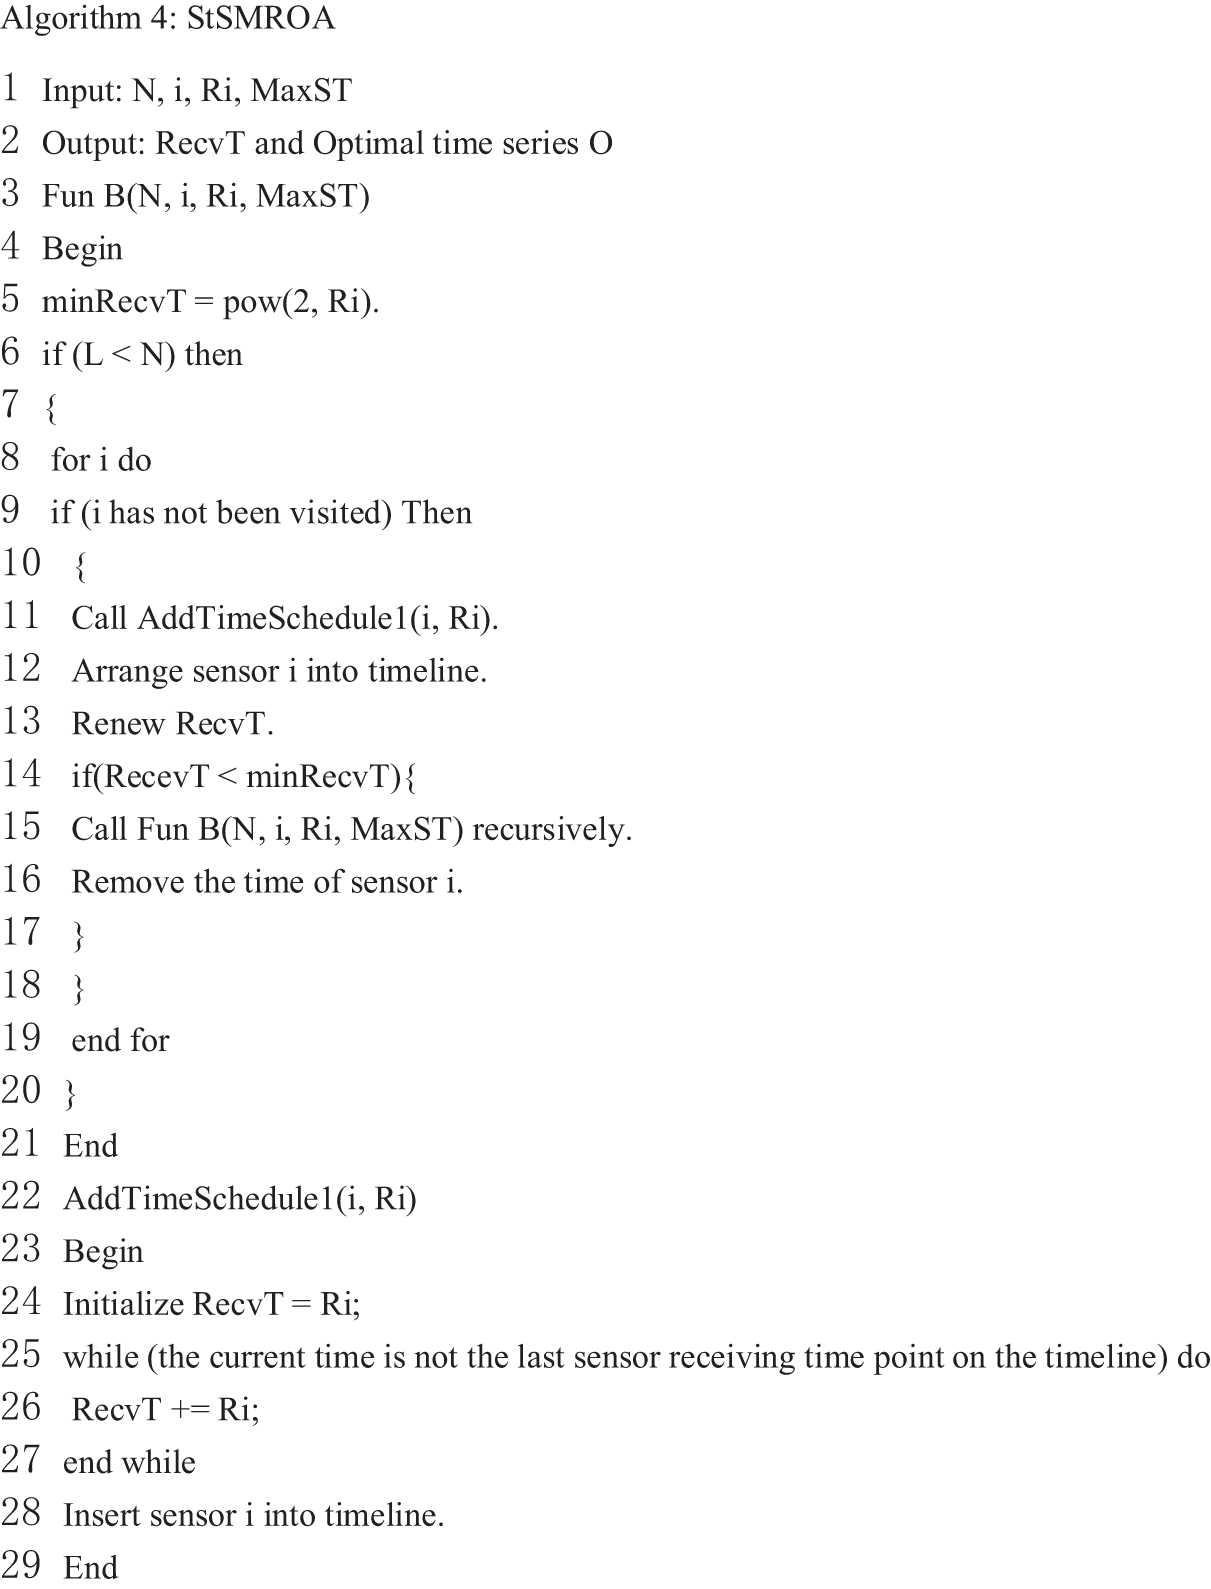
Figure 7: Code for Algorithm 4
4.3.3 Specific Conditions Message Reception Algorithm
Specific Conditions Message Reception Algorithm (SCMRA) can satisfy the specific constraints of factory as shown in Fig. 8. In actual production, different restrictions will occur in actual production. Algorithm 5 is suitable for this situation. According to different constraints, it can determine pruning based on PMRA.
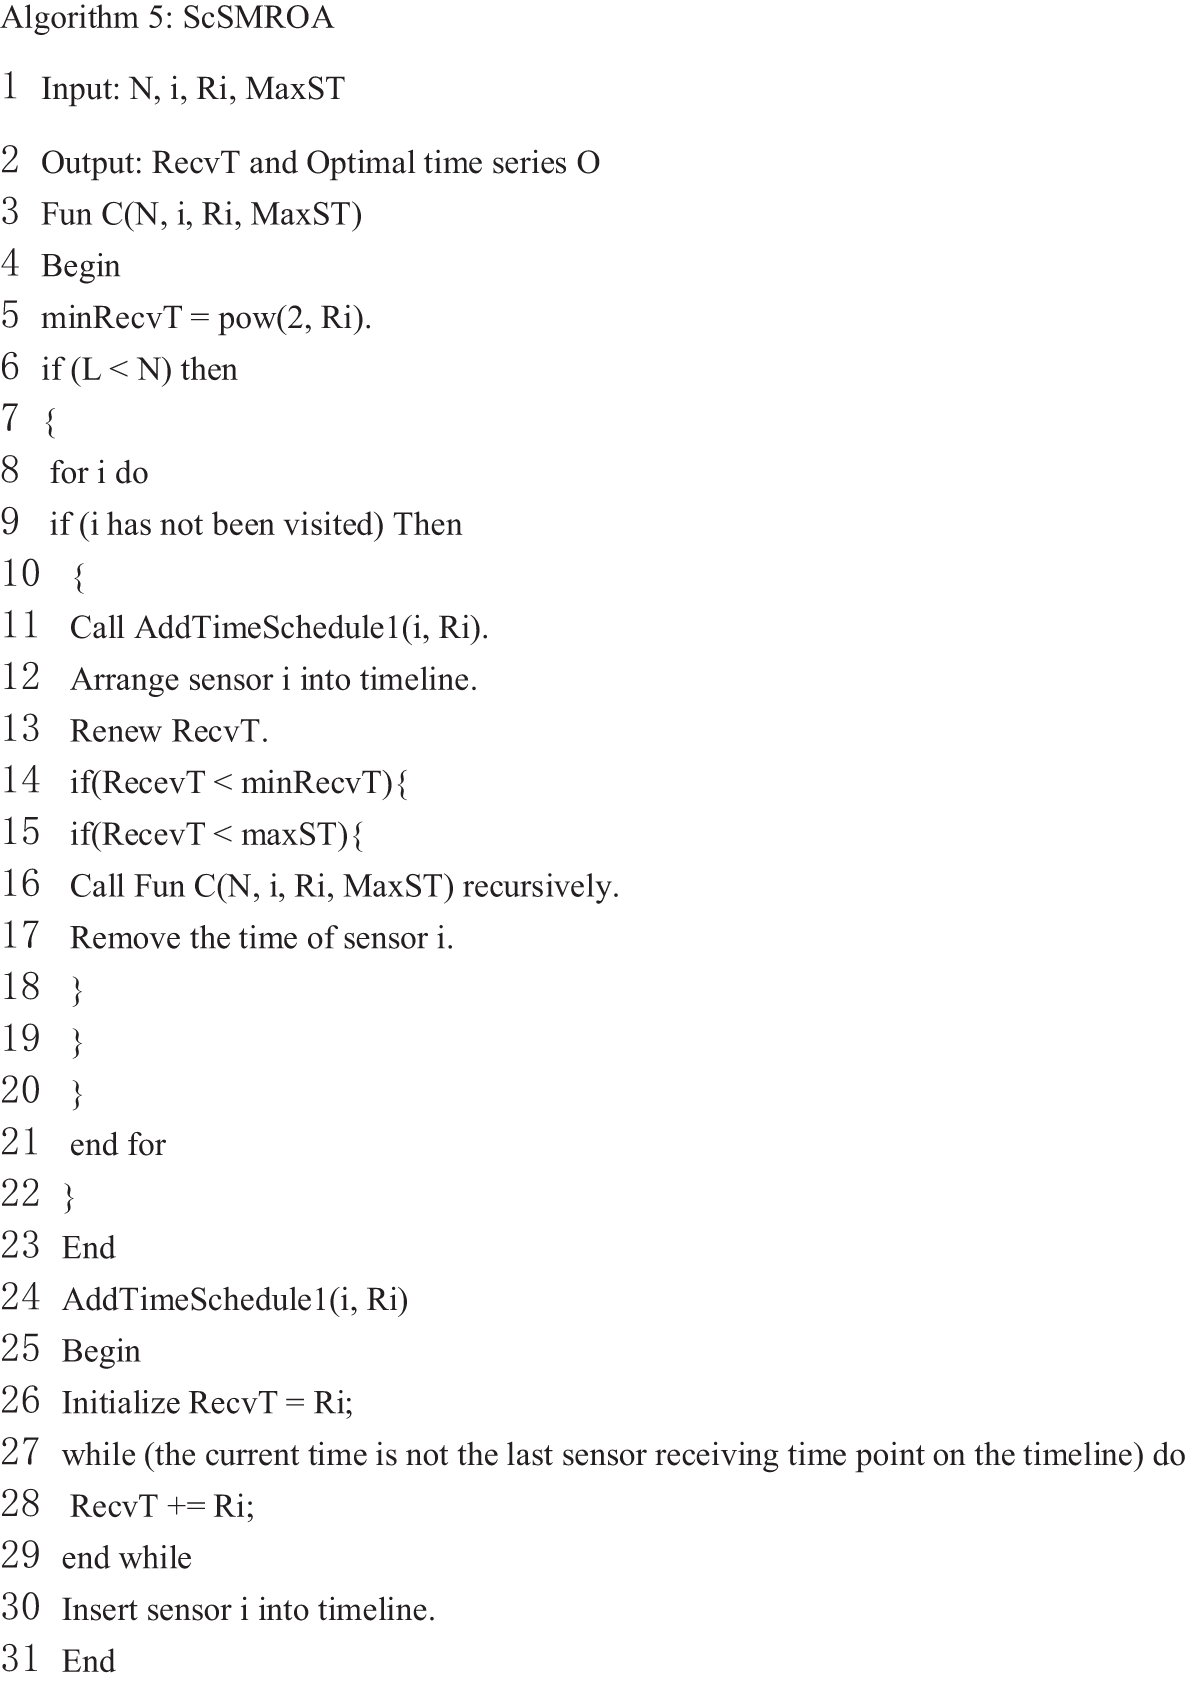
Figure 8: Code for Algorithm 5
5 Experimental Result and Analysis
The experiments are divided into two parts: message transmission algorithm and data aggregation algorithm. For the message transmission algorithm, the parameters considered in this paper include running time and CPU usage. In addition, this paper also uses AHP to evaluate the overall performance of the message transmission algorithm. For the data aggregation algorithm, this paper mainly considers the situation of energy consumption.
The settings for message transmission algorithm include both hardware and software environments. For data aggregation algorithm, this paper simulates the experimental scenario and sets various parameters.
The hardware environment includes the CPU Intel Core i7-5200. The main frequency is 2.2 GHz with 2 cores. The memory is DDR3L and the size is 4 GB. Also, the hard disk is 500 GB. The software environment includes the operating system Windows 8.1 with Eclipse 4.5.2 for IDE.
Due to the large number of sensors deployed in the factory, this paper conducts experiments on a unit in the sensor network. A unit has 6 sensor groups, and each group has 15 sensor nodes. This experiment sets the value of k to 64. In other words, this paper subtracts 64 from the values of ASCII code. This operation can realize the unity of ASCII code and signal frequency.
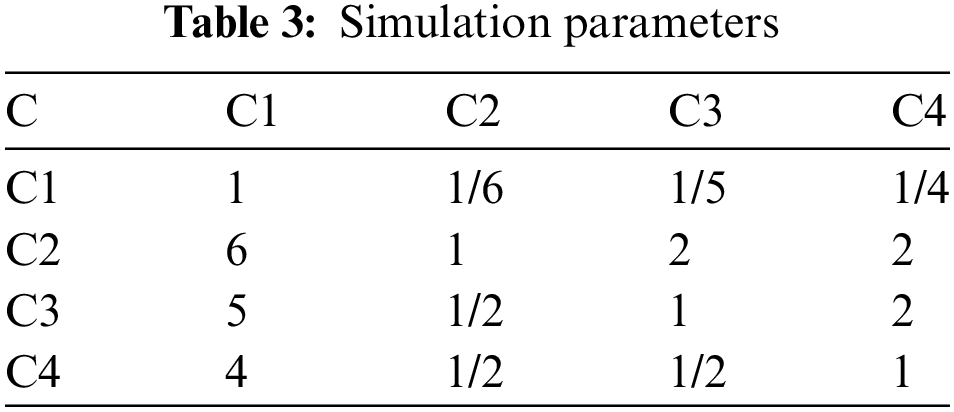
Table 3 shows the simulation parameters considered during execution. The study considers a 100 m × 100 m area as the wireless sensor network. The proposed scenario consists of 100 nodes in the network area. Five algorithms, including LEACH, PEGASIS, E-PEGASIS, HPSO-ILEACH, and ECDA, are initially assigned to each node in the network with the same energy level.
5.2 Experimental Result and Analysis
For information transmission algorithms, the runtime of the algorithm and CPU usage are crucial. Additionally, this paper utilizes AHP to evaluate the comprehensive performance of three information transmission algorithms. As for data aggregation algorithms, this paper considers the scenarios of Energy consumption and Residual Energy.
5.2.1 Comparison of Running Times of Three Algorithms
As shown in Fig. 9a, with the increasingly number of sensors, the two optimization algorithms have mor significant time advantages than PMRA. As shown in the Fig. 9b, when the number of sensor groups exceeds 8, there is a significant difference in time consumption among the three algorithms. When the number of sensor groups is less than 7, the average time to receive information can be controlled within 30 ms. However, as the number of sensors increases, the time consumption of the PMRA increases exponentially. The time consumption of optimization algorithms is at most ten times higher than the PMRA. This situation is due to the addition of pruning operations in the optimization algorithm, which reduces time consumption.
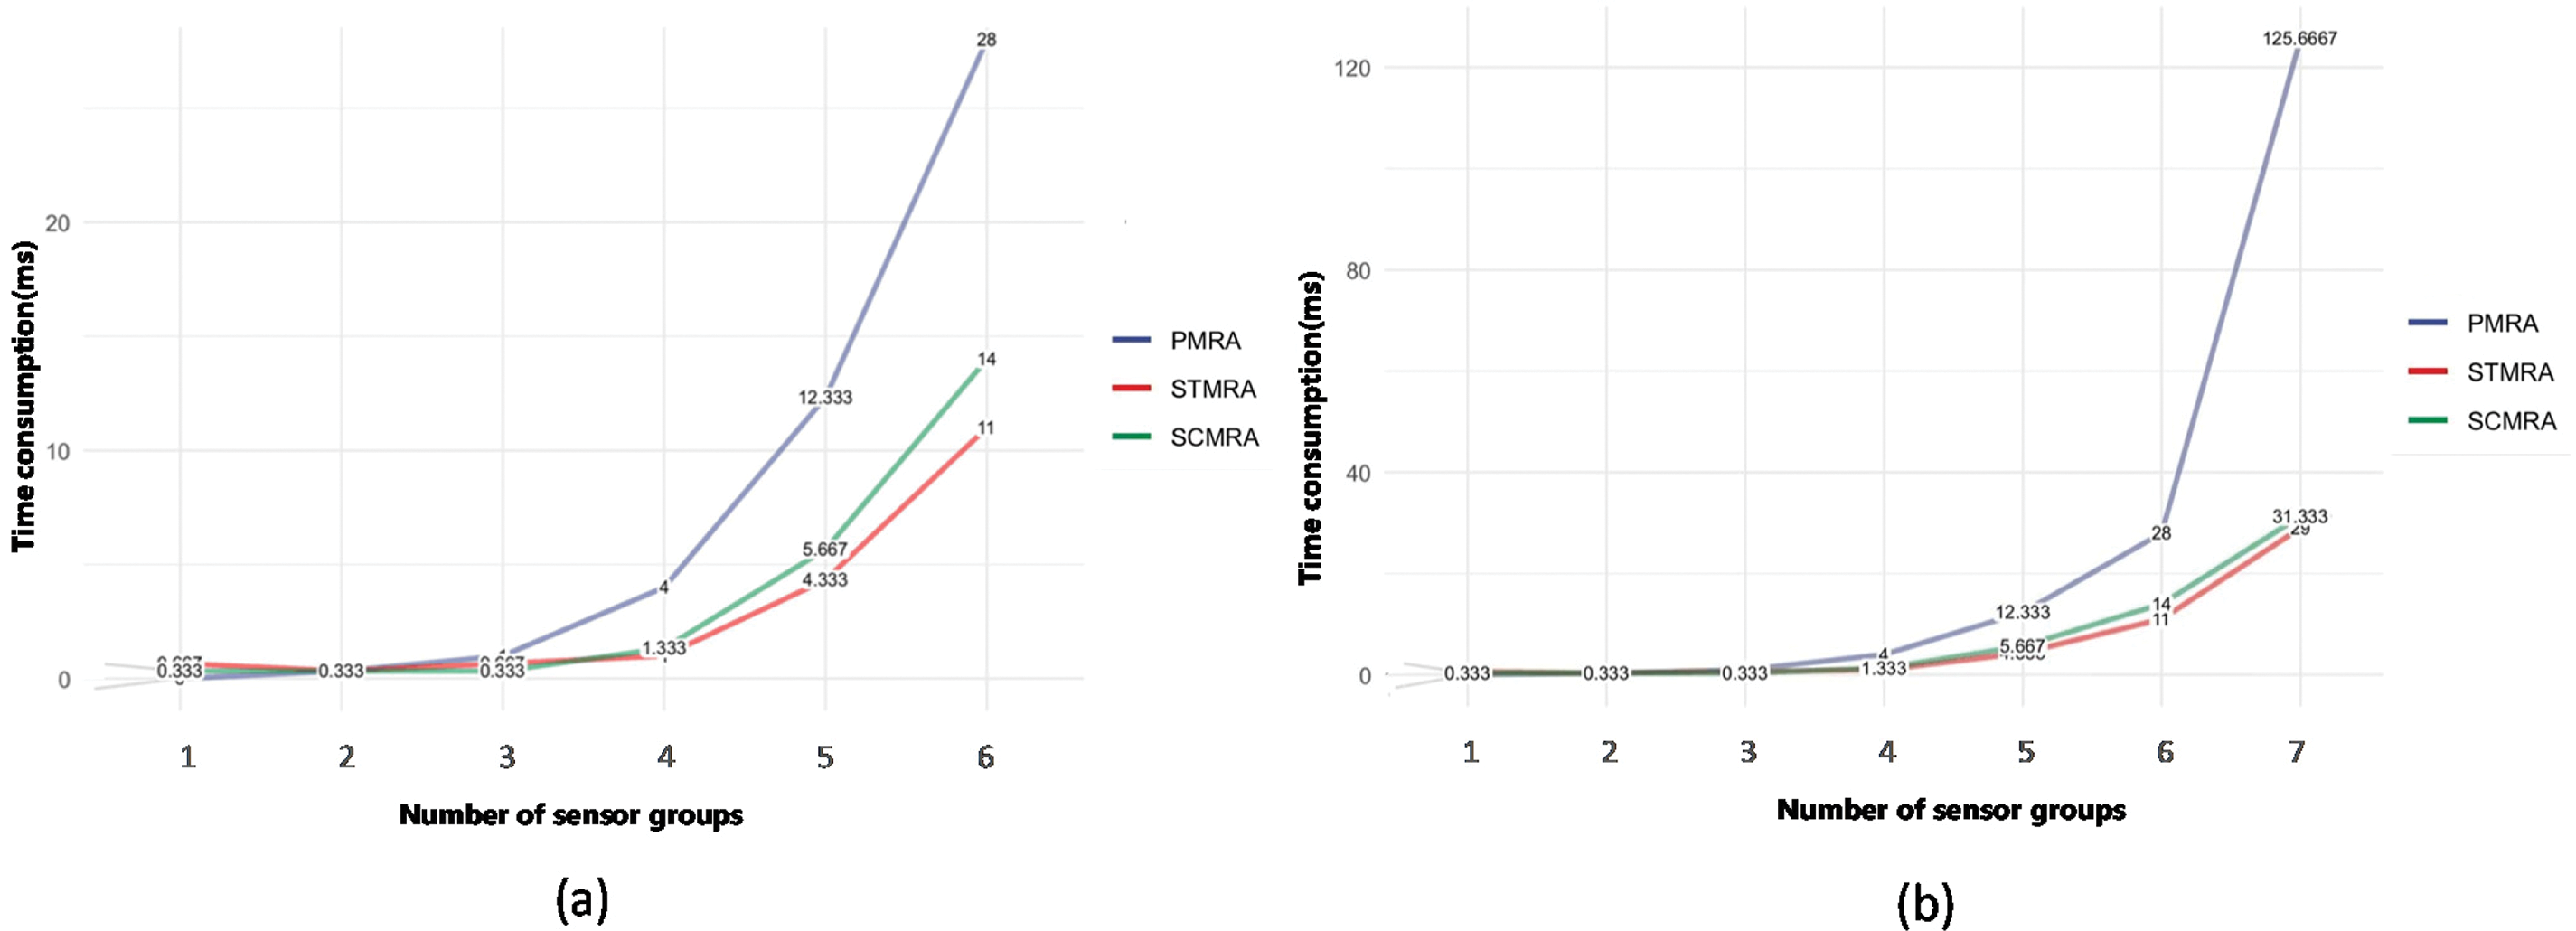
Figure 9: Time performance of PMRA, STMRA, and SCMRA
5.2.2 Comparison of CPU Usage of Three Algorithms
As shown in Fig. 10, the CPU utilization of all three information receiving algorithms is increasing with the growing number of sensors because it is the increase of the judgment and processing of information. In addition, it is clear that the CPU usage of the three information receiving algorithms is divided into three distinct intervals, 1 ≤ N ≤ 6, 6 ≤ N ≤ 8, and 8 ≤ N ≤ 10. In the first interval, the CPU utilization of the PMRA algorithm is more than twice of the other two optimization algorithms because this is the optimization operation of STMRA and SCMRA. In the second and third intervals, the overall CPU utilization of SCMRA is slightly higher than that of STMRA. It increases 3.5% and 2.8% in the second and third intervals. This is related to the addition of specific judgments of SCMRA, while STMRA doesn’t have this operation.

Figure 10: CPU utilization of PMRA, STMRA, and SCMRA
5.2.3 Comprehensive Comparison of Three Algorithms
Experimental verification shows that all three algorithms can fully receive information from sensors. The difference is that PMRA can output different sequences of sensors. In other words, PMRA can output sequences of different time series. This algorithm is relatively flexible, but it takes a lot of time. The application of two optimization algorithms is more targeted than PMRA. They also have low time consumption than PMRA. STMRA can output all sequences for the shortest time. This scheme prunes sequences that do not satisfy the shortest time. SCMRA can output all sequences for the shortest time and specific constraints. This scheme prunes sequences that do not satisfy the shortest time and specific constraints.
Besides, every algorithm has its priorities for influencing factors such as the number of sensors, signal frequency, and signal repetition period. Therefore, this paper uses AHP to evaluate the comprehensive performance of the three algorithms. The evaluation process is divided into the following two processes.
Process 1: Establish a hierarchical model. The hierarchical model is shown in Fig. 11.

Figure 11: Hierarchical analysis diagram of sensor information reception algorithms
Process 2: Model solving. There are four steps:
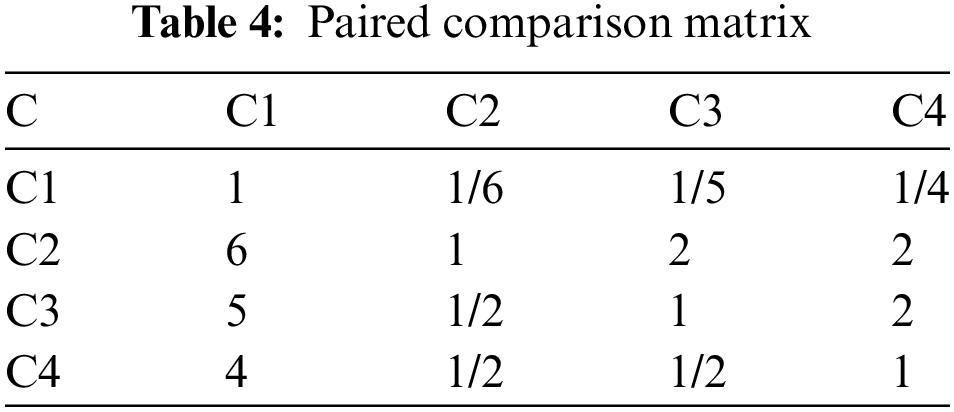
(1) Establish a judgment matrix. The ninth percentile scale is used to measure the importance of two factors. With the help of the ninth percentile scale, the experiment can create the judgment matrix. As shown in Table 4, by comparing the elements in the benchmark layer in pairs, the experiment creates a paired comparison matrix.
(2) Normalize the judgment matrix. With the help of the paired comparison matrix, the experiment calculates the weights of the solution layer. And then the experiment calculates to determine the final solution. However, while using judgment matrices to calculate weights, consistency checks are essential. It helps avoid logical errors which is caused by subjective evaluations. The operation of column normalization is shown in Table 5.
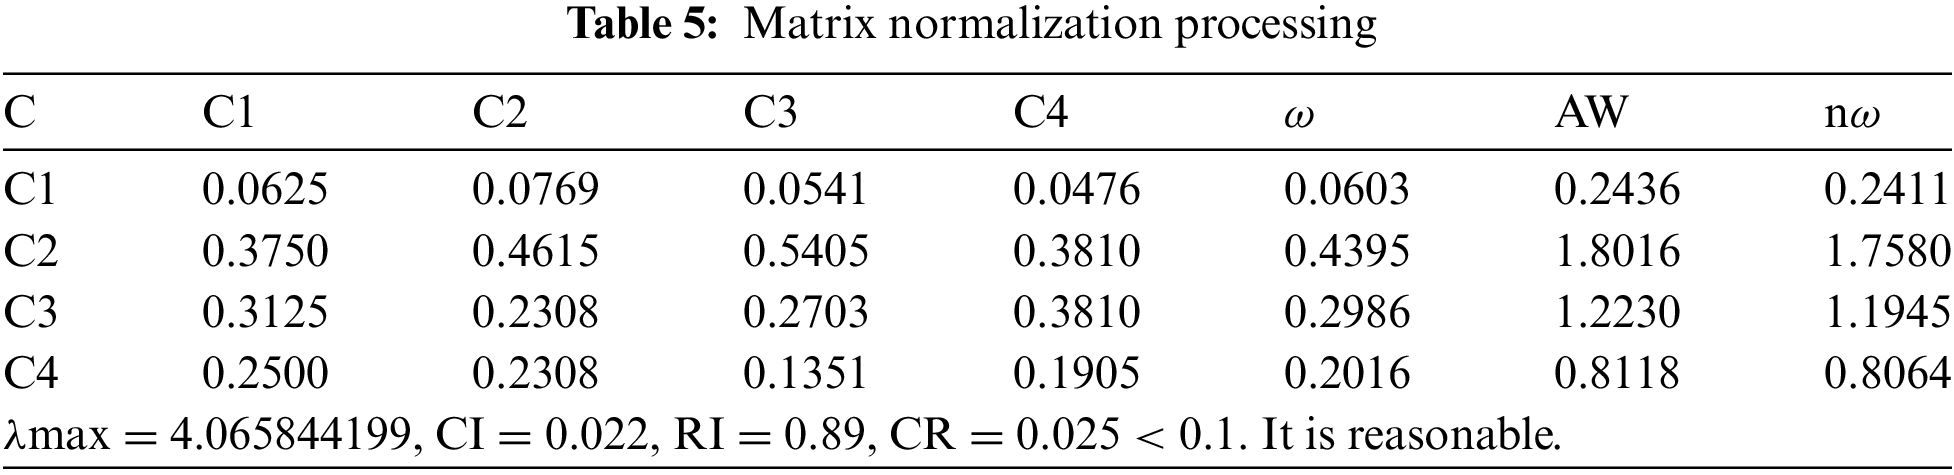
After normalization, it is necessary to use the normalized matrix A, matrix W, and the number of elements in the criterion layer to obtain
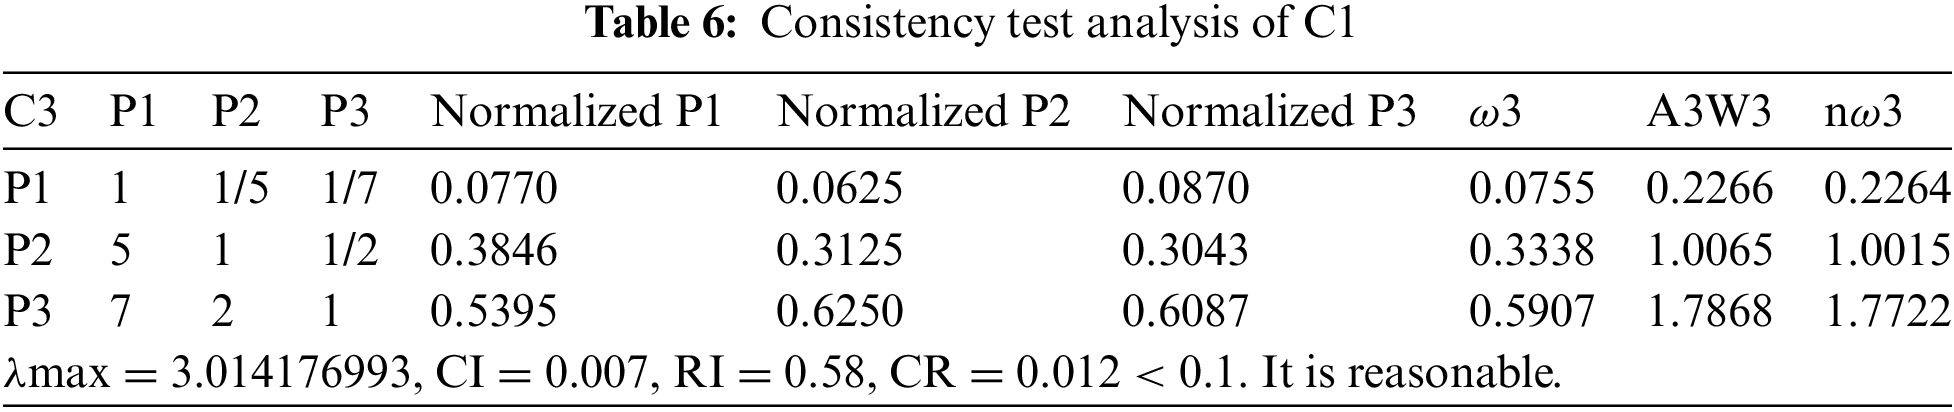
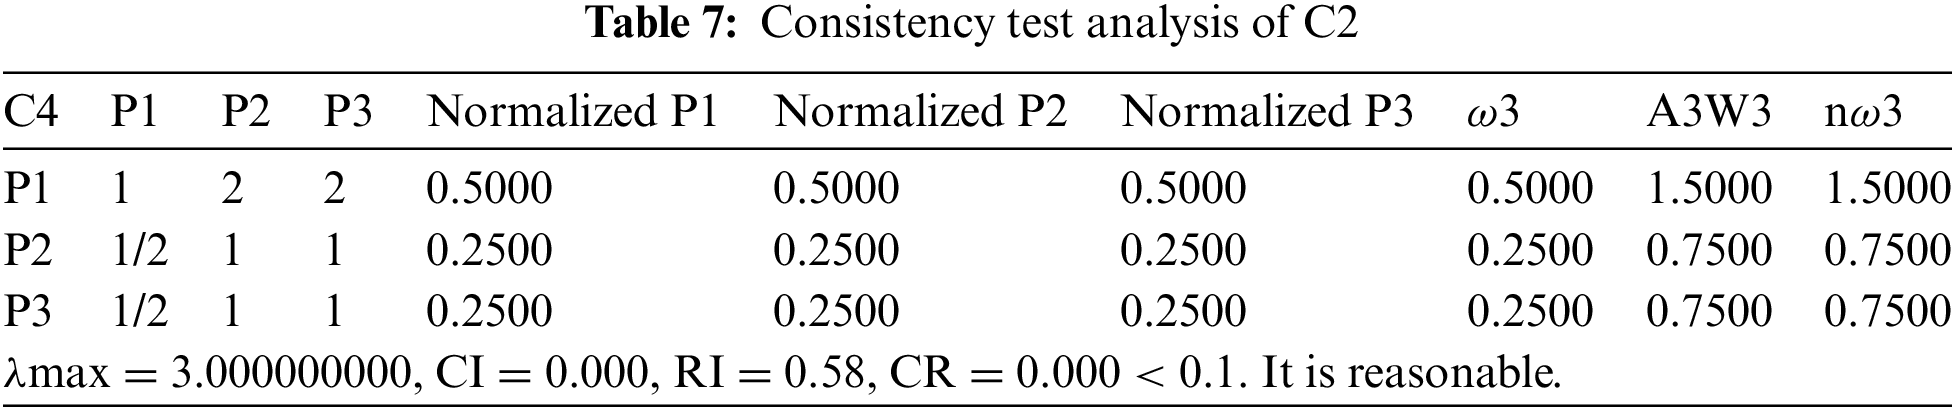
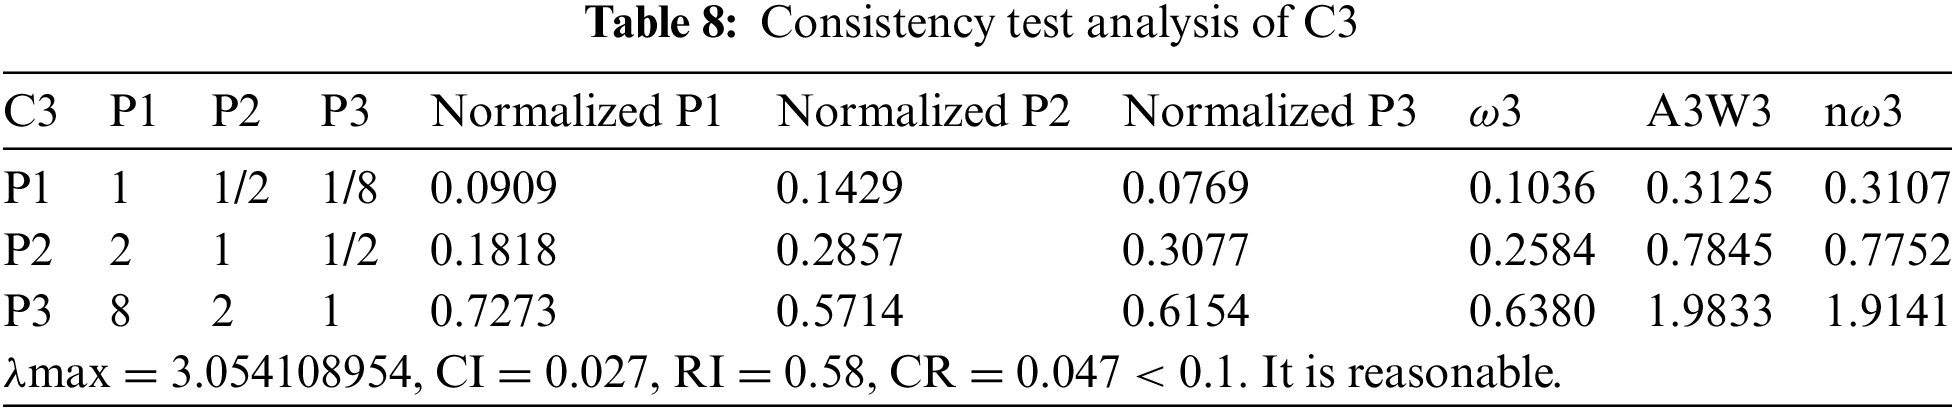
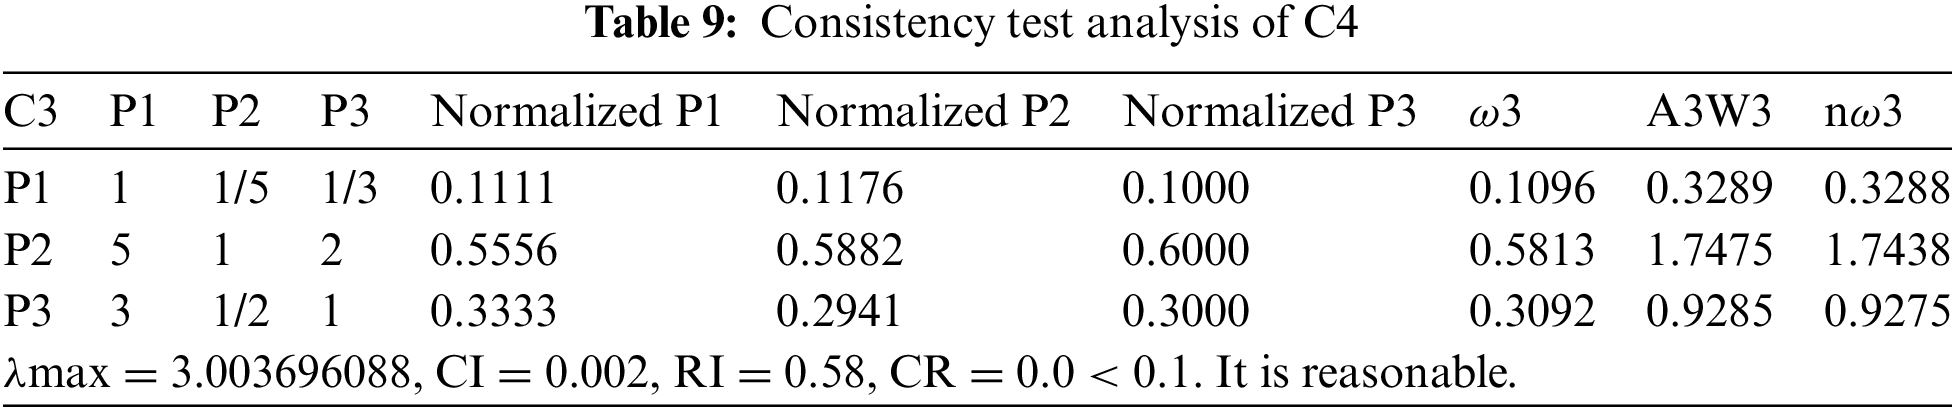
(3) Implement similar steps for each element of the criteria layer. As shown in Tables 6–9, this experiment calculates the weights of each layer’s elements. The four factors in the criterion layer have all passed the consistency test. The data consistency is within a reasonable range. Therefore, this experiment can calculate the score of different schemes.
(4) As shown in Table 10, by summarizing the results, this experiment can obtain the weight matrix.
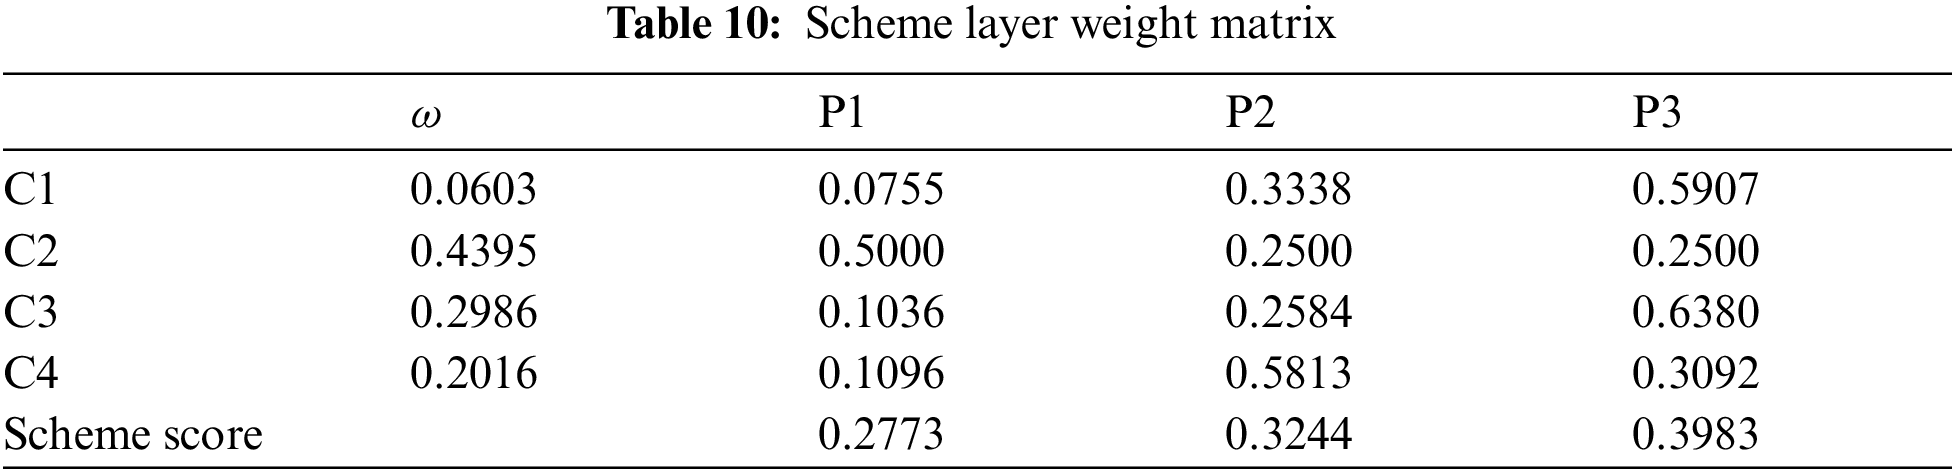
From Table 11, the scheme score of PMRA is 0.28 as the STMRA and SCMRA scores are 0.32 and 0.40. Therefore, the best solution is SCMRA of multiple factors. It can receive information completely and efficiently.
5.2.4 Energy Consumption and Residual Energy
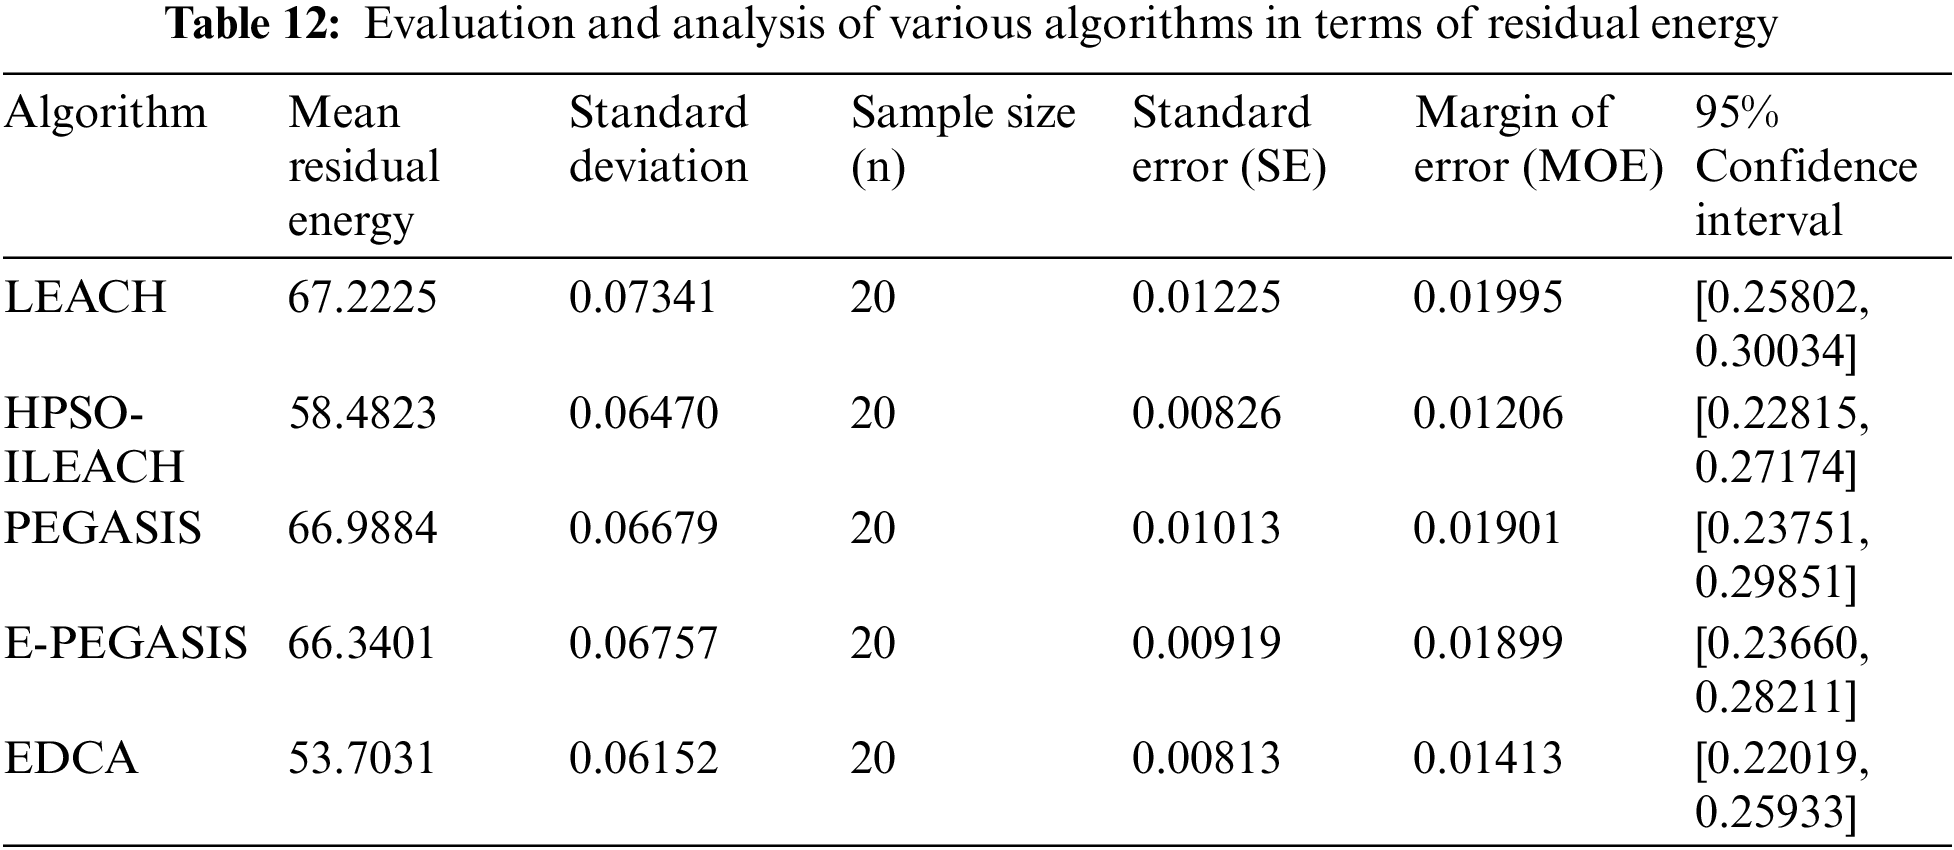
Fig. 12a clearly depicts that ECDA consistently exhibits lower average energy consumption. LEACH has the highest energy consumption. Meanwhile, when the number of rounds is less than 800, the energy consumption of Pegasus, HPSO-ILEACH, and E-PEGASIS is similar. When the number of rounds reaches 800, the energy consumption of E-PEGASIS will be close to the proposed ECDA. Fig. 12b illustrates the remaining energy of the algorithms. In terms of residual energy, HPSO-ILEACH, E-PEGASIS, and ECDA show similar performance.
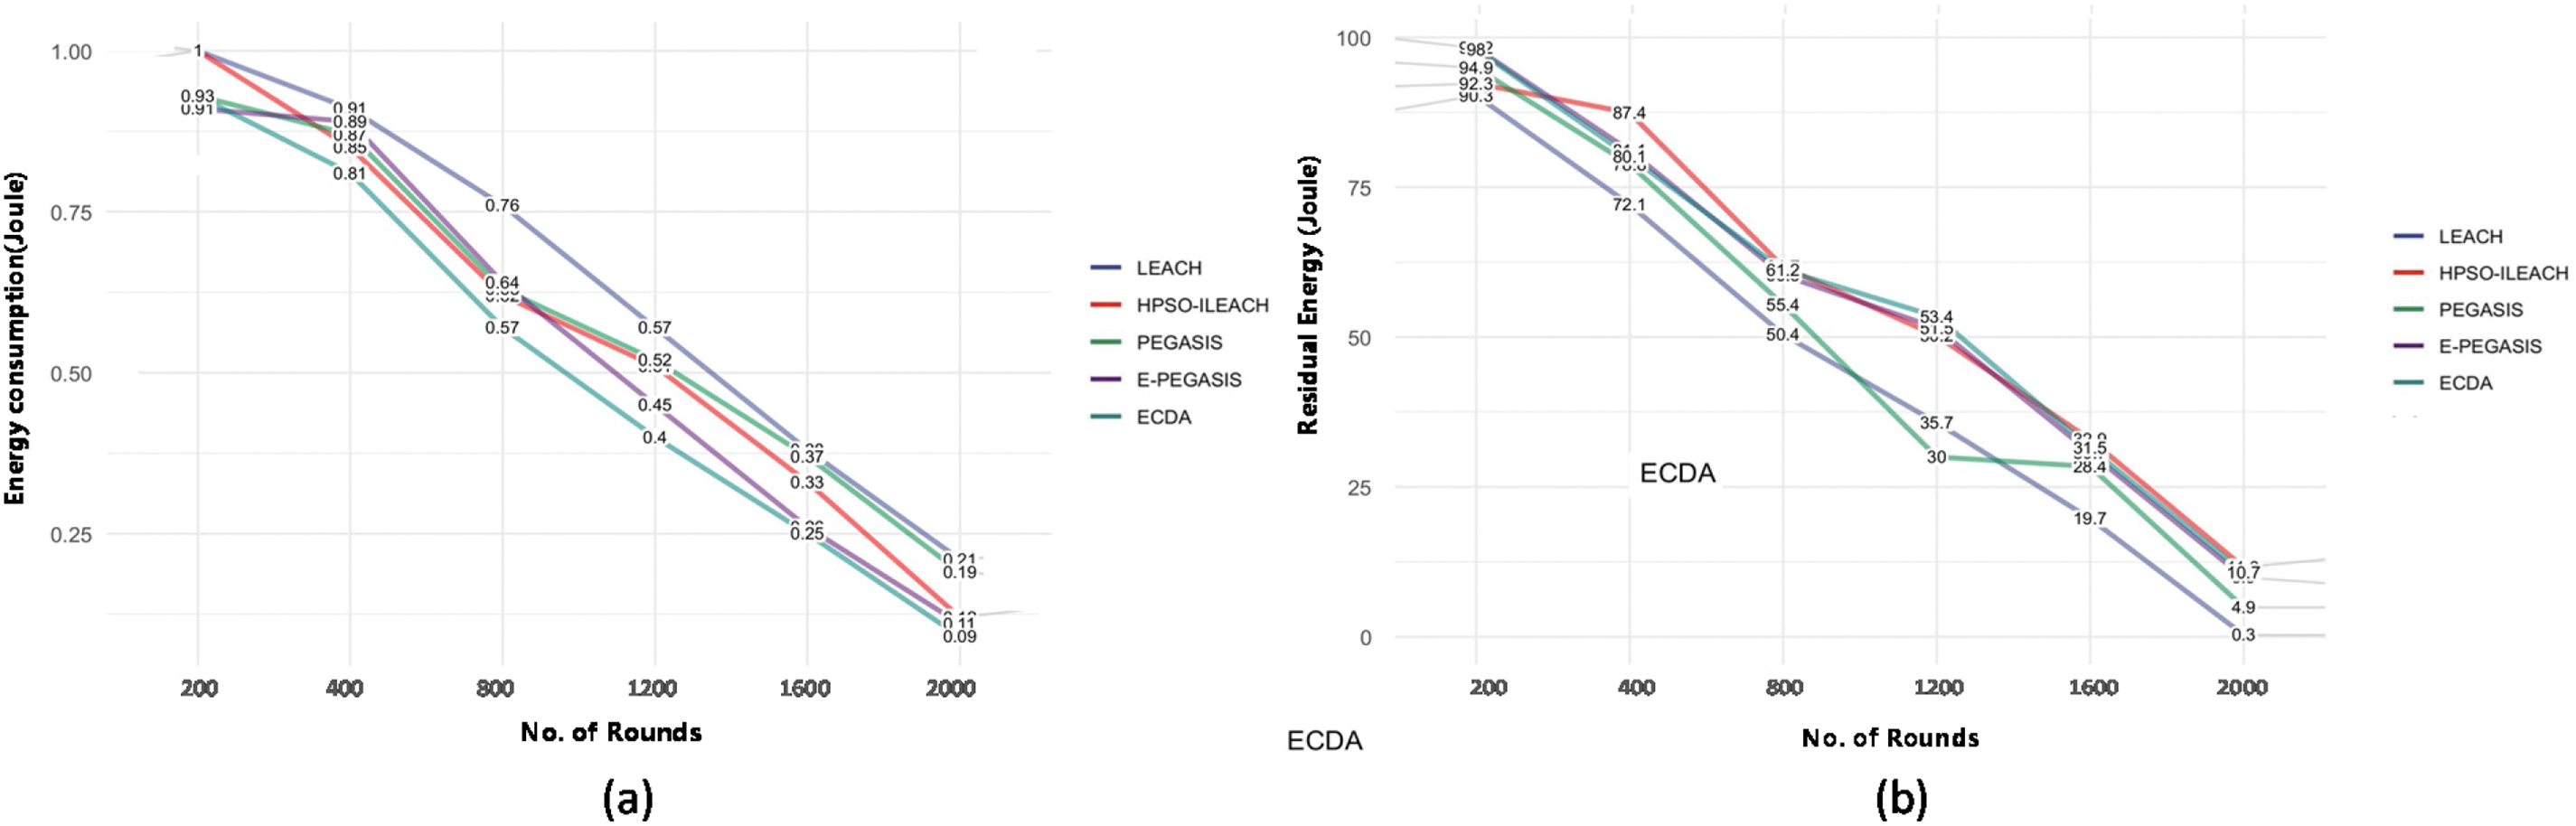
Figure 12: Energy consumption and residual energy
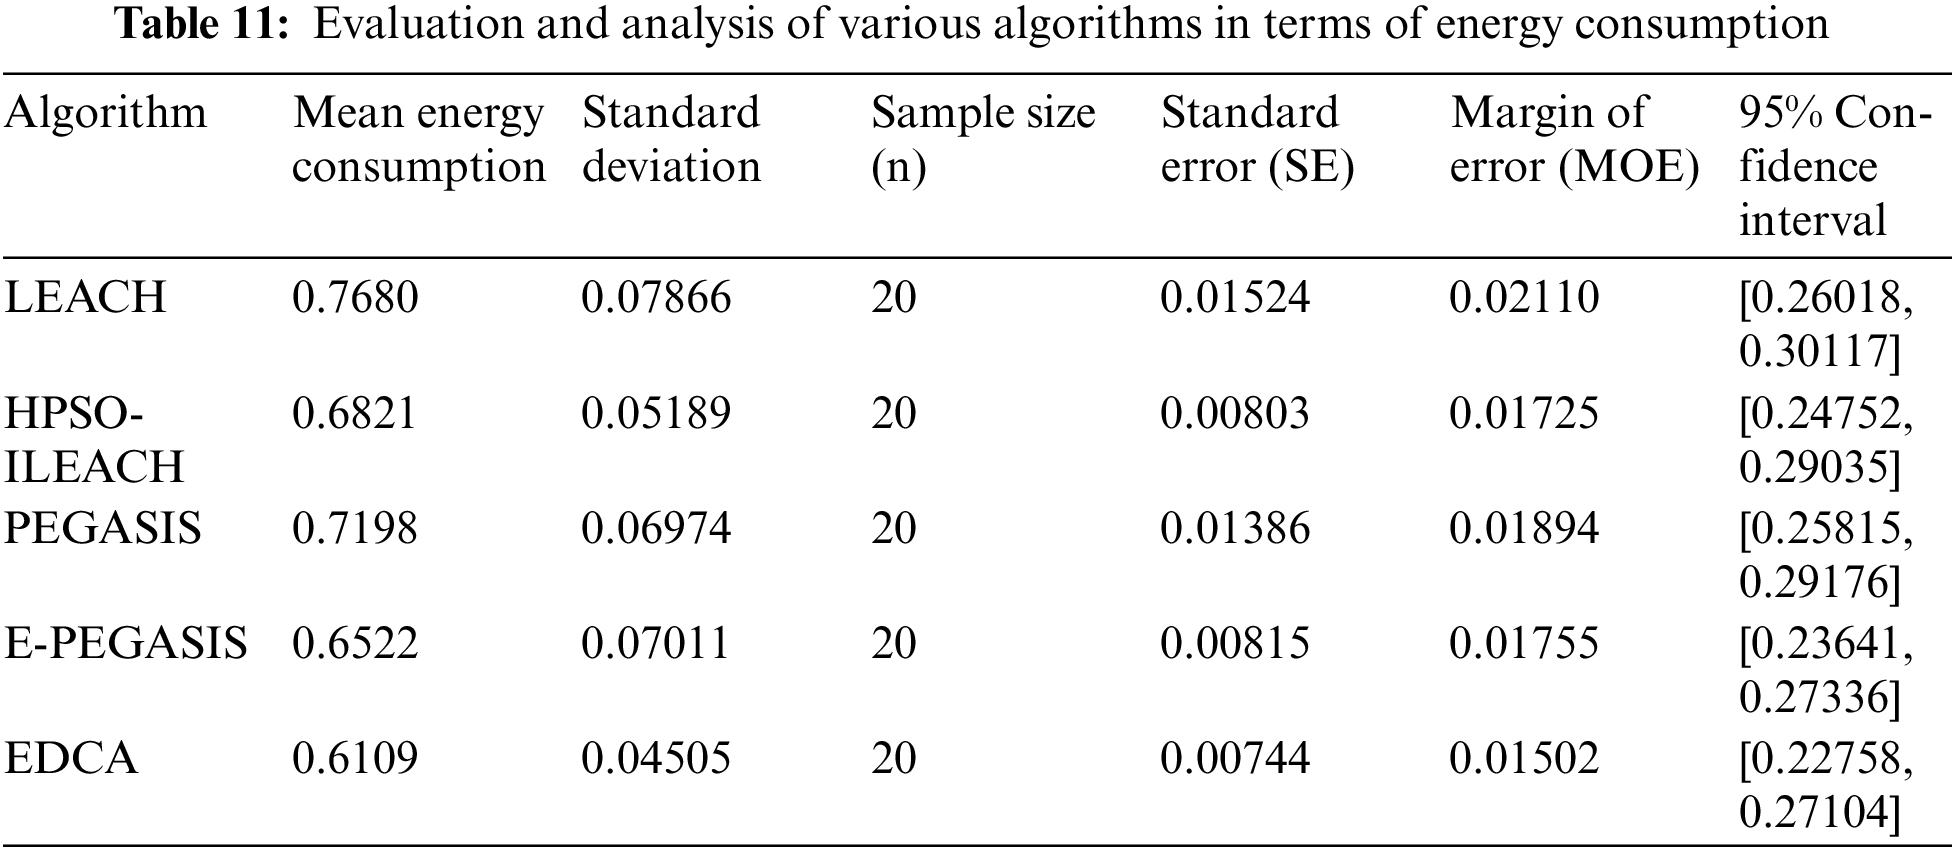
The overall statistical evaluation results of five algorithms in terms of energy consumption and residual energy are shown in Tables 11 and 12. Compared to other algorithms, ECDA demonstrates lower average energy consumption and residual energy. Additionally, the narrow width of the confidence interval suggests that ECDA has greater potential in minimizing energy consumption within the network.
This paper explores the issue of factory sensor data acquisition and transmission in CPS based on WSN and proposes the information processing model. Firstly, this paper proposes Energy-Conserving Data Aggregation Algorithm (ECDA). According to simulation results, the proposed methodology efficiently reduces energy consumption and increasing the transmission reliability. Secondly, this paper developed Efficient Message Reception Algorithm for Sensors (EMRA), which includes PMRA, STMRA, and SCMRA. Experiments show that EMRA helps in receiving information from the sensor regularly and completely. However, Due to resource constraints, WSN is easily targeted by Sinkhole, Sybil, wormhole, interference, and eavesdropping attacks. Therefore, providing Quality of Service (QoS) related to network security in terms of data confidentiality and privacy has become a major challenge for secure data communication. In the future, this article can further investigate an intelligent factory environment for bidirectional information detection and analysis.
Acknowledgement: None.
Funding Statement: Initiation Funds for High-Level Talents Program of Xi’an International University (Grant No. XAIU202411).
Author Contributions: Chao-Hsien Hsieh is responsible for the guidance section of this article. Qingqing Yang is responsible for the main writing part of the article. Dehong Kong and Fengya Xu is responsible for the revision part of this article. Hongmei Wang is responsible for the partial writing section of the article. All authors reviewed the results and approved the final version of the manuscript.
Availability of Data and Materials: Not applicable.
Ethics Approval: Not applicable.
Conflicts of Interest: The authors declare no conflicts of interest to report regarding the present study.
References
1. S. Kumar and B. Bhowmik, “Emergence, evolution, and applications of cyber-physical systems in smart society,” in 2024 Fourth Int. Conf. Adv. Elect., Comput., Commun. Sustain. Technol., Bhilai, India, 2024, pp. 1–8. doi: 10.1109/ICAECT60202.2024.10468864. [Google Scholar] [CrossRef]
2. M. K. Dehury, B. K. Mohanta, and S. Chedup, Security Issues and Challenges in Deploying a CPS Using WSN. Singapore: Information Technology Security. Springer, 2024. [Google Scholar]
3. L. Cavanini et al., “A preliminary study of a cyber physical system for Industry 4.0: Modelling and co-simulation of an AGV for smart factories,” in 2018 Workshop Metrol. Industry 4.0 and IoT, Brescia, Italy, vol. 16, pp. 169–174, 2018. doi: 10.1109/METROI4.2018.8428334. [Google Scholar] [CrossRef]
4. W. Yu, Y. Liu, T. Dillon, W. Rahayu, and F. Mostafa, “An integrated framework for health state monitoring in a smart factory employing IoT and big data techniques,” IEEE Internet Things J., vol. 9, no. 3, pp. 2443–2454, 2022. doi: 10.1109/JIOT.2021.3096637. [Google Scholar] [CrossRef]
5. J. Li et al., “Research and application of energy-efficient management approach for wireless sensor networks,” Sensors, vol. 23, no. 3, 2023, Art. no. 1567. doi: 10.3390/s23031567. [Google Scholar] [PubMed] [CrossRef]
6. S. C. Mukhopadhyay, S. K. S. Tyagi, N. K. Suryadevara, V. Piuri, F. Scotti and S. Zeadally, “Artificial intelligence-based sensors for next generation IoT applications: A review,” IEEE Sens. J., vol. 21, no. 22, pp. 24920–24932, 2021. doi: 10.1109/JSEN.2021.3055618. [Google Scholar] [CrossRef]
7. M. R. Uddin et al., “A hybrid MCDM approach based on AHP, and TOPSIS to select an ERP system in Bangladesh,” in 2021 Int. Conf. Inform. Commun. Technol. Sustain. Develop., Dhaka, Bangladesh, 2021, pp. 161–165. doi: 10.1109/ICICT4SD50815.2021.9396932. [Google Scholar] [CrossRef]
8. K. Karunanithy and B. Velusamy, “An efficient data collection using wireless sensor networks and internet of things to monitor the wild animals in the reserved area,” Peer-to-Peer Netw. Appl., vol. 15, no. 2, pp. 1105–1125, 2022. doi: 10.1007/s12083-021-01289-x. [Google Scholar] [CrossRef]
9. K. Karunanithy and B. Velusamy, “Edge device based efficient data collection in smart health monitoring system using wireless body area network,” Biomed. Signal Process. Control, vol. 72, no. 16, 2022, Art. no. 103280. doi: 10.1016/j.bspc.2021.103280. [Google Scholar] [CrossRef]
10. A. Belfkih, C. Duvallet, and B. Sadeg, “A survey on wireless sensor network databases,” Wireless Netw., vol. 25, no. 8, pp. 4921–4946, 2019. doi: 10.1007/s11276-019-02070-y. [Google Scholar] [CrossRef]
11. T. Sutjarittham, H. Habibi Gharakheili, S. S. Kanhere, and V. Sivaraman, “Experiences with IoT and AI in a smart campus for optimizing classroom usage,” IEEE Internet Things J., vol. 6, no. 5, pp. 7595–7607, 2019. doi: 10.1109/JIOT.2019.2902410. [Google Scholar] [CrossRef]
12. M. A. Jamshed, K. Ali, Q. H. Abbasi, M. A. Imran, and M. Ur-Rehman, “Challenges, applications, and future of wireless sensors in internet of things: A review,” IEEE Sens. J., vol. 22, no. 6, pp. 5482–5494, 2022. doi: 10.1109/JSEN.2022.3148128. [Google Scholar] [CrossRef]
13. M. Javaid, A. Haleem, R. P. Singh, S. Rab, and R. Suman, “Significance of sensors for Industry 4.0: Roles, capabilities, and applications,” Sens. Int., vol. 2, 2021, Art. no. 100110. doi: 10.1016/j.sintl.2021.100110. [Google Scholar] [CrossRef]
14. J. Koo and S. Yoon, “Simultaneous in-situ calibration for physical and virtual sensor fusion towards digital twin-enabled building operation,” Adv. Eng. Inform., vol. 59, no. 4, pp. 421–434, 2024. doi: 10.1016/j.aei.2023.102239. [Google Scholar] [CrossRef]
15. C. Shyalika et al., “RI2AP: Robust and interpretable 2D anomaly prediction in assembly pipelines,” Sensors, vol. 24, no. 10, 2024, Art. no. 3244. doi: 10.3390/s24103244. [Google Scholar] [PubMed] [CrossRef]
16. T. Saaty, The analytic hierarchy process: Planning, priority setting, resource allocation. McGraw-Hill, 1980. [Google Scholar]
17. N. Munier and E. Hontoria, “Rationality of the AHP Method,” in Uses and Limitations of the AHP Method. Cham: Management for Professionals, Springer, 2021. doi: 10.1007/978-3-030-60392-2_4. [Google Scholar] [CrossRef]
18. A. Ronco, L. Schulthess, D. Zehnder, and M. Magno, “Machine learning in-sensors: Computation-enabled intelligent sensors for next generation of IoT,” in 2022 IEEE Sensors, Dallas, TX, USA, 2022. doi: 10.1109/SENSORS52175.2022.9967240. [Google Scholar] [CrossRef]
19. F. Aquino, F. Fernández, and E. Ortigoza, “Multicriteria analysis of the performance in the use of electrical energy in the UNA: An approach based on AHP,” in 2022 IEEE Int. Conf. Automat./XXV Cong. Chilean Assoc. Automat. Cont., 2022, pp. 1–6. doi: 10.1109/ICA-ACCA56767.2022.10006203. [Google Scholar] [CrossRef]
20. D. R. Dange, S. Dutta, T. Chakraborty, and M. Majumder, “Identification of priority parameters for representation of desertification by using AHP-VIKOR method,” in 2022 IEEE Delhi Sect. Conf., Curicó, Chile, 2022, pp. 1–4. doi: 10.1109/DELCON54057.2022.9752995. [Google Scholar] [CrossRef]
21. H. Ergin and E. Nasibov, “Evaluation of university monitoring criteria with fuzzy AHP method,” in Int. Conf. Prob. Cyber. Inform., Baku, Azerbaijan, 2023, pp. 1–3. doi: 10.1109/PCI60110.2023.10325926. [Google Scholar] [CrossRef]
22. J. A. Saucedo-Martínez, T. E. Salais-Fierro, R. Rodriguez-Aguilar, and J. A. Marmolejo-Saucedo, “Selecting the distribution system using AHP and fuzzy AHP methods,” Mobile Netw Appl., vol. 29, no. 1, pp. 235–242, 2024. doi: 10.1007/s11036-023-02290-9. [Google Scholar] [CrossRef]
23. G. Adiline Macriga, K. Malarvizhi, S. Sobitha Ahila, C. N. K. Babu, S. Ayyasamy and B. M. Yashaswini, “Energy efficient greedy tree-based algorithm for data aggregation in wireless sensor network,” Measur.: Sens., vol. 30, no. 4, pp. 432–445, 2023. doi: 10.1016/j.measen.2023.100910. [Google Scholar] [CrossRef]
24. B. A. Begum and S. V. Nandury, “Data aggregation protocols for WSN and IoT applications-a comprehensive survey,” J. King Saud Univ.-Comput. Inf. Sci., vol. 35, no. 2, pp. 651–681, 2023. doi: 10.1016/j.jksuci.2023.01.008. [Google Scholar] [CrossRef]
25. V. Rama Krishna, V. Sukanya, and M. A. Hameed, “Enhancing Wireless Sensor Network lifetime through hierarchical chain-based routing and horizontal network partitioning techniques,” Measur.: Sens., vol. 36, no. 5, pp. 597–616, 2024. doi: 10.1016/j.measen.2024.101300. [Google Scholar] [CrossRef]
26. S. Sharmin, I. Ahmedy, and R. M. Noor, “An energy-efficient data aggregation clustering algorithm for wireless sensor networks using hybrid PSO,” Energies, vol. 16, no. 5, 2023, Art. no. 2487. doi: 10.3390/en16052487. [Google Scholar] [CrossRef]
27. S. R. Jonnalagadda, S. Kattula, and R. Guntuku, “Energy-aware MAX-LEACH routing protocol for homogeneous and heterogeneous WSNs,” Wireless Pers. Commun., vol. 132, no. 2, pp. 1527–1551, 2023. doi: 10.1007/s11277-023-10673-0. [Google Scholar] [CrossRef]
28. S. Sadhana, E. Sivaraman, and D. Daniel, “Enhanced energy-efficient routing for wireless sensor network using extended power-efficient gathering in sensor information systems (E-PEGASIS) protocol,” Procedia Comput. Sci., vol. 194, no. 4, pp. 89–101, 2021. doi: 10.1016/j.procs.2021.10.062. [Google Scholar] [CrossRef]
29. L. Wang, Y. Luo, and H. Yan, “Optimization analysis of node energy consumption in wireless sensor networks based on improved ant colony algorithm,” Sustain. Energy Technol. Assess., vol. 64, no. 1, pp. 1309–1327, 2024. doi: 10.1016/j.seta.2024.103680. [Google Scholar] [CrossRef]
Cite This Article
 Copyright © 2025 The Author(s). Published by Tech Science Press.
This work is licensed under a Creative Commons Attribution 4.0 International License , which permits unrestricted use, distribution, and reproduction in any medium, provided the original work is properly cited.
 Downloads
 Citation Tools