
 Submit a Paper
 Propose a Special lssue
 Open Access
ARTICLE

Addressing Imbalance in Health Datasets: A New Method NR-Clustering SMOTE and Distance Metric Modification
1 Department of Electrical Engineering and Informatics, Faculty of Engineering, Universitas Negeri Malang, Malang, 65145, Indonesia
2 Department of Computer Science, Universitas Bumigora, Mataram, 83127, Indonesia
3 Department of Computer Graphic and Multimedia, Faculty of Computing, College of Computing and Applied Sciences, Universiti Malaysia Pahang Al-Sultan Abdullah, Pekan, 26600, Malaysia
* Corresponding Author: Triyanna Widiyaningtyas. Email:
Computers, Materials & Continua 2025, 82(2), 2931-2949. https://doi.org/10.32604/cmc.2024.060837
Received 11 November 2024; Accepted 03 December 2024; Issue published 17 February 2025
 View Full Text
 Download PDF
Abstract
An imbalanced dataset often challenges machine learning, particularly classification methods. Underrepresented minority classes can result in biased and inaccurate models. The Synthetic Minority Over-Sampling Technique (SMOTE) was developed to address the problem of imbalanced data. Over time, several weaknesses of the SMOTE method have been identified in generating synthetic minority class data, such as overlapping, noise, and small disjuncts. However, these studies generally focus on only one of SMOTE’s weaknesses: noise or overlapping. Therefore, this study addresses both issues simultaneously by tackling noise and overlapping in SMOTE-generated data. This study proposes a combined approach of filtering, clustering, and distance modification to reduce noise and overlapping produced by SMOTE. Filtering removes minority class data (noise) located in majority class regions, with the k-nn method applied for filtering. The use of Noise Reduction (NR), which removes data that is considered noise before applying SMOTE, has a positive impact in overcoming data imbalance. Clustering establishes decision boundaries by partitioning data into clusters, allowing SMOTE with modified distance metrics to generate minority class data within each cluster. This SMOTE clustering and distance modification approach aims to minimize overlap in synthetic minority data that could introduce noise. The proposed method is called “NR-Clustering SMOTE,” which has several stages in balancing data: (1) filtering by removing minority classes close to majority classes (data noise) using the k-nn method; (2) clustering data using K-means aims to establish decision boundaries by partitioning data into several clusters; (3) applying SMOTE oversampling with Manhattan distance within each cluster. Test results indicate that the proposed NR-Clustering SMOTE method achieves the best performance across all evaluation metrics for classification methods such as Random Forest, SVM, and Naїve Bayes, compared to the original data and traditional SMOTE. The proposed method (NR-Clustering SMOTE) improves accuracy by 15.34% on the Pima dataset and 20.96% on the Haberman dataset compared to SMOTE-LOF. Compared to Radius-SMOTE, this method increases accuracy by 3.16% on the Pima dataset and 13.24% on the Haberman dataset. Meanwhile, compared to RN-SMOTE, the accuracy improvement reaches 15.56% on the Pima dataset and 19.84% on the Haberman dataset. This research result implies that the proposed method experiences consistent performance improvement compared to traditional SMOTE and its latest variants, such as SMOTE-LOF, Radius-SMOTE, and RN-SMOTE, in solving imbalanced health data with class binaries.Keywords
Abbreviations
| SMOTE | Synthetic Minority Over-Sampling Technique |
| NR | Noise Reduction |
| SVM | Support Vector Machine |
| LOF | Local Outlier Factor |
| KSMOTE | Kalman SMOTE |
| ENN | Edited Nearest Neighbor |
| K-NN | K-Nearest Neighbor |
| TP | True Positive |
| TN | True Negative |
| FP | False Positive |
| FN | False Negative |
| DBSCAN | Density-Based Spatial Clustering of Applications with Noise |
| AUC | Area Under the Curve |
| ED | Euclidean Distance |
| Min | Minimum |
| Max | Maximum |
| DManhattan | Distance of Manhattan |
| RN-SMOTE | Reduced Noise-SMOTE |
Dataset balancing is crucial in data preprocessing, especially for classification problems involving imbalanced datasets. Imbalanced datasets often present challenges in machine learning, particularly in classification methods. The underrepresentation of minority classes can lead to biased and inaccurate models. Researchers developed the Synthetic Minority Over-Sampling Technique (SMOTE) [1] to address the issue of imbalanced data. Many researchers have applied SMOTE to solve data-balancing problems in recent decades. SMOTE generates synthetic data for the minority class based on nearest neighbors using Euclidean distance through linear interpolation [2]. Over time, several weaknesses in SMOTE’s approach to creating synthetic minority class data have been identified, such as overlapping, noise, and small disjuncts [3,4]. Noise refers to minority class data situated in the majority class region, while overlapping refers to minority class data (noise data) located near majority data at the decision boundary. SMOTE introduces noise in synthetic minority data due to noise in the oversampled original data [5]. Furthermore, SMOTE produces overlapping in synthetic minority data, potentially creating noise caused by an unclear decision boundary, thereby reducing classification performance [6].
Several previous studies have developed SMOTE-based methods with different approaches. For example, study [7] developed SMOTE-LOF to balance data in the Pima, Haberman, and Glass datasets. SMOTE-LOF first oversamples the data using SMOTE. Once the data is balanced, minority class data identified as outliers are removed through the Local Outlier Factor (LOF) method. However, this study only addresses noise data considered as outliers and does not solve the problem of minority class data located near majority class data, which can also be noise. Study [8] introduced Radius-SMOTE to address data imbalance. Radius-SMOTE filters out minority class data considered as noise before applying SMOTE oversampling based on a specified radius. This study’s limitation is its lack of detailed criteria for removing minority class noise data, and the chosen radius does not establish a clear decision boundary between minority and majority classes. Study [9] developed RN-SMOTE to address data imbalance by balancing data with SMOTE, then detecting and removing noise with the DBSCAN clustering method. After minority class noise data is removed, oversampling with SMOTE is repeated. Studies [10–12] used distance metrics in SMOTE to generate synthetic data for minority classes, finding that various distance metrics can enhance classification performance. However, these studies lack specific criteria for identifying and removing minority-class noise data.
The KSMOTE (Kalman SMOTE) method introduced in the study is an enhancement of the SMOTE technique that uses a Kalman filter to identify and remove data samples considered as noise from the dataset. A limitation of this study is the lack of detailed criteria for determining which data should be removed as noise. Study [13] applied a hybrid SMOTE-ENN sampling method to address data imbalance in liver disease cases. SMOTE is used to oversample the minority class until it is balanced with the majority class. Once balanced, noise in the majority class data is removed using the Edited Nearest Neighbor (ENN) method. The drawback of this study is the removal of a large amount of majority class data, which may lead to the loss of valuable information. The study [14] introduces the DiGAN method to solve the problem of imbalanced data in diabetes disease data.
Several previous studies have developed SMOTE methods using different approaches. However, these studies generally focus on only one of SMOTE’s weaknesses: noise or overlapping. Therefore, this study addresses both issues simultaneously by tackling noise and overlapping in SMOTE-generated data. This study proposes a combined approach of filtering, clustering, and distance modification to reduce noise and overlapping produced by SMOTE. Filtering removes minority class data (noise) located in majority class regions, with the k-nn method applied for filtering. The use of NR, which eliminates data that is considered noise before applying SMOTE, has a positive impact on overcoming data imbalance [4]. By removing these noise points, the synthetic data generation focuses on the core patterns of the minority class, resulting in improved model robustness and better generalization. Clustering establishes decision boundaries by partitioning data into clusters, allowing SMOTE with modified distance metrics to generate minority class data within each cluster. SMOTE with modified Manhattan distance for balancing minor classes in each cluster can minimize the occurrence of potential noise in artificially generated minor class overlaps.
This study introduces a modified SMOTE method called Noise Reduction-Clustering SMOTE with Manhattan Distance (NR-Clustering SMOTE) for balancing data, particularly in healthcare data. Meanwhile, the contributions of this research are as follows:
1. Using the k-nn method for filtering by eliminating minority classes adjacent to the majority class (noise data).
2. Clustering data into several groups with the K-means method, with the number of clusters determined by the silhouette value. K-means clustering aims to establish decision boundaries by partitioning data into clusters.
3. Applying a modified Manhattan distance in SMOTE to perform oversampling within each cluster to minimize overlapping data that may generate noise.
4. Using Random Forest, SVM, and Naïve Bayes data classification methods, the results are verified or evaluated using Accuracy, F1-measure, and AUC metrics.
5. Comparing the proposed method with other techniques for addressing data imbalance, such as SMOTE, SMOTE-LOF [7], Radius-SMOTE [8], and RN-SMOTE [9].
Fig. 1 illustrates the flow of this research. The study begins with dataset collection, preprocessing, and division using 10-fold cross-validation, classification, and performance evaluation.
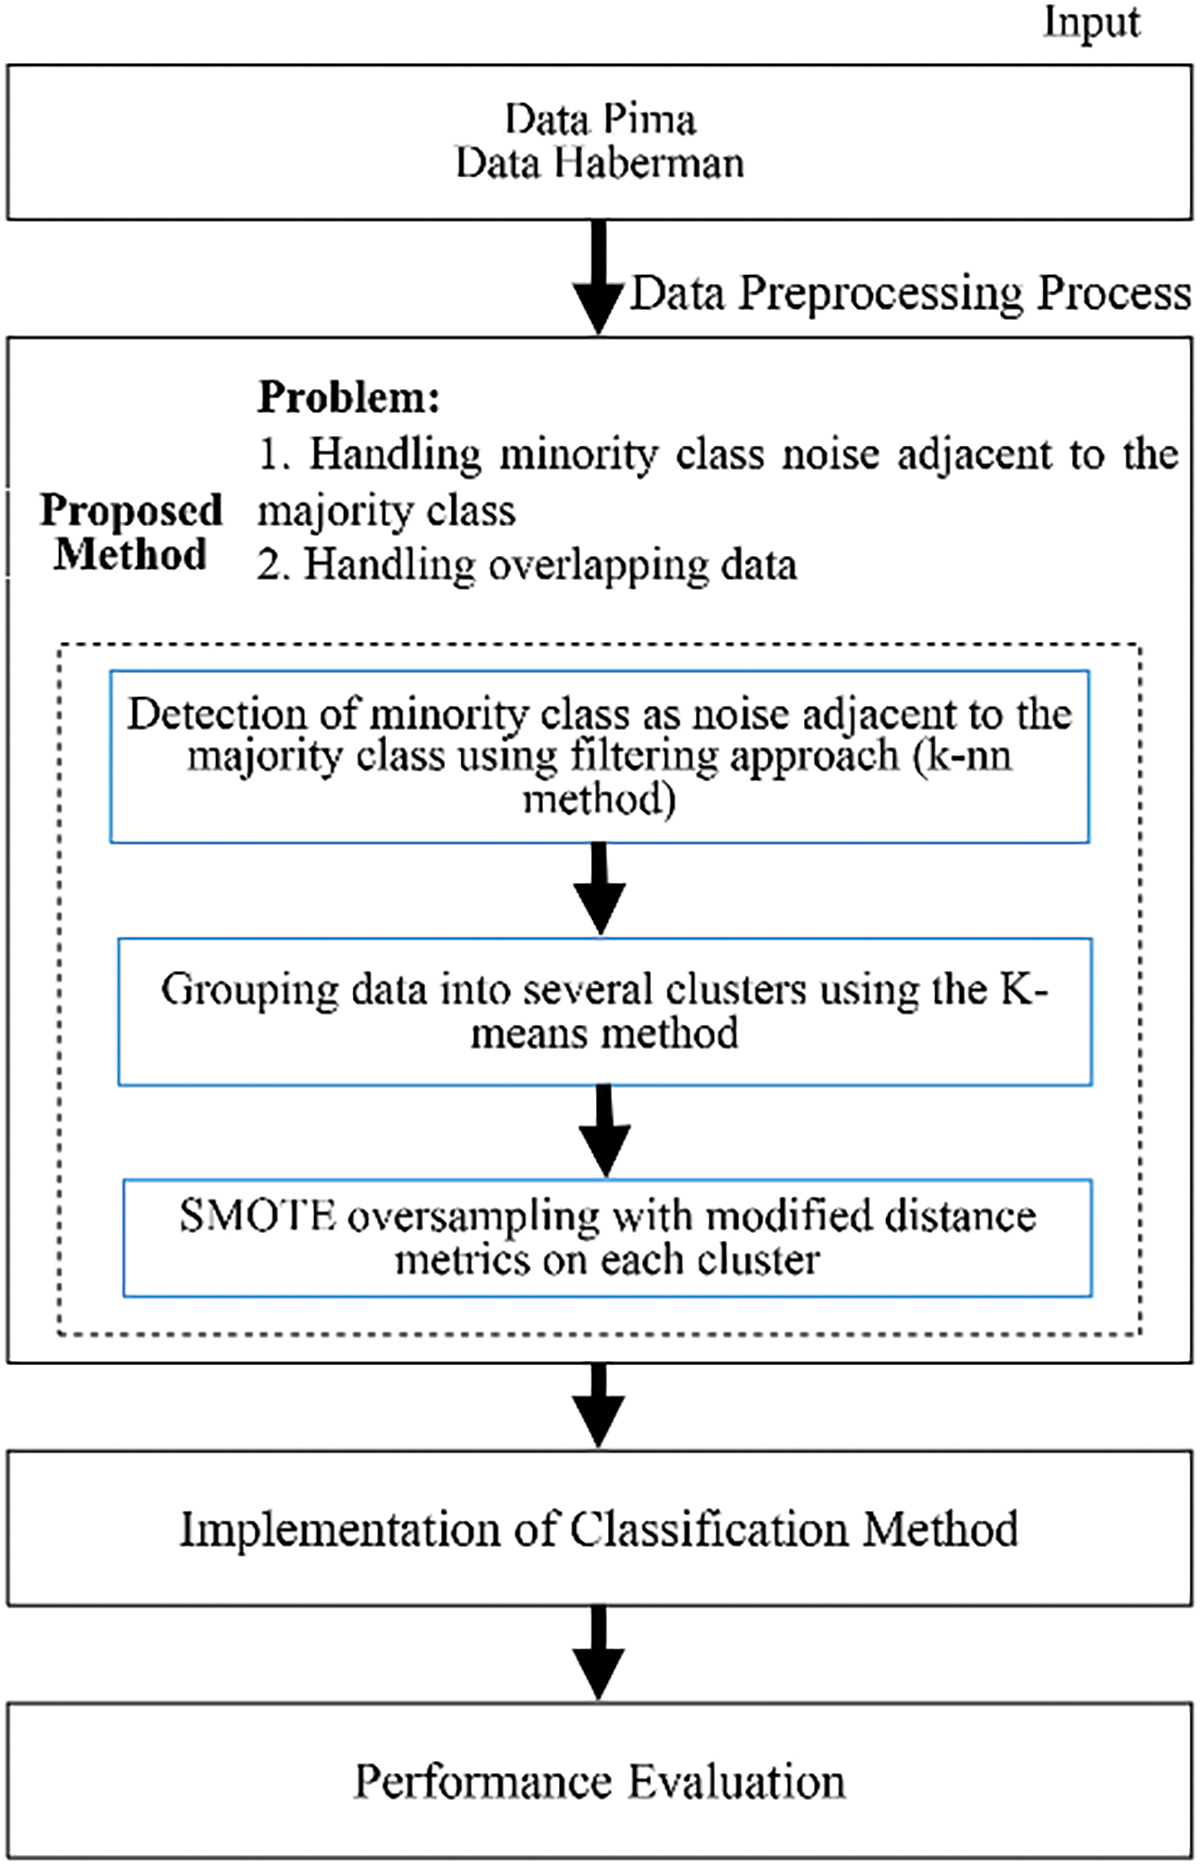
Figure 1: Research flow
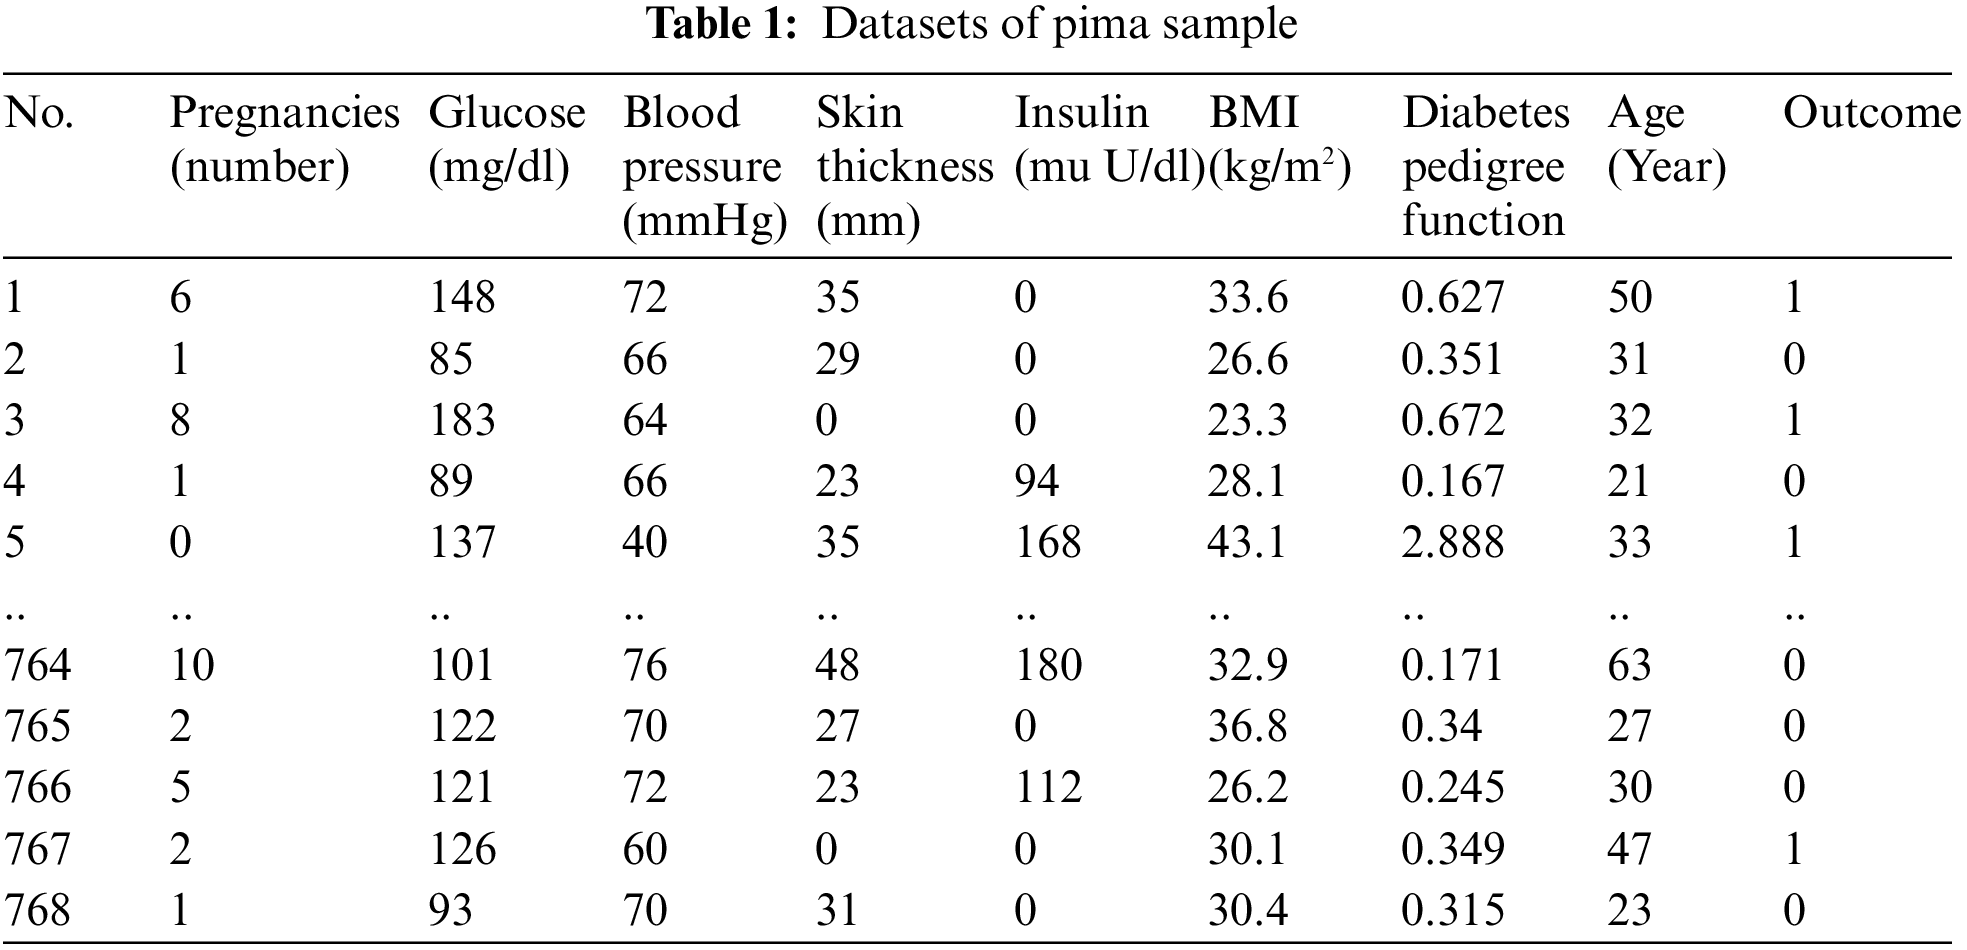
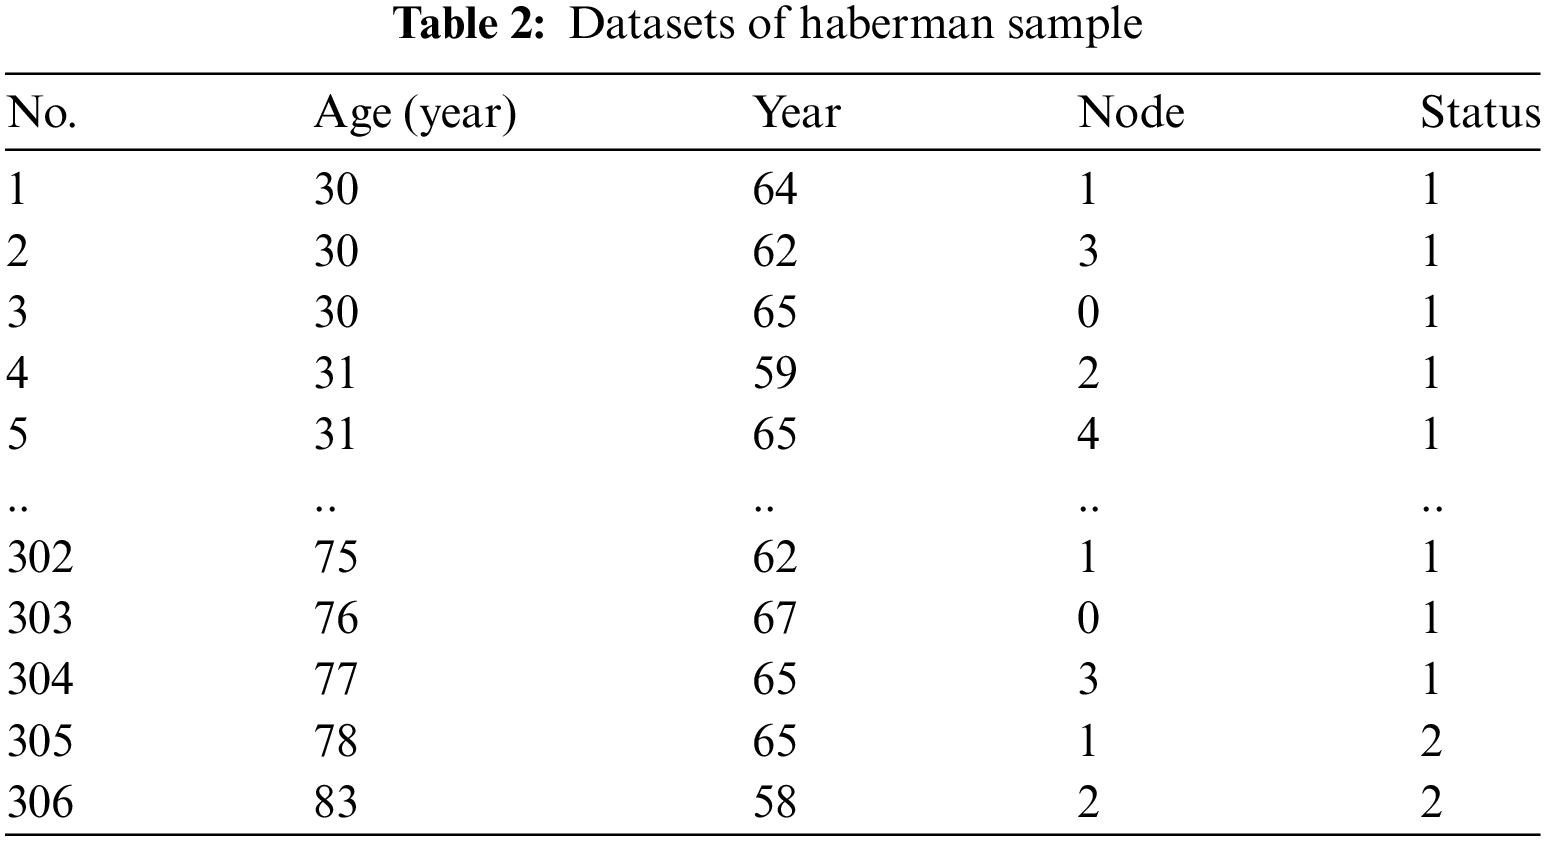
The initial step involves collecting health data from Kaggle, specifically the Pima and Haberman datasets exhibiting different imbalance ratios. The Pima dataset contains 768 instances with eight attributes, while the Haberman dataset consists of 306 instances with three attributes. In the Pima dataset, the minority class (Positive) has 268 instances, and the majority class (Negative) has 500 instances, resulting in an imbalance ratio of 1.87%. In contrast, the Haberman dataset has a majority class (class 1) with 225 instances and a minority class (class 2) with 81 instances, yielding an imbalance ratio of 2.78%. Samples from the Pima and Haberman datasets are presented in Tables 1 and 2, respectively.
This study’s data preprocessing includes scaling and balancing the data using the proposed approach (NR-Clustering SMOTE). Scaling reduces the impact of features with the highest value range (max) compared to features with the lowest value range (min). The scaling formula is presented in Eq. (1).
SMOTE is one of the oversampling methods designed to address data distribution issues developed by [1]. SMOTE aims to balance the data distribution by randomly adding instances of the minority class and creating new instance data through linear interpolation using the Euclidean distance [1]. The creation of new data in the minority class utilizes Eq. (6) and linear interpolation between minority data points with k nearest neighbors using the Euclidean distance formula is shown in Eq. (7) [15]. The use of Euclidean distance in SMOTE to create artificial minority classes has limitations, particularly when the data distribution is high-dimensional; it can lead to potential noise-generating overlapping data in the artificial minority classes produced. Therefore, an alternative distance metric that can be used in high-dimensional data is the Manhattan distance (Eq. (8)) [16]. Moreover, the Manhattan distance performs better than the Euclidean distance when applied to SMOTE. The SMOTE method has a crucial weakness: it generates noise data in the minority classes and potentially noise-generating overlapping data, leading to inaccurate classification results. Therefore, this research proposes a solution using a method called NR-Clustering SMOTE.
Fig. 2 illustrates the detailed steps of the proposed method (NR-Clustering SMOTE) to address the issues of noise and overlapping data in imbalanced datasets. The first step involves filtering using the k-nn method to categorize minority data into noise or non-noise categories using k = 3 [8,17]. Minority data located around the majority class (noise) is removed. Removing noise from the minority class before applying SMOTE can help reduce the noise data produced by SMOTE, thereby improving the performance of the classification method [9]. Examples of minority class data as noise can be seen in Fig. 3. Afterward, the data is clustered into several groups using K-means, which first determines the number of clusters based on the silhouette score. The purpose of clustering the data with K-means is to establish decision boundaries by partitioning the data into multiple clusters. Subsequently, the SMOTE method (k = 5) with modification of the Manhattan distance metric is applied to balance the minority class and minimize the potential overlap of artificially generated minority class data that could become noise within each cluster. Using k = 5 in SMOTE is a standard parameter and has been proven to give good results in various datasets [1,8]. The selection of the Manhattan distance metric in SMOTE is due to its capability to work in high-dimensional data [16]. Moreover, Manhattan distance outperforms Euclidean distance when applied in SMOTE.
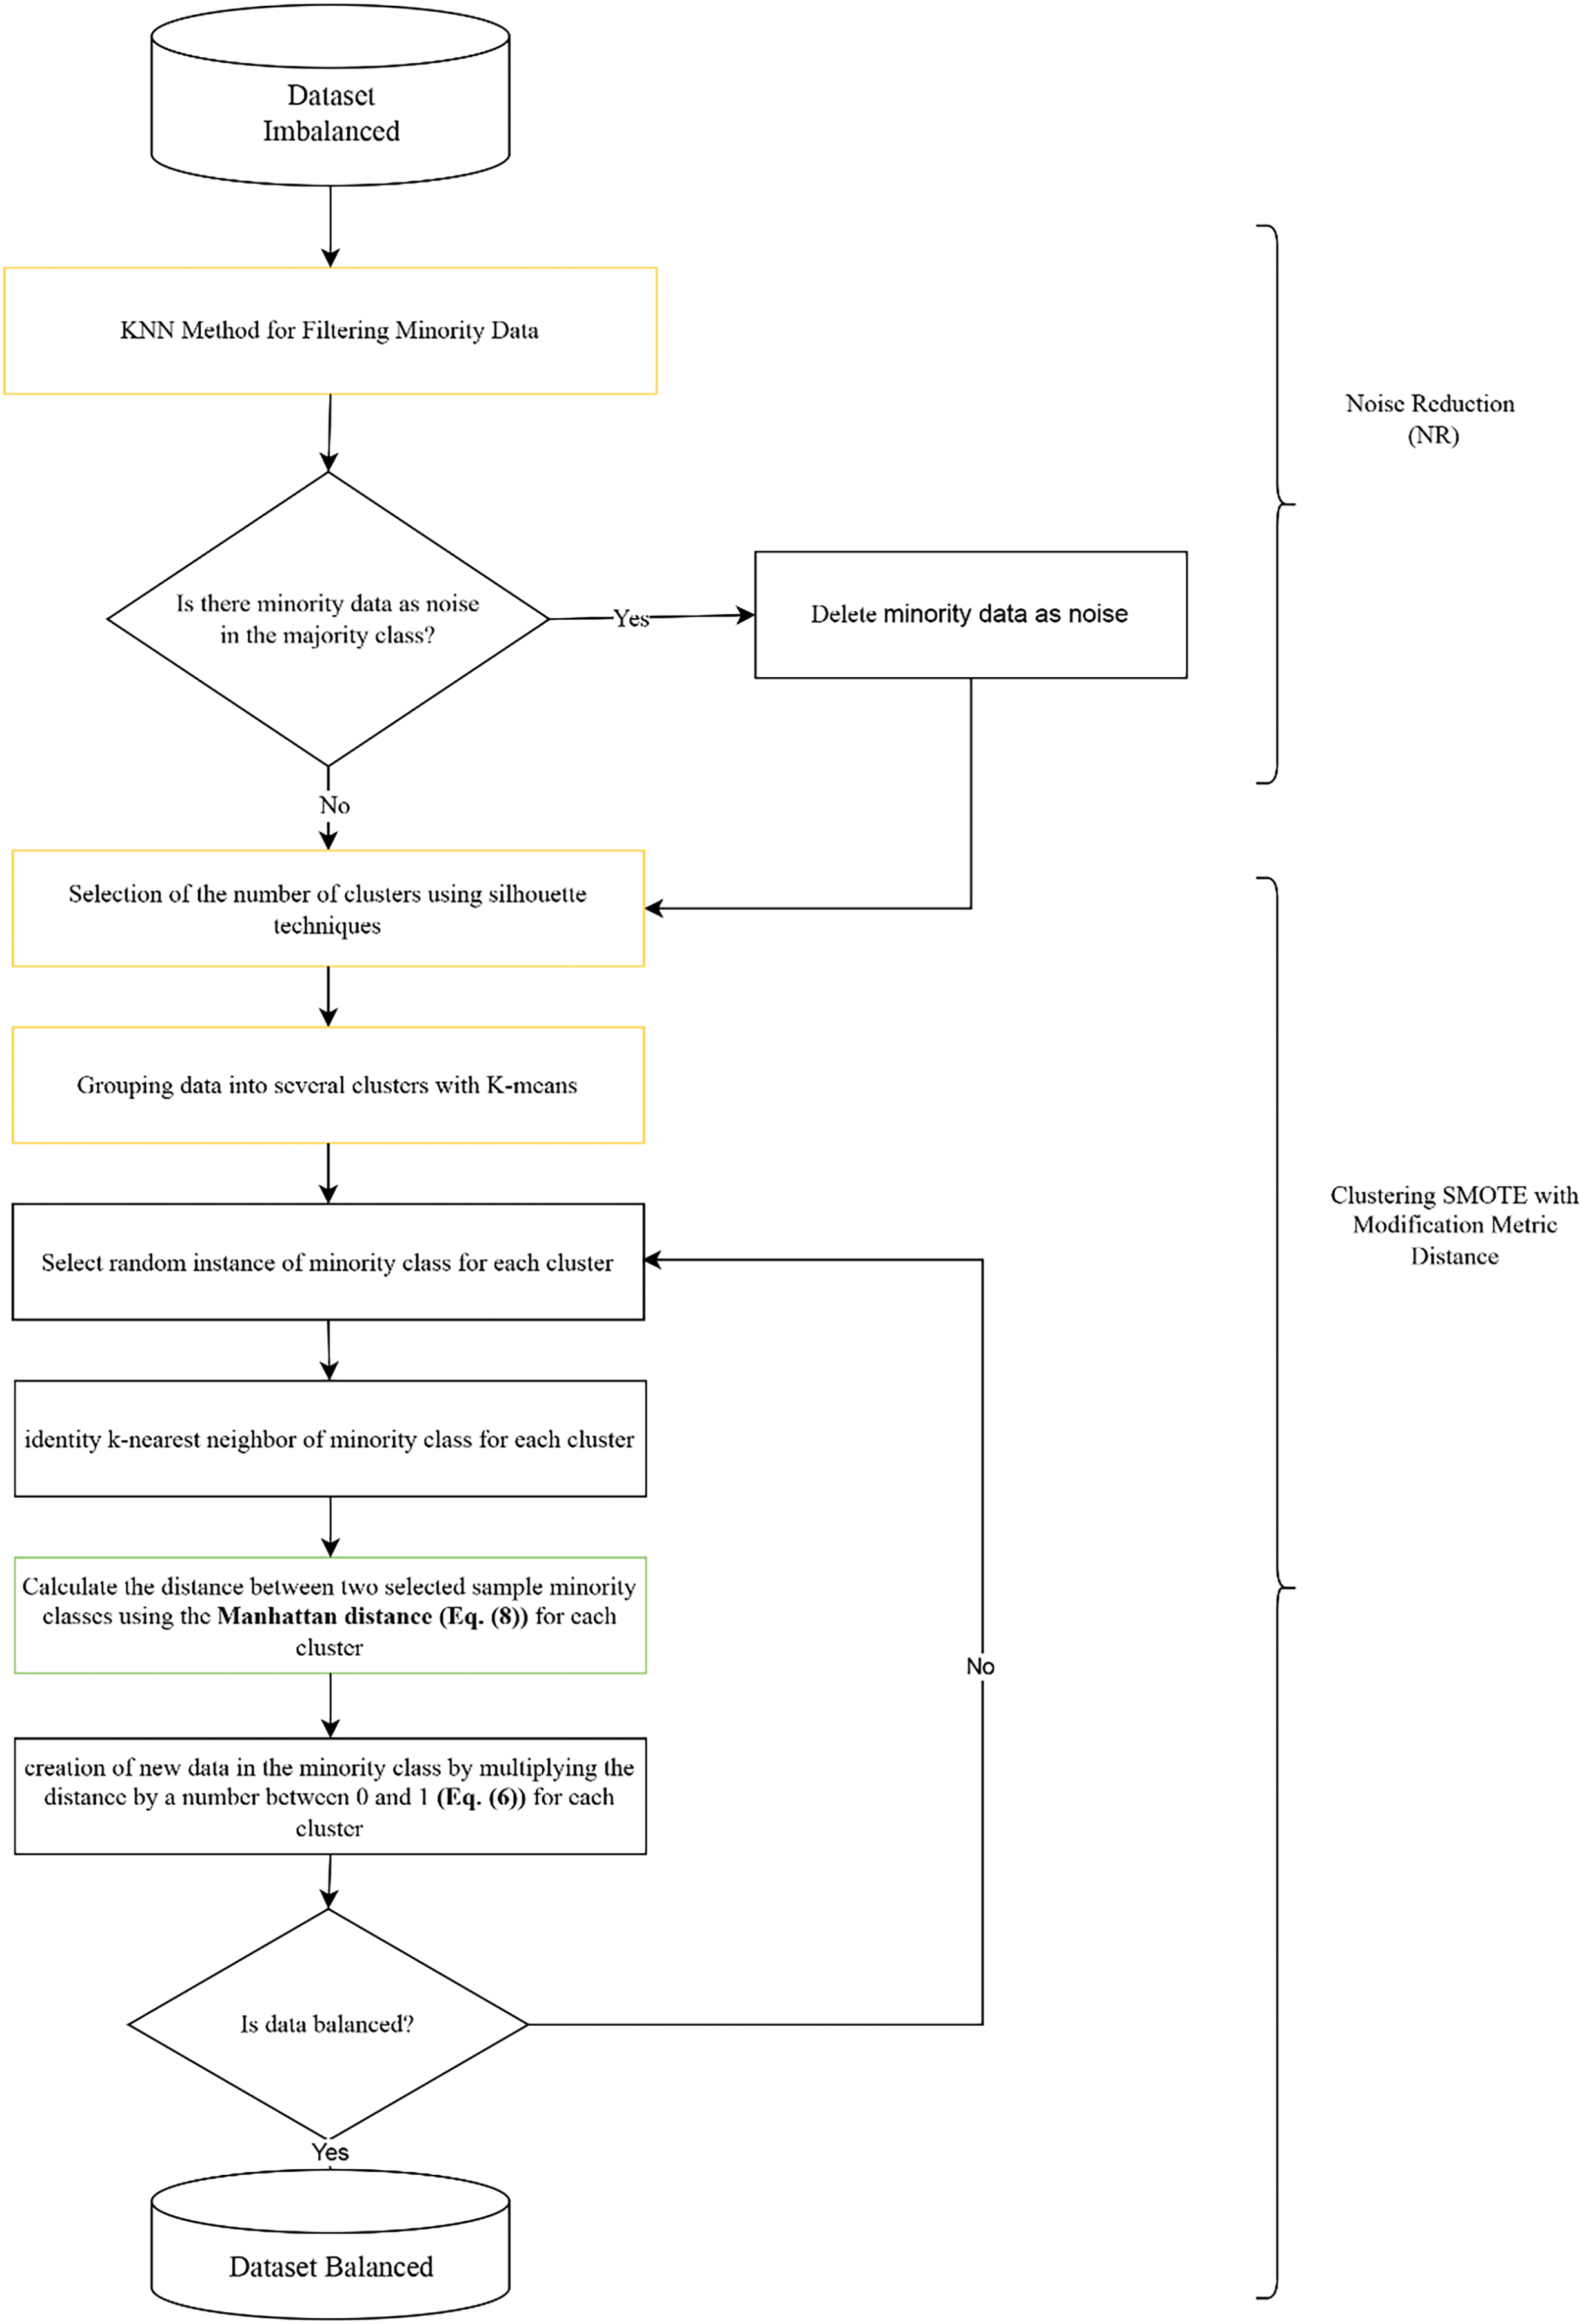
Figure 2: Proposed method steps (NR-Clustering SMOTE)
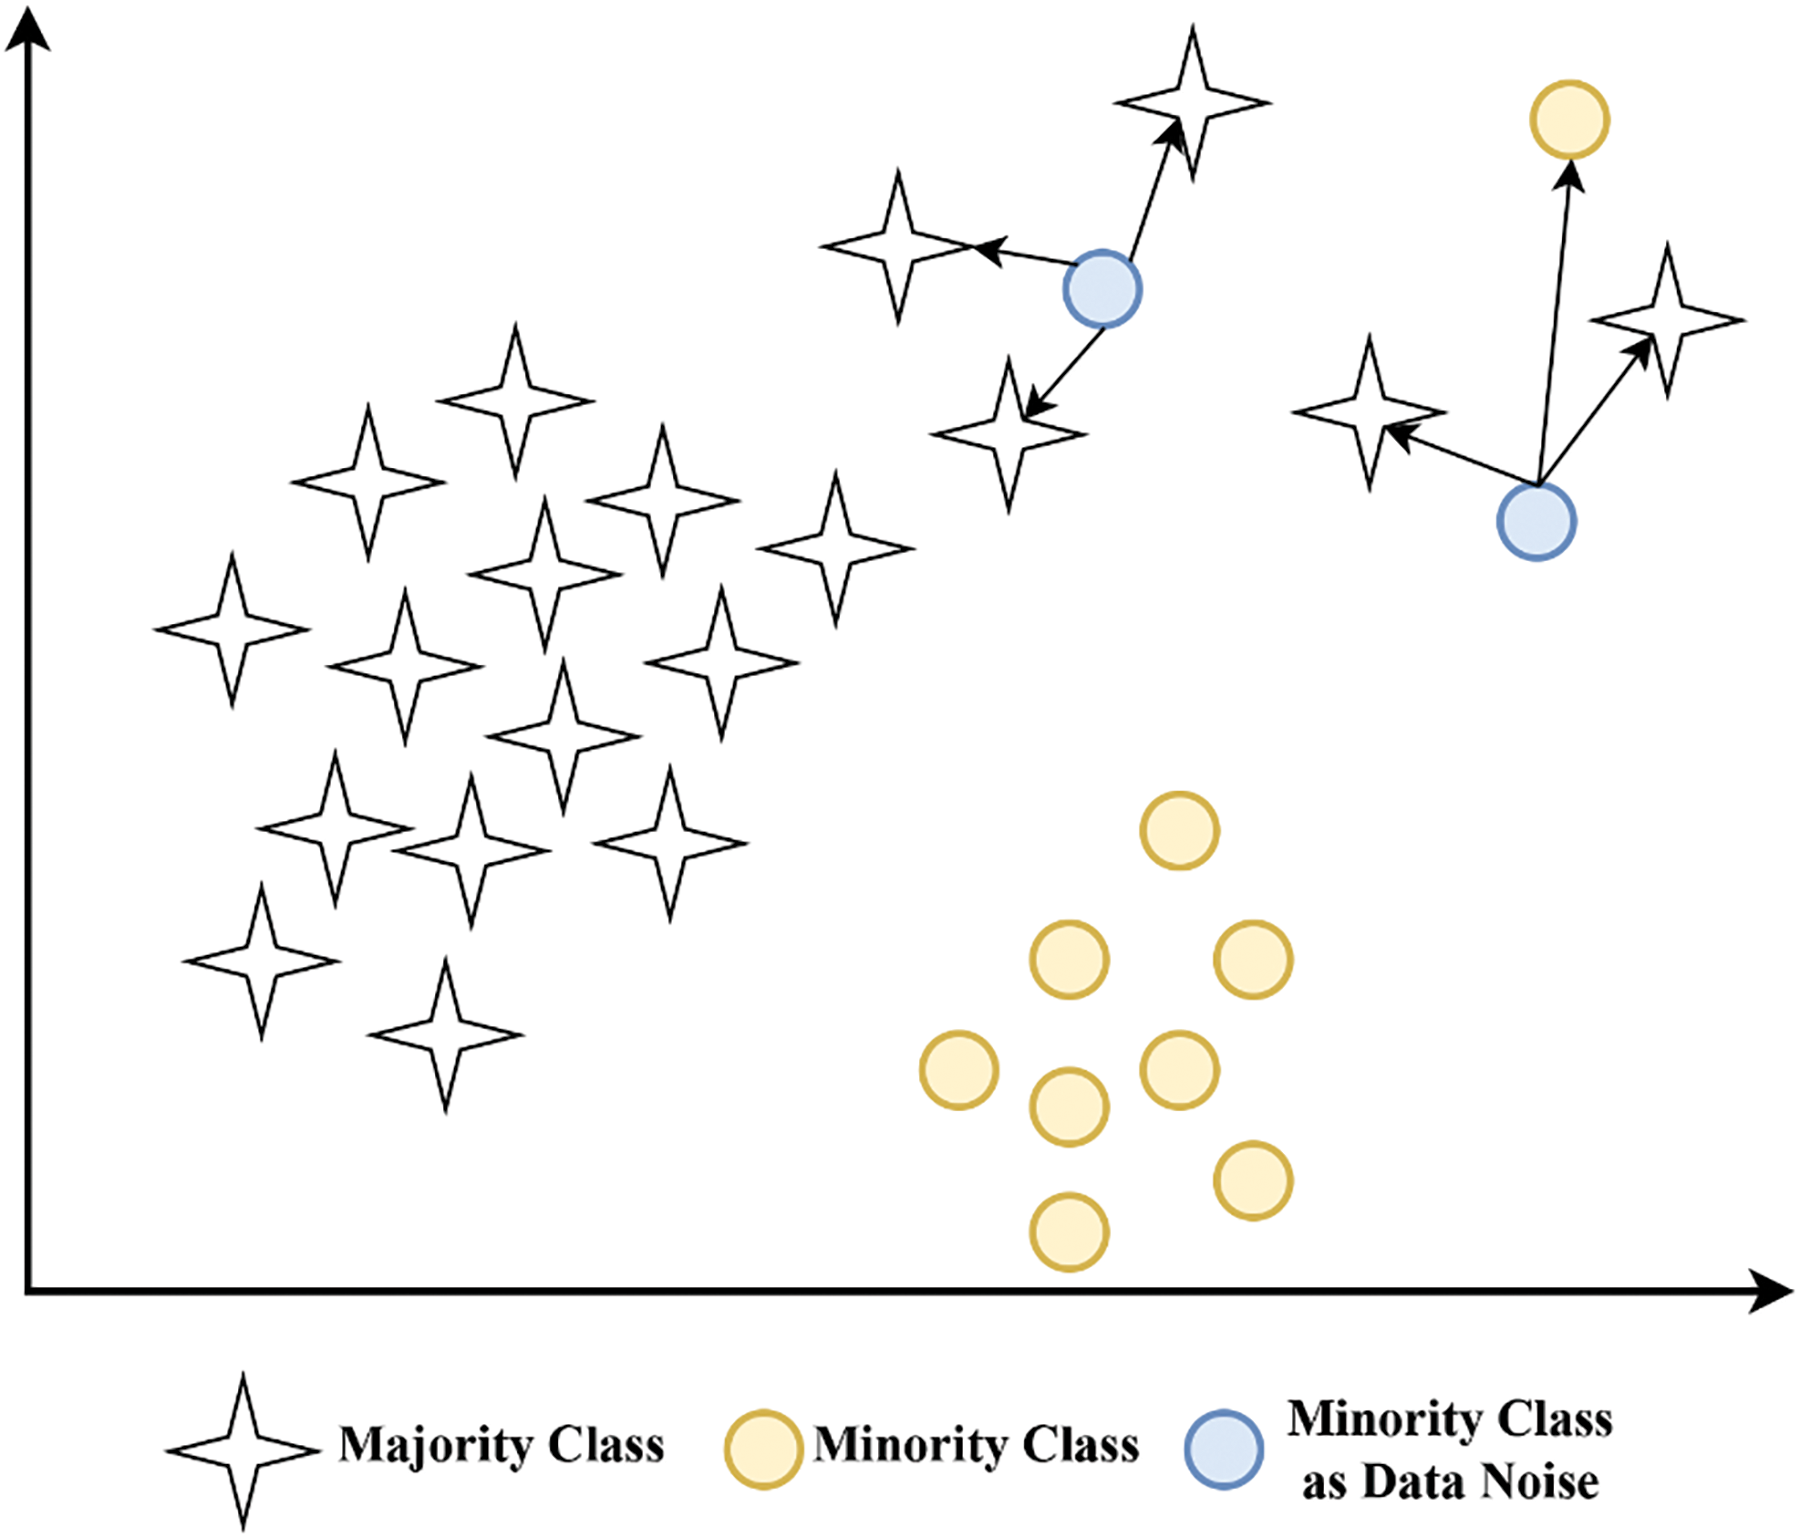
Figure 3: Minority class data as noise
Clustering is an unsupervised machine-learning technique that groups similar data based on specific features or characteristics. The primary objective of clustering is to discover patterns within a dataset without prior knowledge. Clustering techniques are commonly employed for data exploration, pattern recognition, and segmentation. Numerous clustering methods have been developed for data grouping in machine learning, including K-means clustering, DBSCAN, mean shift, and agglomerative clustering [18]. The most frequently utilized clustering method in SMOTE modifications is K-means, as evidenced in studies [19–22]. Therefore, this research incorporates the K-means method in the modification of SMOTE to address the issue of imbalanced health data. The K-means algorithm is a clustering method that falls under unsupervised learning. This method seeks to partition existing data into several groups where the data within each group share similar characteristics [23]. The steps to perform clustering with the K-means method are [23]:
1. Select the number of clusters k.
2. Randomly initialize k cluster centers. The cluster centers (centroids) are assigned initial random values.
3. Allocate all data objects to the nearest cluster by calculating the distance of each data point to the centroid using Euclidean distance as per Eq. (7).
4. Repeat steps (2) and (3) until the members of each cluster stabilize and no further movements occur.
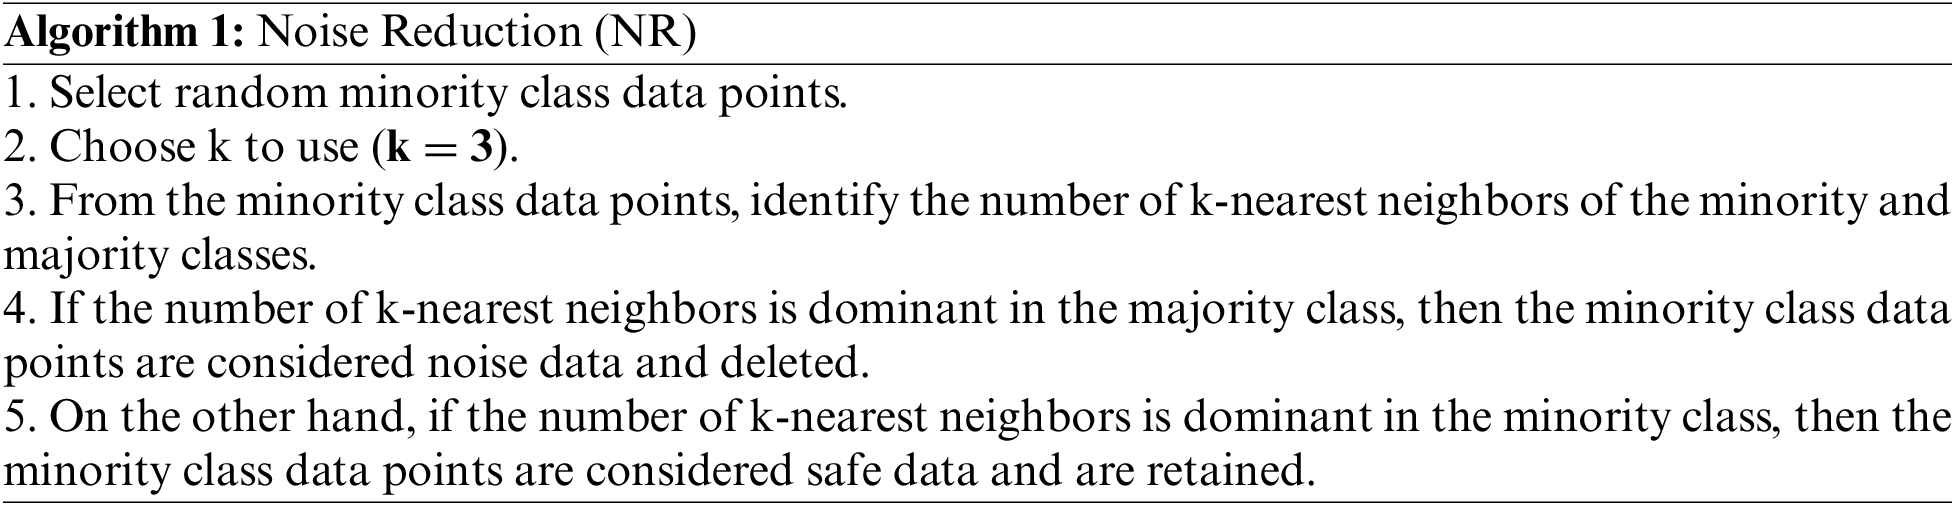
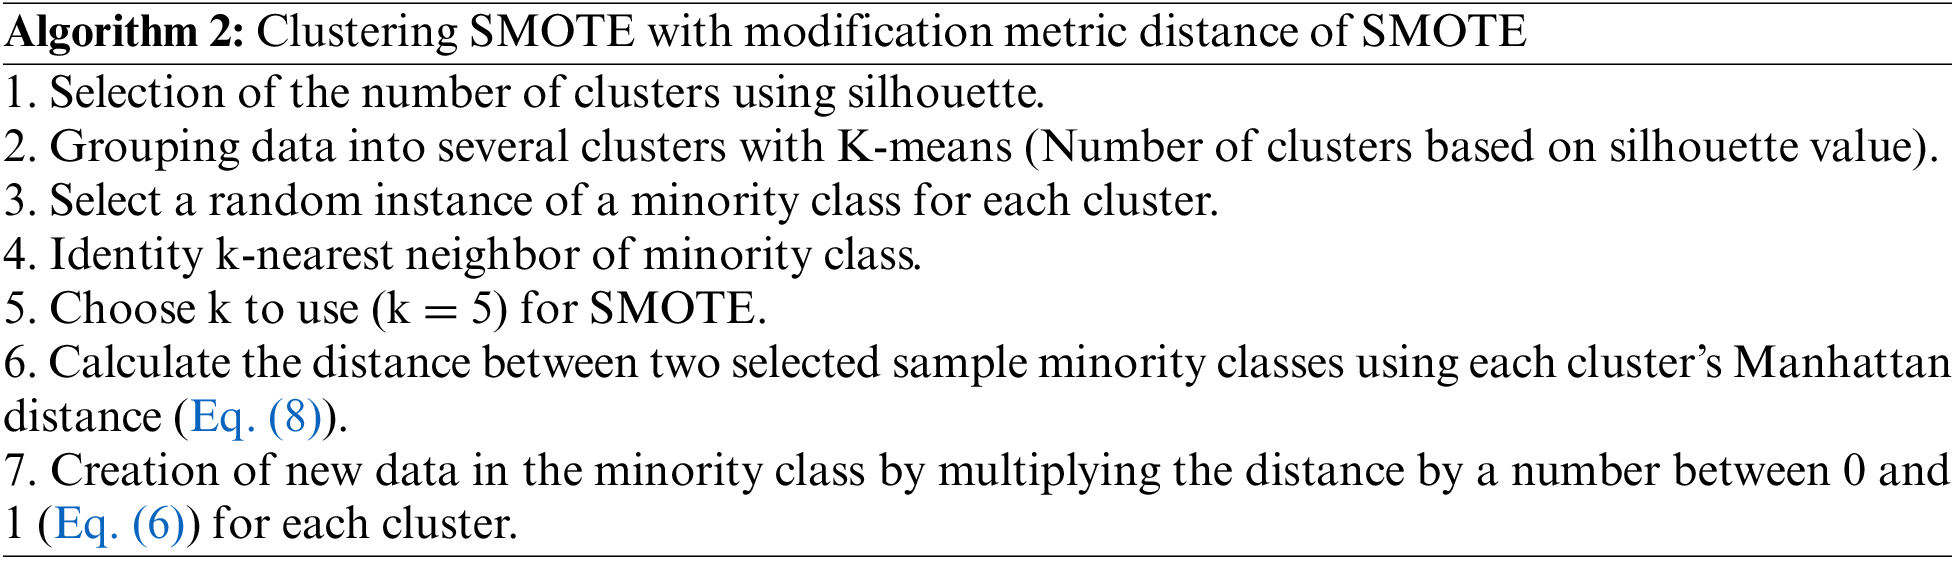
Algorithm 1 represents the Noise Reduction (NR) model, while Algorithm 2 represents the Clustering SMOTE model with modification metric distance of SMOTE.
Choosing the best k value in the K-means method is a difficult task. One way that can be used to select the best k value is the silhouette coefficient. This method measures the similarity of an object with its cluster(cohesion) compared to other clusters (separation). The steps in calculating the silhouette coefficient value [24]. The silhouette coefficient ranges from −1 to 1, and the higher the value, the better the clustering results. The silhouette coefficient value equals 1, meaning the number of clusters produced is perfect.
1. Calculate the average distance from one data to another in a cluster using the formula in Eq. (2).
where
2. Calculate the average distance from data i to all data in other clusters using the Eq. (3). Then, find the minimum average distance using Eq. (4).
Calculate the silhouette coefficient value using Eq. (5).
The value a(i) represents the density level of the cluster containing object i. A smaller value of a(i) indicates a denser cluster. Meanwhile, the value b(i) indicates how far object i distance from other clusters. A larger value of b(i) signifies that object i is farther away from other clusters.
where
where
The fourth step involves dividing the data into training and testing sets using 10-fold cross-validation. The performance of the classification method is evaluated using 10-fold cross-validation to validate each fold. The 10-fold cross-validation method divides the data into ten subsets, with each fold alternately serving as training and testing data. The k-fold cross-validation method is a popular technique for evaluating the performance of classification algorithms. This technique is generally considered to be able to improve model performance, especially on small data sets, and provide reliable accuracy estimates with relatively low variance [25]. The next process is implementing classification methods using Random Forest, SVM, and Naïve Bayes methods.
Random Forest is one part of a variety of decision trees that uses the concept of ensemble learning, namely bagging (bootstrap aggregating), which aims to divide the data into several decision trees. Then, each decision tree provides a prediction, and the majority decision is used as the final prediction using voting. Random forests can use the concepts of Gini and Information Gain in forming decision trees, the formulas for which are shown in Eqs. (9) and (10). Gini functions in forming decision trees, while Information Gain is used to select the best attributes in forming decision trees.
where p(i|t) is the proportion of samples from class i in node t.
where S is the dataset, A is the attribute in the dataset, Si is the number of cases in the i-partition.
SVM is a classification method that maximizes the margin on each class’s decision boundary to make it easy to predict (Eq. (11)). The SVM method can work on nonlinear data by utilizing several kernels.
where y is the class prediction, αi is the weight of each training sample, yi is the class label, xi is the training sample, x is the sample to be predicted, and b is the bias.
Naїve Bayes is a probabilistic method based on Bayes’ theorem with the assumption that the features used for classification are independent of each other. The Naïve Bayes formula used in classification is like Eq. (12).
where P(C∣X) is the probability of class C given feature X, P(X∣C) is the probability of feature X given class C, P(C) is the prior probability of class C, and P(X) is the prior probability X feature.
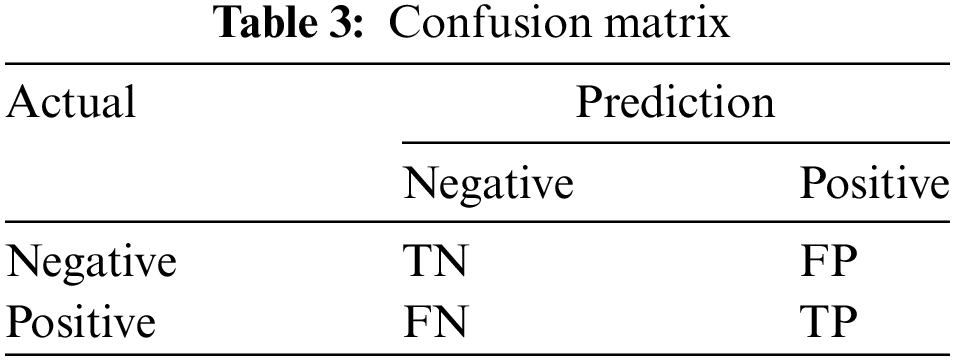
The final step is to evaluate the performance of the classification method. Performance evaluation utilizes a confusion matrix table. The confusion matrix table depicts the number of correct and incorrect classifications, as shown in Table 3 [26]. The formulas used to calculate accuracy is Eq. (13) [27], recall is Eq. (14) [28], F1-measure is Eq. (15), and AUC is Eq. (16) [29].
This study tests the proposed method using the Pima and Haberman datasets with different imbalance ratios. The Pima dataset contains 768 instances with 8 attributes, while the Haberman dataset has 306 instances with 3 attributes. In the Pima dataset, there are 268 instances of the minority class (Positive) and 500 instances of the majority class (Negative), resulting in an imbalance ratio of 1.87%. In the Haberman dataset, the majority class (class 1) consists of 225 instances, and the minority class (class 2) has 81 instances, leading to an imbalance ratio of 2.78%. Subsequently, scaling is performed to mitigate the impact of features with the highest value range compared to those with the lowest value range.
Subsequently, data balancing is carried out on both datasets (Pima and Haberman) using the proposed method, NR-Clustering SMOTE. The NR-Clustering SMOTE approach involves steps to balance the data namely the proposed method is called “NR-Clustering SMOTE,” which has several stages in balancing data: (1) filtering by removing minority classes close to majority classes (data noise) using the k-nn method; (2) clustering the data using K-means to establish decision boundaries by partitioning the data into several clusters; and (3) applying SMOTE oversampling with Manhattan distance to each cluster. The sampling process with NR-Clustering SMOTE on the Pima and Haberman datasets is illustrated in Fig. 4. The data balanced with the proposed method are then classified using Random Forest, SVM, and Naïve Bayes methods, with data training and testing initially separated using 10-fold cross-validation. The 10-fold cross-validation method divides the data into 10-fold. The classification results are measured based on Accuracy, Recall, F1-measure, and AUC obtained from the confusion matrix table.
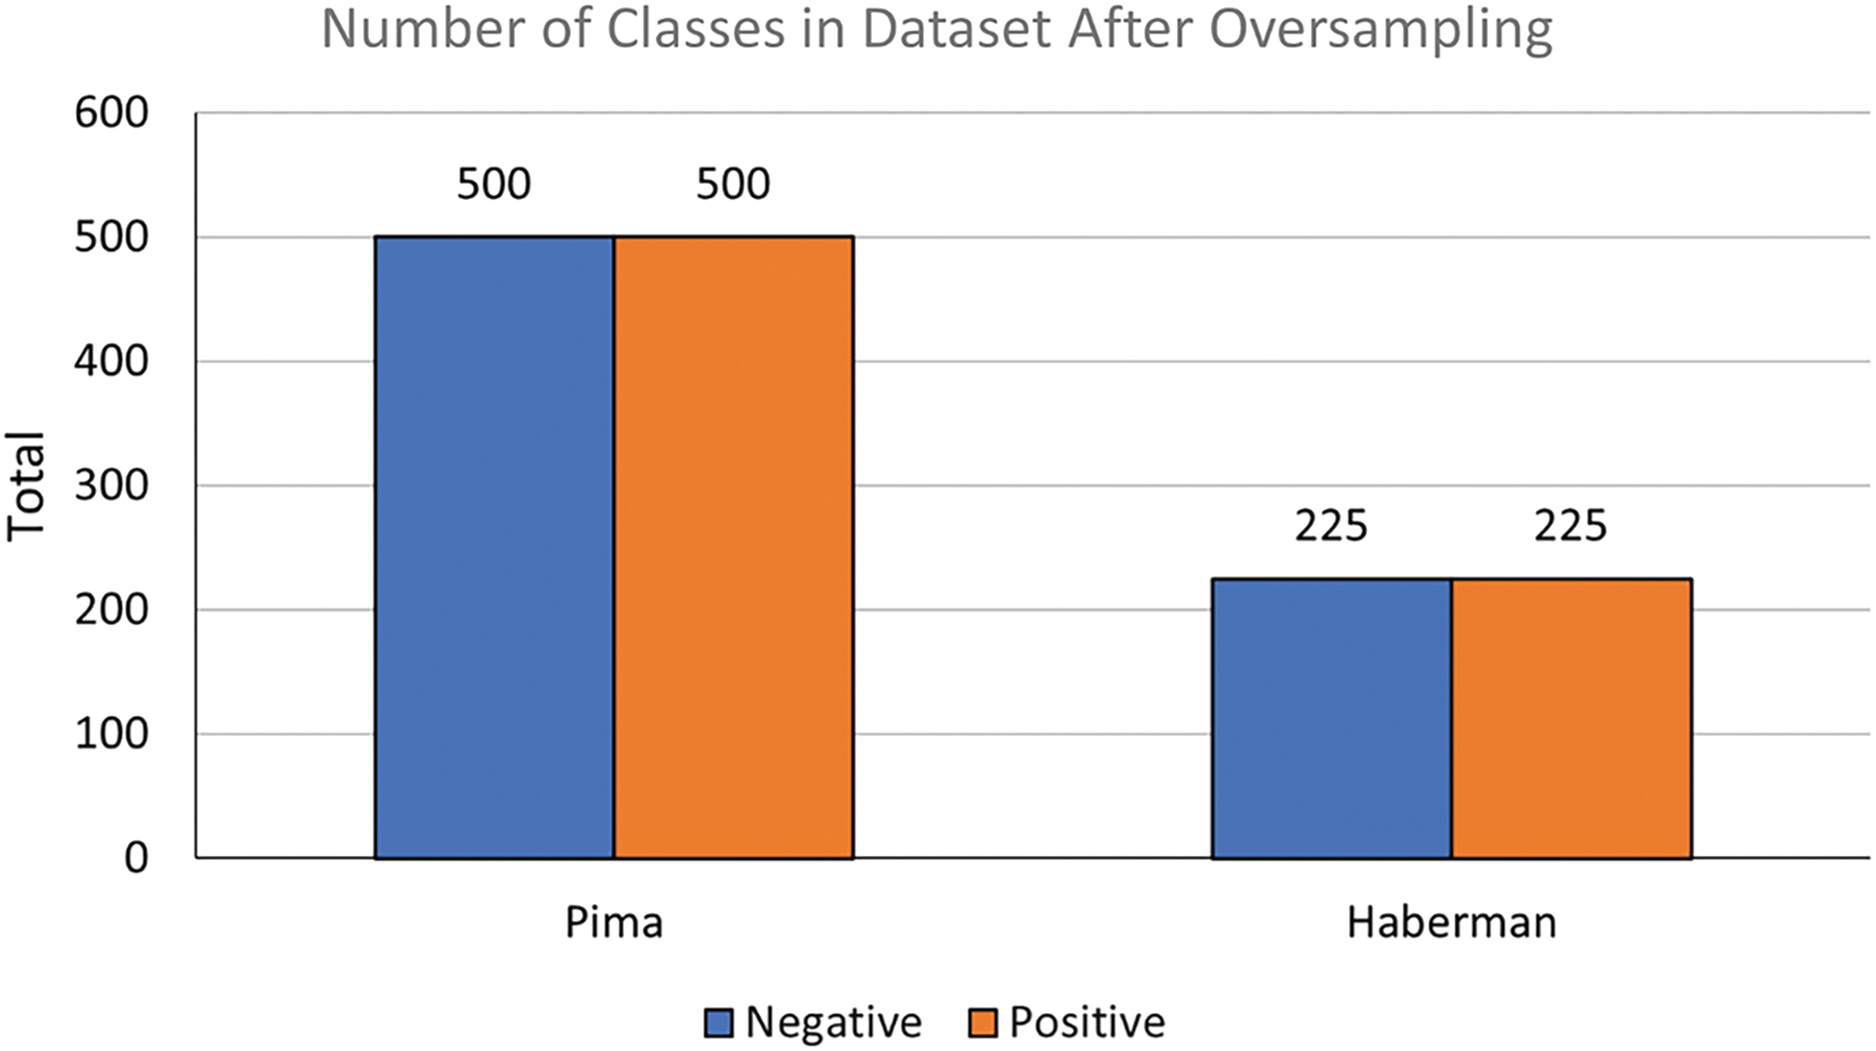
Figure 4: Number of classes in dataset after NR-Clustering SMOTE oversampling
Table 4 demonstrates that the Random Forest method without sampling (using the original data) accurately classified 431 instances of the negative class out of 500 instances and 155 instances of the positive class out of 268 instances in the Pima dataset. The Random Forest method with SMOTE accurately classified 392 instances of the negative class and 430 instances of the positive class out of 1000 instances in the Pima dataset. Using the proposed approach (NR-Clustering SMOTE), the Random Forest method accurately classified 439 instances of the negative class and 457 instances of the positive class out of 1000 instances in the Pima dataset. Table 5 reveals that the Random Forest method without sampling (using the original data) accurately classified 187 instances of class 1 out of 225 instances and 22 instances of class 2 out of 80 instances in the Haberman dataset. The Random Forest method with SMOTE accurately classified 121 instances of class 1 and 180 instances of class 2 out of 500 instances in the Haberman dataset. Using the proposed approach (NR-Clustering SMOTE), the Random Forest method accurately classified 185 instances of class 1 and 220 instances of class 2 out of 500 instances in the Pima dataset.
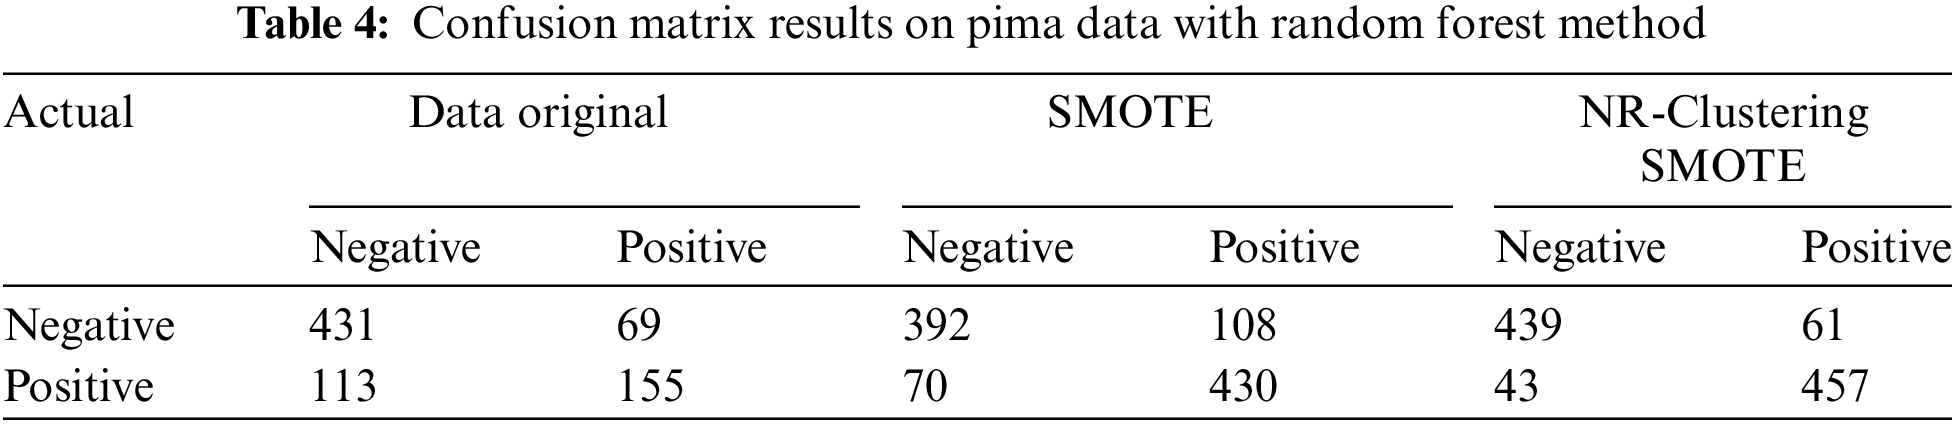
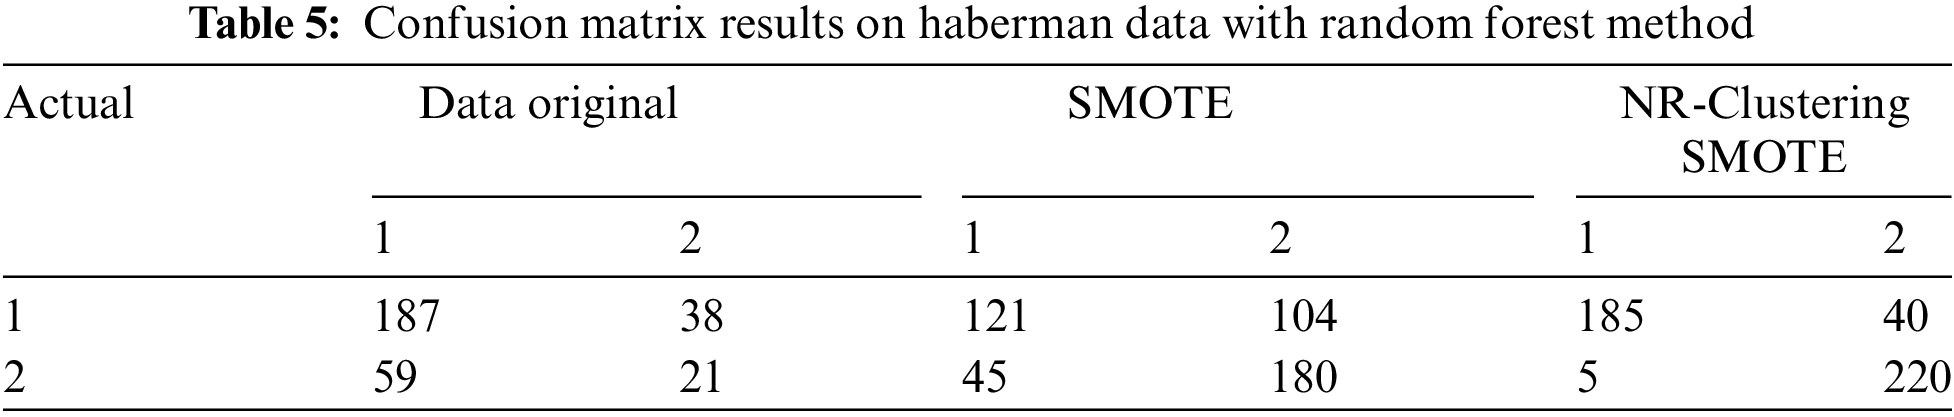
Table 6 indicates that the SVM method without sampling (using the original data) accurately classified 443 instances of the negative class out of 500 instances and 149 instances of the positive class out of 268 instances in the Pima dataset. The SVM method with SMOTE accurately classified 372 instances of the negative class and 383 instances of the positive class out of 1000 instances in the Pima dataset. The SVM method using the proposed approach (NR-Clustering SMOTE) accurately classified 419 instances of the negative class and 434 instances of the positive class out of 1000 instances in the Pima dataset. Table 7 reveals that the SVM method without sampling (using the original data) accurately classified 219 instances of class 1 out of 225 instances and 12 instances of class 2 out of 80 instances in the Haberman dataset. The SVM method with SMOTE accurately classified 142 instances of class 1 and 130 instances of class 2 out of 500 instances in the Haberman dataset. Lastly, the SVM method using the proposed approach (NR-Clustering SMOTE) accurately classified 188 class 1 and 173 instances of class 2 out of 500 instances in the Pima dataset.
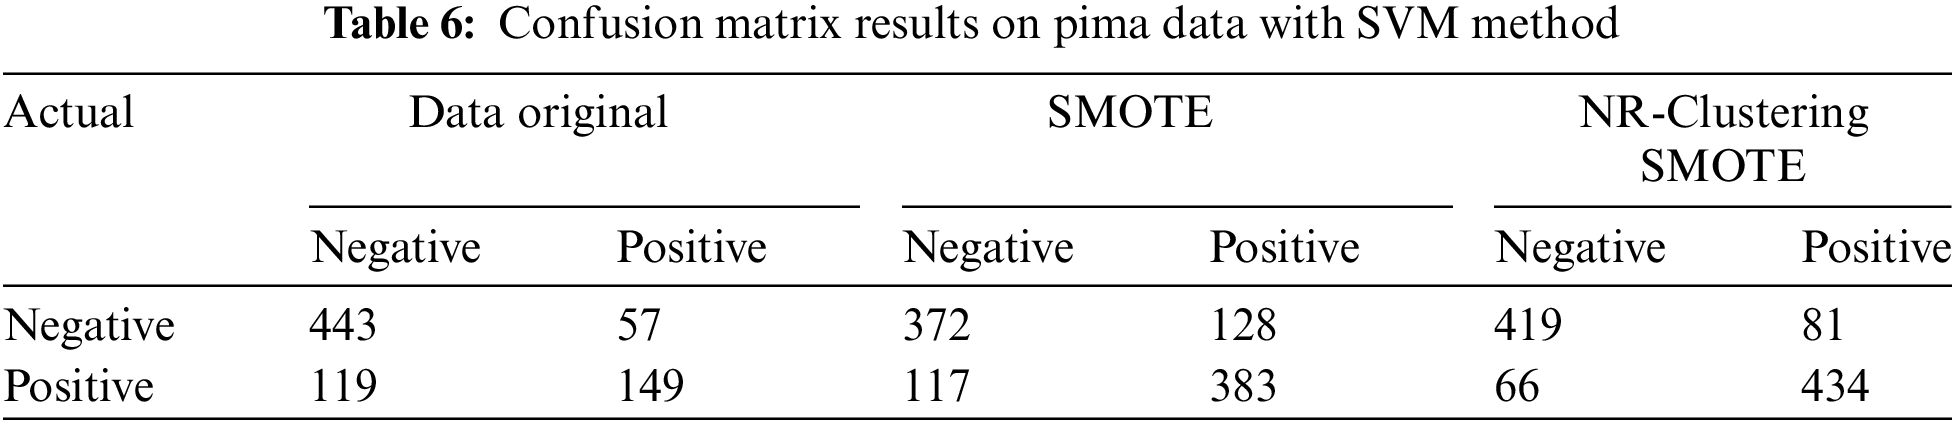
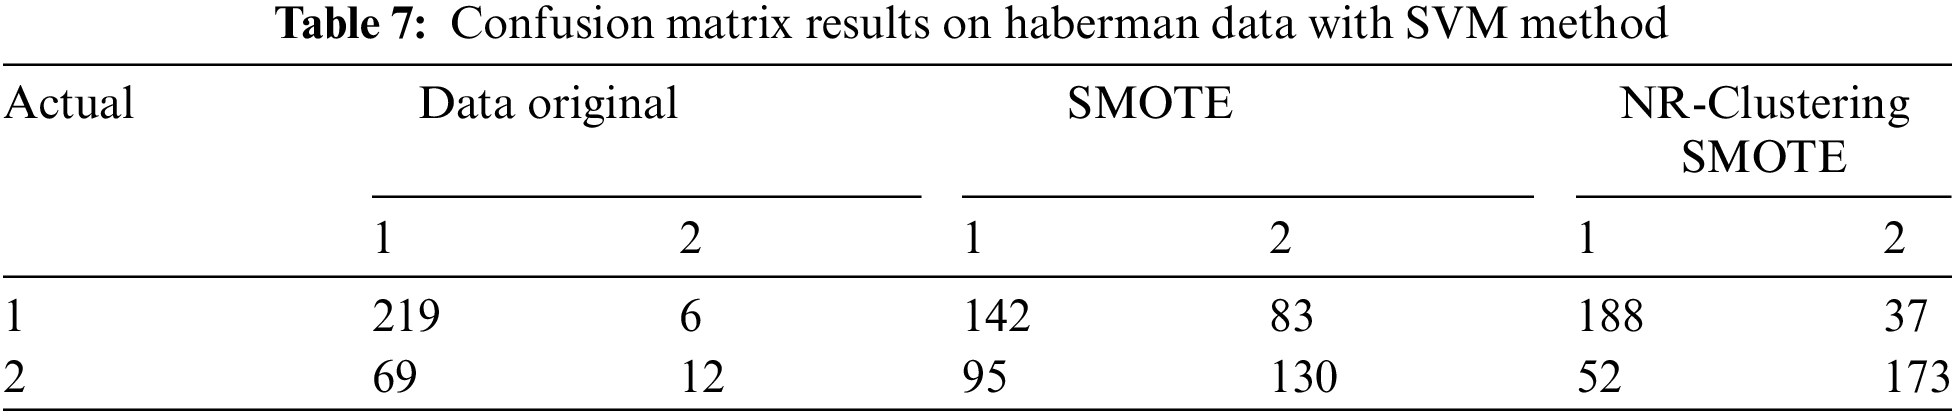
Table 8 shows that the Naïve Bayes method without sampling (using the original data) accurately classified 422 instances of the negative class from 500 instances and 159 instances of the positive class from 268 instances in the Pima dataset. The Naïve Bayes method with SMOTE accurately classified 392 instances of the negative class and 338 instances of the positive class from 1000 instances in the Pima dataset. The Naïve Bayes method using the proposed approach (NR-Clustering SMOTE) accurately classified 420 instances of the negative class and 402 instances of the positive class from 1000 instances in the Pima dataset. Table 9 indicates that the Naïve Bayes method without sampling (using the original data) accurately classified 213 instances of class 1 from 225 instances and 17 instances of class 2 from 80 instances in the Haberman dataset. The Naïve Bayes method with SMOTE accurately classified 170 instances of class 1 and 80 instances of class 2 from 500 instances in the Haberman dataset. Lastly, the Naïve Bayes method incorporating the proposed approach (NR-Clustering SMOTE) accurately classified 202 class 1 and 134 instances of class 2 from 500 instances in the Pima dataset.
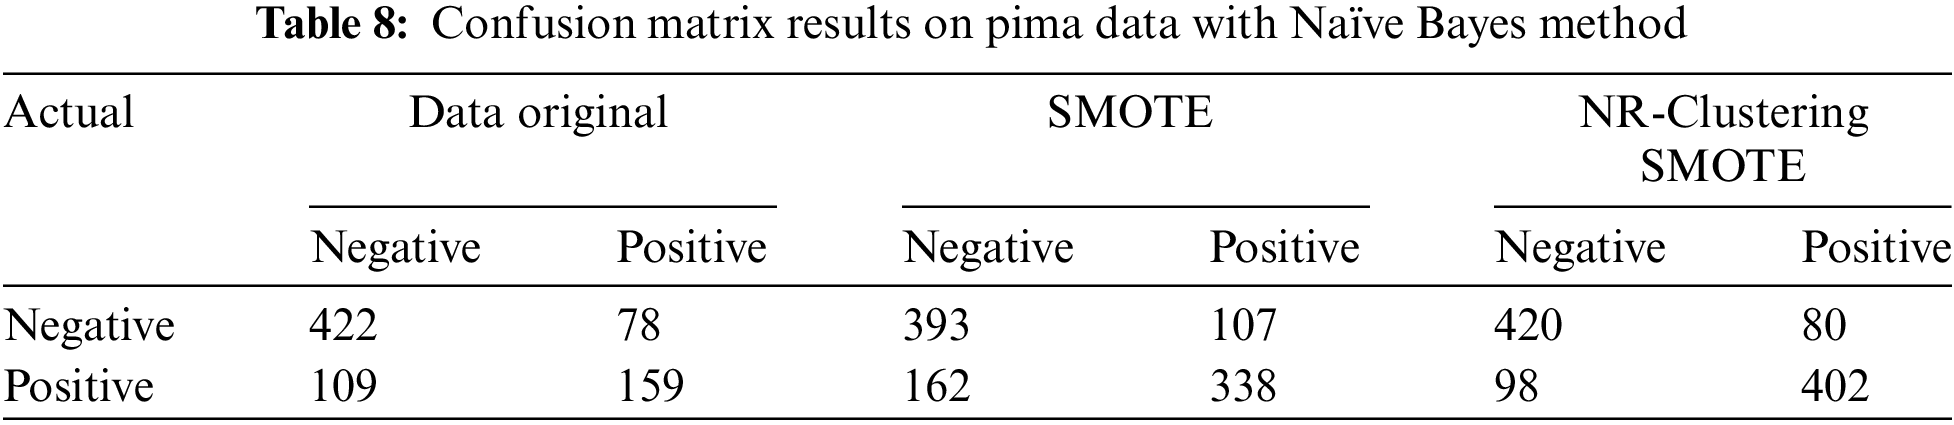
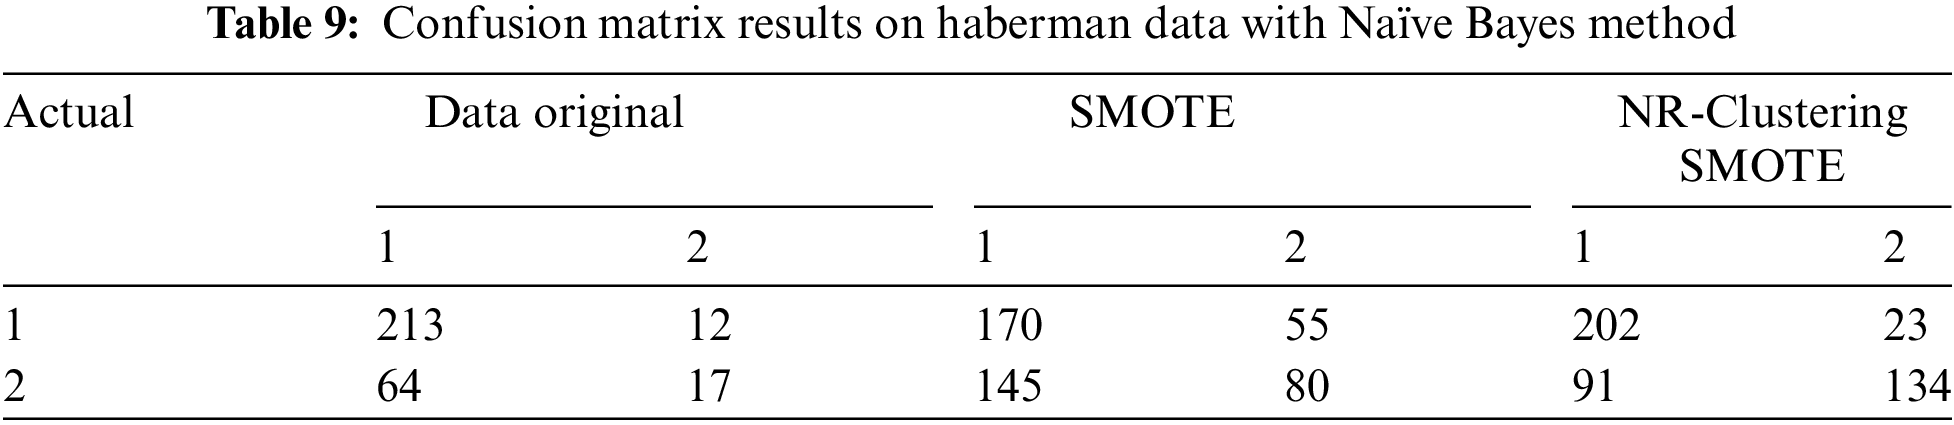
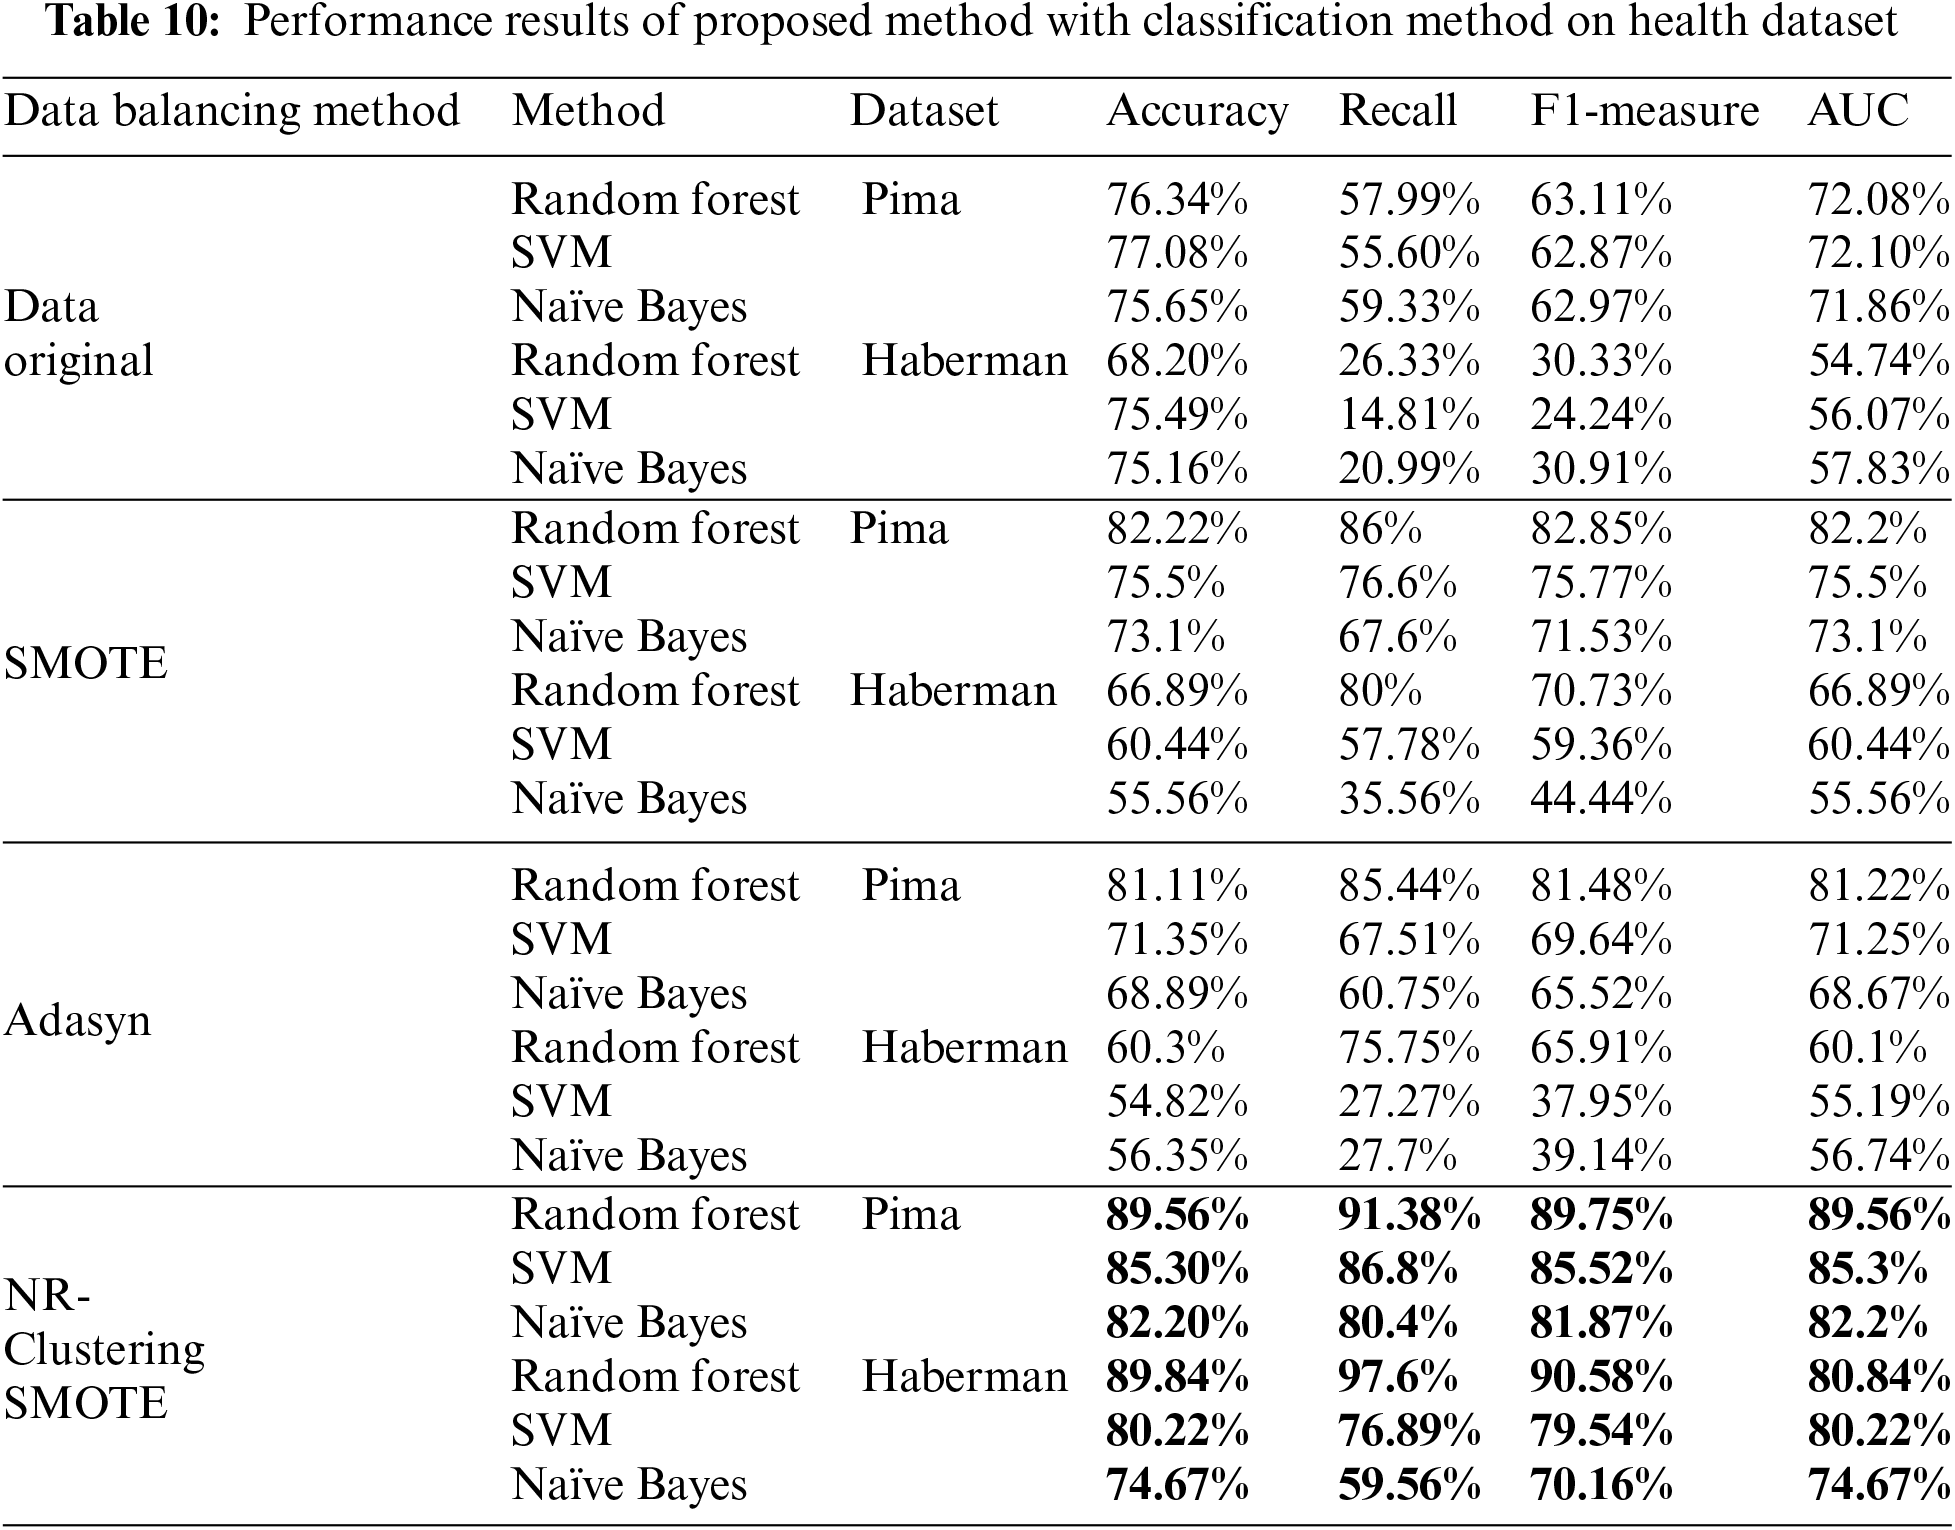
Table 10 compares data performance without oversampling, SMOTE and NR-Clustering SMOTE using Random Forest, SVM, and Naïve Bayes methods for classifying the Pima and Haberman datasets. NR-Clustering SMOTE demonstrates superior performance compared to the non-sampling, and SMOTE approaches across all evaluation metrics, such as accuracy, F1-measure, and AUC. Specifically, the NR-Clustering SMOTE method with Random Forest achieved an accuracy of 89.56%, an F1-measure of 89.75%, and an AUC of 89.56% on the Pima dataset, while on the Haberman dataset, the accuracy reached 89.84%, the F1-measure 90.58%, and the AUC 89.84%. Similarly, NR-Clustering SMOTE with the SVM method attained an accuracy of 85.30%, an F1-measure of 85.52%, an AUC of 85.30% on the Pima dataset, and an accuracy of 80.22%, an F1-measure of 79.54%, and an AUC of 80.22% on the Haberman dataset. On average, NR-Clustering SMOTE with Random Forest demonstrated the best performance on both the Pima and Haberman datasets compared to the SVM and Naïve Bayes methods. This indicates that NR-Clustering SMOTE can enhance the classification capabilities of the methods in classifying the Pima and Haberman data more effectively while reducing noise and overlap at the decision boundaries that could interfere with the learning process.
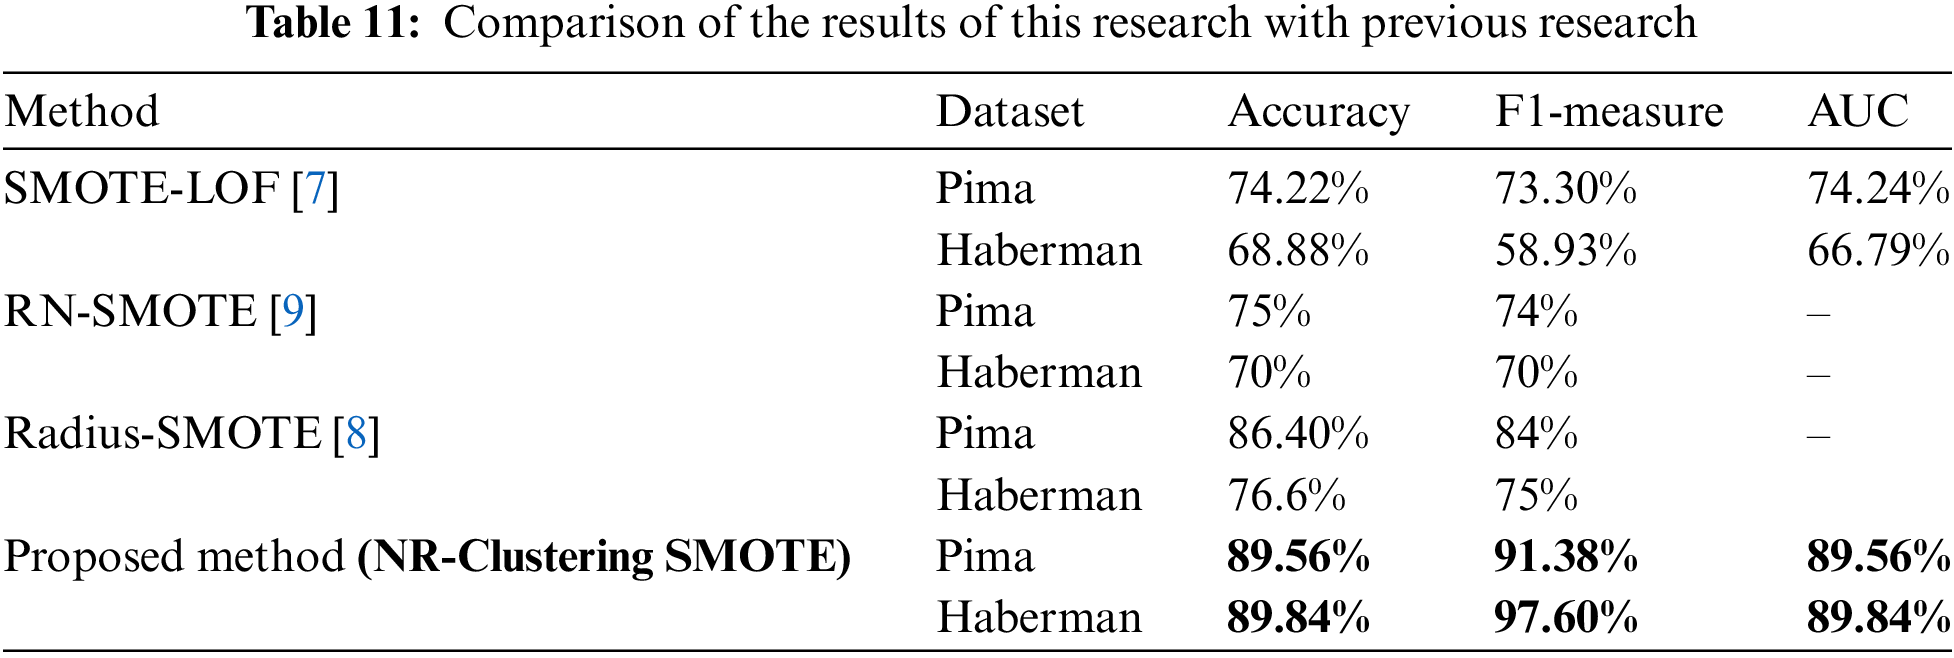
The proposed NR-Clustering SMOTE method aims to address the weaknesses of SMOTE by combining filtering, clustering, and distance adjustment techniques using the Manhattan metric. NR-Clustering SMOTE with Manhattan can be an effective solution for handling dataset imbalance by reducing noise and overlap. The use of NR, which removes data that is considered noise before applying SMOTE, has a positive impact on overcoming data imbalance [4]. Clustering establishes decision boundaries by partitioning data into clusters, allowing SMOTE with modified distance metrics to generate minority class data within each cluster. The clustering method approach in SMOTE can minimize the overlap of artificial minority data, which is potential noise [30]. In recent years, various developments of SMOTE have been introduced, such as LOF-SMOTE [7], Radius-SMOTE [8], and RN-SMOTE [9] on the same dataset. Table 11 shows that the NR-Clustering SMOTE method increases accuracy by 15.34% on the Pima dataset and by 20.96% on the Haberman dataset compared to SMOTE-LOF [7]. Compared to Radius-SMOTE [8], this method improves accuracy by 3.16% on the Pima dataset and 13.24% on the Haberman dataset. Meanwhile, compared to RN-SMOTE [9], the accuracy improvement achieved is 14.56% on the Pima dataset and 19.84% on the Haberman dataset.
The proposed method exhibits superior performance across all classification methods compared to several SMOTE modifications, such as SMOTE-LOF [7], Radius-SMOTE [8], and RN-SMOTE [9]. The performance enhancement of NR-Clustering SMOTE is attributed to removing noise, clustering data using K-means to establish decision boundaries, and subsequently performing oversampling with SMOTE that employs a modified Manhattan distance. Eliminating minority classes identified as noise before applying Clustering SMOTE aids this method in reducing the noise produced, thereby improving classification outcomes [9,31]. Furthermore, using K-means clustering to establish decision boundaries across multiple clusters can reduce overlap [32]. Modifying the Manhattan distance in SMOTE for balancing minority classes also minimizes the risk of noise arising from overlapping minority classes within each cluster. Not only that, the selection of the Manhattan distance metric in SMOTE is due to its capability to work in high-dimensional data [16]. Moreover, Manhattan distance outperforms Euclidean distance when applied in SMOTE.
There are several limitations of the NR-Clustering SMOTE method that can be further explored in future research: (1) the proposed method is currently only applied to binary class cases, suggesting that future studies could be developed to address multi-class data; (2) this research has not resolved the issue of small disjuncts within the minority class, indicating that subsequent studies should aim to tackle this challenge.
This study proposes the NR-Clustering SMOTE method to address the problem of data imbalance in the health field. The health datasets used in testing this method are Pima and Haberman, each of which has a different level of imbalance ratio. The NR-Clustering SMOTE method has stages in data balancing, namely: (1) filtering by removing minority classes close to majority classes (data noise) using the k-nn method; (2) clustering data with clustering (K-means), which aims to form decision boundaries by partitioning data into several clusters; (3) applying SMOTE oversampling with Manhattan distance to each cluster. Overall, the NR-Clustering SMOTE method performed better on all evaluation metrics than the traditional SMOTE method in all classification methods. The proposed NR-Clustering SMOTE method improved accuracy by 15.34% on the Pima dataset and 20.96% on the Haberman dataset compared to LOF-SMOTE. Compared to Radius-SMOTE, this method improves accuracy by 3.16% on the Pima dataset and 13.24% on the Haberman dataset. Meanwhile, compared to RN-SMOTE, the accuracy improvement obtained reached 15.56% on the Pima dataset and 19.84% on the Haberman dataset.
Future research can solve the small disjuncts problem using a cluster approach by observing the density of each cluster and the sparsity of data in the cluster. Understanding how dense or sparse the data in each cluster is can determine the amount of synthetic data needed to be added. This approach ensures that the synthetic data samples are appropriately distributed to each cluster, thus balancing data distribution within the minority class and addressing the within-class imbalance. Not only that, further research can extend the NR-Clustering SMOTE to multi-class imbalances or explore its integration with deep learning frameworks for large-scale health data analytics.
Acknowledgement: Thanks to Universitas Negeri Malang supported this research in a dissertation research scheme.
Funding Statement: This research was funded by Universitas Negeri Malang, contract number 4.4.841/UN32.14.1/LT/2024.
Author Contributions: Conceptualization, Hairani Hairani, and Triyanna Widiyaningtyas; methodology, Hairani Hairani; software, Hairani Hairani; validation, Triyanna Widiyaningtyas, and Didik Dwi Prasetya; formal analysis, Hairani Hairani, Triyanna Widiyaningtyas, and Didik Dwi Prasetya; investigation, Hairani Hairani, Triyanna Widiyaningtyas, and Didik Dwi Prasetya; writing—original draft preparation, Hairani Hairani; writing—review and editing, Triyanna Widiyaningtyas, Didik Dwi Prasetya, and Afrig Aminuddin; visualization, Hairani Hairani; supervision, Triyanna Widiyaningtyas, and Didik Dwi Prasetya. All authors reviewed the results and approved the final version of the manuscript.
Availability of Data and Materials: The data that support the findings of this study are openly available in (Kaggle) at https://www.kaggle.com/datasets/uciml/pima-indians-diabetes-database (accessed on 03 December 2024) for Pima and at https://www.kaggle.com/datasets/gilsousa/habermans-survival-data-set (accessed on 03 December 2024) for Haberman. The code can be seen in (Github) at https://github.com/Hairani10/NR-Clustering-SMOTE/blob/main/NR-Clustering%20SMOTE.ipynb (accessed on 03 December 2024).
Ethics Approval: Not applicable.
Conflicts of Interest: The authors declare no conflicts of interest to report regarding the present study.
References
1. N. V. Chawla, K. W. Bowyer, and L. O. Hall, “SMOTE: Synthetic minority over-sampling technique,” J. Artif. Intell. Res., vol. 16, pp. 341–378, 2002. doi: 10.1613/jair.953. [Google Scholar] [CrossRef]
2. D. Elreedy, A. F. Atiya, and F. Kamalov, “A theoretical distribution analysis of synthetic minority oversampling technique (SMOTE) for imbalanced learning,” Mach. Learn., vol. 113, no. 7, pp. 4903–4923, 2024. doi: 10.1007/s10994-022-06296-4. [Google Scholar] [CrossRef]
3. T. Fahrudin, J. L. Buliali, and C. Fatichah, “Enhancing the performance of smote algorithm by using attribute weighting scheme and new selective sampling method for imbalanced data set,” Int. J. Innov. Comput. Inform. Cont., vol. 15, no. 2, pp. 423–444, Apr. 2019. doi: 10.24507/ijicic.15.02.423. [Google Scholar] [CrossRef]
4. H. Hairani, T. Widiyaningtyas, and D. Dwi Prasetya, “Addressing class imbalance of health data: A systematic literature review on modified synthetic minority oversampling technique (SMOTE) strategies,” JOIV: Int. J. Inform. Visual., vol. 8, no. 3, pp. 1310–1318, 2024. doi: 10.62527/joiv.8.3.2283. [Google Scholar] [CrossRef]
5. A. S. Hussein, T. Li, C. W. Yohannese, and K. Bashir, “A-SMOTE: A new preprocessing approach for highly imbalanced datasets by improving SMOTE,” Int. J. Comput. Intell. Syst., vol. 12, no. 2, pp. 1–11, 2019. doi: 10.2991/ijcis.d.191114.002. [Google Scholar] [CrossRef]
6. J. A. Sáez, J. Luengo, J. Stefanowski, and F. Herrera, “SMOTE–IPF: Addressing the noisy and borderline examples problem in imbalanced classification by a re-sampling method with filtering,” Inf. Sci., vol. 291, pp. 184–203, Jan. 2015. doi: 10.1016/j.ins.2014.08.051. [Google Scholar] [CrossRef]
7. A. Asniar, N. U. Maulidevi, and K. Surendro, “SMOTE-LOF for noise identification in imbalanced data classification,” J. King Saud Univ.-Comput. Inf. Sci., vol. 34, no. 6, pp. 3413–3423, Jun. 2022. doi: 10.1016/j.jksuci.2021.01.014. [Google Scholar] [CrossRef]
8. G. A. Pradipta, R. Wardoyo, A. Musdholifah, and I. N. H. Sanjaya, “Radius-SMOTE: A new oversampling technique of minority samples based on radius distance for learning from imbalanced data,” IEEE Access, vol. 9, pp. 74763–74777, 2021. doi: 10.1109/ACCESS.2021.3080316. [Google Scholar] [CrossRef]
9. A. Arafa, N. El-Fishawy, M. Badawy, and M. Radad, “RN-SMOTE: Reduced noise SMOTE based on DBSCAN for enhancing imbalanced data classification,” J. King Saud Univ.-Comput. Inf. Sci., vol. 34, no. 8, pp. 5059–5074, Jan. 2022. doi: 10.1016/j.jksuci.2022.06.005. [Google Scholar] [CrossRef]
10. Q. Dai, J. Wei Liu, and J. L. Zhao, “Distance-based arranging oversampling technique for imbalanced data,” Neural Comput. Appl., vol. 35, no. 2, pp. 1323–1342, 2023. doi: 10.1007/s00521-022-07828-8. [Google Scholar] [CrossRef]
11. S. Feng, J. Keung, P. Zhang, Y. Xiao, and M. Zhang, “The impact of the distance metric and measure on SMOTE-based techniques in software defect prediction,” Inf. Softw Technol., vol. 142, 2022, Art. no. 106742. doi: 10.1016/j.infsof.2021.106742. [Google Scholar] [CrossRef]
12. A. Balakrishnan, J. Medikonda, P. K. Namboothiri, and M. Natarajan, “Mahalanobis metric-based oversampling technique for parkinson’s disease severity assessment using spatiotemporal gait parameters,” Biomed. Signal Process. Control, vol. 86, 2023, Art. no. 105057. doi: 10.1016/j.bspc.2023.105057. [Google Scholar] [CrossRef]
13. H. Hairani, T. Widiyaningtyas, and D. D. Prasetya, “Feature selection and hybrid sampling with machine learning methods for health data classification,” Revue d’Intelligence Artificielle, vol. 38, no. 4, pp. 1255–1261, 2024. doi: 10.18280/ria.380419. [Google Scholar] [CrossRef]
14. P. Zhao et al., “DiGAN Breakthrough: Advancing diabetic data analysis with innovative GAN-based imbalance correction techniques,” Comput. Meth. Prog. Biomed. Update, vol. 5, no. 5, pp. 1–18, Jan. 2024. doi: 10.1016/j.cmpbup.2024.100152. [Google Scholar] [CrossRef]
15. E. Blanco-Mallo, L. Morán-Fernández, B. Remeseiro, and V. Bolón-Canedo, “Do all roads lead to Rome? Studying distance measures in the context of machine learning,” Pattern Recognit., vol. 141, no. 12, pp. 1–15, Sep. 2023. doi: 10.1016/j.patcog.2023.109646. [Google Scholar] [CrossRef]
16. S. Maldonado, J. López, and C. Vairetti, “An alternative SMOTE oversampling strategy for high-dimensional datasets,” Appli. Soft Comput. J., vol. 76, no. 2, pp. 380–389, Mar. 2019. doi: 10.1016/j.asoc.2018.12.024. [Google Scholar] [CrossRef]
17. K. Napierala and J. Stefanowski, “Types of minority class examples and their influence on learning classifiers from imbalanced data,” J. Intell. Inf. Syst., vol. 46, no. 3, pp. 563–597, Jun. 2016. doi: 10.1007/s10844-015-0368-1. [Google Scholar] [CrossRef]
18. I. H. Sarker, “Machine learning: Algorithms, real-world applications and research directions,” SN Comput. Sci., vol. 2, no. 3, May 2021, Art. no. 160. doi: 10.1007/s42979-021-00592-x. [Google Scholar] [PubMed] [CrossRef]
19. P. K. Jadwal, S. Jain, S. Pathak, and B. Agarwal, “Improved resampling algorithm through a modified oversampling approach based on spectral clustering and SMOTE,” Microsyst. Technol., vol. 28, no. 12, pp. 2669–2677, 2022. doi: 10.1007/s00542-022-05287-8. [Google Scholar] [CrossRef]
20. Z. Xu, D. Shen, T. Nie, Y. Kou, N. Yin and X. Han, “A cluster-based oversampling algorithm combining SMOTE and k-means for imbalanced medical data,” Inf. Sci., vol. 572, no. 2, pp. 574–589, Sep. 2021. doi: 10.1016/j.ins.2021.02.056. [Google Scholar] [CrossRef]
21. J. Fonseca, G. Douzas, and F. Bacao, “Improving imbalanced land cover classification with k-means SMOTE: Detecting and oversampling distinctive minority spectral signatures,” Information, vol. 12, no. 7, pp. 1–20, 2021. doi: 10.3390/info12070266. [Google Scholar] [CrossRef]
22. C. Guo, Y. Ma, Z. Xu, M. Cao, and Q. Yao, “An improved oversampling method for imbalanced Data-SMOTE based on canopy and K-means,” in Proc. 2019 Chinese Automat. Congr. CAC 2019, 2019, pp. 1467–1469. doi: 10.1109/CAC48633.2019.8997367. [Google Scholar] [CrossRef]
23. A. M. Ikotun, A. E. Ezugwu, L. Abualigah, B. Abuhaija, and J. Heming, “K-means clustering algorithms: A comprehensive review, variants analysis, and advances in the era of big data,” Inf. Sci., vol. 622, no. 11, pp. 178–210, Apr. 2023. doi: 10.1016/j.ins.2022.11.139. [Google Scholar] [CrossRef]
24. T. Widiyaningtyas, I. Hidayah, and T. B. Adji, “Recommendation algorithm using clustering-based UPCSim (CB-UPCSim),” Computers, vol. 10, no. 10, pp. 1–17, Oct. 2021. doi: 10.3390/computers10100123. [Google Scholar] [CrossRef]
25. T. -T. Wong and P. -Y. Yeh, “Reliable accuracy estimates from K-fold cross validation,” IEEE Trans. Knowl. Data Eng., vol. 32, no. 8, pp. 1586–1594, Aug. 2020. doi: 10.1109/TKDE.2019.2912815. [Google Scholar] [CrossRef]
26. H. Hartono and E. Ongko, “Avoiding overfitting dan overlapping in handling class imbalanced using hybrid approach with smoothed bootstrap resampling and feature selection,” Int. J. Inform. Visual., vol. 6, no. 2, pp. 343–348, 2022. doi: 10.30630/joiv.6.2.985. [Google Scholar] [CrossRef]
27. I. Saifudin and T. Widiyaningtyas, “Systematic literature review on recommender system: Approach, problem, evaluation techniques datasets,” IEEE Access, vol. 12, no. 3, pp. 19827–19847, 2024. doi: 10.1109/ACCESS.2024.3359274. [Google Scholar] [CrossRef]
28. D. Sucipto, D. Prasetya, and T. Widiyaningtyas, “A review questions classification based on BLOOM taxonomy using a data mining approach,” J. Eng. Technol. Indust. Appl., vol. 10, no. 48, pp. 162–171, Jul. 2024. doi: 10.5935/jetia.v10i48.1204. [Google Scholar] [CrossRef]
29. Z. Farou, M. Aharrat, and T. Horváth, “A comparative study of assessment metrics for imbalanced learning,” in New Trends in Database and Information Systems. Cham: Springer, 2023, vol. 1, pp. 119–129. doi: 10.1007/978-3-031-42941-5_11. [Google Scholar] [CrossRef]
30. E. Elyan, C. F. Moreno-Garcia, and C. Jayne, “CDSMOTE: Class decomposition and synthetic minority class oversampling technique for imbalanced-data classification,” Neural Comput. Appl., vol. 33, no. 7, pp. 2839–2851, 2021. doi: 10.1007/s00521-020-05130-z. [Google Scholar] [CrossRef]
31. N. A. Firdausanti, I. Mendonça, and M. Aritsugi, “Noise-free sampling with majority framework for an imbalanced classification problem,” Knowl. Inf. Syst., vol. 66, pp. 4011–4042. doi: 10.1007/s10115-024-02079-6. [Google Scholar] [CrossRef]
32. N. A. Azhar, M. S. Mohd Pozi, A. Mohamed Din, and A. Jatowt, “An investigation of SMOTE based methods for imbalanced datasets with data complexity analysis,” IEEE Trans. Knowl. Data Eng., vol. 35, no. 7, pp. 6651–6672, 2023. doi: 10.1109/TKDE.2022.3179381. [Google Scholar] [CrossRef]
Cite This Article
 Copyright © 2025 The Author(s). Published by Tech Science Press.
This work is licensed under a Creative Commons Attribution 4.0 International License , which permits unrestricted use, distribution, and reproduction in any medium, provided the original work is properly cited.
 Downloads
 Citation Tools