
 Submit a Paper
 Propose a Special lssue
 Open Access
ARTICLE
YOLO-SIFD: YOLO with Sliced Inference and Fractal Dimension Analysis for Improved Fire and Smoke Detection
1 Artificial Intelligence Railroad Research Department, Korea Railroad Research Institute (KRRI), Uiwang, 16105, Republic of Korea
2 Transportation System Engineering, University of Science and Technology (UST), Daejeon, 34113, Republic of Korea
* Corresponding Author: Jong-Un Won. Email:
Computers, Materials & Continua 2025, 82(3), 5343-5361. https://doi.org/10.32604/cmc.2025.061466
Received 25 November 2024; Accepted 09 January 2025; Issue published 06 March 2025
 View Full Text
 Download PDF
Abstract
Fire detection has held stringent importance in computer vision for over half a century. The development of early fire detection strategies is pivotal to the realization of safe and smart cities, inhabitable in the future. However, the development of optimal fire and smoke detection models is hindered by limitations like publicly available datasets, lack of diversity, and class imbalance. In this work, we explore the possible ways forward to overcome these challenges posed by available datasets. We study the impact of a class-balanced dataset to improve the fire detection capability of state-of-the-art (SOTA) vision-based models and propose the use of generative models for data augmentation, as a future work direction. First, a comparative analysis of two prominent object detection architectures, You Only Look Once version 7 (YOLOv7) and YOLOv8 has been carried out using a balanced dataset, where both models have been evaluated across various evaluation metrics including precision, recall, and mean Average Precision (mAP). The results are compared to other recent fire detection models, highlighting the superior performance and efficiency of the proposed YOLOv8 architecture as trained on our balanced dataset. Next, a fractal dimension analysis gives a deeper insight into the repetition of patterns in fire, and the effectiveness of the results has been demonstrated by a windowing-based inference approach. The proposed Slicing-Aided Hyper Inference (SAHI) improves the fire and smoke detection capability of YOLOv8 for real-life applications with a significantly improved mAP performance over a strict confidence threshold. YOLOv8 with SAHI inference gives a mAP:50-95 improvement of more than 25% compared to the base YOLOv8 model. The study also provides insights into future work direction by exploring the potential of generative models like deep convolutional generative adversarial network (DCGAN) and diffusion models like stable diffusion, for data augmentation.Keywords
Fire incidents endanger both humans and wildlife and cause significant environmental and monetary damage. With increasing urbanization, infrastructural diversity, and deforestation, technological collaboration is pivotal to developing advanced fire-proof systems in consolidated engineering pipelines. Early fire detection and damage control strategies are critical to sustain a world inhabitable by humans and wildlife alike, and for the realization of smart cities, infrastructure maintenance, and mitigating the adversities of global warming.
Among the myriad scientific efforts leading to fire threat mitigation include sensor-based fire detection systems. A hydrogen sensor with a microheater to sense hydrogen generated by fire [1] was proposed to detect smoldering fire. Multiple sensor-equipped mobile robots using ultrasonic, line, and flame sensors [2] have been designed to ensure the stable maneuverability of fire-detecting robots. Systems integrating sensing technologies into the Internet of Things (IoT) are the most viable option due to rapid deployability [3].
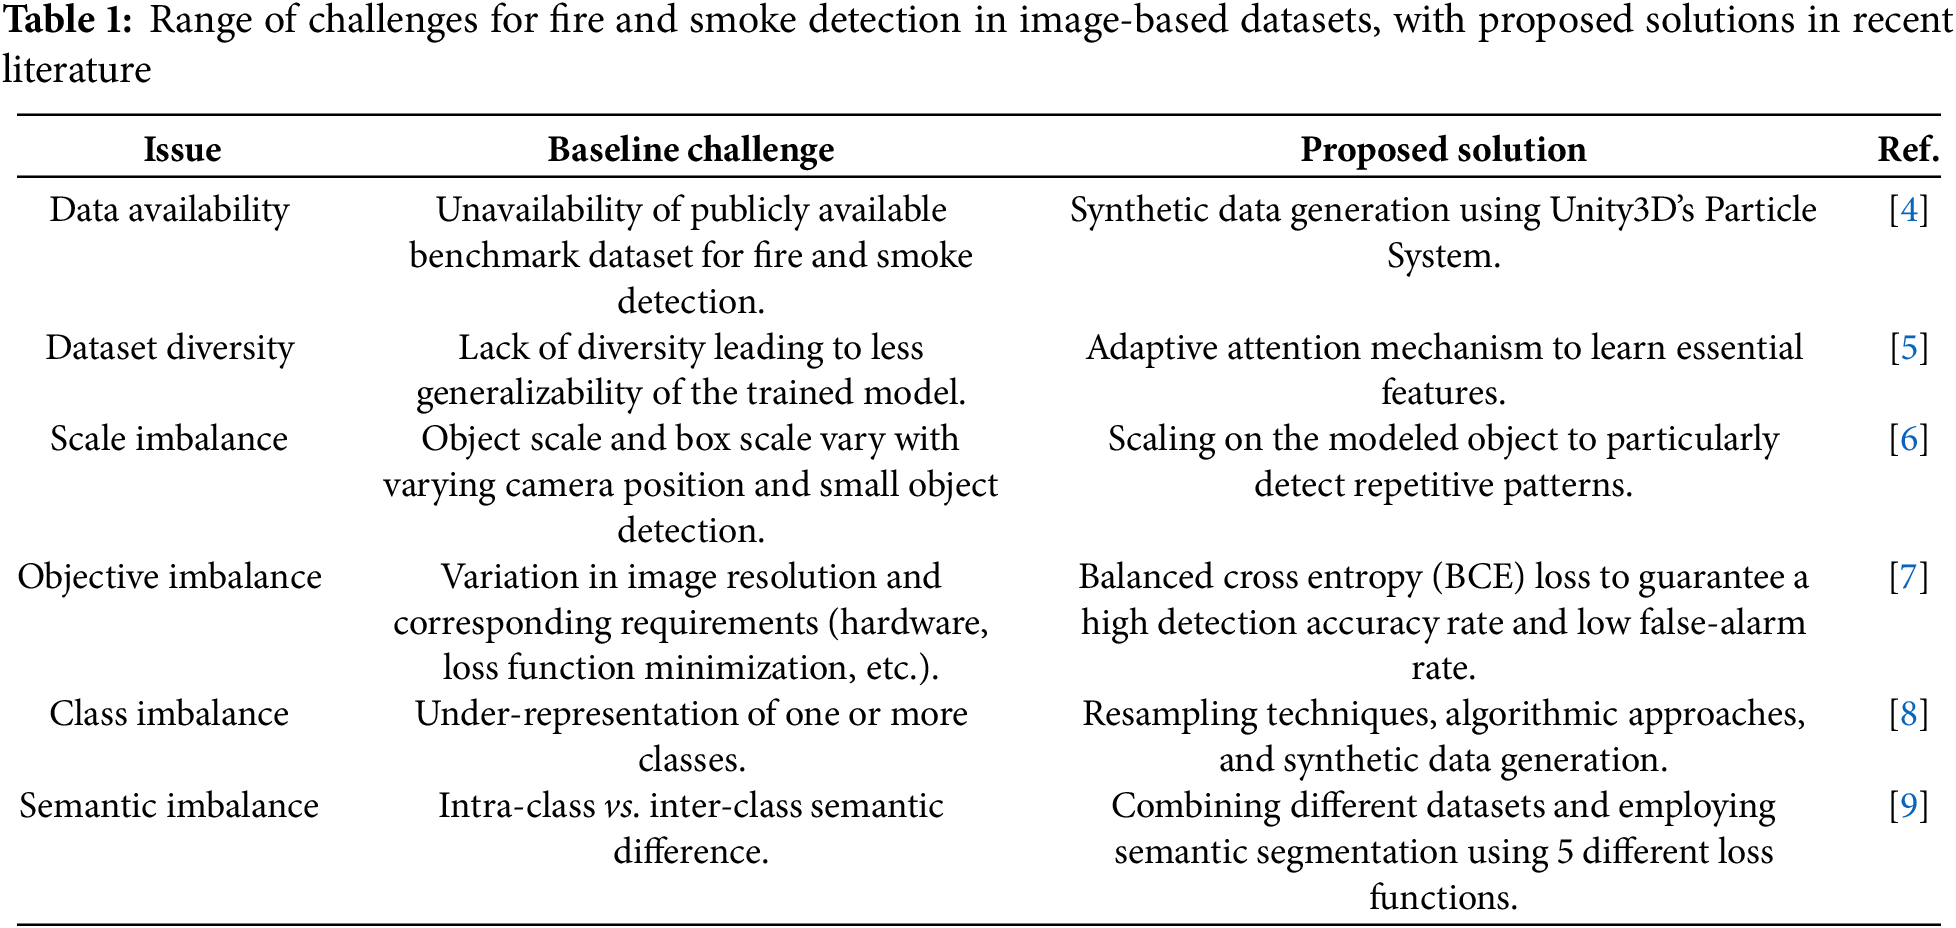
In the past several years, with the advent of object detection capability in vision-based systems, fire detection has held significant attention from the research community. Vision-based systems are trained on an extensive amount of data, enabling them to make subsequent detections and predictions. However, one of the primary challenges for efficient vision-based fire and smoke detection system design is the scarcity of publicly available benchmark datasets. The range of challenges that come with the currently available datasets have been summarized in Table 1.
In this study, our motivation is to design a fire and smoke detector with high accuracy that has the potential to be applied to real-time processing on board in the future. We can summarize the contributions presented in this work as follows:
1. Using a class-balanced dataset, we propose a light-weight deep learning-based smoke and fire detection approach using the you only look once (YOLO) version 8 model with Slicing-Aided Hyper Inference (SAHI) to improve the model’s detection capability, especially for small fires. To the best of our knowledge, YOLOv8 has not yet been used with SAHI to analyze the fire detection capability of YOLOv8 model.
2. We perform fractal dimension analysis to study the spatial arrangement of fire and smoke to get insights into patterns, density, and severity of fire outbreaks to establish the groundwork for SAHI.
3. We give a comprehensive future work direction for data augmentation using generative adversarial networks (GANs) and diffusion models.
4. From our rigorous experimentation, we show that the key to improving detection performance and alleviating the problems of insufficient feature representation and background confusion lies in feature enhancement and fusion, which we achieve through SAHI.
The complete model architecture has been presented in Fig. 1, with 4 major modules: 1) Balanced dataset creation, 2) YOLOv8n model training, 3) fractal analysis, and 4) SAHI.
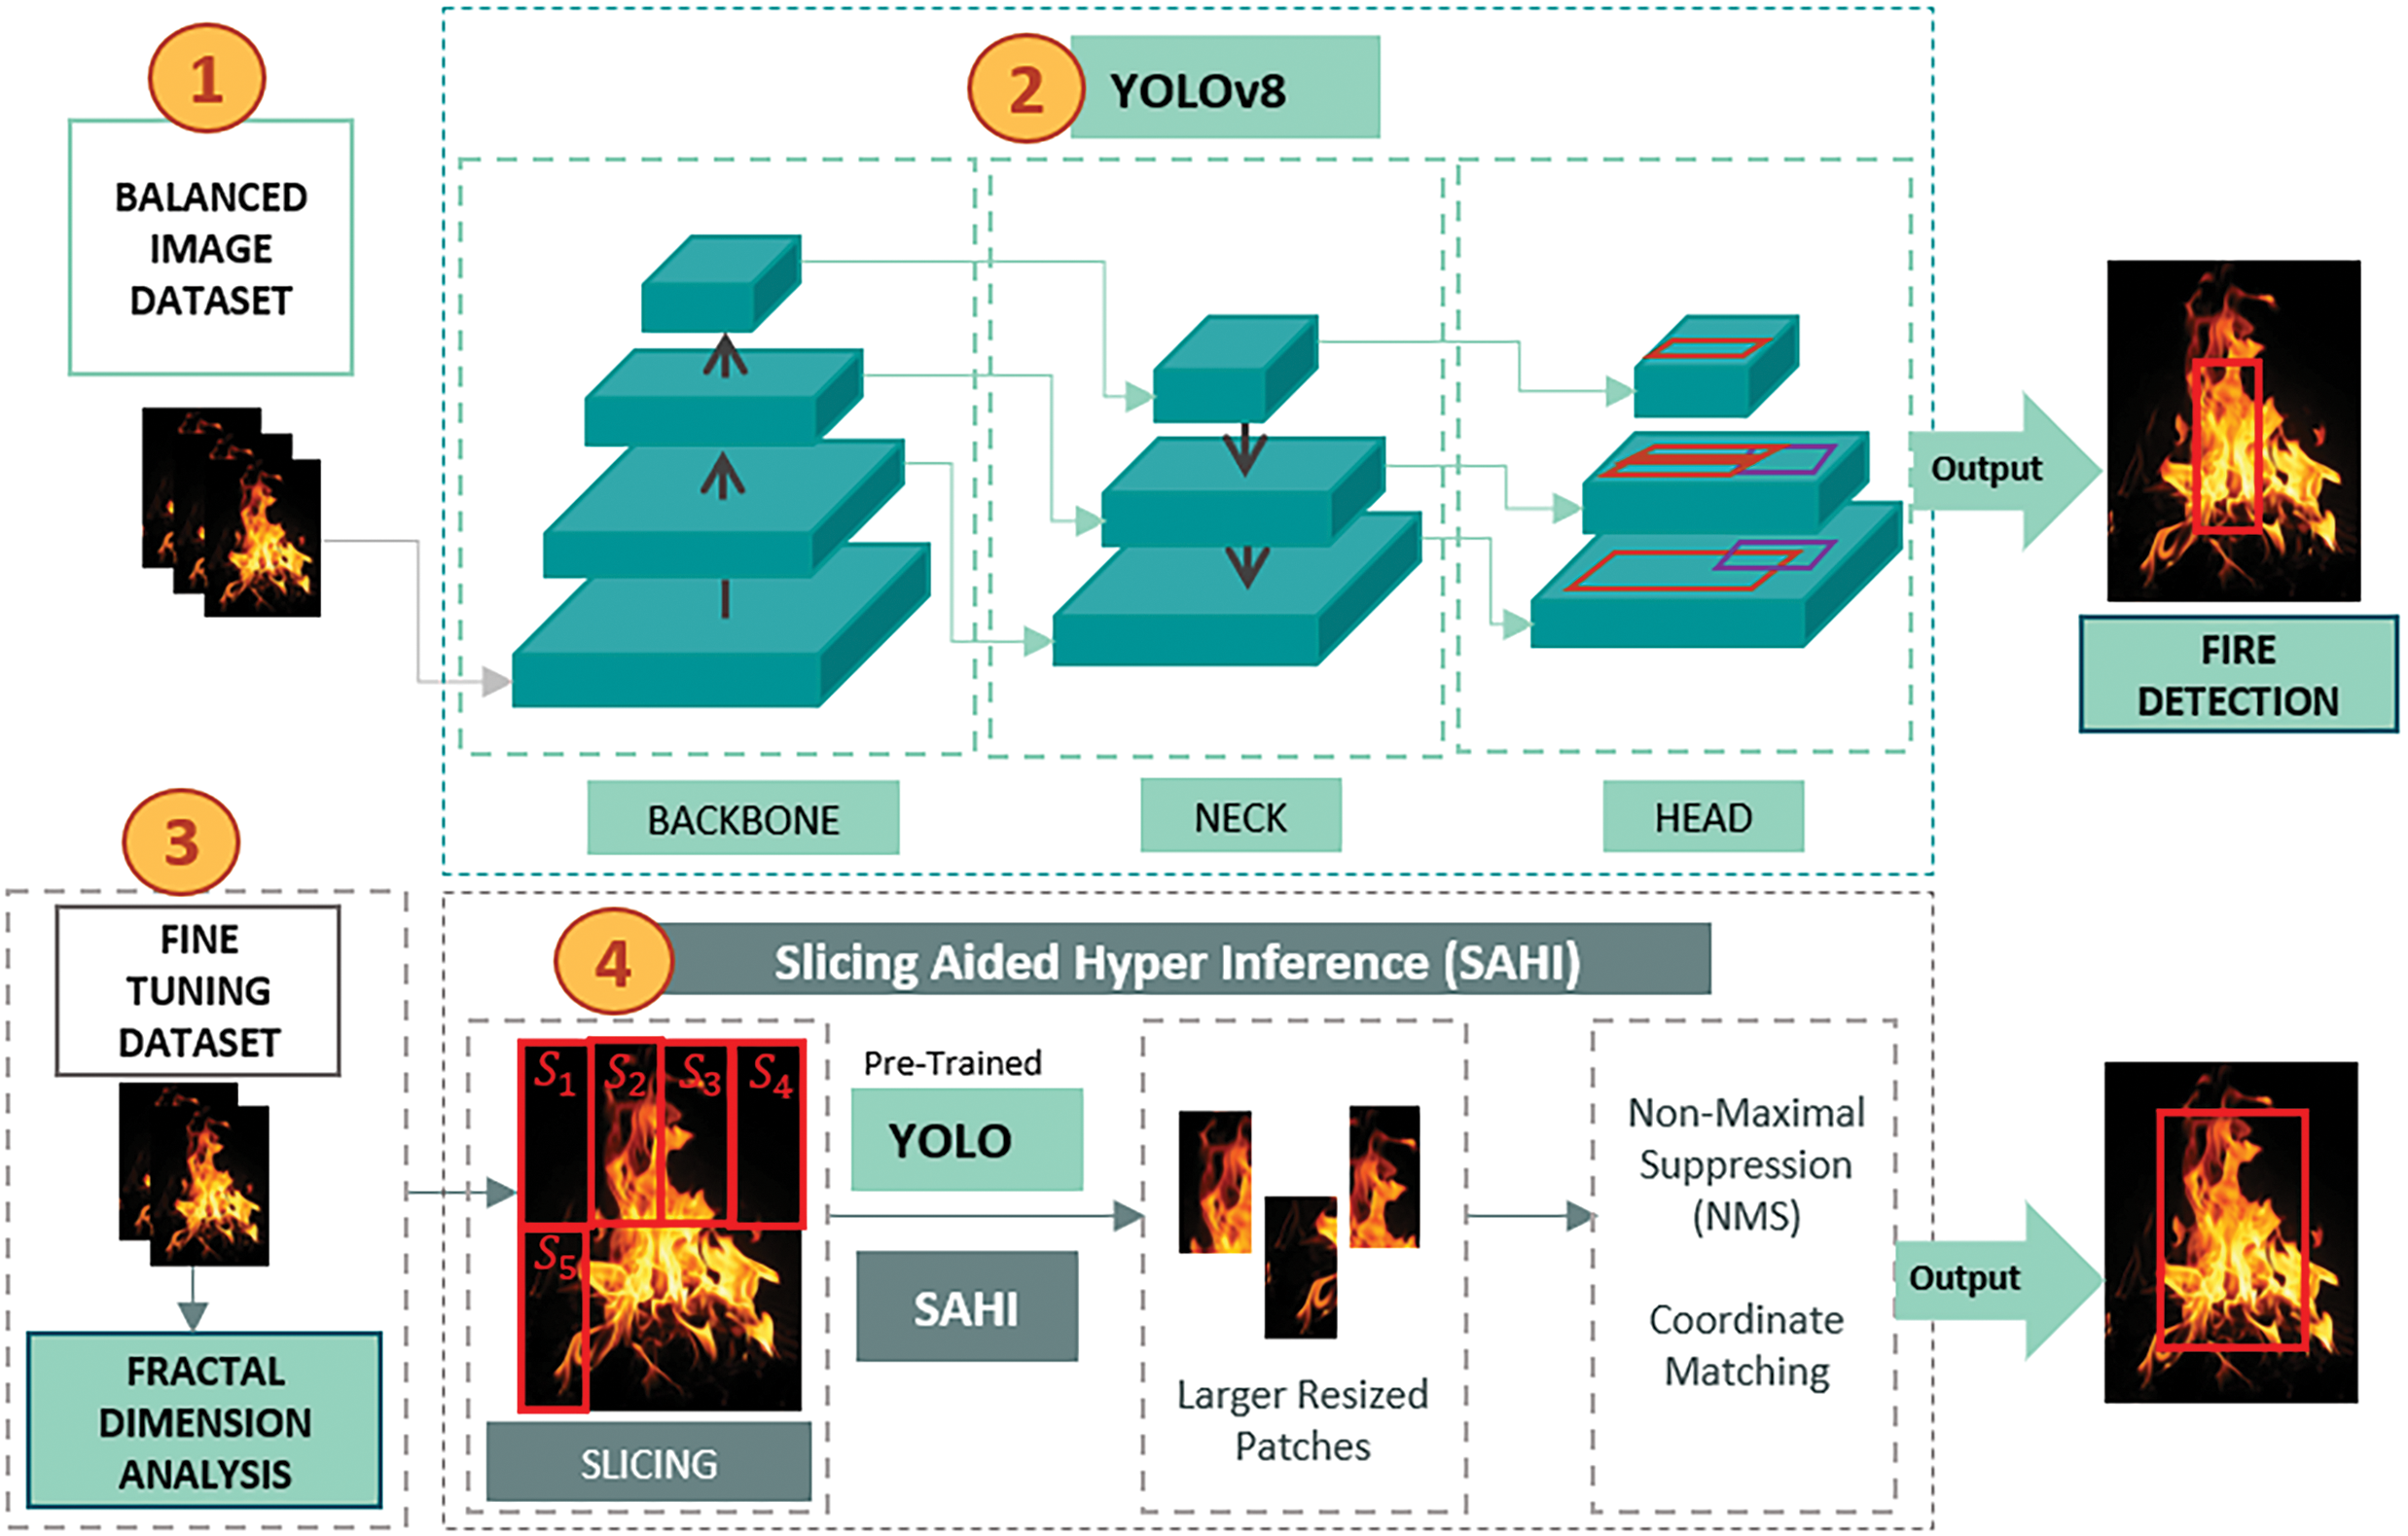
Figure 1: Proposed YOLOv8 model using Sliced Inference with Fractal Dimension (SIFD) analysis for fire and smoke detection
The rest of the paper is organized as follows: Section 2 explains the proposed methodology of developing a fire and smoke analysis and detection model, fractal analysis, and SAHI, along with the environment and hardware specification. Section 3 describes the balanced dataset we used for our experiments and its statistical characteristics. Section 4 details the results, followed by Section 5 giving insights into our studies of generative models with the potential of future work direction. We conclude with a summary of our findings in Section 6.
In this section, we will explain the experimental methodology including the fire and smoke detection model architecture, fractal dimension analysis, and the inference methodology, SAHI. We also discuss the hardware and environment specifications that were used to train and test the performance of the proposed model.
2.1 Fire and Smoke Detection Model—YOLO-SIFD
Our proposed model YOLO-SIFD includes a study on YOLOv8 using Sliced Inference with Fractal Dimension (SIFD) analysis for fire and smoke detection. Fig. 1 shows a schematic of our proposed work.
Object detection has lately been studied with transformer architecture [10] for arial images by maximizing feature understanding at the cost of increased model complexity and different YOLO versions for loss optimization [11]. YOLOv7 [12] and YOLOv8 [13] are both recent, state-of-the-art (SOTA) object detection models published in 2022 and 2023, respectively. YOLOv7 motivated the inception of YOLOv8 to primarily address its inherent limitation to be used for real-time applications owing to the trade-off between model complexity and inference speed. YOLOv8 is an anchor-free model which doesn’t rely on pre-defined object size and location in an image. This is achieved with a decoupled head to process objectness score calculation (probability of object location), and classification tasks independently. This adaptive design is advantageous for faster inference and better accuracy in detecting small objects. YOLOv8 has introduced Cross-Stage Partial (CSP) [14] enhancement to improve the gradient flow during training and eventually minimize the loss function. The CSPDarknet as backbone improves feature extraction of YOLOv8 compared to its predecessors. The Path Aggregation Network (PANet) [15] used in YOLOv8 neck enables multi-scale feature extraction by simplifying information flow across varying spatial resolutions. The modified YOLO head incorporates dynamic anchor assignment and a novel Intersection over Union (IoU) loss function to increase bounding box predictions and manage overlapping objects. The sigmoid function is used as the activation function for the objectness score in the output layer of YOLOv8 to show the probability of an object in a bounding box.
We further study the fractal dimension of fire to render fractal geometrics for analyzing fire propagation. The bounding boxes from SAHI detection are used to construct a binary fractal image representing the detections. The calculated fractal dimension gives the spatial distribution of the bounding boxes in the binary image. This quantitative measure of the complexity of the arrangement of detected objects can be used to develop effective feature extraction methodologies. For the scope of this work, a higher fractal dimension corresponds to a complex distribution, indicating more objects, clustered together. This spatial arrangement of detected fire can provide insights into patterns, density, severity, and the potential of fire spread.
To improve the detection accuracy of YOLOv8, we incorporated it with SAHI. SAHI divides large images into smaller, manageable slices such that each slice is independently processed as a large patch. After detection in individual patches, bounding box coordinates are matched and overlapping patches are removed using non-maximal suppression (NMS). This method allows models to process each slice independently, reducing computational load and memory usage. By aggregating the results from these slices, SAHI enables detection of smaller and overlapping objects, and segmentation where high-resolution input is required. Small object detection has been studied with attention networks [16]. The resulting performance gain is achieved by leveraging a large dataset, hence inapplicable to data-constrained applications. To overcome the detection challenges associated with small objects, especially in data-constrained domains, Slicing-Aided Hyper Inference (SAHI) has been studied in the literature [17,18]. The viability of the slicing approach can be further strengthened by the fact that dynamic textures in a fire can be fractally analyzed and fire propagation can be modeled [19]. Such an approach can help develop early fire detection methodologies.
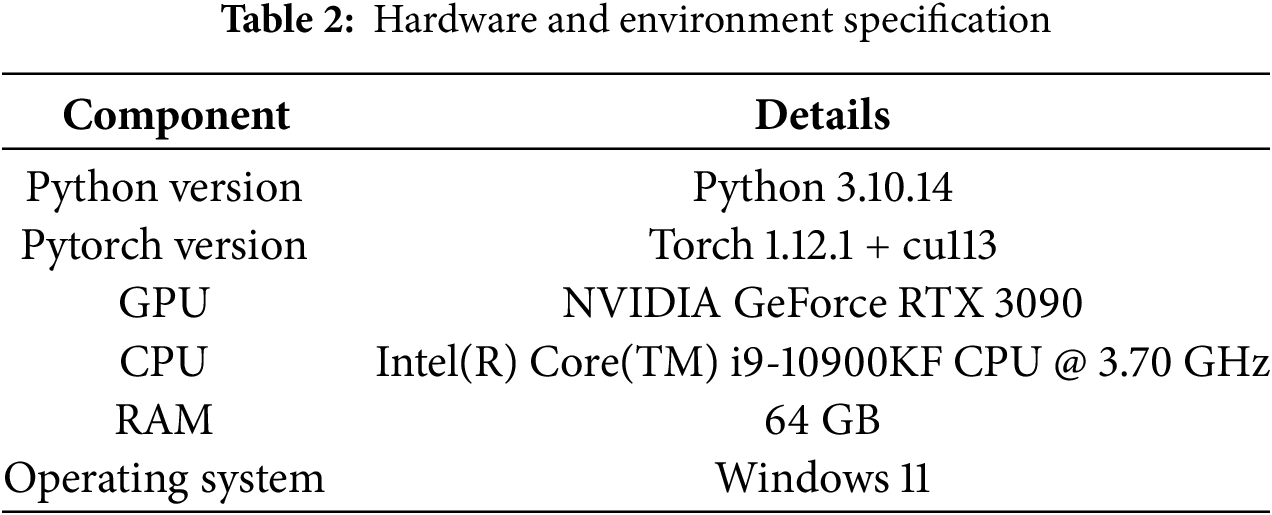
The hardware specification and runtime environment for the designed fire and smoke detection model have been outlined in Table 2.
We used a publicly available fire dataset for this study, previously adapted in [20] with 8974 images and [21] with 11,667 images. These datasets are built on other publicly available video datasets like VisiFire, widely studied for fire detection in earlier works like [22,23]. The details specific to a dynamic dataset with the intent to improve detection accuracy have been given in the following sections.
Let the original video dataset
The entire set of frames can then be denoted as:
where
Since, each frame can have single or multiple labels (fire, smoke or both), the labelled frames comprising the labelled dataset
where each pair (
where
Using the above information, we calculate the chi-square,
Since
We also calculate the p-value, a statistical measure to calculate the significance of observed data. It is the likelihood of obtaining a value equal to or greater than the observed result if the null hypothesis or conjecture is true. The p-value is the probability that a chi-square random variable with
If the p-value is greater than a significance level
To achieve the dataset balance, we adopt a pruning technique that uses an oversampling or undersampling technique, as required. For over-sampled or under-sampled labels, we respectively reduce or increase the duration or frequency of frame extraction from videos labeled as fire or smoke, by skimming through the entire dataset L, to avoid losing data diversity. We do this iteratively until a class-balanced dataset is achieved.
3.2 Statistical Analysis of Dataset
Following the balanced dataset creation strategy from Section 3.1, Fig. 2 shows samples from the dataset.
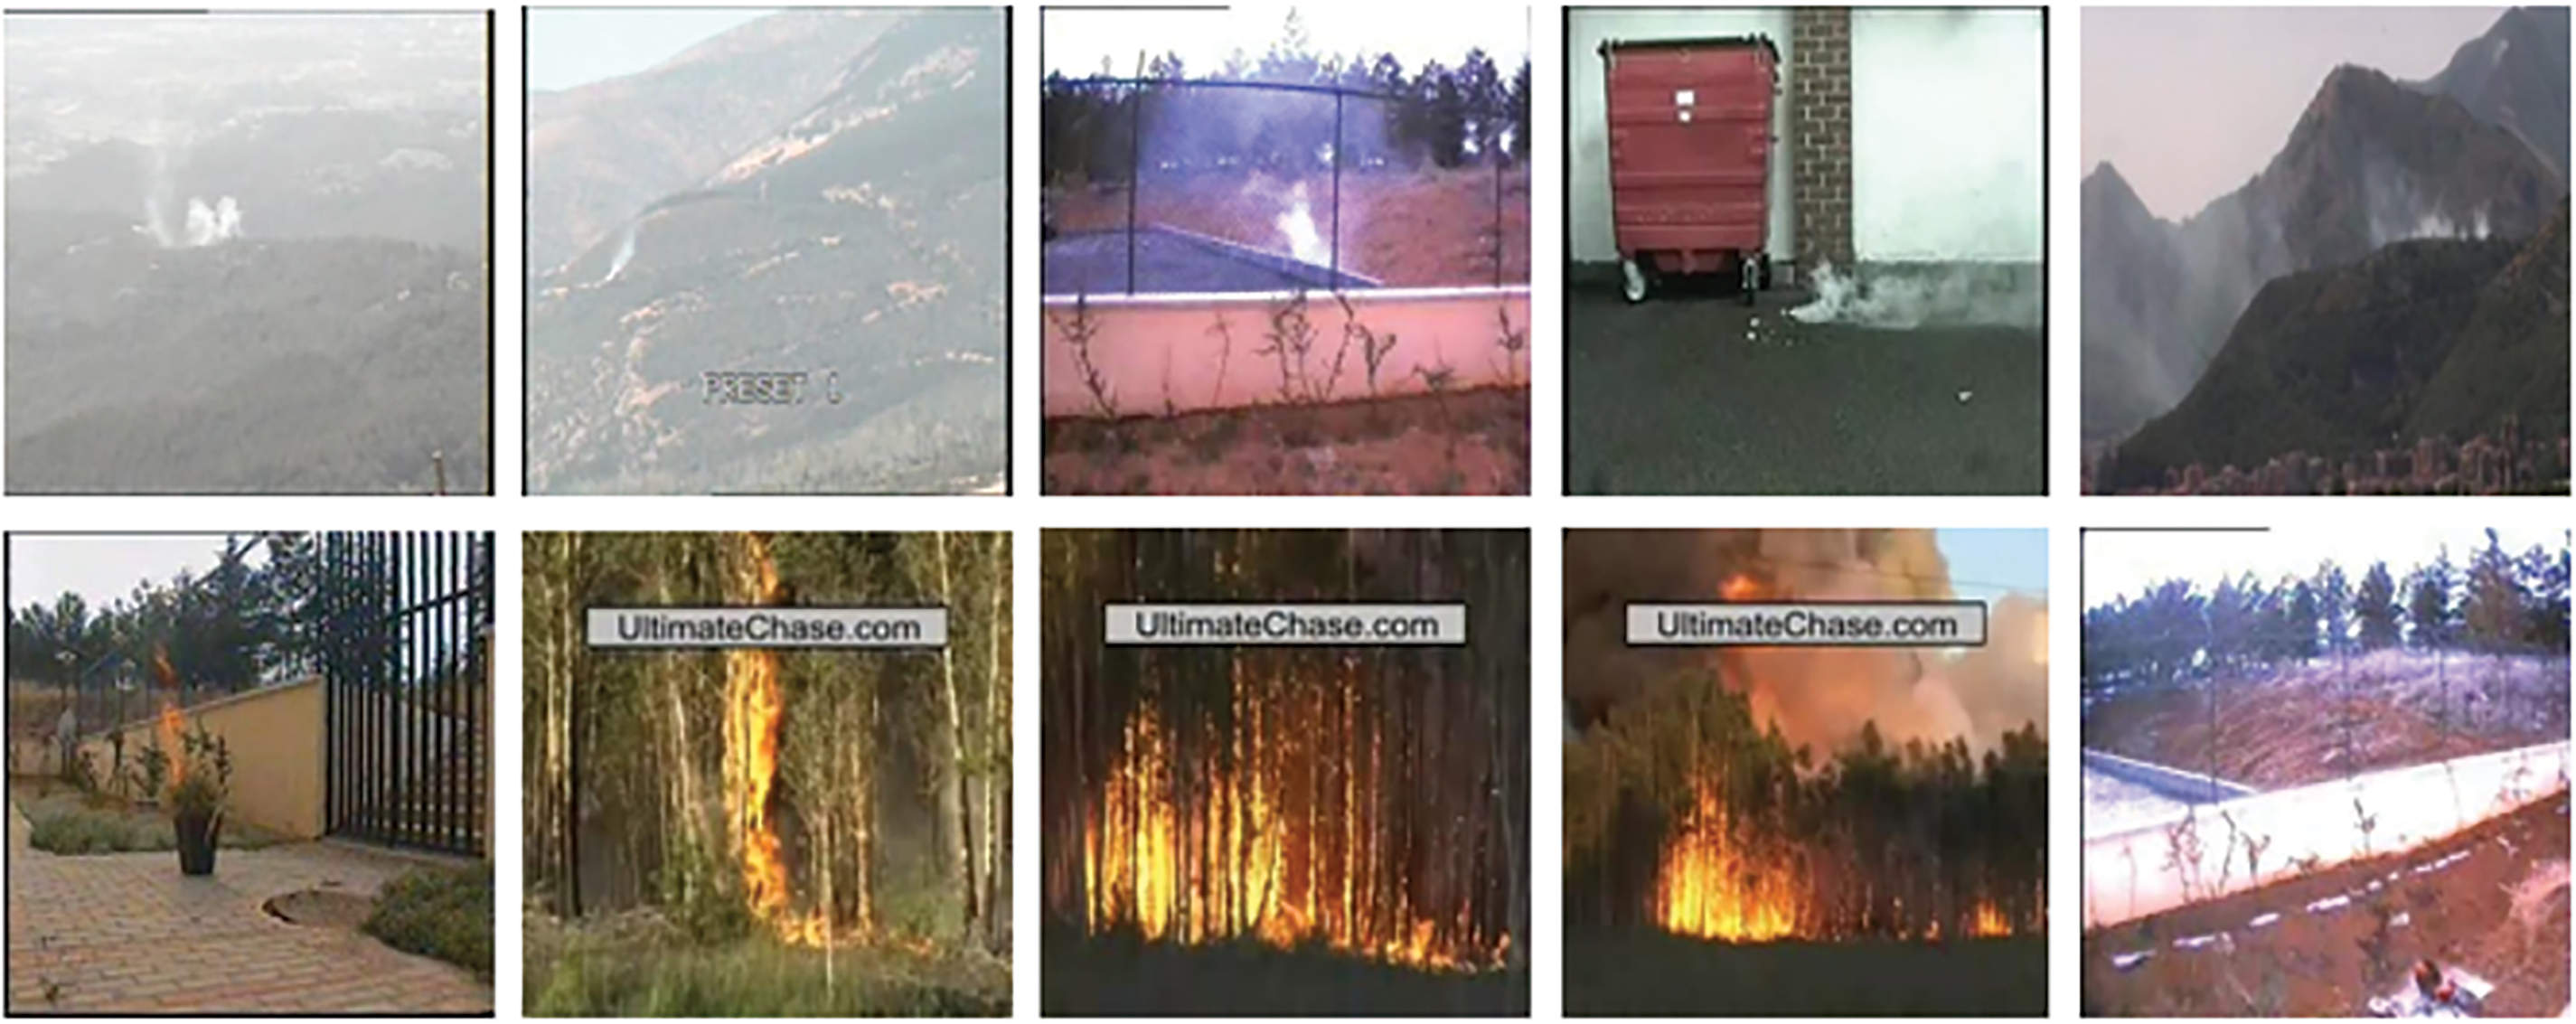
Figure 2: Samples from the balanced dataset
Fig. 3 shows the label distribution in terms of fire and smoke in the dataset. A further distribution of label counts in train, test, and validation datasets is shown. An equal number of 6793 smoke and fire labels corresponds to a balanced dataset.
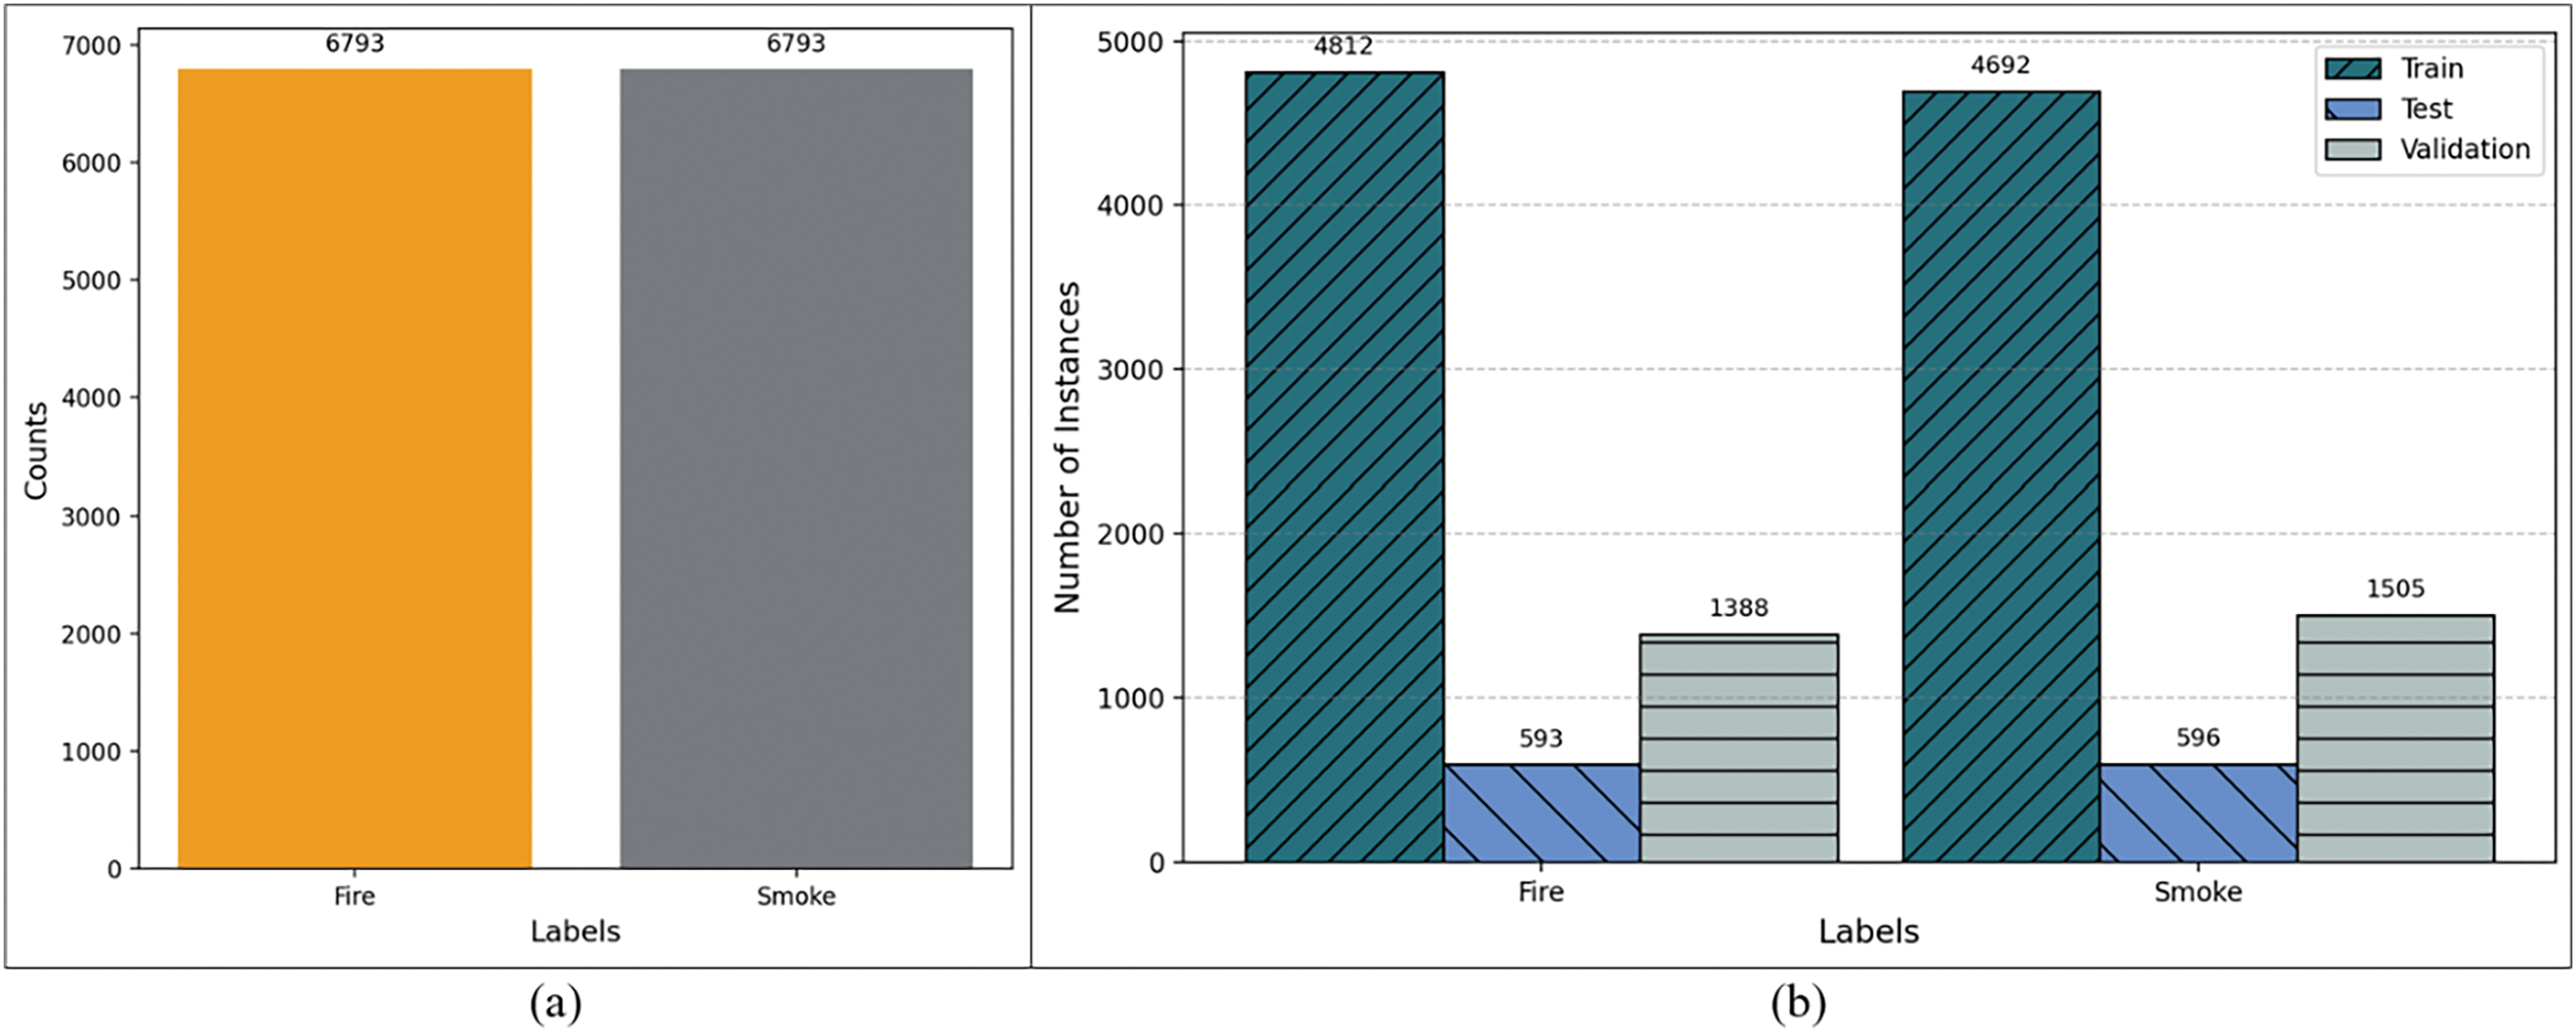
Figure 3: Label distribution comparison in train, test and validation sets. (a) Fire and smoke label distribution in the fire and smoke detection dataset. (b) Label distribution comparison in train, test and validation sets
A consolidated overview of data split into training, test, and validation sets, and a statistical overview of the dataset in terms of label counts for fire and smoke is given in Table 3.
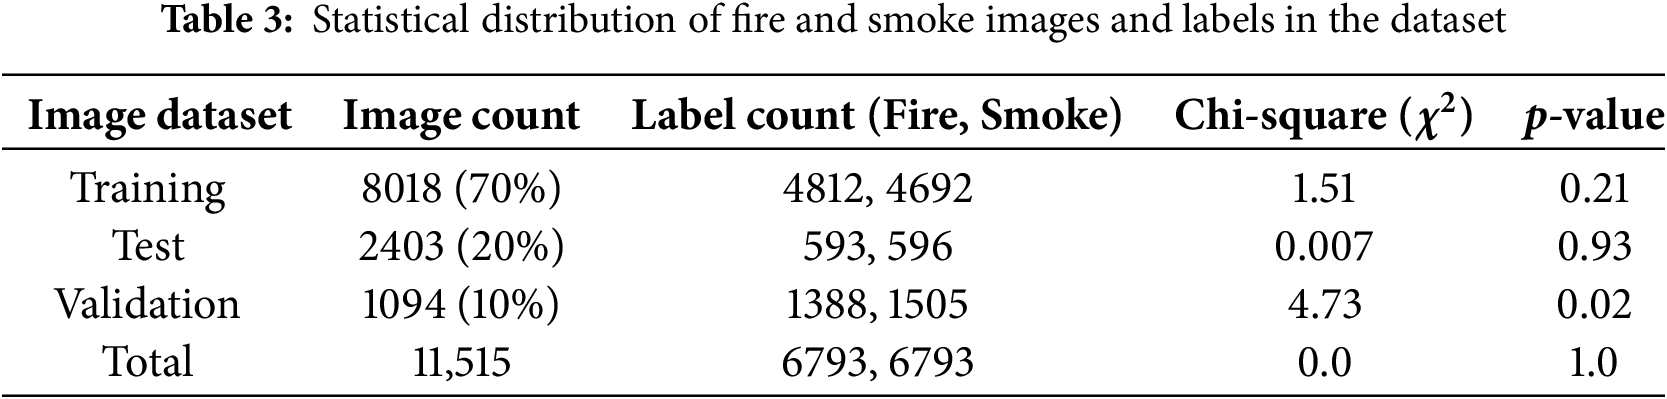
Chi-square values, obtained using Eq. (6), are 0 for the entire dataset indicating a perfect balance. For training and test datasets, the values are low, so the model can be trained on a balanced dataset. The validation set, on the contrary, shows a higher
The results of chi-square test are further supported by the p-value from Eq. (7). Statistically, a low p-value (<0.05) suggests that the class distribution in the dataset is significantly different from the expected distribution, indicating potential imbalance. This can be seen in the validation dataset, again prompting the need for a better inference methodology.
We used fine-tuning for optimal performance. For YOLOv7, adam optimizer was used with a learning rate of 0.001 and momentum of 0.937. For YOLOv8, adamW optimizer was used with a learning rate of 0.01 and momentum of 0.9. The training results for YOLOv7 are for 60 epochs while that for YOLOv8 are for 50 epochs, to achieve comparable performance. We compare our results with recent work in terms of precision, recall, and mean average precision (mAP) values.
Fig. 4 shows the training result of YOLOv7 and YOLOv8 for 60 and 50 epochs, respectively. The epochs are shown along the x-axis while the performance metrics on the y-axis are depicted by the graph header. These evaluation parameters [25], precisely precision, recall, and mAP [26] can be defined using Eqs. (8) to (10) where true positive (TP), true negative (TN), false positive (FP), and false negative (FN) values are considered. For both models’ performance shown in Fig. 4, the precision, a count of true positives out of the total predicted bounding boxes, has been calculated using (8):
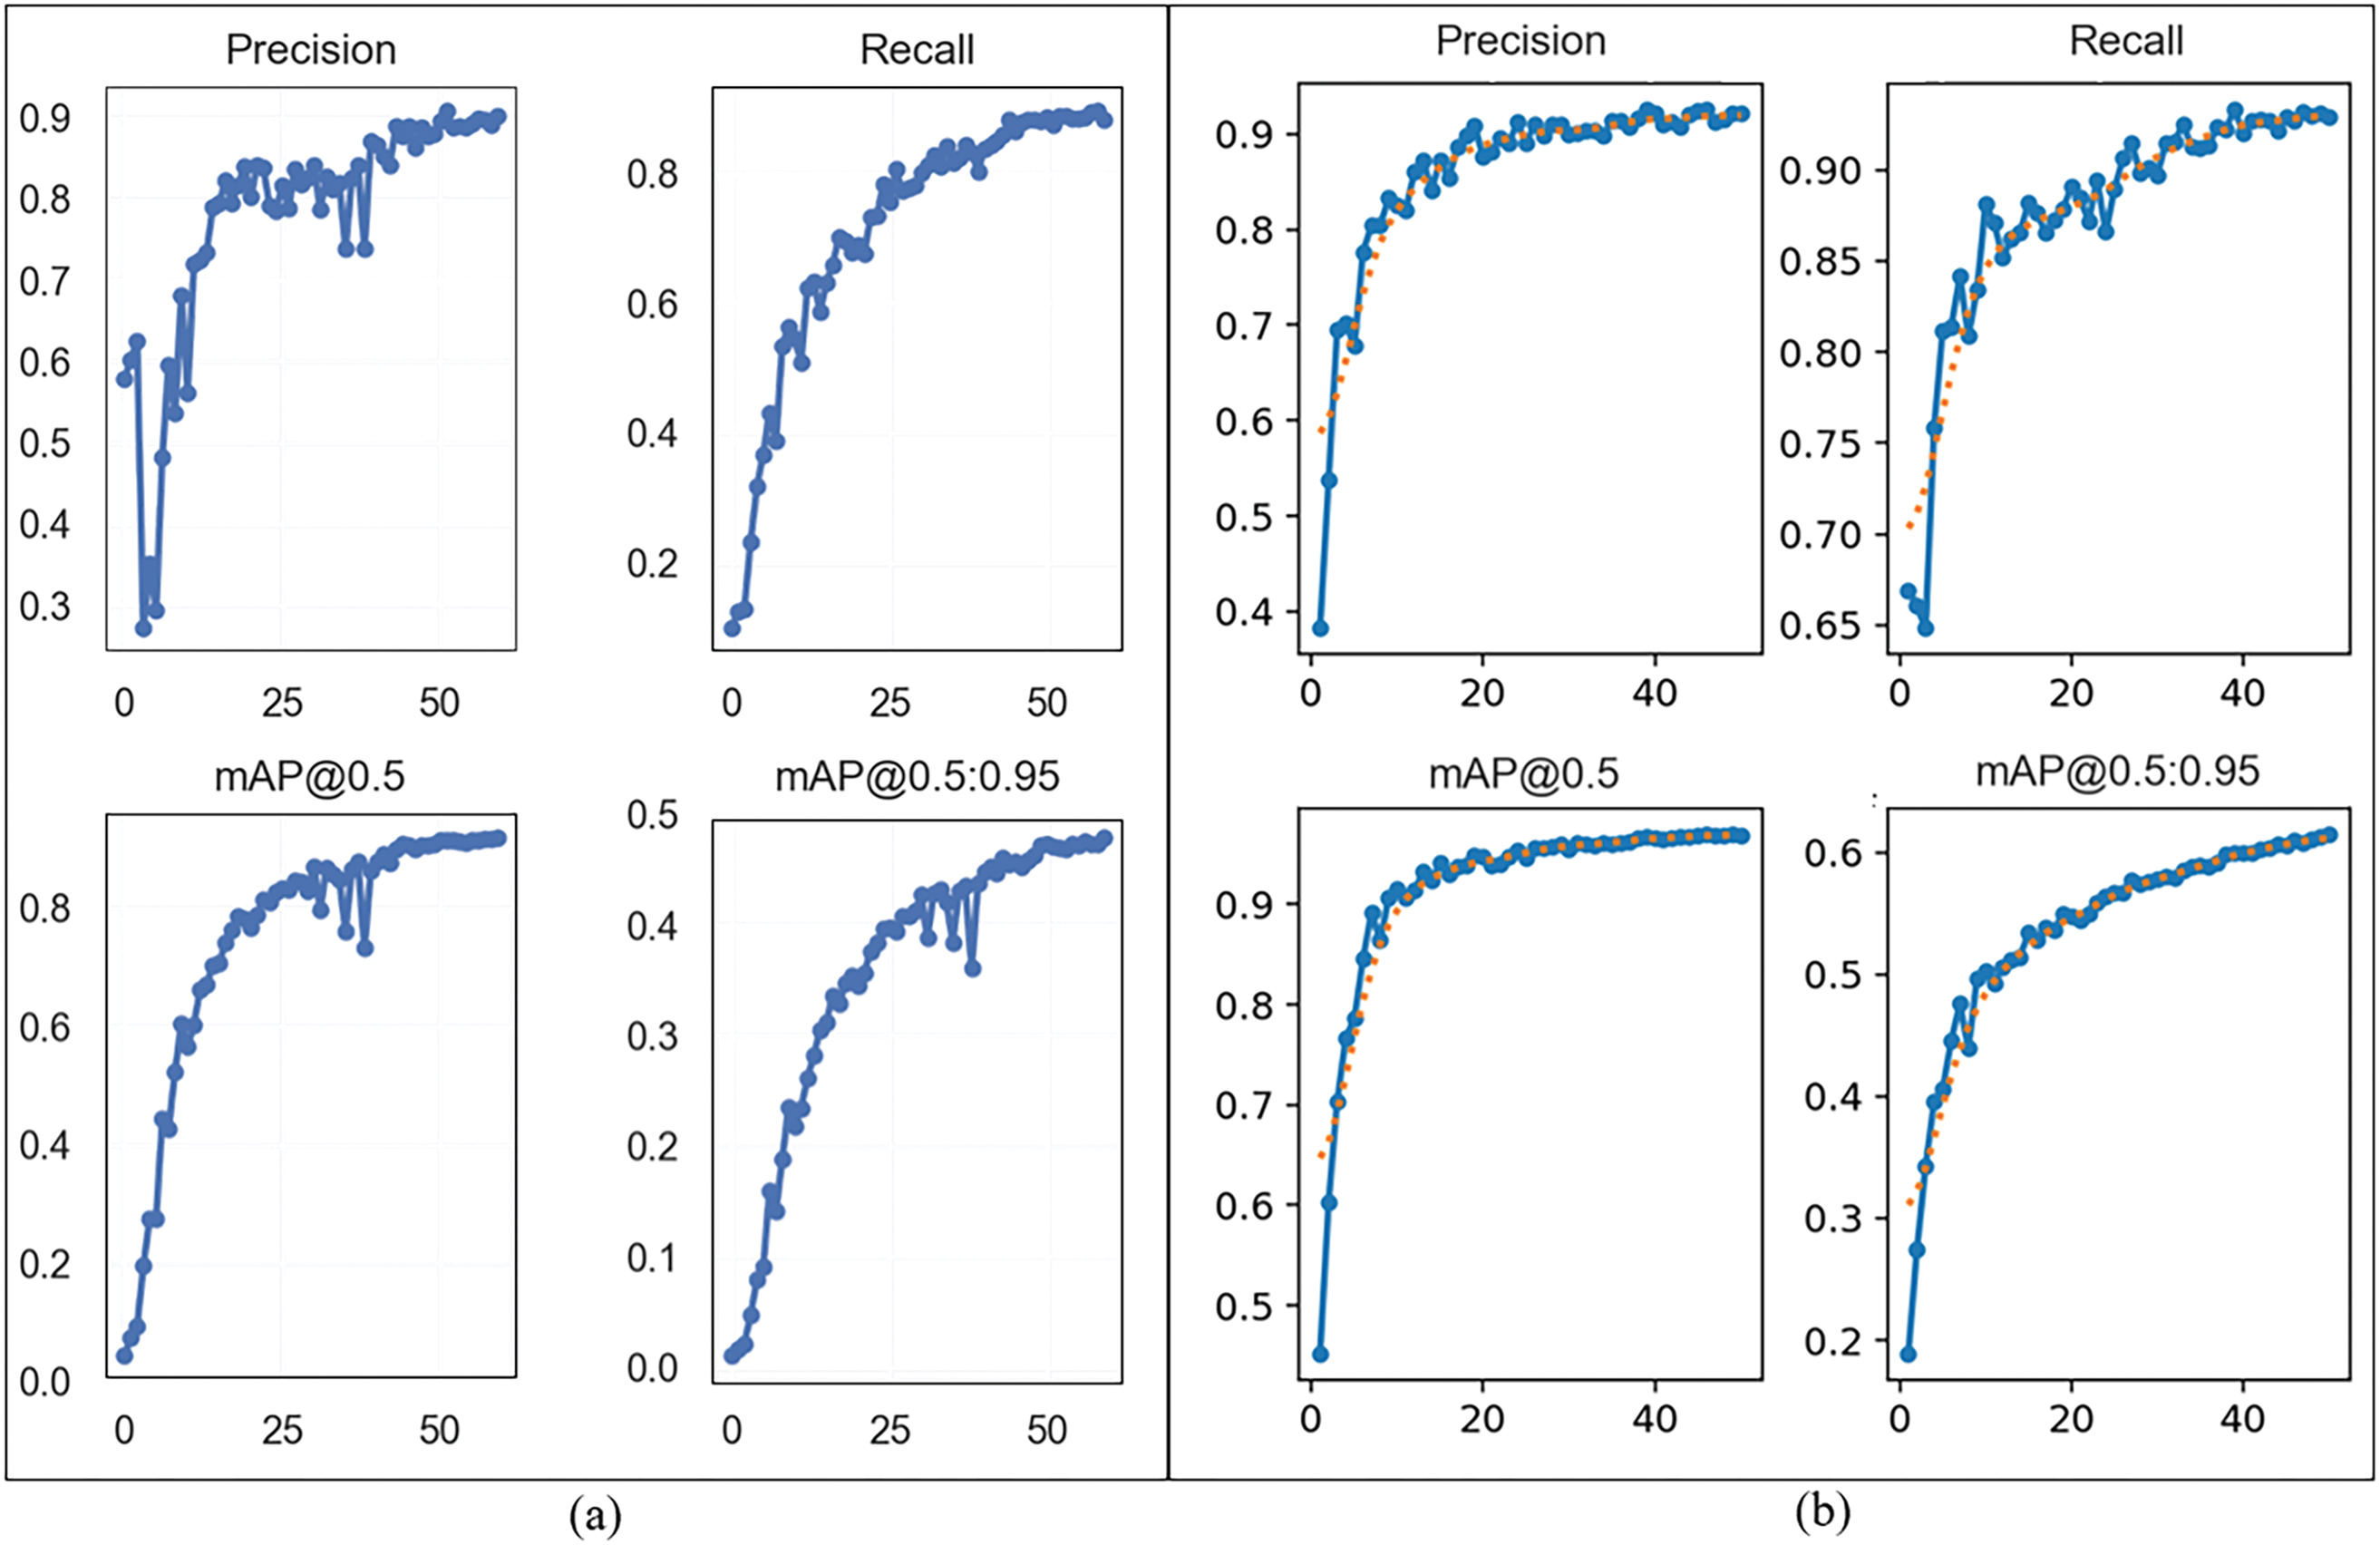
Figure 4: Performance result comparison of YOLOv7 and YOLOv8 for fire and smoke detection. (a) YOLOv7 performance results (y-axis) for 60 epochs (x-axis). (b) YOLOv8 performance results (y-axis) for 50 epochs (x-axis)
Recall, which counts the true objects detected by the model, can be calculated as:
At a given IoU threshold, we also calculate the model’s mAP value as:
where
From (10), mAP is the average of precision values computed at different recall levels across all classes and images, hence being a more comprehensive evaluation metric. It gives a more balanced view of the model’s performance for given confidence thresholds.
From Fig. 4, we can see that for YOLOv7 to reach a performance comparable to YOLOv8, the finetuning results vary by 10 epochs less for YOLOv8, to avoid overfitting. The results have been summarized in Table 4, where we compare our results to recent related work. We used a balanced dataset with fire and smoke labels to make this model better suitable for practical applications. Our model shows a great balance between precision and recall which is a tradeoff. Looking at Eqs. (8) and (9), if a model strictly predicts a positive class with high confidence, it will have high precision but many true positives might be missed leading to lower recall, and vice versa. This concept is further evaluated in the precision-recall curve shown in Section 4.3.
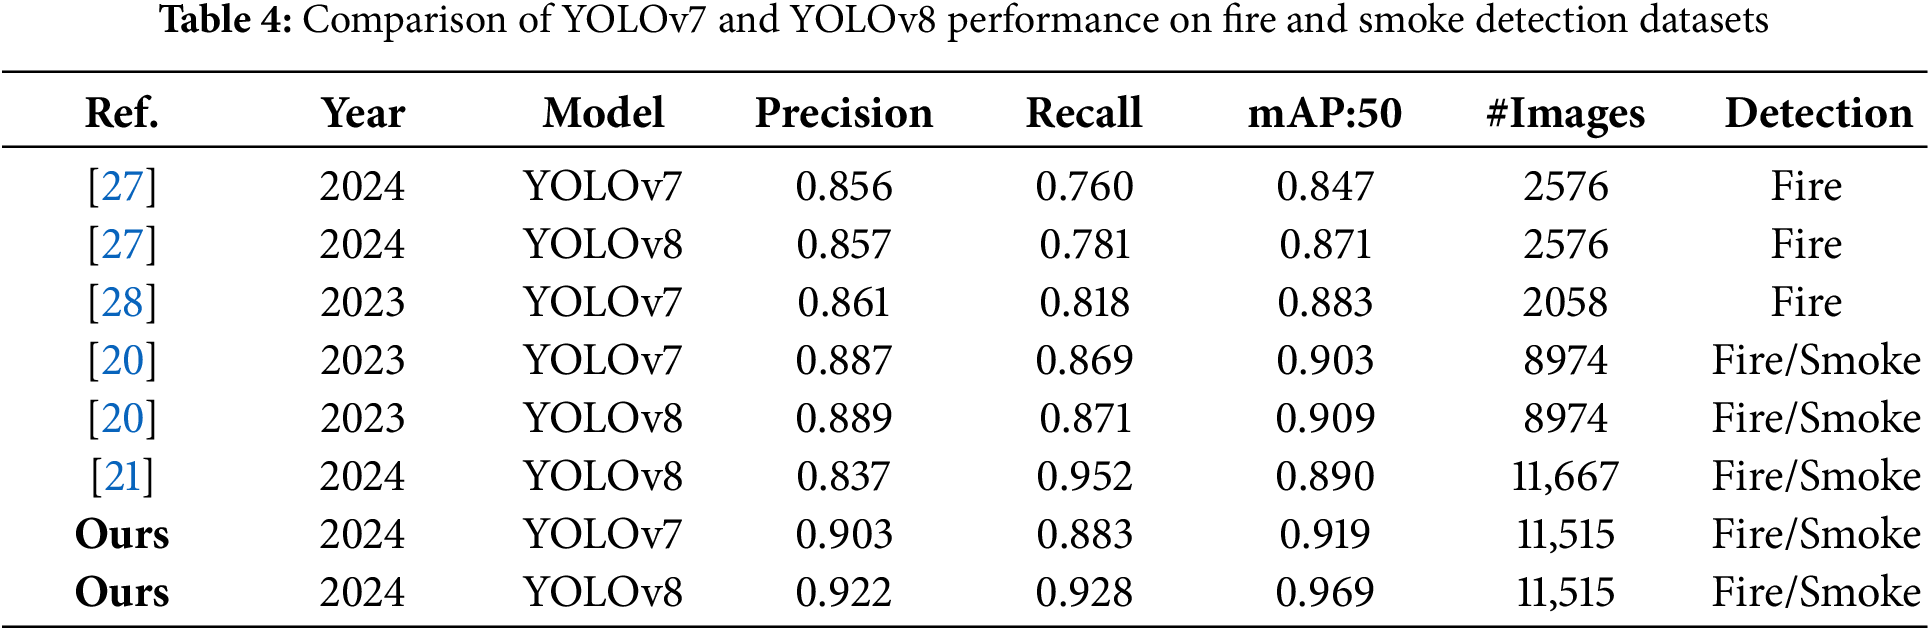
We compare our results with recent work in the literature. Reference [27] studied fire detection using YOLOv7 and YOLOv8. However, the achieved performance is not very high and the training dataset is small. The models are also trained only for fire detection, which limits its applicability. The fire detection model from [28] has achieved a good balance between precision and recall, but the dataset size and only fire detection capability become its limitations. The model proposed in [21] with the same baseline dataset as ours, has been designed for both fire and smoke detection and achieves a high recall with a suitable dataset volume. Our proposed model achieves an overall superior performance in terms of high precision, recall balance, and better mAP values, which can be credited to the class-balanced dataset.
To dig further into our fire and smoke detection model, we use box loss as an evaluation parameter to compare YOLOv7 and YOLOv8 performance, shown in Fig. 5. Box loss is the difference between the model’s predicted bounding boxes and the actual ground truth bounding boxes. A lower loss value is desirable since it is an indicator of the model’s predictions to be closer to the actual values. While YOLOv7 gives a lower box loss value compared to YOLov8, we choose YOLOv8 due to its overall better performance.
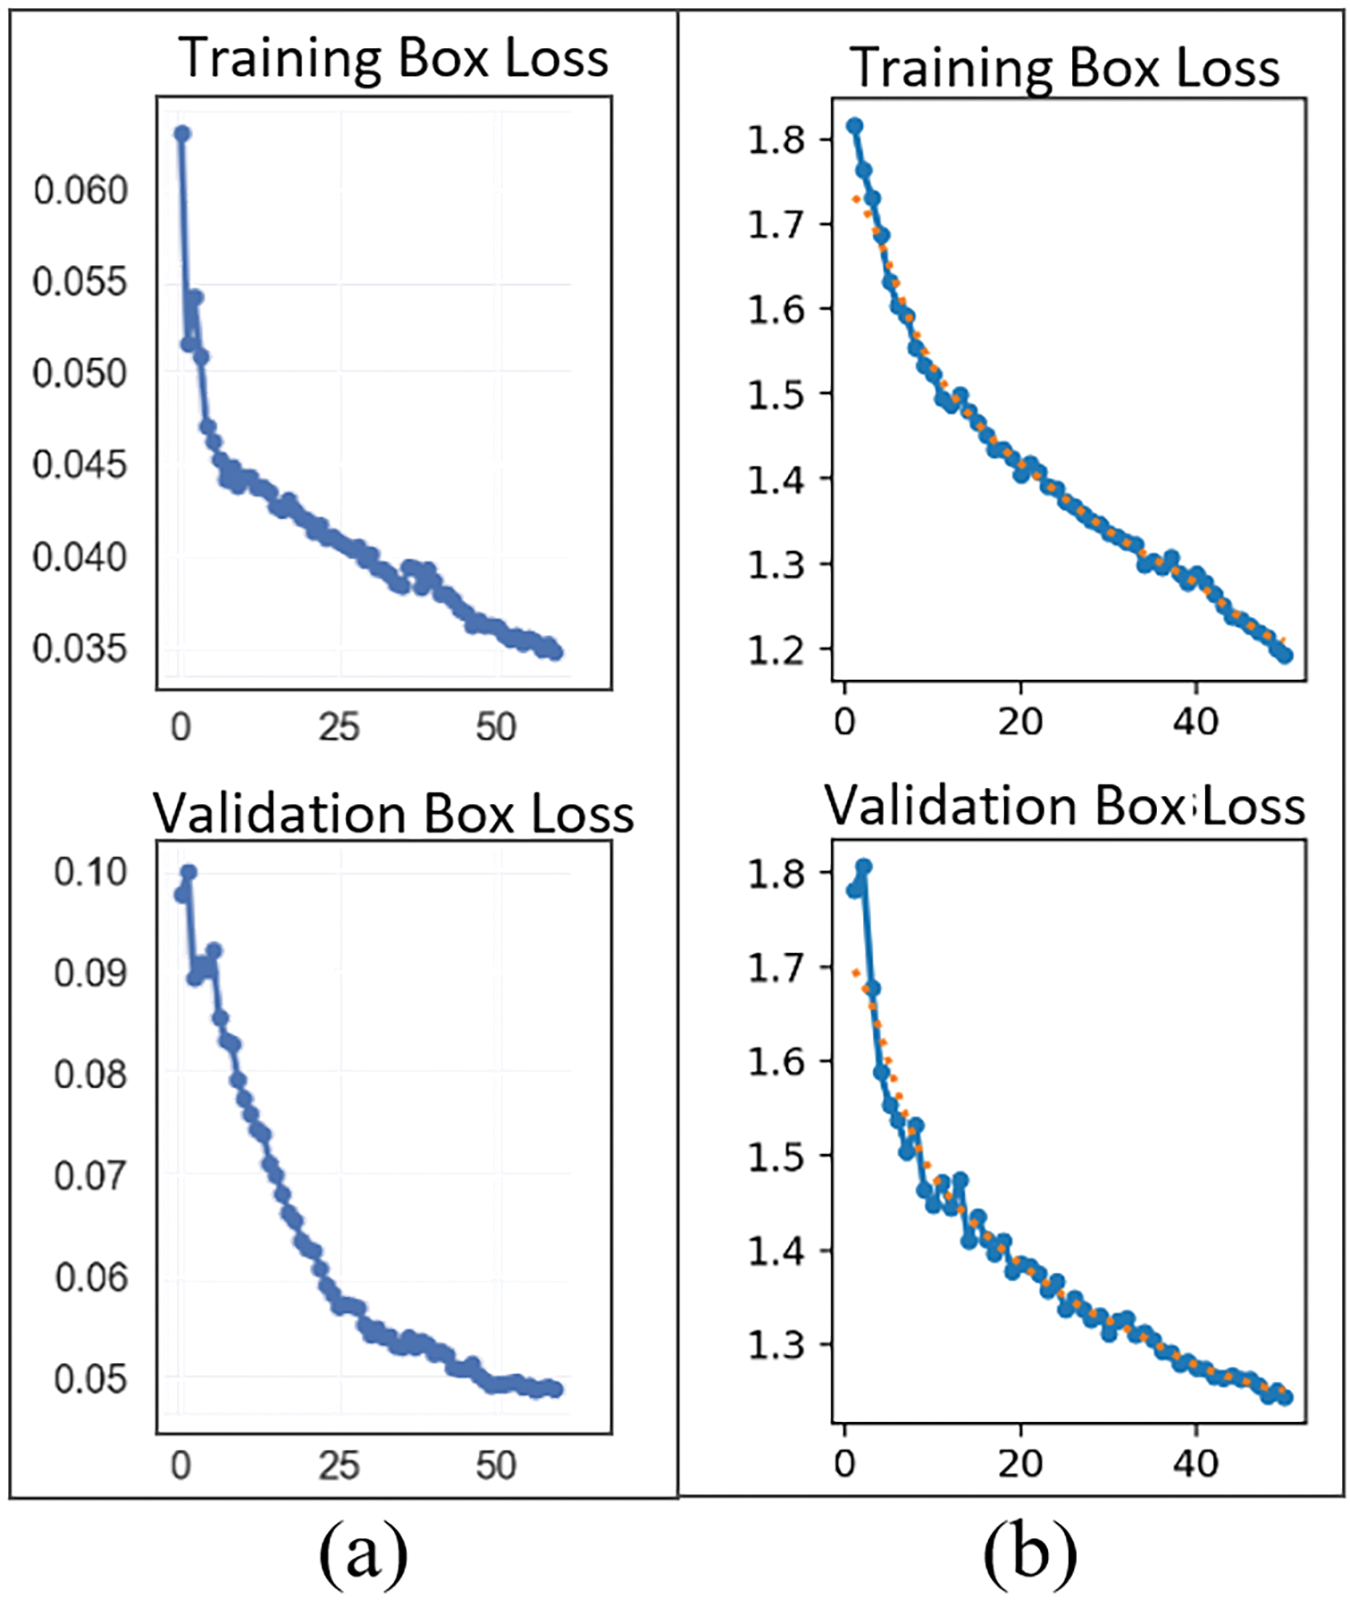
Figure 5: Loss comparison of YOLOv7 and YOLOv8 models. (a) Training and validation box loss for YOLOv7. (b) Training and validation box loss for YOLOv8
We further explore the trained YOLOv8 model and evaluate it on a number of parameters.
F1 score is the harmonic mean of precision and recall given by:
The graph in Fig. 6 shows F1 score calculated at different confidence thresholds. It shows the balance between precision and recall by considering both false positives and false negatives. A higher peak suggests better model performance. The values range from 0 to 1, where 1 indicates perfect precision and recall, and 0 indicates the worst performance. All classes 0.92 at 0.332 means that, on average, the model has 92% precision at a confidence threshold of 0.332 for all classes.
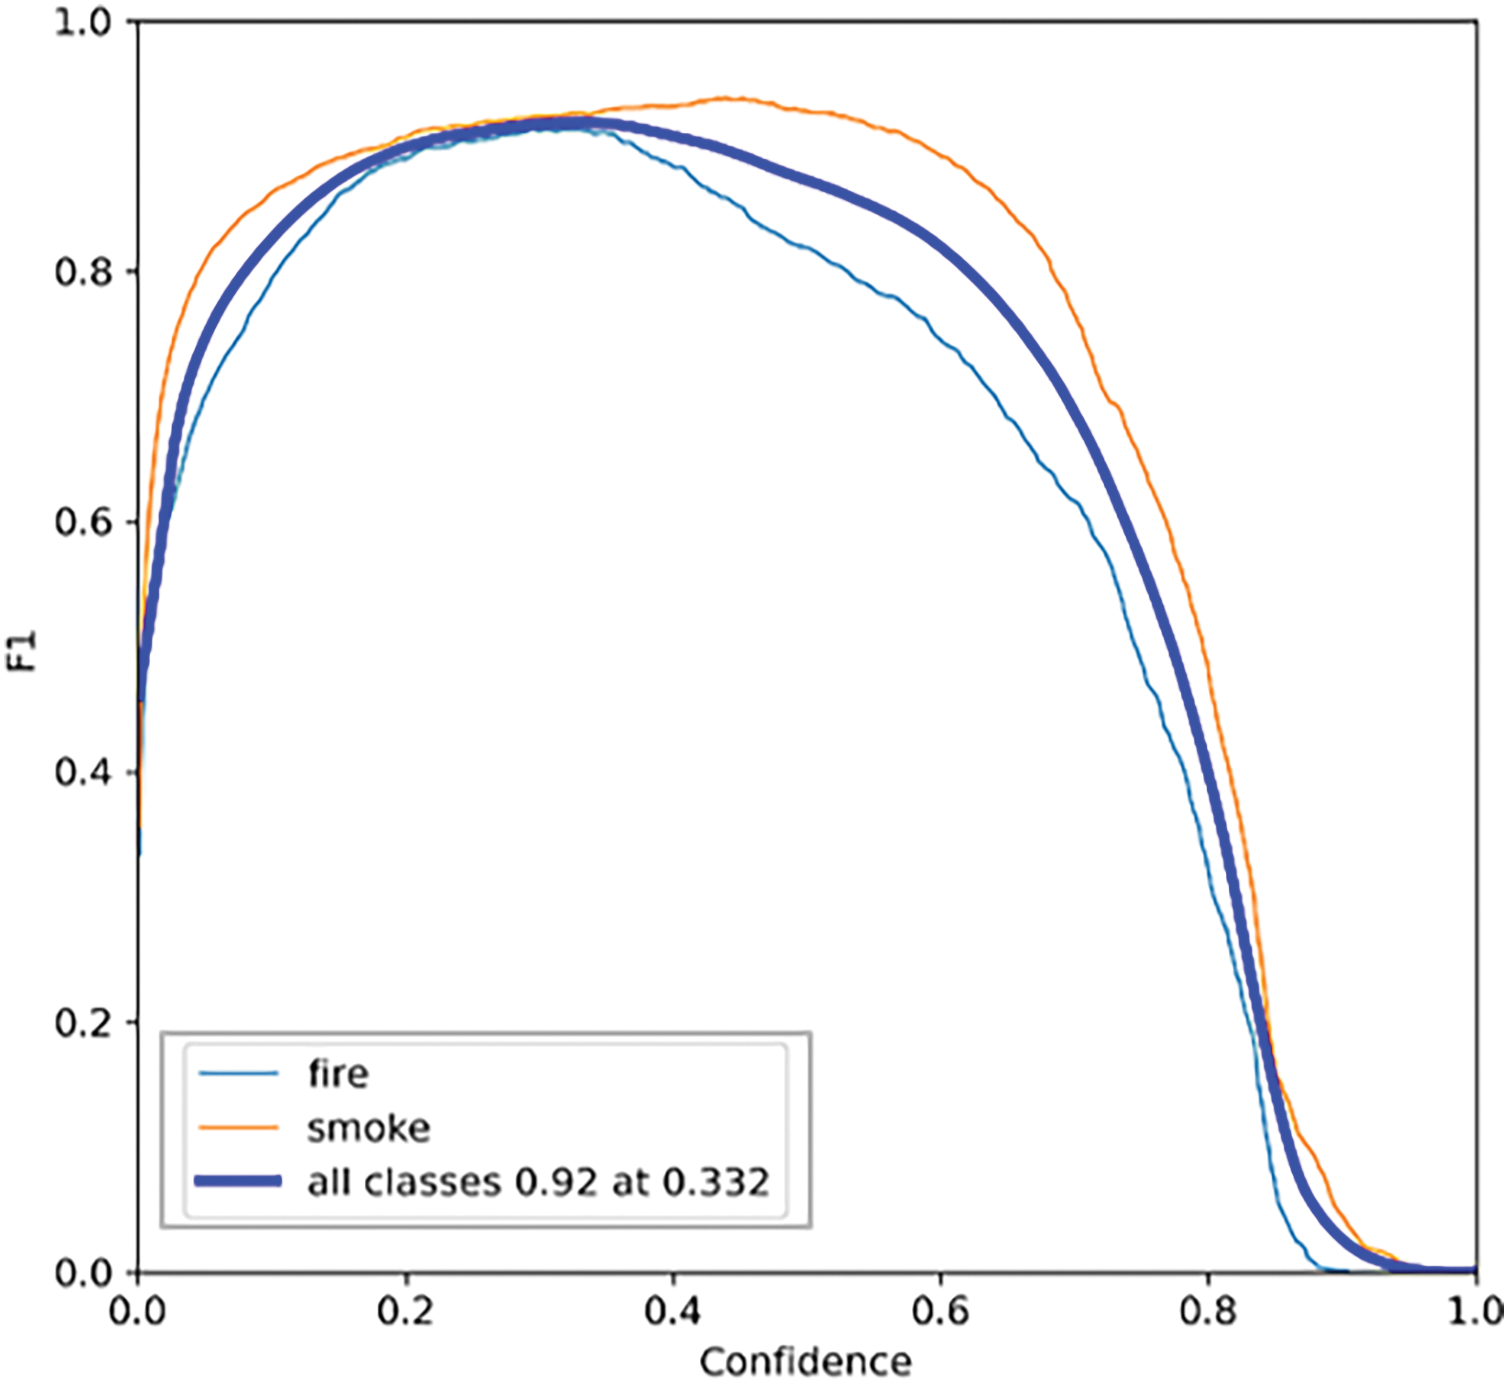
Figure 6: F1 confidence curve for YOLOv8 validation
The graph in Fig. 7 shows the trade-off between precision and recall for different threshold values. All classes 0.969 mAP@0.5 means that the mAP is 96.9% across all classes at an IoU threshold of 0.5, as given in Eq. (7). IoU measures the area of overlap between the predicted bounding box and the ground truth bounding box. mAP50 refers to the mean average precision calculated at an IoU threshold of 0.5. In a precision-recall curve, a model that reaches closer to the top-right corner is better.
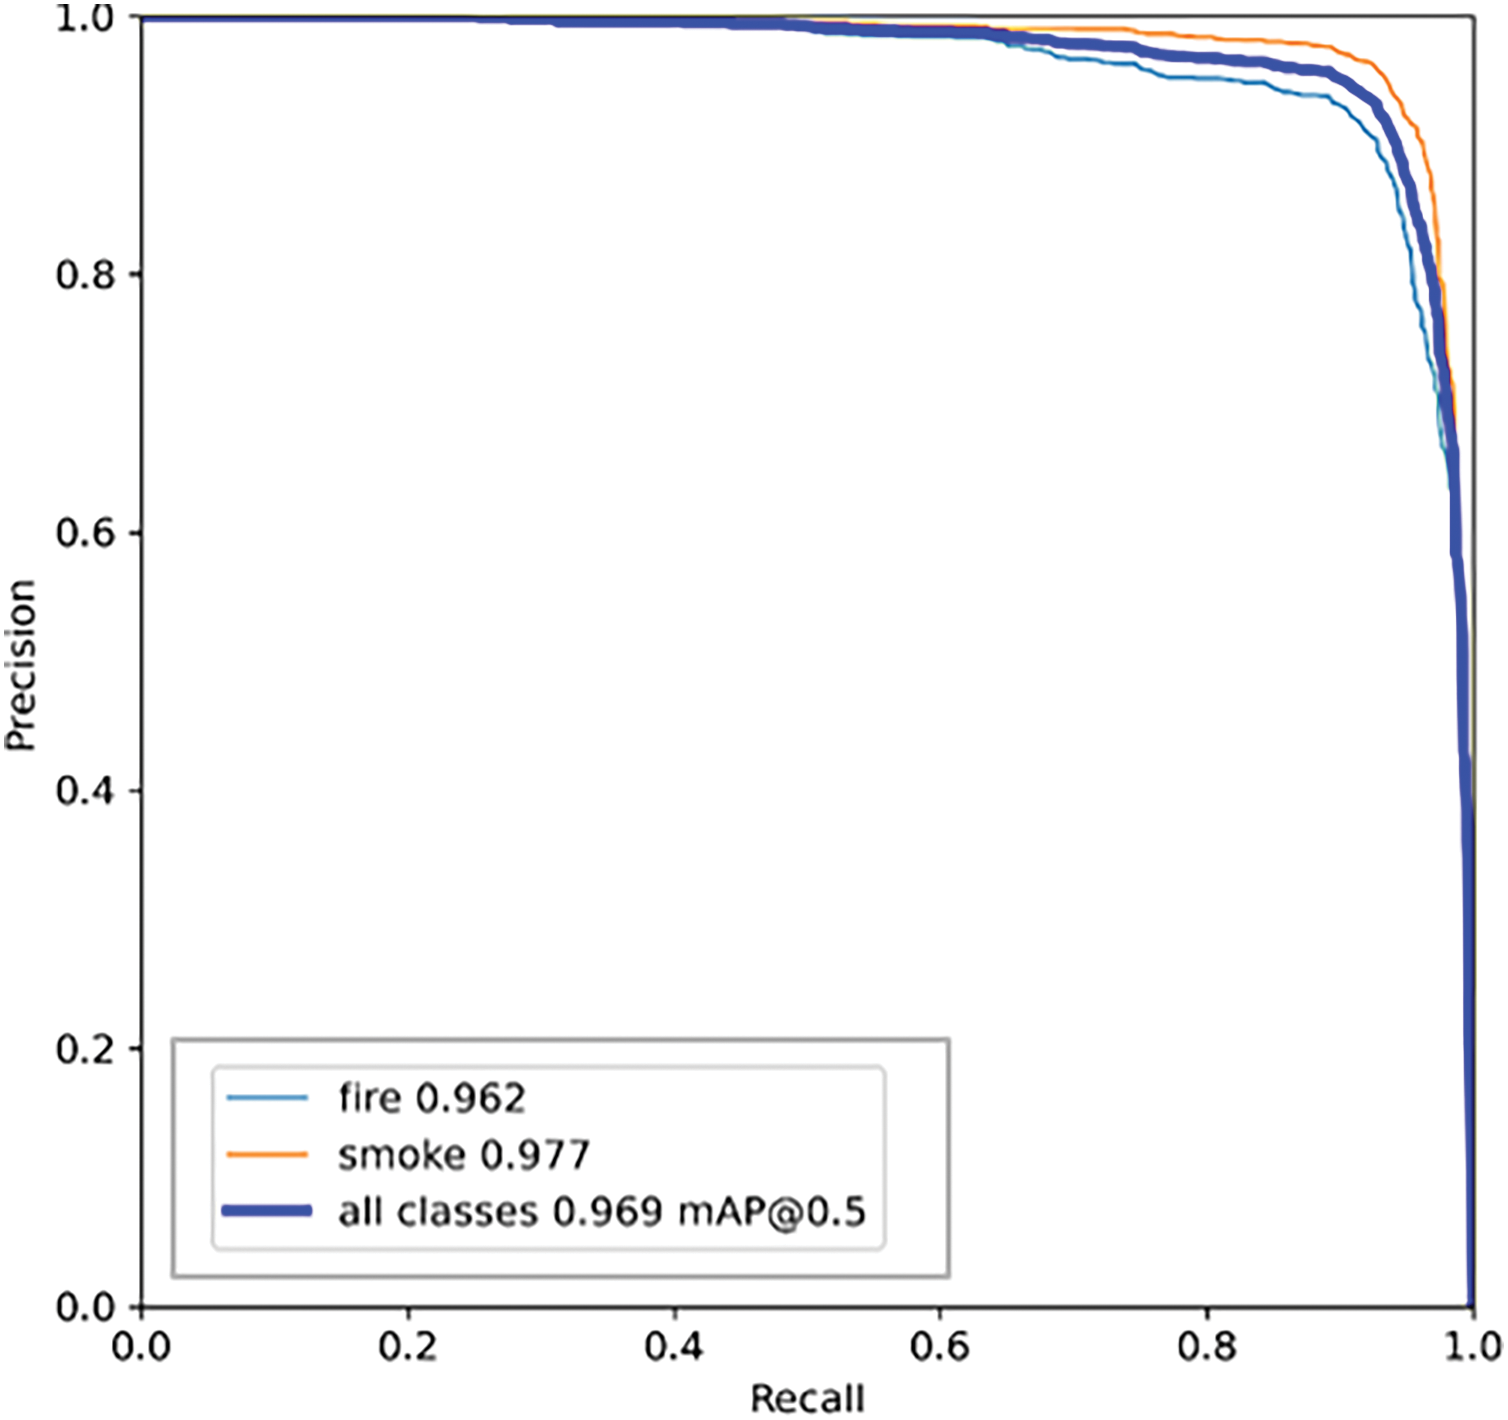
Figure 7: Precision recall curve for YOLOv8 validation
The confusion matrix summarizes the classification performance. Correct predictions are indicated along the main diagonal (top left to bottom right) while misclassifications are indicated by the off-diagonal values. Fig. 8 shows the normalized confusion matrix for YOLOv8. It is evident from the figure that the model’s ability to predict fire and smoke is high, precisely, 95% and 98%, respectively.

Figure 8: Normalized confusion matrix for YOLOv8 validation
Fractal dimension is a rational geometric statistic providing the complexity detail in a pattern indicating “self-similarity”, in a normal Euclidean space. In essence, spatial dimensionality constrains the fractal dimension of the object it contains. A higher fractal dimension typically indicates more complex, intricate shapes, and vice versa. Since we are using 2D images, the 2D space constrains the fractal dimension of fire in a range between 1 and 2. 1D objects, like straight lines, can be covered with intervals, whereas 2D objects need to be covered with small boxes or tiles. In the realm of wildfires, fractal dimension methodologies like the box-counting method can be used to analyze how the embedding space is occupied by the fire pattern. Since the boundary of fire is highly irregular, being neither a 1D curve nor filling a complete tile in a 2D box, the overall fractal dimension of fire follows the power law, eventually ranging between 1 (for linear) and 2 (for surface).
The box-counting method is analogous to counting the boxes in a grid that cover a certain part of an image (or object of interest like fire in our case) over different dimensions. We use a box-counting fractal dimension methodology, wherein, with an increasing scale of analysis, or larger boxes; the fractal dimension generally decreases. This is because large boxes are less sensitive to fine details, leading to a less complicated structure at larger scales. Fractal properties of fire have been studied in the literature for stochastic modeling [29], suggesting its importance in determining the spread of fire.
We analyzed the fractal dimension based on varying box sizes, using the fine-tuning dataset, and the result is shown in Fig. 9. The result shows that the fractal dimension of the detected bounding boxes in the image broadly ranges between 1 and 2. A fractal dimension close to 1 indicates simpler, linear structures, while that closer to 2 suggests more complex, surface-like structures. Our result is therefore suggestive of some irregularity or roughness in fire and smoke patterns, indicating somewhat low dimensionality, unlike highly intricate or fractally detailed objects like ice or certain kinds of trees, etc.
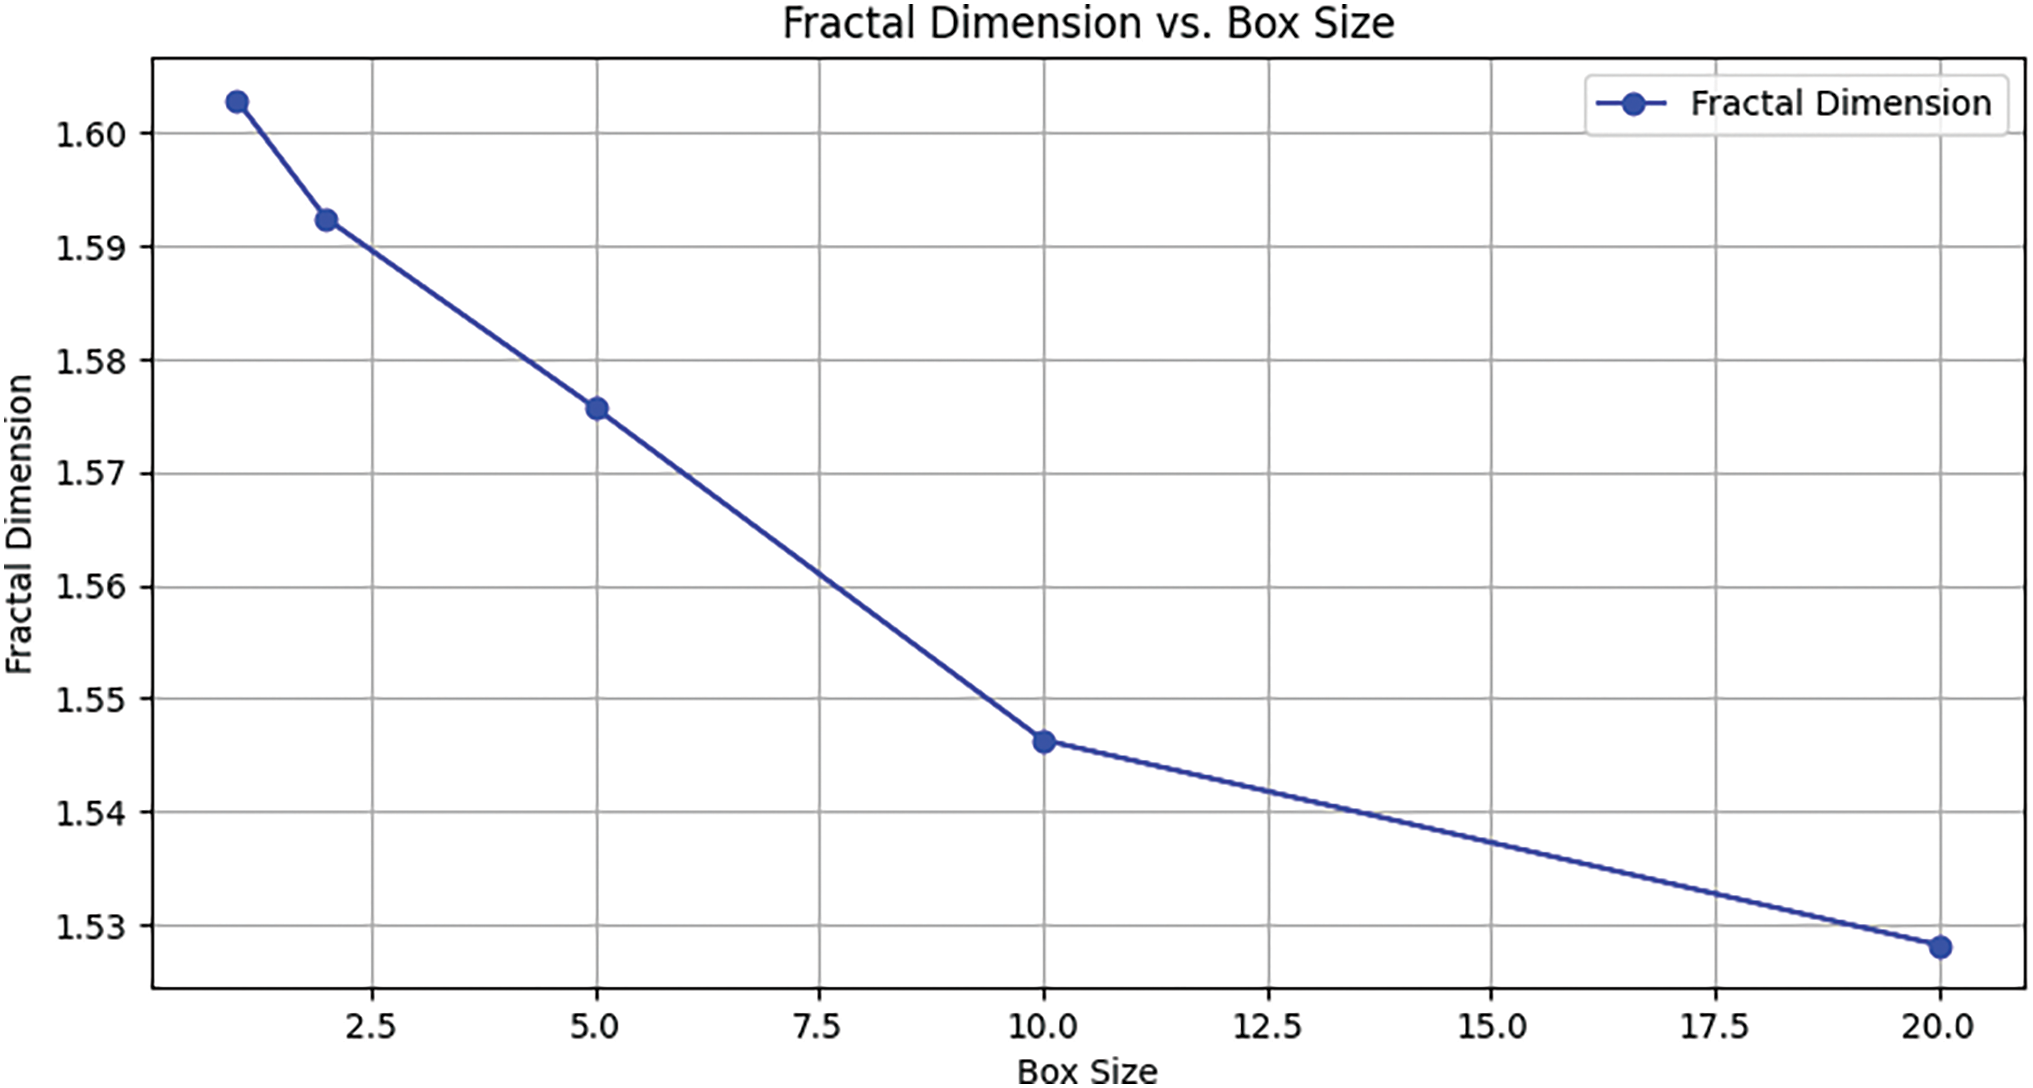
Figure 9: Results of fractal dimension based on varying box sizes
This somewhat fractal pattern in the spatial dimension of fire, clearly observed in the small box scenario, is a convincing argument for developing adaptive feature extraction strategies. It also advocates the use of efficient inference methodologies for a performance boost. We therefore study SAHI as an inference scheme to reap the benefits of fractal patterns. The result is also significant evidence to study fractal dimension as a useful metric to analyze fire spread. However, considerable value to human intervention and environmental conditions needs to be considered.
To improve the detection capability of our proposed YOLOv8 model further, we run SAHI inference [30] on the test dataset. We analyzed the slice size and overlap ratio using experiments with two window sizes, 64 × 64 and 128 × 128, and three overlap ratios, 1%, 10%, and 20%. We used a minimum confidence threshold of 50% to evaluate the mAP value. The results can be visualized from Fig. 10.
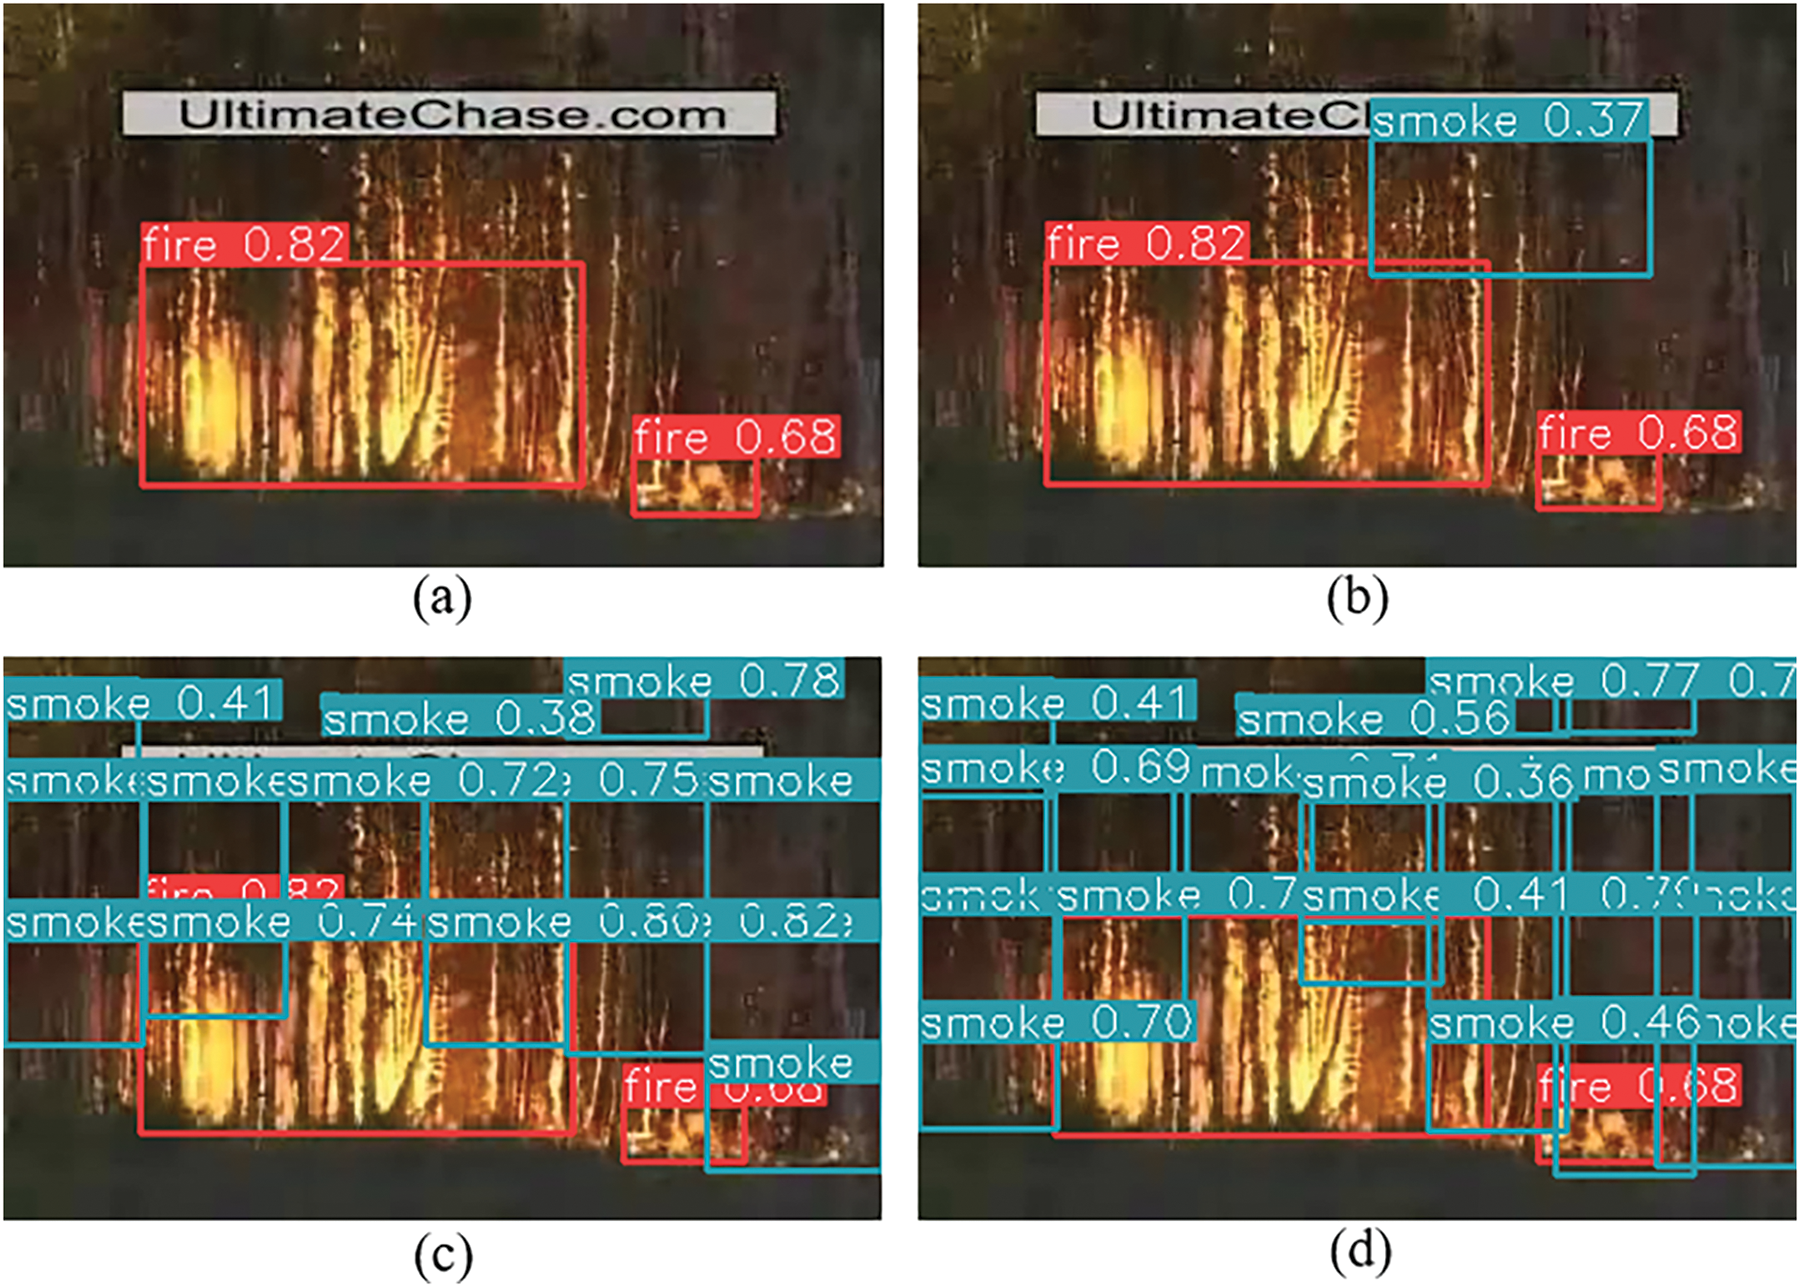
Figure 10: Results of SAHI inference for YOLOv8 validation. (a) SAHI inference with 12 slices each 128
Fig. 10a shows that 12 slices of 128 × 128, with 1% overlap, produced only 2 predictions, suggesting that with a large slice size and a minimal overlap ratio, the effectiveness of capturing boundary details becomes limited. The same 12 slices of 128 × 128 each and a 20% overlap in Fig. 10b, show 3 distinct predictions. The same can be inferred from Fig. 10c and d, where 28 and 35 slices each of 64
Following this approach, we get better performance of SAHI with 128 × 128 window size and 20% overlap, giving a mAP:50–95 value of 88%, as can be seen in Fig. 10b. It can hence be inferred that smaller slices with a moderate overlap ratio have the potential to enhance detection by providing finer details, enhanced detection across boundaries, better contextual integration, and fewer false positives. To achieve an optimal performance for small object detection, the dataset can be diversified with aerial and satellite images.
To evaluate the performance of SAHI, we use mAP (Eq. (10)), evaluated at multiple IoU thresholds like 0.5, and 0.5:0.95. It essentially penalizes the model with poor localization (low IoU). This is because mAP defines a strict criterion for counting true positives, by using a percentage of overlap between the predicted and ground truth bounding boxes. This allows for capturing both the quality of the bounding boxes and their classification accuracy.
Moreover, precision and recall, in isolation, can be misleading in case of class imbalance, by being skewed towards the class with more instances in the dataset. mAP, on the other hand, computes average precision across all classes, eradicating the bias toward the frequent classes and giving a more balanced evaluation. Since mAP captures the trade-offs between precision and recall across multiple IoU thresholds, we consider it for evaluating the performance of SAHI, and compare it to our baseline model in Table 5.
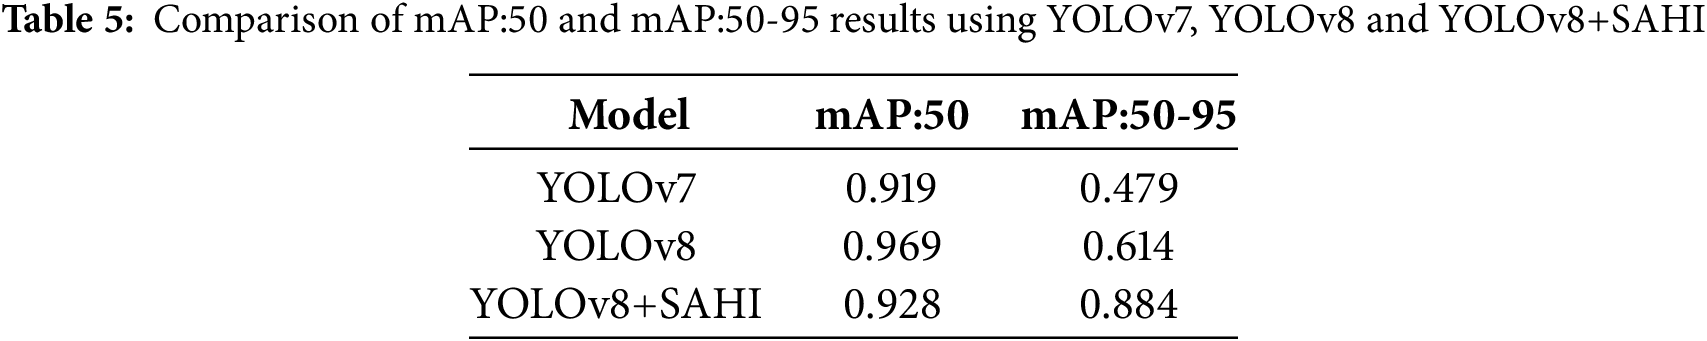
The results in Table 5 indicate a performance improvement and coherence of the proposed YOLOv8+SAHI model. The model gives consistently high performance with mAP:50 and mAP:50-95 being as high as 93% and 88%, respectively. This performance gap between the two metrics varies by more than 20% for both YOLOv7 and YOLOv8, under a high threshold of 50–95, indicating better performance under a high confidence threshold for YOLOv8+SAHI. The proposed model, therefore, provides reasonable evidence for successfully detecting small fires, and is a practically viable solution for real-time fire and smoke detection applications.
5 Research on Generative Models for Data Augmentation
To address the key challenges facing the fire and smoke detection use case, also highlighted in Table 1, we study the baseline using generative models for data augmentation to create a balanced dataset and for data augmentation. As a future work direction, generative adversarial networks (GAN) [31] and diffusion models can be used to increase the dataset size.
The current data augmentation techniques can increase the dataset size but they are limited to changing the dataset already available, incapable of generalization. With the dataset used for this study, we used deep convolutional generative adversarial network (DCGAN) [32] to generate a diverse and generalizable dataset, as shown in Fig. 11.
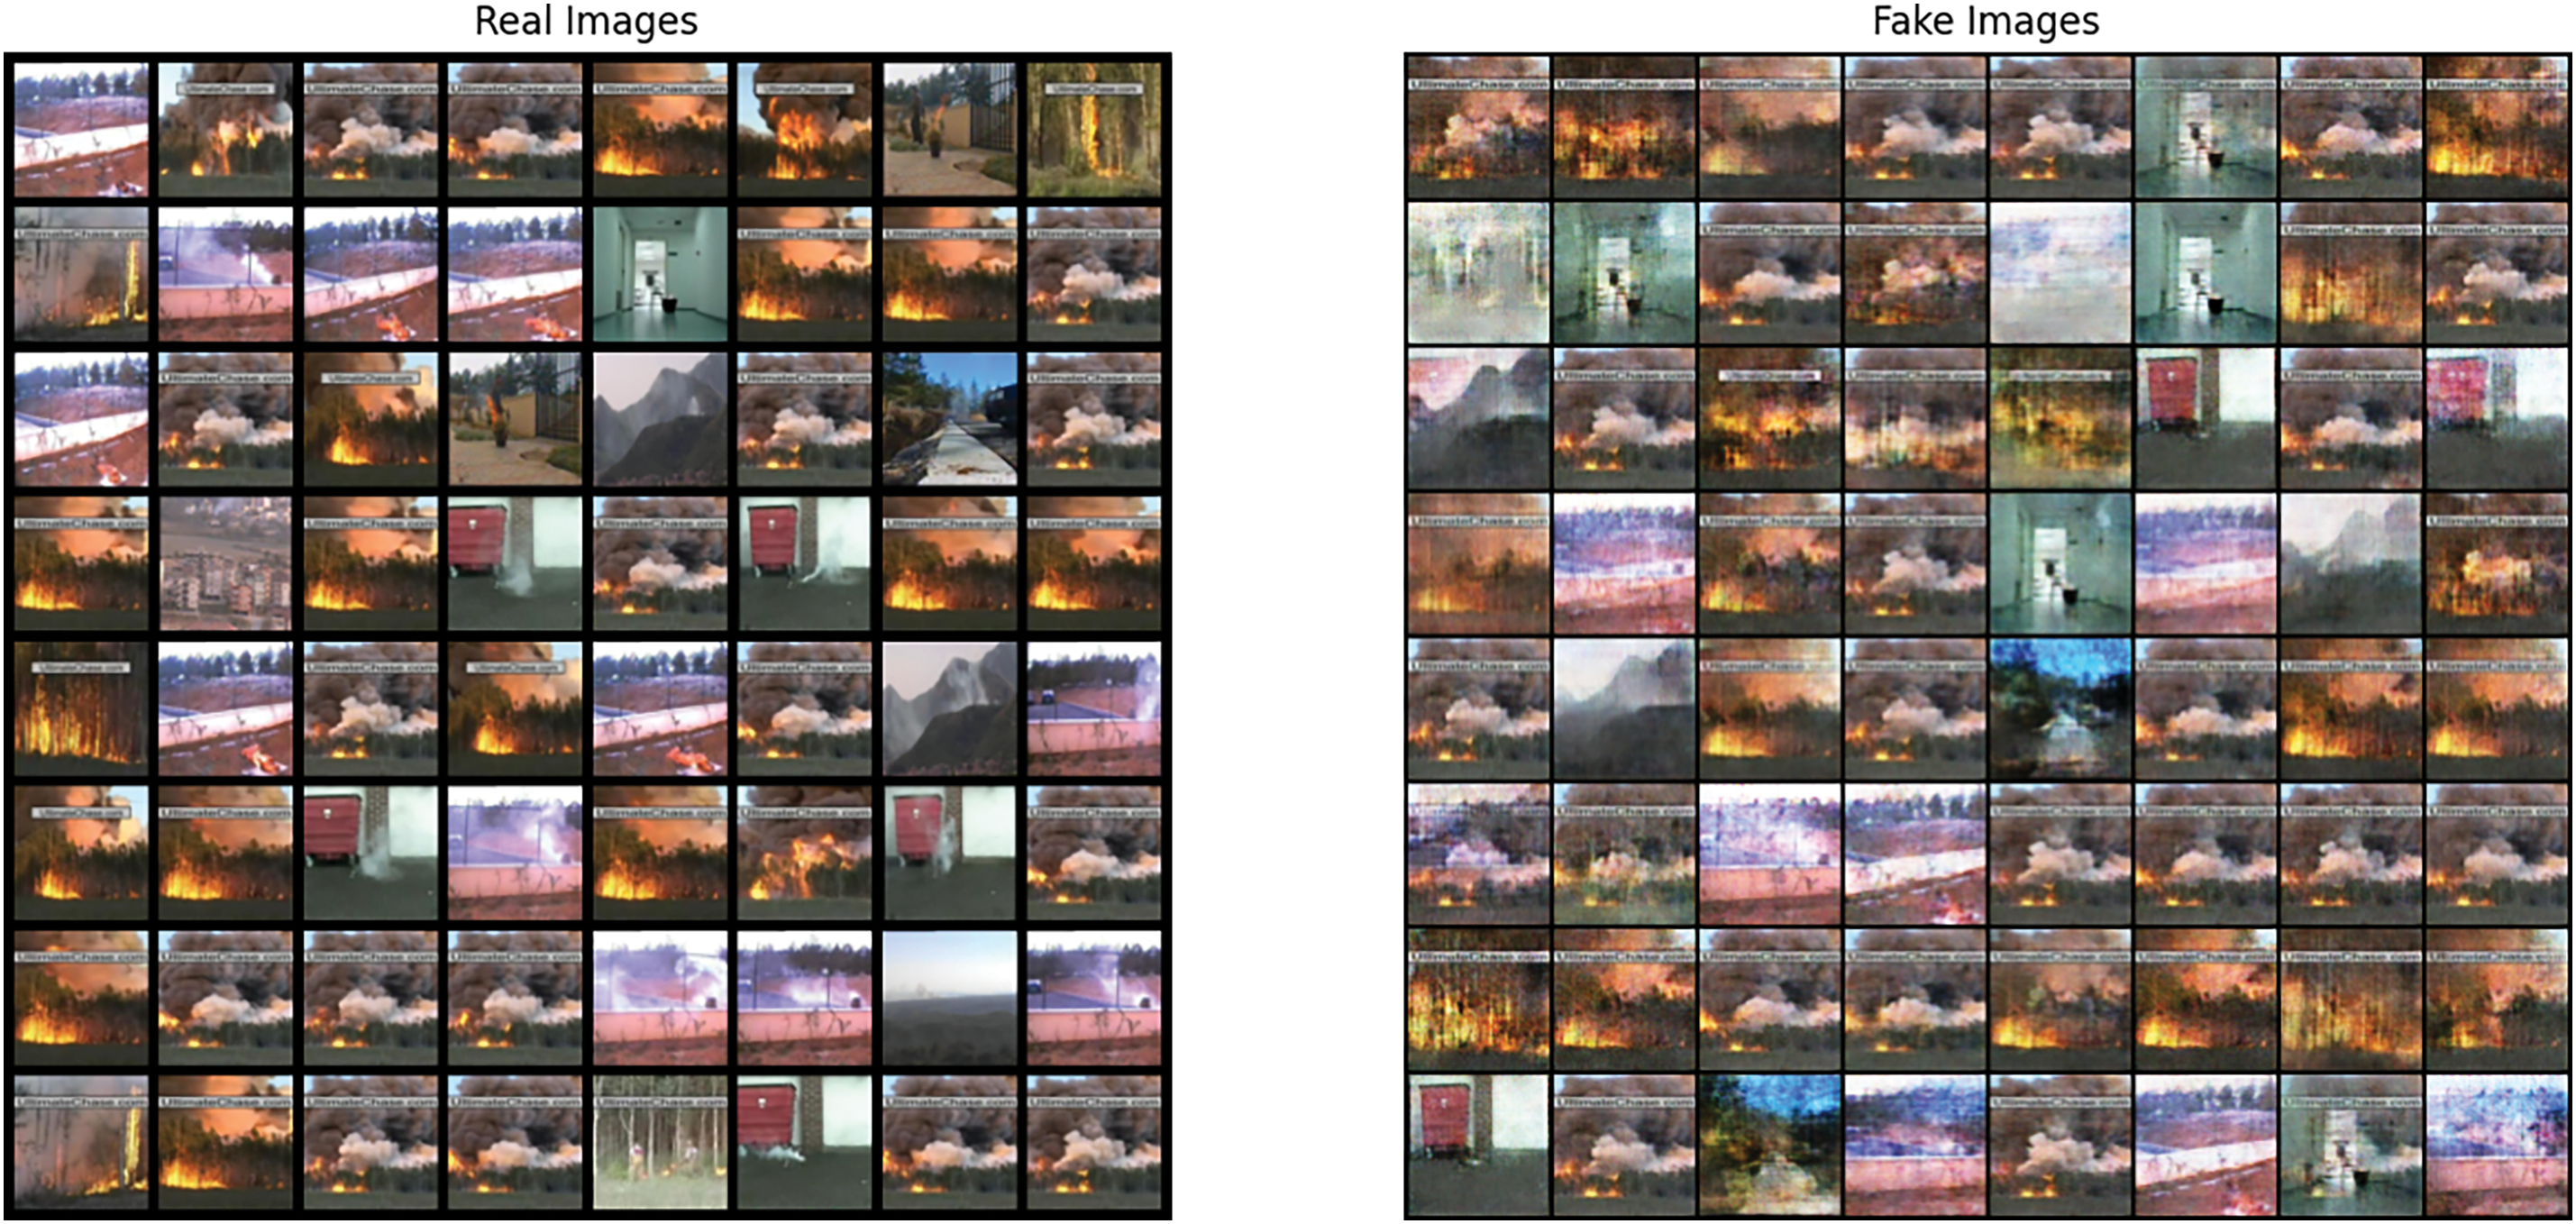
Figure 11: Images generated using DCGAN trained for 500 epochs
The objective function of GAN,
Training a DCGAN works with a generator, G, that creates realistic image samples, and a discriminator, D, that learns to distinguish between the real and the generated samples, in an adversarial manner. Eq. (9) has 2 terms:
We used the PyTroch framework for DCGAN implementation with the same dataset explained in Section 3, and hardware specification from Section 2.2. The model was configured with a batch size of 128 and a learning rate of 0.0002. The size of the feature map in the generator and discriminator has been set to 64, for the sake of analysis. Fig. 12 gives an overview of how the generator and discriminator loss were minimized over 50, 100, 200, and 500 epochs.
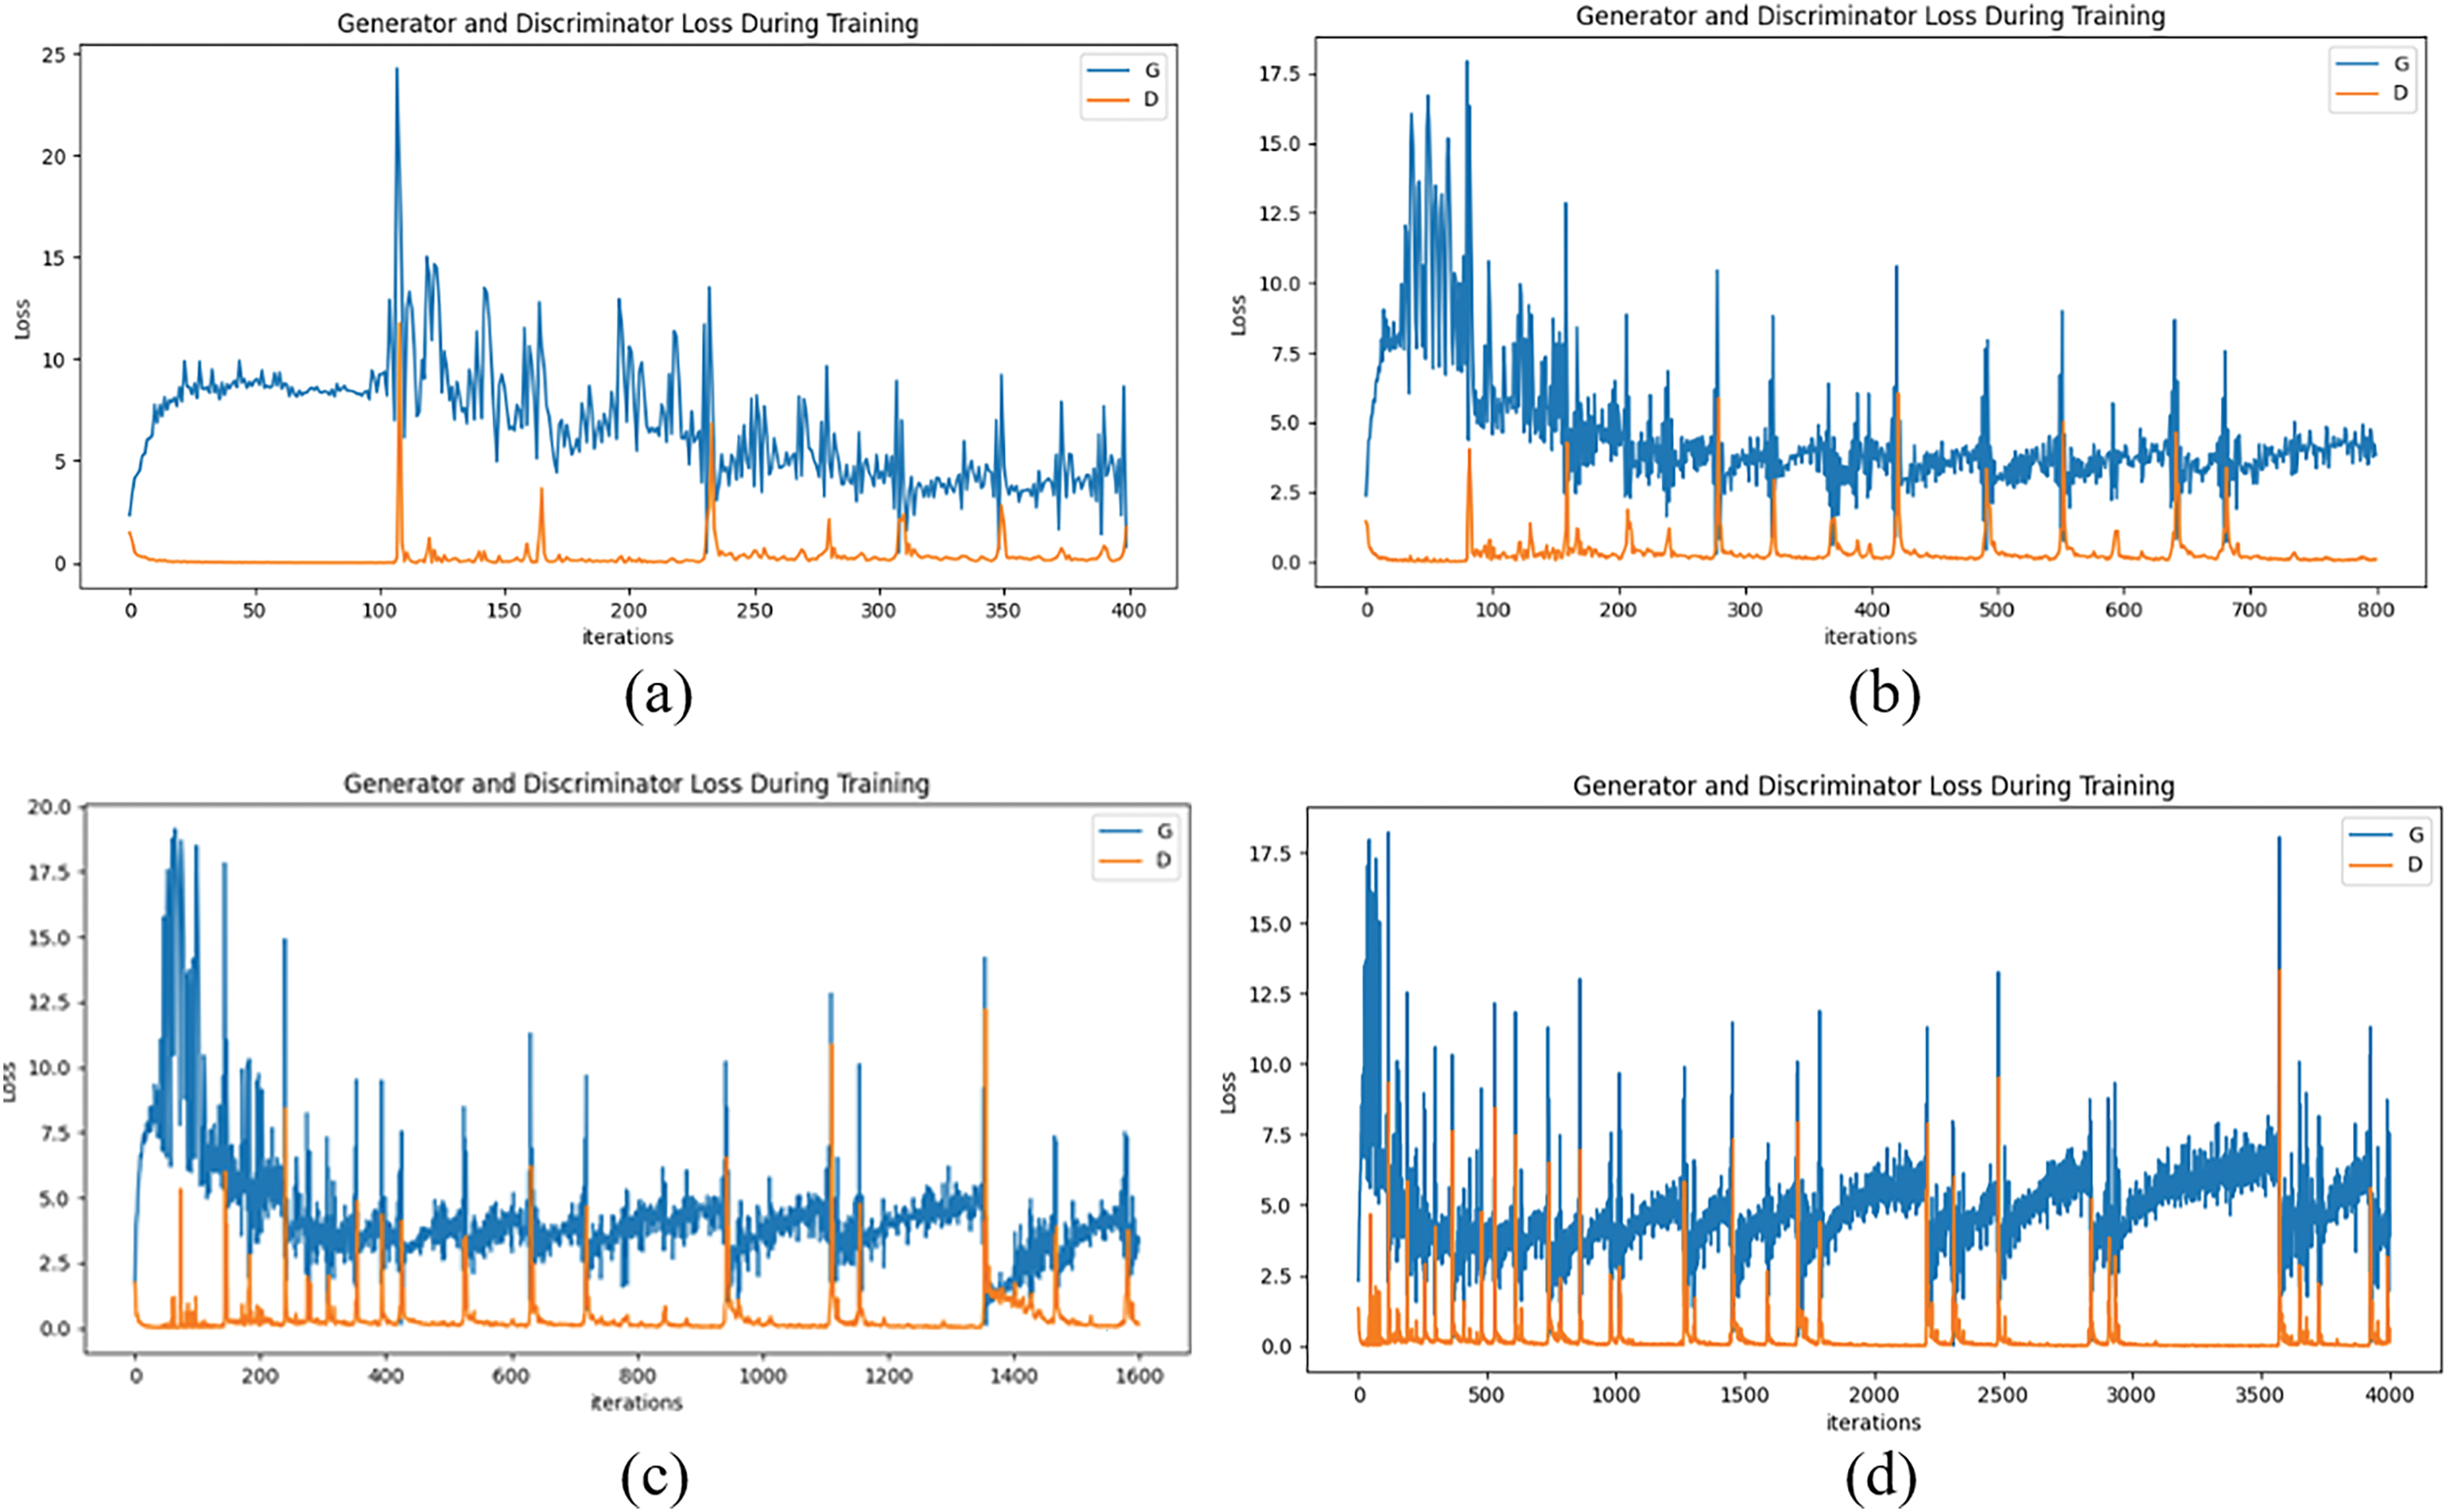
Figure 12: Minimizing the objective function of DCGAN with loss on the y-axis and iteration corresponding to number of epochs along the x-axis. (a) 50 epochs. (b) 100 epochs, (c) 200 epochs, (d) 500 epochs
By leveraging DCGAN to generate a dataset with minimal generator-discriminator loss, the YOLOv8 model can be trained and its performance can be evaluated as a future work direction.
Diffusion models are a class of generative models, which operate using a step-by-step diffusion of a series of random noises [33]. They employ a Markov chain to iteratively add and reverse Gaussian noise to data, and generate high-quality synthetic images. Utilizing the impressive capabilities of uniting the forces of large language models (LLMs) and diffusion models, text-to-image generation can be studied for improving data augmentation for fire and smoke detection.
We used pre-trained Stable Diffusion version 1–4, which is a latent diffusion model for text-to-image generation, from Hugging Face. The potential of the base model can be evaluated with a fine-tuned version, to explore its potential as a data augmentation candidate for efficient fire and smoke detection. Fig. 13 shows some representative images generated using stable diffusion.
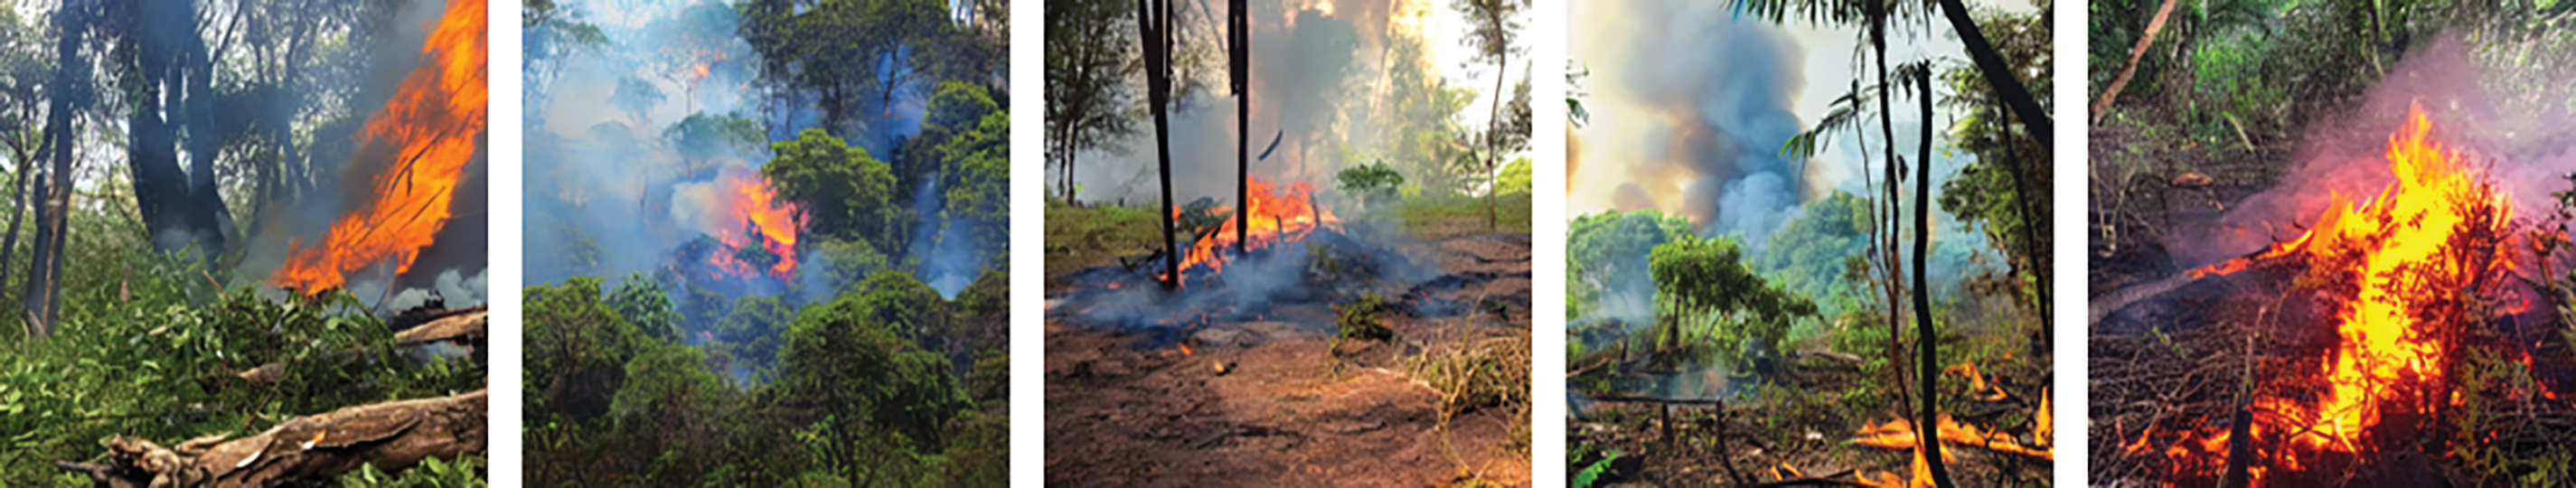
Figure 13: Image samples of forest fire, generated using stable diffusion
Diffusion models can be explored as a promising future work direction for data augmentation to improve the performance of fire detection.
In this paper, we have formulated a fire and smoke detection methodology based on YOLOv8 using a balanced dataset. We statistically analyzed our dataset and showed enhanced training results using a class-balanced approach compared to earlier research work. We analyzed the fractal dimension of fire and showed that the repetitive patterns in a fire can be leveraged for better feature extraction using a windowing-based inference technique. Our proposed slicing-based inference approach, SAHI, shows significant potential to improve the detection capability of our fire detection model. Our model is lightweight and straightforward and can be extended into real-world applications. Due to the absence of any work reported using SAHI inference with YOLOv8 for fire and smoke detection, our work can be used as a baseline for extensions into practical fire and smoke detection systems. We further provide baseline studies and promising future work direction using DCGAN and diffusion models to generate images and produce high-quality, diverse, and generalizable fire and smoke detection datasets. These can be used for data augmentation and can be rendered to realize high-performance fire and smoke detection models.
Acknowledgement: Not applicable.
Funding Statement: This research was supported by a grant from R&D Program Development of Rail-Specific Digital Resource Technology Based on an AI-Enabled Rail Support Platform, grant number PK2401C1, of the Korea Railroad Research Institute.
Author Contributions: The authors confirm contribution to the paper as follows: study conception and design: Mariam Ishtiaq and Jong-Un Won; data collection: Mariam Ishtiaq and analysis and interpretation of results: Mariam Ishtiaq; draft manuscript preparation: Mariam Ishtiaq and Jong-Un Won. All authors reviewed the results and approved the final version of the manuscript.
Availability of Data and Materials: The data that support the findings of this study are available from the corresponding author, Jong-Un Won, upon reasonable request.
Ethics Approval: Not applicable.
Conflicts of Interest: The authors declare no conflicts of interest to report regarding the present study.
Abbreviations
| BCE | Balanced cross-entropy |
| CSP | Cross-stage partial |
| DCGAN | Deep convolutional generative adversarial network |
| FN | False negative |
| FP | False positive |
| GAN | Generative adversarial network |
| IoT | Internet of things |
| IoU | Intersection over union |
| mAP | Mean average precision |
| NMS | Non-maximal suppression |
| PANet | Path aggregation network |
| SAHI | Slicing-aided hyper inference |
| SOTA | State-of-the-art |
| TN | True negative |
| TP | True positive |
| YOLO | Yolo only look once |
References
1. Hayashi Y, Akimoto Y, Hiramatsu N, Masunishi K, Saito T, Yamazaki H, et al. Smoldering fire detection using low-power capacitive MEMS hydrogen sensor for future fire alarm. J Micromech Microeng. 2023;33(10):105006. doi:10.1088/1361-6439/acec80. [Google Scholar] [CrossRef]
2. Shcherbyna V, Maksymova S, Yevsieiev V. Mobile robot for fires detection development; 2023 [cited 2024 Sep 6]. Available from: https://openarchive.nure.ua/handle/document/27491. [Google Scholar]
3. Morchid A, Jebabra R, Ismail A, Khalid HM, El Alami R, Qjidaa H, et al. IoT-enabled fire detection for sustainable agriculture: a real-time system using flask and embedded technologies. Results Eng. 2024 Sep 1;23(1):102705. doi:10.1016/j.rineng.2024.102705. [Google Scholar] [CrossRef]
4. Kim HC, Lam HK, Lee SH, Ok SY. Early fire detection system by using automatic synthetic dataset generation model based on digital twins. Appl Sci. 2024 Jan;14(5):1801. doi:10.3390/app14051801. [Google Scholar] [CrossRef]
5. Yar H, Khan ZA, Rida I, Ullah W, Kim MJ, Baik SW. An efficient deep learning architecture for effective fire detection in smart surveillance. Image Vis Comput. 2024 May 1;145(1):104989. doi:10.1016/j.imavis.2024.104989. [Google Scholar] [CrossRef]
6. Rosu IA, Grillakis M, Papadopoulos A, Agop M, Voulgarakis A. Fractal and spectral analysis of recent wildfire scars in Greece. Fire Technol. 2024 Jan 1;60(1):167–92. doi:10.1007/s10694-023-01497-2. [Google Scholar] [CrossRef]
7. Li T, Zhao E, Zhang J, Hu C. Detection of wildfire smoke images based on a densely dilated convolutional network. Electronics. 2019 Oct;8(10):1131. doi:10.3390/electronics8101131. [Google Scholar] [CrossRef]
8. Yang Y, Mirzaei G. Performance analysis of data resampling on class imbalance and classification techniques on multi-omics data for cancer classification. PLoS One. 2024 Feb 29;19(2):e0293607. [Google Scholar]
9. Kumar A, Perrusquía A, Al-Rubaye S, Guo W. Wildfire and smoke early detection for drone applications: a light-weight deep learning approach. Eng Appl Artif Intell. 2024 Oct 1;136(19):108977. doi:10.1016/j.engappai.2024.108977. [Google Scholar] [CrossRef]
10. Sun X, Yu Y, Cheng Q. Robust and discriminative feature learning via mutual information maximization for object detection in aerial images. Comput Mater Contin. 2024;80(3):4149–71. doi:10.32604/cmc.2024.052725. [Google Scholar] [CrossRef]
11. Ding Z, Sun L, Mao X, Dai L, Ding R. Improving transferable targeted adversarial attack for object detection using RCEN framework and logit loss optimization. Comput Mater Contin. 2024;80(3):4387–412. doi:10.32604/cmc.2024.052196. [Google Scholar] [CrossRef]
12. ultralytics/docs/en/models/yolov7.md at main · ultralytics/ultralytics · GitHub [Internet]. [cited 2024 Sep 13]. Available from: https://github.com/ultralytics/ultralytics/blob/main/docs/en/models/yolov7.md. [Google Scholar]
13. Jocher G, Chaurasia A, Qiu J. Ultralytics YOLO [Internet]; 2023 [cited 2024 Sep 13]. Available from: https://github.com/ultralytics/ultralytics. [Google Scholar]
14. Sensors | free full-text | an improved wildfire smoke detection based on YOLOv8 and UAV images [Internet]. [cited 2024 Sep 13]. Available from: https://www.mdpi.com/1424-8220/23/20/8374. [Google Scholar]
15. Ma S, Li W, Wan L, Zhang G. A lightweight fire detection algorithm based on the improved YOLOv8 model. Appl Sci. 2024 Jan;14(16):6878. doi:10.3390/app14166878. [Google Scholar] [CrossRef]
16. Bhanbhro H, Hooi Y, Nordin M, Kusakunniran W, Amur Z. MCBAN: a small object detection multi-convolutional block attention network. Comput Mater Contin. 2024;81(2):2243–59. doi:10.32604/cmc.2024.052138. [Google Scholar] [CrossRef]
17. Gia BT, Bui Cong Khanh T, Trong HH, Tran Doan T, Do T, Le DD, et al. Enhancing road object detection in fisheye cameras: an effective framework integrating SAHI and hybrid inference. In: IEEE/CVF Conference on Computer Vision and Pattern Recognition Workshops (CVPRW); 2024 Nov 11; Seattle, WA, USA: IEEE. p. 7227–35. [Google Scholar]
18. Muzammul M, Algarni A, Ghadi YY, Assam M. Enhancing UAV aerial image analysis: integrating advanced SAHI techniques with real-time detection models on the VisDrone dataset. IEEE Access. 2024;12(2):21621–33. doi:10.1109/ACCESS.2024.3363413. [Google Scholar] [CrossRef]
19. Torabian M, Pourghassem H, Mahdavi-Nasab H. Fire detection based on fractal analysis and spatio-temporal features. Fire Technol. 2021 Sep 1;57(5):2583–614. doi:10.1007/s10694-021-01129-7. [Google Scholar] [CrossRef]
20. Casas E, Ramos L, Bendek E, Rivas F. Assessing the effectiveness of YOLO architectures for smoke and wildfire detection. IEEE Access. 2023 Sep 5;11:96554–83. doi:10.1109/ACCESS.2023.3312217. [Google Scholar] [CrossRef]
21. Chetoui M, Akhloufi MA. Fire and smoke detection using fine-tuned YOLOv8 and YOLOv7 deep models. Fire. 2024;7(4):135. doi:10.3390/fire7040135. [Google Scholar] [CrossRef]
22. Li Y, Zhang W, Liu Y, Jin Y. A visualized fire detection method based on convolutional neural network beyond anchor. Appl Intell. 2022 Sep 1;52(11):13280–95. doi:10.1007/s10489-022-03243-7. [Google Scholar] [CrossRef]
23. Casas E, Ramos L, Bendek E, Rivas-Echeverria F. YOLOv5 vs. YOLOv8: performance benchmarking in wildfire and smoke detection scenarios. J Image Graph. 2024;12(2):127–36. doi:10.18178/joig.12.2.127-136. [Google Scholar] [CrossRef]
24. A probabilistic approach for vision-based fire detection in videos [Internet]. [cited 2024 Sep 13]. Available from: https://ieeexplore.ieee.org/abstract/document/5430942. [Google Scholar]
25. Lv C, Zhou H, Chen Y, Fan D, Di F. A lightweight fire detection algorithm for small targets based on YOLOv5s. Sci Rep. 2024 Jun 19;14(1):14104. doi:10.1038/s41598-024-64934-4. [Google Scholar] [PubMed] [CrossRef]
26. Hsiao YT, Sheu JS, Ma H. Efficient object detection and intelligent information display using YOLOv4-tiny. Adv Technol Innov. 2024 Jan 1;9(1):42–9. doi:10.46604/aiti.2023.12682. [Google Scholar] [CrossRef]
27. CF-YOLO: a capable forest fire identification algorithm founded on YOLOv7 improvement | signal, image and video processing [Internet]. [cited 2024 Jul 30]. Available from: https://link.springer.com/article/10.1007/s11760-024-03288-w. [Google Scholar]
28. Fire | Free Full-Text | CNTCB-YOLOv7: an effective forest fire detection model based on ConvNeXtV2 and CBAM [Internet]. [cited 2024 Jul 30]. Available from: https://www.mdpi.com/2571-6255/7/2/54. [Google Scholar]
29. Alvarez Masdeu JA. Fractals in the propagation of forest fires and stochastic models. [Bachelor’s thesis]. Barcelona: Universitat de Barcelona; 2023 Jun. Available from: https://hdl.handle.net/2445/200813. [Google Scholar]
30. Akyon FC, Altinuc SO, Temizel A. aSlicing aided hyper inference and fine-tuning for small object detection. arXiv:2202.06934v5. 2022. [Google Scholar]
31. Goodfellow IJ, Pouget-Abadie J, Mirza M, Xu B, Warde-Farley D, Ozair S, et al. Generative adversarial networks. arXiv:1406.2661v1. 2014. [Google Scholar]
32. DCGAN based data generation for process monitoring [Internet]. [cited 2024 Sep 13]. Available from: https://ieeexplore.ieee.org/document/8908922. [Google Scholar]
33. Rombach R, Blattmann A, Lorenz D, Esser P, Ommer B. High-resolution image synthesis with latent diffusion models. arXiv:2112.10752. 2022. [Google Scholar]
Cite This Article
 Copyright © 2025 The Author(s). Published by Tech Science Press.
This work is licensed under a Creative Commons Attribution 4.0 International License , which permits unrestricted use, distribution, and reproduction in any medium, provided the original work is properly cited.
 Downloads
 Citation Tools