
 Submit a Paper
 Propose a Special lssue
 Open Access
ARTICLE
Advancing Railway Infrastructure Monitoring: A Case Study on Railway Pole Detection
School of Electronics and Communication Engineering, Shenzhen Campus of Sun Yat-sen University, Shenzhen, 518107, China
* Corresponding Author: Liang Wang. Email:
Computers, Materials & Continua 2025, 83(2), 3059-3073. https://doi.org/10.32604/cmc.2024.057949
Received 31 August 2024; Accepted 27 November 2024; Issue published 16 April 2025
 View Full Text
 Download PDF
Abstract
The development of artificial intelligence (AI) technologies creates a great chance for the iteration of railway monitoring. This paper proposes a comprehensive method for railway utility pole detection. The framework of this paper on railway systems consists of two parts: point cloud preprocessing and railway utility pole detection. This method overcomes the challenges of dynamic environment adaptability, reliance on lighting conditions, sensitivity to weather and environmental conditions, and visual occlusion issues present in 2D images and videos, which utilize mobile LiDAR (Laser Radar) acquisition devices to obtain point cloud data. Due to factors such as acquisition equipment and environmental conditions, there is a significant amount of noise interference in the point cloud data, affecting subsequent detection tasks. We designed a Dual-Region Adaptive Point Cloud Preprocessing method, which divides the railway point cloud data into track and non-track regions. The track region undergoes projection dimensionality reduction, with the projected results being unique and subsequently subjected to 2D density clustering, greatly reducing data computation volume. The non-track region undergoes PCA-based dimensionality reduction and clustering operations to achieve preprocessing of large-scale point cloud scenes. Finally, the preprocessed results are used for training, achieving higher accuracy in utility pole detection and data communication. Experimental results show that our proposed preprocessing method not only improves efficiency but also enhances detection accuracy.Keywords
In recent years, with the continuous development of railways in China, the operating mileage of railways in China has reached 159,000 km, including 45,000 km of high-speed rail. The immense railway network brings a high level of management complexity [1].
Railways are a comprehensive system influenced by various factors, which can be categorized into equipment-related and human-related factors. Equipment-related factors mainly include train equipment and railway infrastructure, such as utility poles, railway electrical boxes, and issues like the aging or damage of contact networks. Human-related factors primarily involve illegal intrusions by pedestrians. The aging or damage of utility poles can severely jeopardize train operations [2], necessitating the positioning and identification of utility poles. Currently, the inspection of railway utility poles mainly relies on manual inspections, which are inefficient and time-consuming.
In the new era, with the development of AI (artificial intelligence), object detection has gradually replaced manual inspection methods. Object detection is a crucial aspect of computer vision, used for the identification and localization of one or multiple objects. In the railway field, AI is primarily used for rail detection [3,4], rail transit detection [5], railway foreign object detection [6,7], and ballast detection [8], with little focus on utility pole detection.
The framework of this paper on railway can be divided into two parts: detection based on 2D images and detection based on point cloud data. Video sequence-based detection methods typically involve installing video equipment on high-speed trains to capture the environmental conditions along the railway. In recent years, with the development of AI, detecting each frame from large-scale video images has become feasible, enabling the monitoring of anomalies in railway infrastructure. For example, Jiang et al. [9] constructed a rectangular sampling area with dynamic width for each video frame, obtaining a panoramic image through image stitching for detection. Duan et al. [10] improved YOLOV5, using a hyperbolic scatter panoramic imaging system to adapt to dark scenes like tunnels. Others [11] have mounted cameras on drones to monitor railway infrastructure.
Despite providing powerful tools for the railway industry, image detection technology has significant shortcomings in dynamic environment adaptability. However, point cloud data allows for a digital three-dimensional representation of the environment, enabling the automated study of its geometric shapes. Currently, the mainstream acquisition methods include Mobile Laser Scanning (MLS) [12,13], Geographic Information Systems (GIS) [14,15], and Building Information Modeling (BIM) [16,17]. MLS has advantages in railway scenarios due to its mobility, which allows for data collection during the movements on fixed railway lines, significantly improving data collection efficiency. Additionally, since the measurement process does not require personnel to be in close proximity to the railway lines, it enhances the safety of the measurement process.
At present, 3D point cloud-based object detection is widely used in fields such as autonomous driving [18–20] and construction [21]. 3D point cloud detection provides millimeter-level accuracy, which is crucial for identifying issues with railway utility poles. Using 3D point clouds can capture detailed three-dimensional shapes of utility poles and offers significant advantages in dealing with adverse weather and complex terrain.
In railway scenarios, LiDAR technology, with its high accuracy, efficiency, and unaffected performance under various weather conditions and complex road conditions, provides robust technical support for railway planning, construction, and maintenance, greatly improving the accuracy and efficiency of work. Therefore, we propose the Dual-Region Adaptive Point Cloud Preprocessing (DAPCP) detection system, with the following contributions:
1. This study adopts three-dimensional point cloud data technology to replace traditional image processing methods for object detection, effectively overcoming the negative impact of extreme weather conditions and complex terrain on detection accuracy, and significantly improving the stability and reliability of detection results.
2. We designed and implemented the Dual-Region Adaptive Point Cloud Preprocessing (DAPCP), which is a point cloud preprocessing module suitable for large-scale railway scenarios. This module partitions the railway scene dataset into track and non-track regions, optimizing the efficiency and accuracy of subsequent processing workflows and laying the foundation for generating high-quality point cloud data.
In recent years, the integration of 3D detection technology with railway systems has become a cutting-edge and highly applied research field in science and engineering. 3D detection technology typically utilizes LiDAR, laser scanners, or similar imaging technologies to capture the external shape and spatial position information of objects or environments. The principle involves obtaining the distance between the emission point and the target, combined with the position and posture of the laser emission point, to jointly solve and obtain the three-dimensional point cloud of the target area [22]. In current railway detection tasks, the main issues are concentrated on point cloud segmentation and track anomaly detection.
Yang et al. [23] proposed using denser features to better detect track surface texture defects. Yang et al. [24] introduced an unsupervised detection method for railway tracks, detecting foreign objects by learning the similarity between normal objects and their corresponding regions.
Presently, the main issues with railway utility poles include the risk of damage or anomalies in sections with increased railway mileage and prolonged usage. Most object detection methods in the literature rely on manual inspections and video-based methods. These methods have drawbacks, such as being easily influenced by environmental and human factors, and often fail to accurately detect issues with utility poles. Therefore, precise measurement and data acquisition using LiDAR have become indispensable in current railway construction and maintenance fields [25].
To address the challenges posed by noisy point cloud data (Fig. 1) and to simplify the data, we need to filter out unnecessary points to avoid wasting resources on irrelevant data in detection tasks. Enhancing detection speed and accuracy ensures that the final results are more precise and effective. Noise points and irrelevant points in detection tasks are often characterized by their outlier and sparse nature. Currently, the field of point cloud denoising employs methods such as Statistical Outlier Removal (SOR) filters [26], bilateral filtering [27], and density clustering [28]. However, these methods are generally suitable for low-density, simple environments and perform poorly in high-density, complex environments.
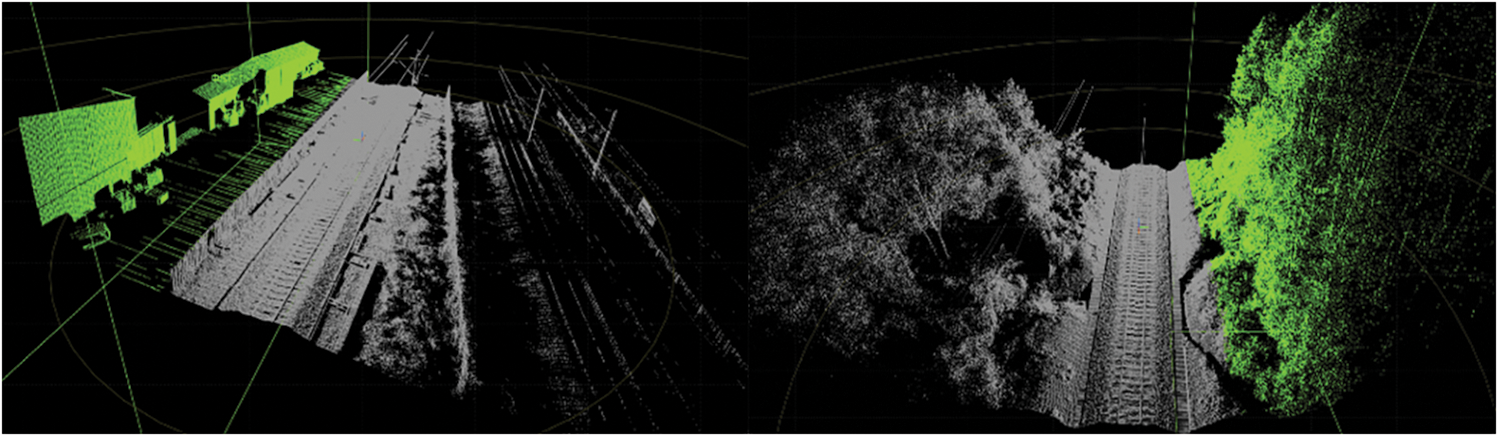
Figure 1: Railway point cloud data
To fundamentally address the complexity and noise in point cloud data, we propose the Dual-Region Adaptive Point Cloud Preprocessing (DAPCP) method. The workflow of this method is illustrated in Fig. 2. This method is developed based on the characteristics of railway point cloud data and meets the requirements for processing large-scale point cloud data in railway scenarios.
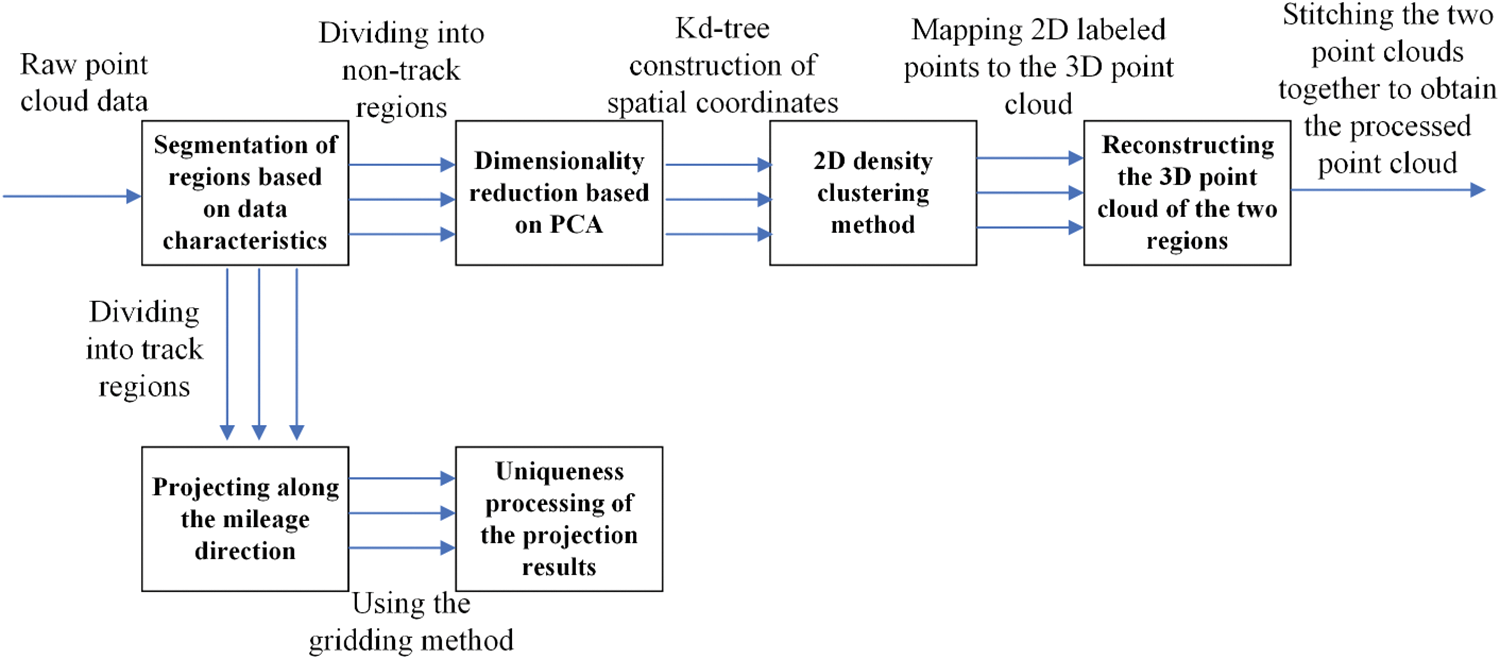
Figure 2: Dual-region adaptive point cloud preprocessing flowchart
In this paper, we designed a preprocessing method specifically tailored for railway detection. This approach divides the railway scene into two regions: track and non-track regions. For these two regions, we perform denoising and data simplification operations separately to facilitate subsequent analysis and application. This method not only significantly reduces the complexity of data processing but also speeds up detection and improves accuracy.
3.1 Track Region Point Cloud Denoising
In this study, we use Mobile Laser Scanning (MLS) to obtain point cloud data and segment it into two main regions—track and non-track regions. When processing the track region point cloud, we project it along the mileage direction based on the characteristics of the railway scene. This projection helps in simplifying the data and enhancing the efficiency and accuracy of subsequent processing steps. This module can be illustrated in Fig. 3, where (a) shows the original point cloud data and (b) shows the projected point cloud data.
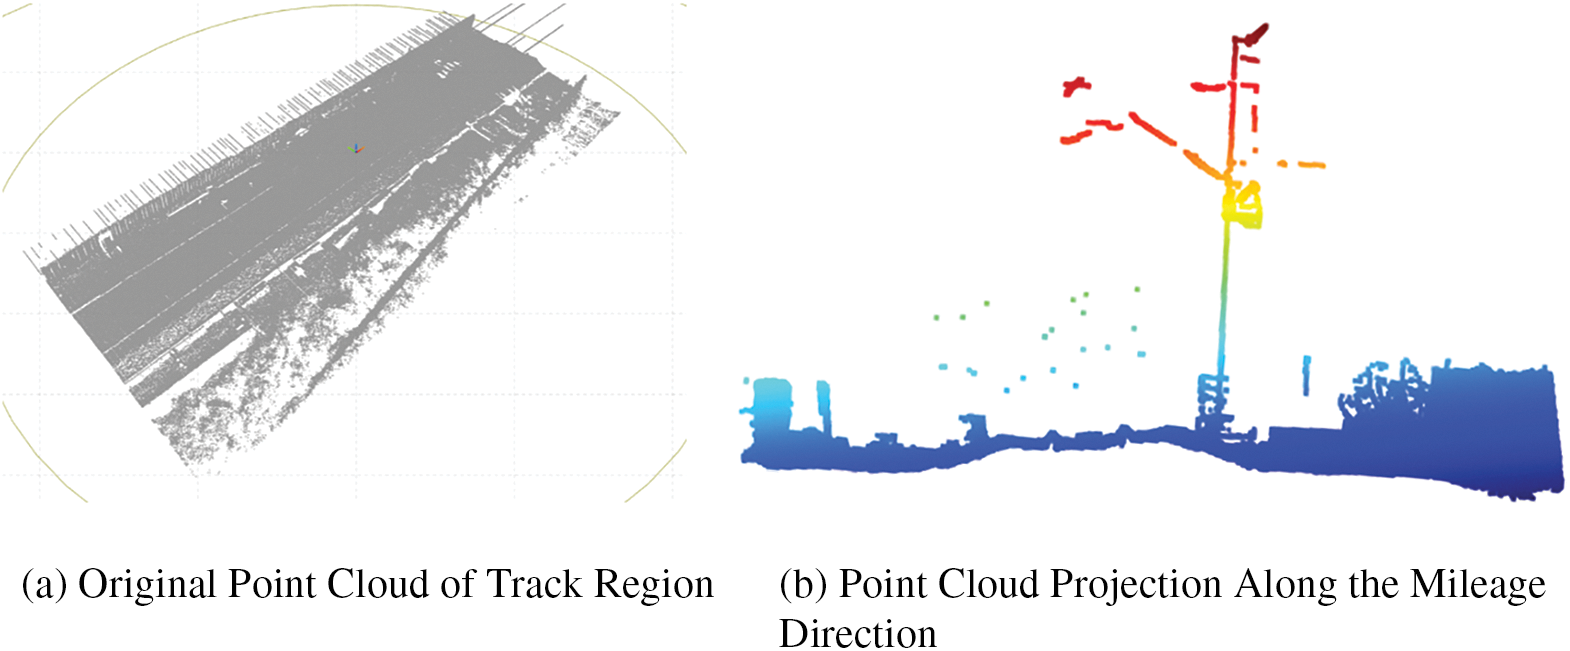
Figure 3: Track region point cloud
The uniqueness algorithm is mainly based on the following criterion, set
Here, [*] denotes the floor operation. Fig. 4 illustrates the division of the track area using the grid method.
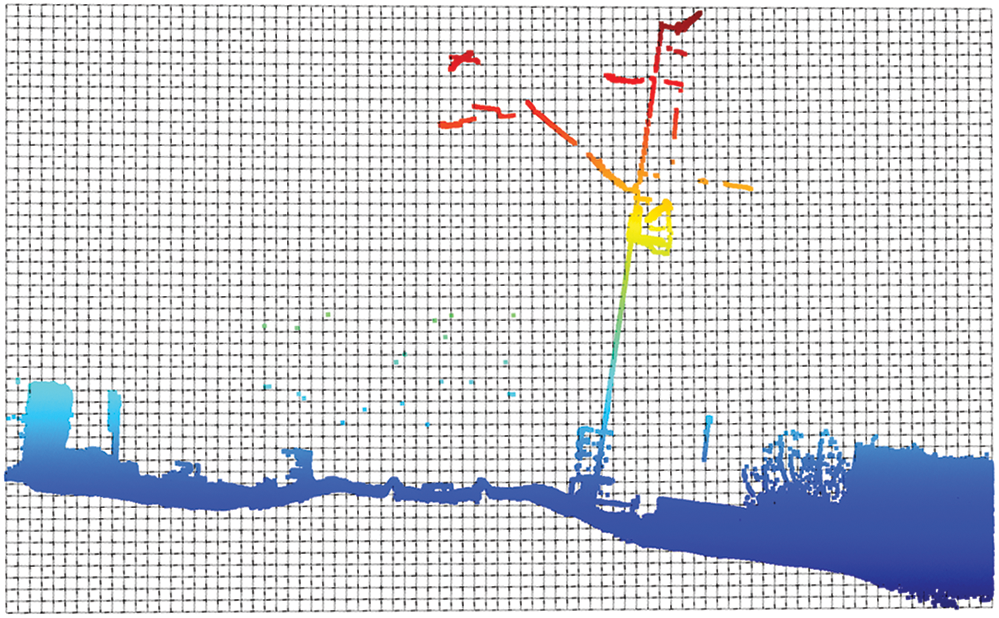
Figure 4: Grid method for unique point cloud division in the track region
By performing two-dimensional density clustering on unique point clouds, noise in the two-dimensional images is turned red. Subsequently, these marked noise points are reintroduced into the original high-dimensional data set. This approach, on the one hand, maintains the integrity of the data while, on the other hand, achieves noise elimination in a more precise manner. The denoising effect is shown in Fig. 5.
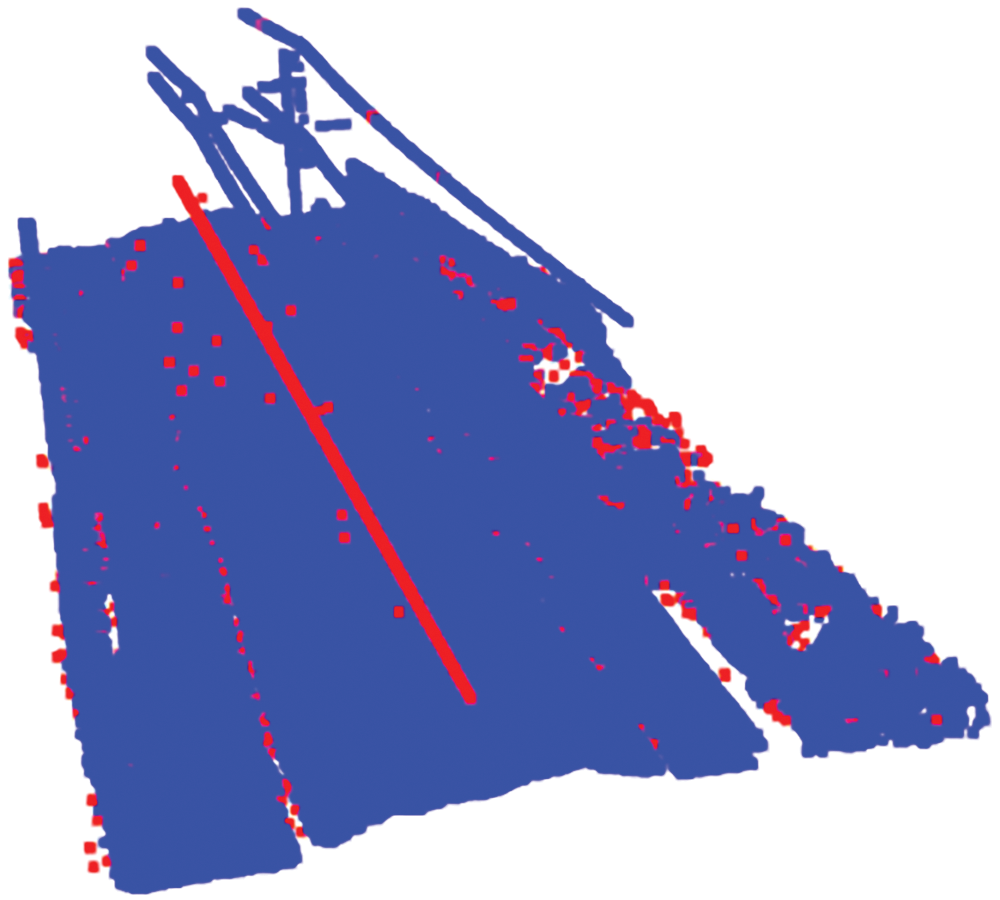
Figure 5: Denoising effect in the track region
By using density clustering methods, all point cloud data is divided more clearly into normal points and outliers. In the track region, outliers typically represent some degree of data deviation, affecting the final detection results.
3.2 Simplification of Point Cloud Data in Non-Track Regions
3.2.1 PCA-Based Dimensionality Reduction Method
Principal Component Analysis (PCA) [29] is a statistical method aimed at reducing the dimensionality of data while retaining as much information as possible from the original dataset. Before performing PCA, it is usually necessary to center the point cloud data, which involves subtracting the mean of each variable, so that the dataset has a mean of zero. Using the centralized data matrix X, which contains the point cloud values and three features, we then calculate the covariance matrix C:
Next, solve for the eigenvalues and corresponding eigenvectors of the covariance matrix C, and sort them based on the size of the eigenvalues. The eigenvectors corresponding to the largest eigenvalues represent the directions with the greatest data variance, while the smallest eigenvalues are associated with noise in the dataset.
Typically, eigenvectors are calculated through the decomposition of C:
Construct the principal component matrix V, where each eigenvector becomes a column of V.
Given the centralized dataset X, the goal of PCA is to find a set of orthogonal bases, i.e., the principal components, which define the coordinates of the data in a lower-dimensional space. Let V be the matrix of principal components, with columns representing the eigenvectors sorted by their corresponding eigenvalues. To transform the data into this lower-dimensional space, the transformed data Y can be calculated as:
Among them,
3.2.2 Building a 3D Spatial Index with k-d Tree
K-d Tree (k-dimensional tree) is a binary tree structure used for organizing and searching multidimensional spaces. The construction of a k-d tree begins at the root node, selecting a dimension for partitioning. In the selected dimension, the median is chosen as the node. The reason for choosing the median is to ensure that the left and right sides have as equal a number of points as possible. The left subtree is constructed using the partition point on the left side, and the above partitioning operation is performed on each subtree. Fig. 6 shows the schematic diagram of tree construction.
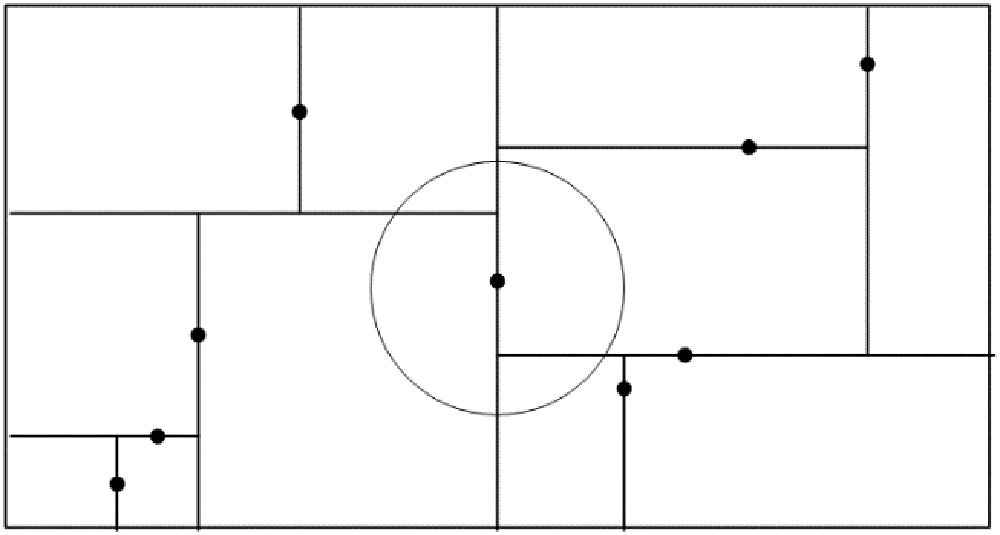
Figure 6: Schematic diagram of k-d tree
3.2.3 Density-Based Clustering Denoising Method
In non-track regions, this method has two important parameters:
where,
where,
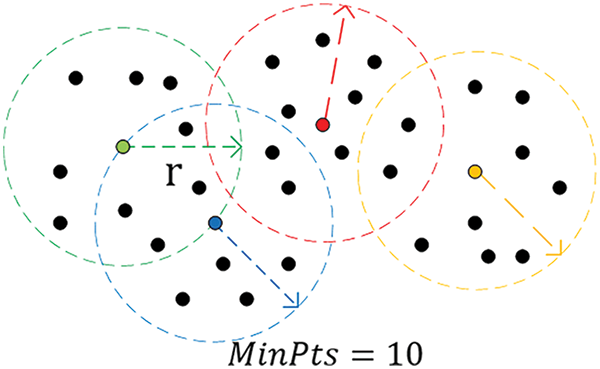
Figure 7: Schematic diagram of density reachability
In the DBSCAN clustering algorithm, all the points are first set to the unvisited state. Based on the number of points in the neighborhood, determine whether p is a core point. If yes, start a new cluster and join p and all its density reachable points. If the number of points in the ∈-neighborhoods is insufficient
Among them,
3.3 3D Point Cloud Object Detection
In recent times, the application of AI with point clouds has become increasingly prevalent, leading to the development of many novel networks for detection tasks. Currently, deep learning methods for point clouds mainly include point-based methods and voxel-based methods. PointNet++ [30] is an improved network architecture based on PointNet [31], which predicts target results by processing point coordinates. This network is more efficient for sparse point clouds but can be slower for dense point clouds, making it difficult to capture features over a large range of the point cloud. Voxel-based methods structure the data and convert 3D object detection into a similar 2D image detection for feature extraction. By adjusting the voxel size, it becomes easier to handle objects of different scales.
The
where,
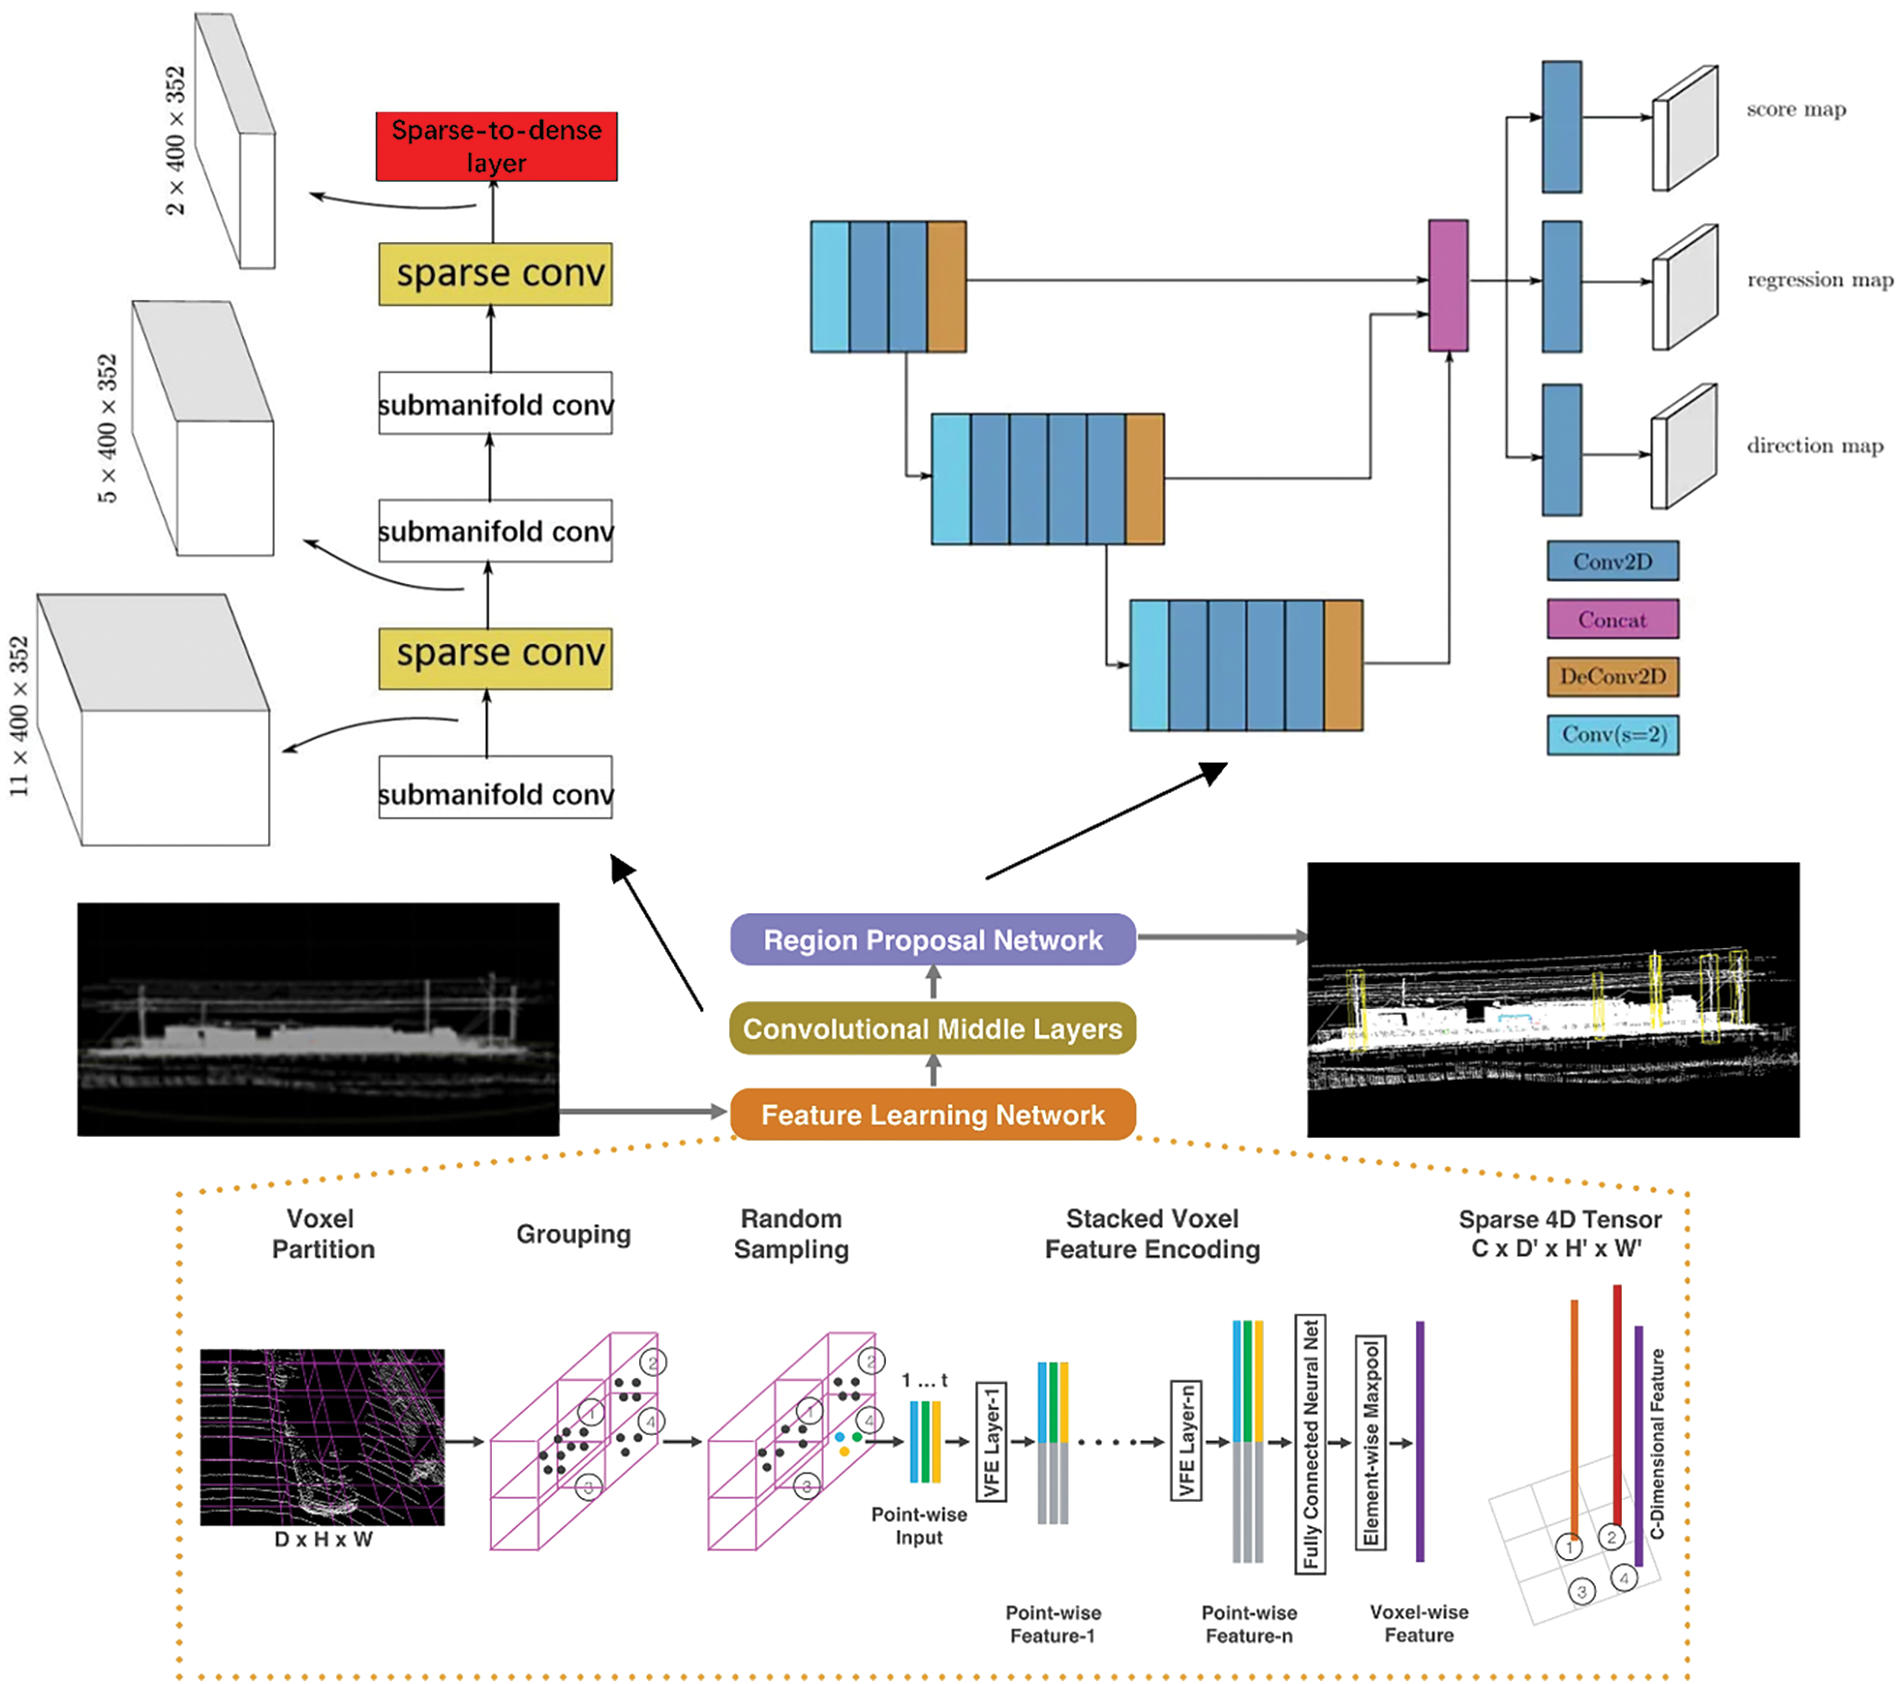
Figure 8: SECOND detection module
The experimental data for this study comes from real railways, utilizing AI technology to train and evaluate the detection performance of railway infrastructure. The experimental data includes three railways, each 1.8, 4.6, and 9.6 km long, respectively. Point cloud data for railway infrastructure was collected using LiDAR mounted on a train. The laser collection equipment is positioned at the origin of the coordinate system, with a collection range of −45 to 45 m horizontally and −5 to 15 m vertically. In the current study, we used point cloud collection equipment to gather detailed data from the three railway lines.
4.1 Point Cloud Denoising Effect
In actual railway environments, the noise in point cloud data typically originates from LiDAR equipment and environmental factors.
The preprocessing effect is shown in Fig. 9: through such preprocessing, we can ensure the clarity and accuracy of the point cloud data while maintaining detection speed, providing a good foundation for subsequent data analysis and applications.
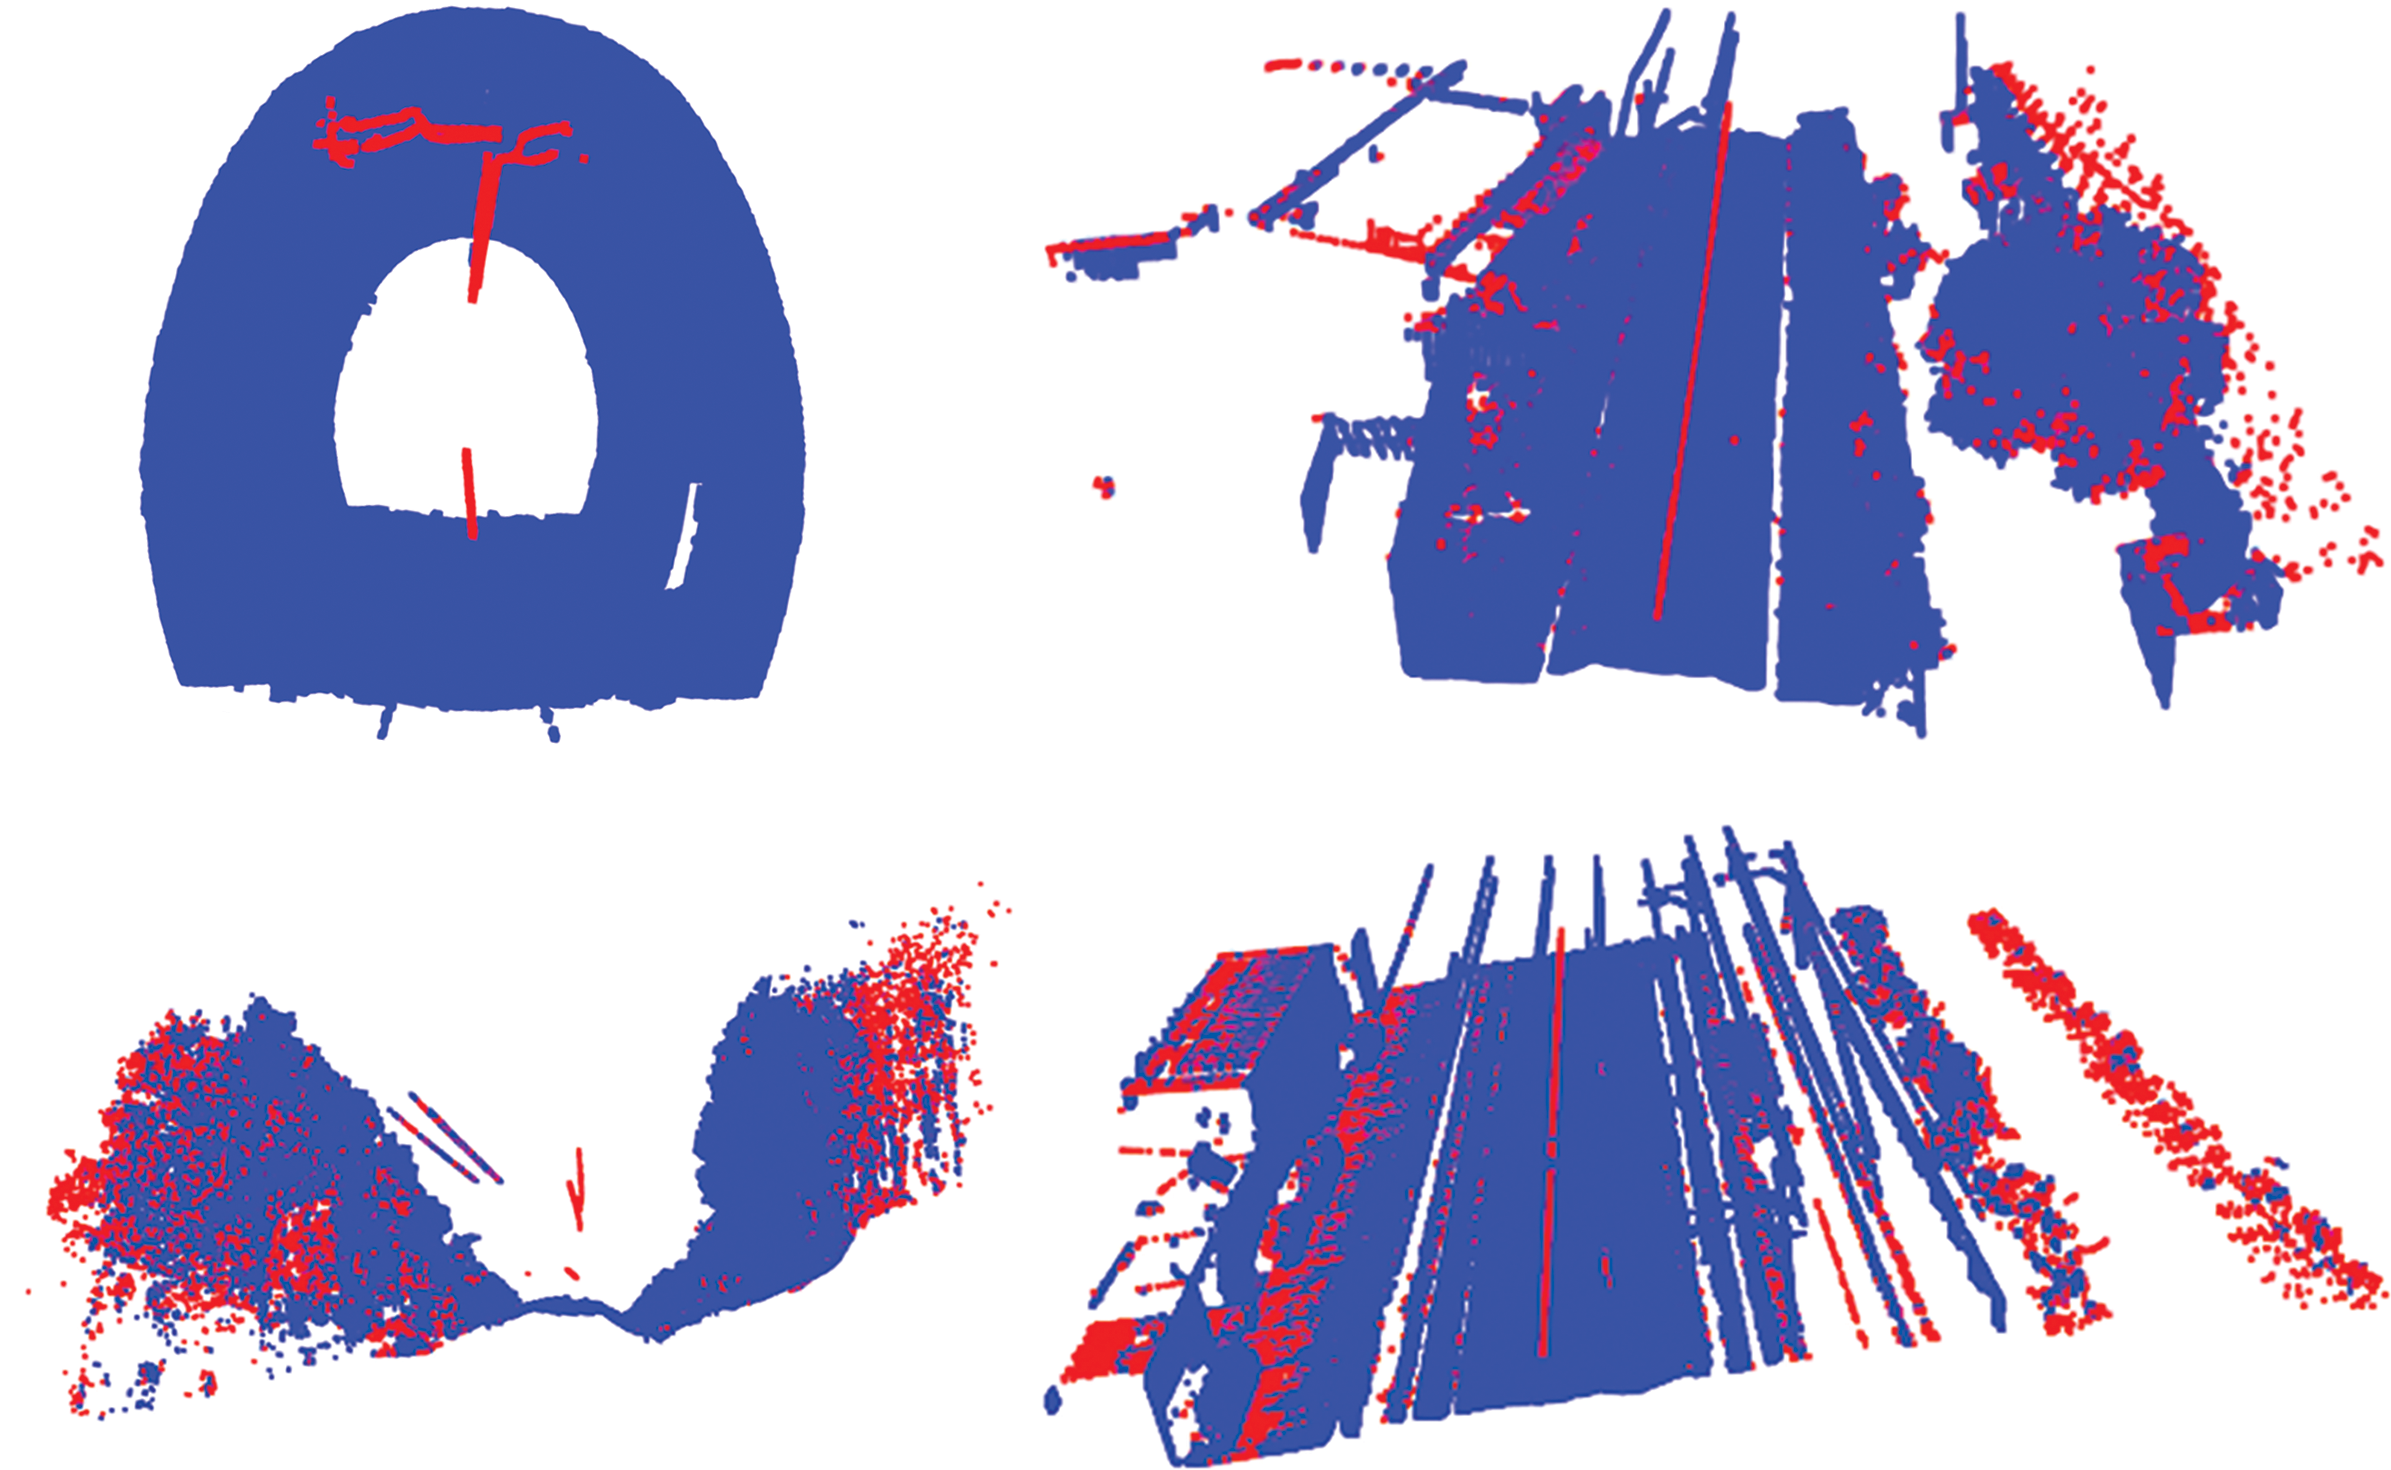
Figure 9: Results of preprocessing in four different scenarios
In this study, to evaluate the denoising effect of point cloud data, we chose to use the F1 score as the performance evaluation standard. The F1 score is a statistical measure commonly used to test the accuracy of data processing algorithms, combining information from both precision and recall. Noise and redundant points were uniformly labeled as noise manually. The calculation formula is:
Table 1 below shows the comparison of different denoising algorithms’ effects and processing times in the same scene.

4.2 Comparison of Detection Results
The 295 point cloud data obtained from LiDAR were divided into training and testing sets in an 8:2 ratio. Among them, 261 were used as the training set and 34 as the testing set. Table 2 shows the experimental environment in this section.

We adopted commonly used metrics in autonomous driving to evaluate the effectiveness: bbox (bounding box), 3D (3D bounding box), BEV (Bird’s Eye View), and mAP (mean Average Precision).
• bbox (bounding box): It is the smallest rectangle or cuboid surrounding the detected object. It is used to indicate the position of the object and its size in space. A common measure is IoU (Intersection over Union), calculated as follows:
• 3D (3D bounding box): This refers to detecting and recognizing objects in three-dimensional space. This differs from 2D detection, which is only performed in the image plane (i.e., two-dimensional space). 3D detection typically involves using point cloud data or a combination of point cloud and image data to accurately locate objects and estimate their spatial dimensions.
• BEV (Bird’s Eye View): This is a view of the objects from above. In 3D object detection, BEV is used to represent the 2D projection of objects in 3D space. The calculation formula is:
A’ and B’ are the 2D projections of 3D Bounding Boxes in BEV. mAP (mean Average Precision) is used to measure the performance of detection algorithms. It is the mean of the average precision.
To calculate mAP, first compute the AP (Average Precision) values for all categories, and then average these AP values to obtain the mAP.
where, N is the number of categories and
4.3 Comparison before and after Preprocessing
To reduce data complexity, this approach can optimize the efficiency of the voxelization process, as fewer points need to be allocated into voxels, while still preserving the overall structural information.
We conducted a comparison of detection results before and after denoising, with the visualization results shown in Fig. 10. For the effect of denoising, the identified poles are marked with yellow boxes, while blue and green boxes which are denoised because they are not poles.
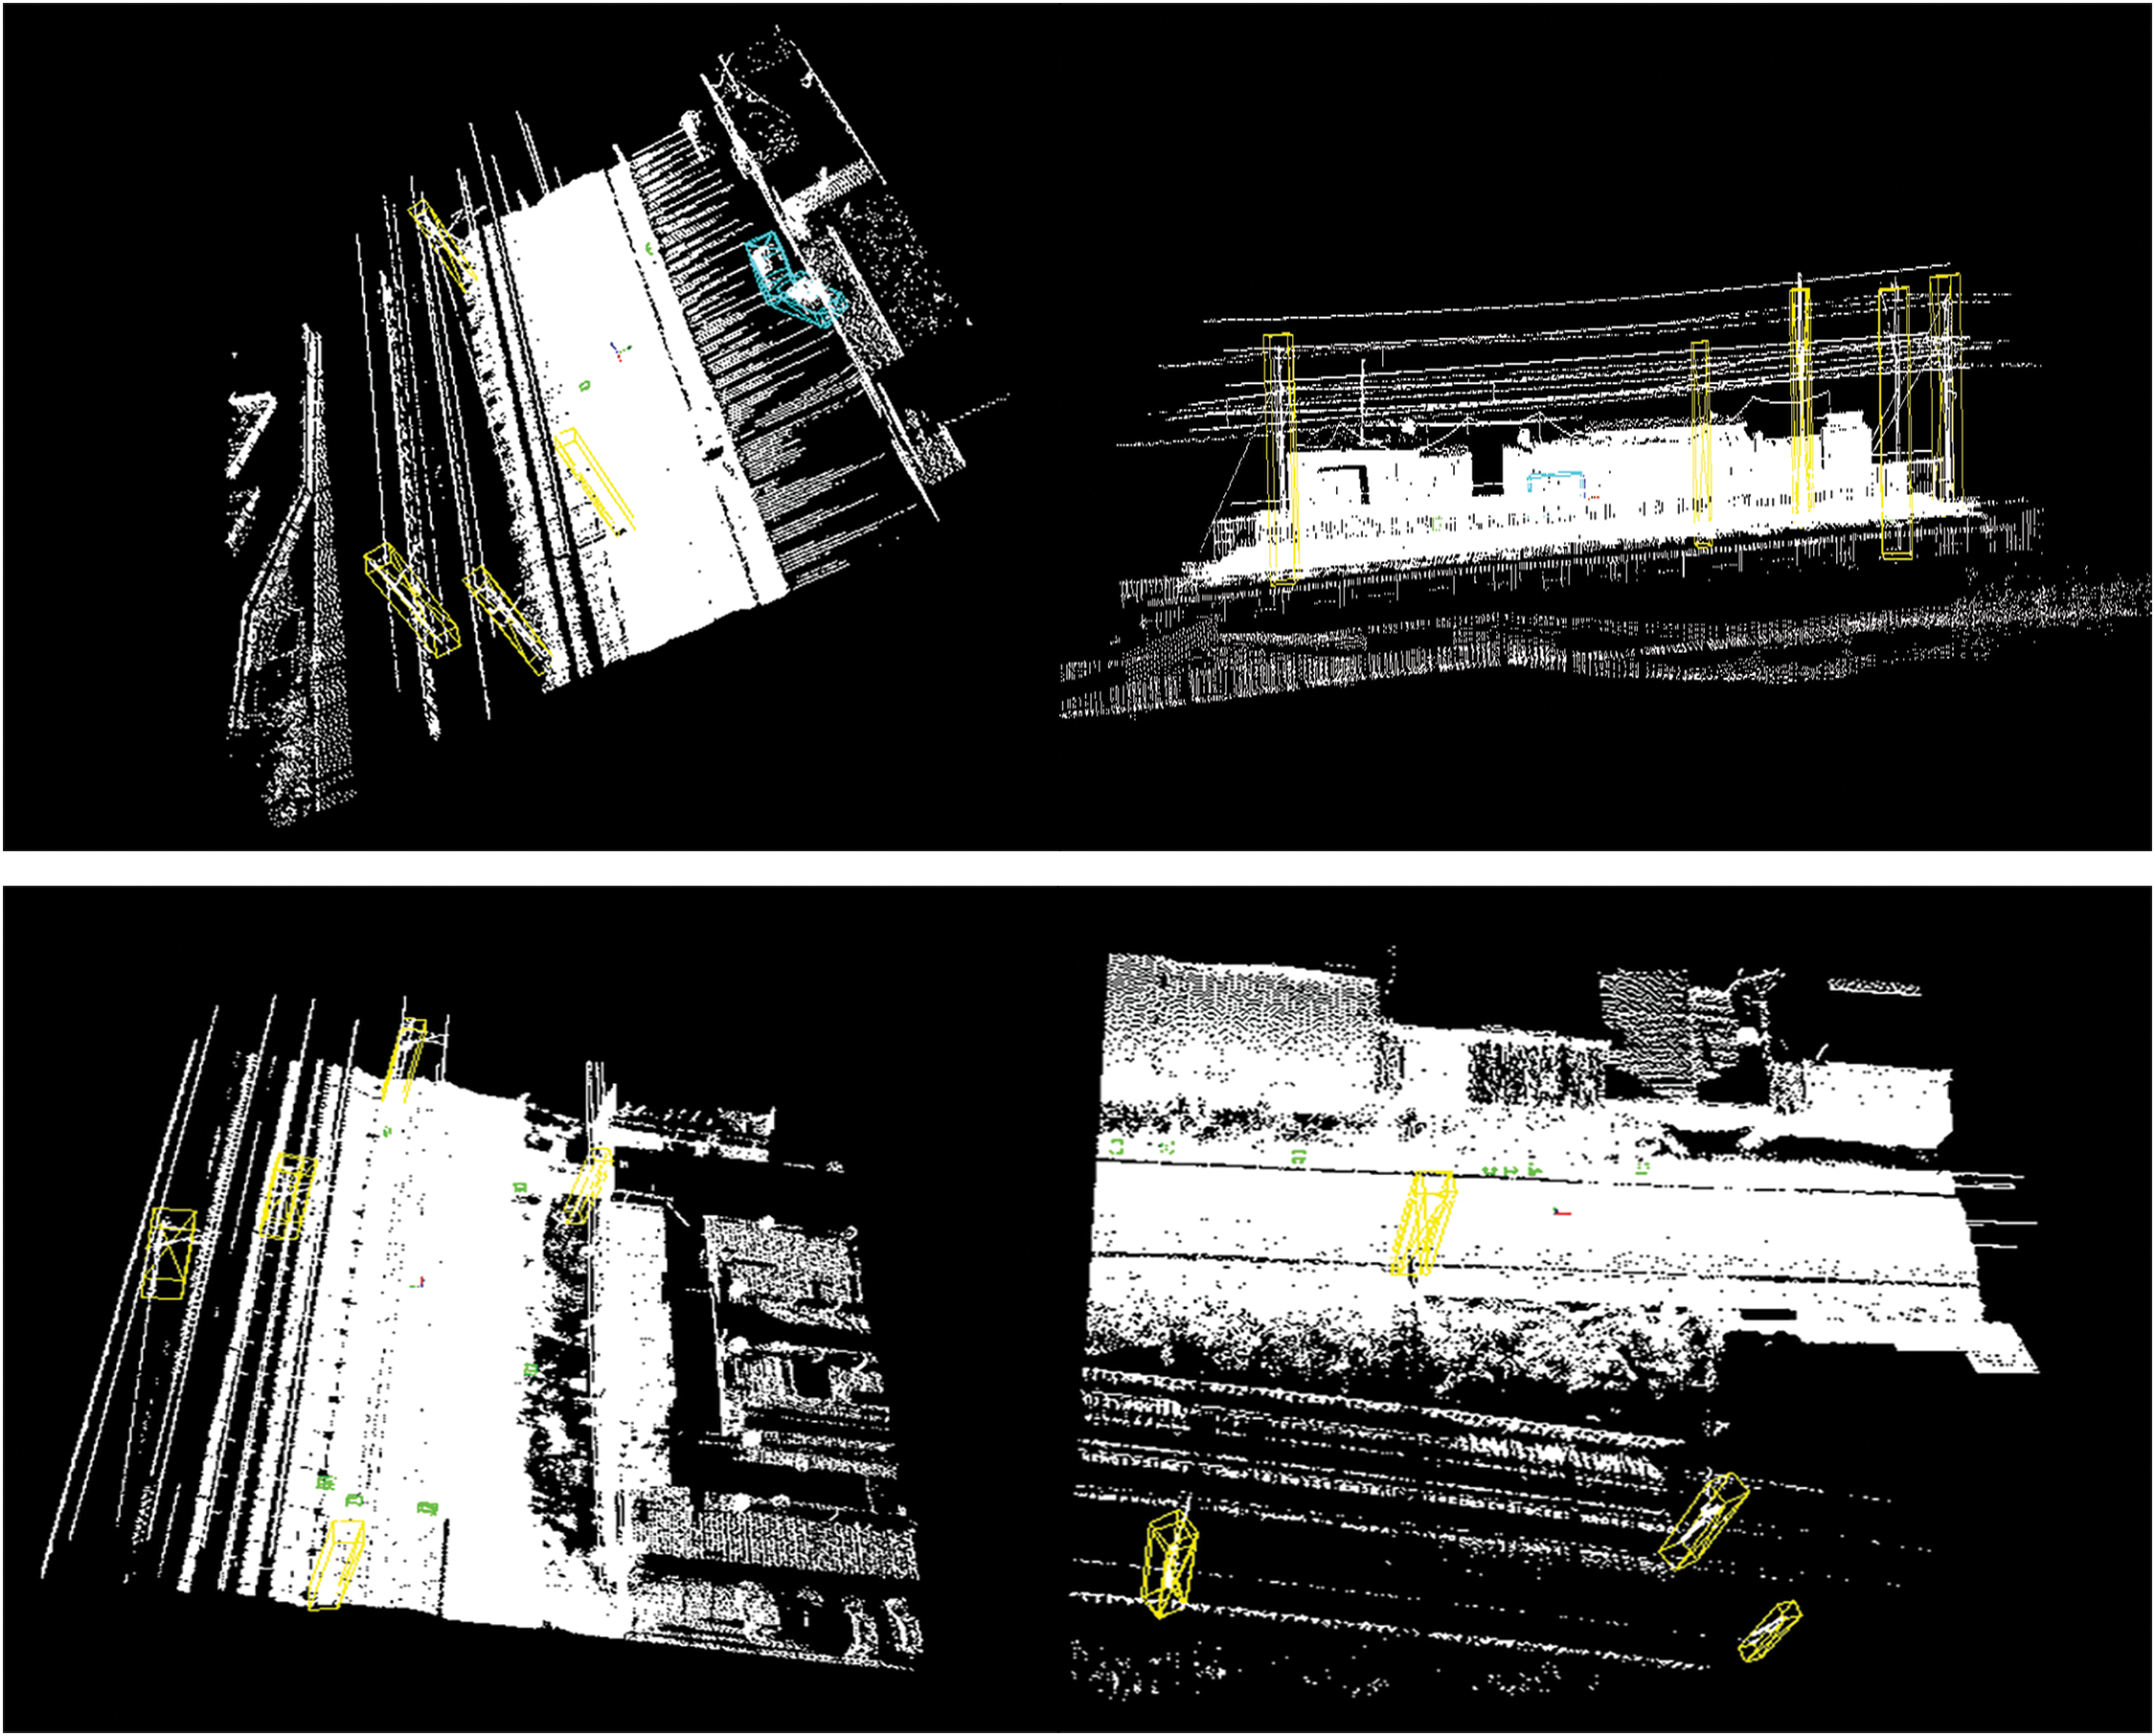
Figure 10: The 3D bounding box of the LiDAR point cloud is shown, where the yellow box clearly indicates the utility pole
Based on the training results in Table 3, we can observe that the point cloud effect after preprocessing is better than the point cloud effect without preprocessing. From the earlier dimensionality reduction figures, we know that in railway scenarios, there is a large amount of noise near the objects being detected. This noise can affect the training results, leading to poor feature extraction and reduced detection accuracy. In performing detection tasks, preprocessing is an important component.

For the detection of railway poles, we established preprocessing steps for the collected point cloud data and conducted highly efficient detection using the SECOND model. In the preprocessing stage, we introduced a dual-region adaptive point cloud preprocessing strategy. We divided the acquired point cloud data into railway track regions and railway non-track regions.
For the railway track region, we directly projected the original point cloud and used grid technology to deduplicate the projected data. This approach is very advantageous for denoising large-scale point clouds as it reduces the data’s dimensionality while retaining important information.
For the railway non-track region, we adopted a density clustering method based on PCA (Principal Component Analysis). This method converts the 3D point cloud data into 2D, allowing density clustering operations on the dimensionality-reduced results, thus achieving efficient point cloud density clustering. Compared to other methods, our dual-region adaptive point cloud preprocessing method achieved significant improvements in both effectiveness and time. It eliminates noise and simplifies data while preserving the features of the detected objects, further reducing computational complexity. The proposed method effectively addresses the needs of large-scale preprocessing in railway scenarios and, when combined with the characteristics of railway point cloud scenes, shows a notable improvement in efficiency compared to other methods, while also demonstrating good performance in accuracy.
Comparing the training results with and without preprocessing, it is clear that the results with preprocessing are significantly better. This confirms the necessity of preprocessing, as the acquired point cloud data contains a large amount of noise, which can degrade detection performance.
Acknowledgement: Not applicable.
Funding Statement: The authors received no specific funding for this study.
Author Contributions: The authors confirm contribution to the paper as follows: Yuxin Yan: Conceptualization; Writing—original draft; Data curation; Methodology; Huirui Wang: Methodology; Data curation; Jingyi Wen: Data curation; Software; Zerong Lan: Writing—review and editing; Liang Wang: Conceptualization; Writing—review and editing. All authors reviewed the results and approved the final version of the manuscript.
Availability of Data and Materials: This article does not involve data availability and this section is not applicable.
Ethics Approval: Not applicable.
Conflicts of Interest: The authors declare no conflicts of interest to report regarding the present study.
References
1. Chen J, Cao J, Cheng Z, Jiang S. Towards efficient distributed collision avoidance for heterogeneous mobile robots. IEEE Trans Mob Comput. 2024 May;23(5):3605–19. doi:10.1109/TMC.2023.3279906. [Google Scholar] [CrossRef]
2. Lidén T. Railway infrastructure maintenance—a survey of planning problems and conducted research. Transp Res Procedia. 2015 Dec;10:574–83. [Google Scholar]
3. Gibert X, Patel VM, Chellappa R. Deep multitask learning for railway track inspection. IEEE Trans Intell Transp Syst. 2016 Jan;18(1):153–64. doi:10.1109/TITS.2016.2568758. [Google Scholar] [CrossRef]
4. Gibert X, Patel VM, Chellappa R. Robust fastener detection for autonomous visual railway track inspection. In: 2015 IEEE Winter Conference on Applications of Computer Vision; 2015; IEEE. p. 694–701. [Google Scholar]
5. Gasparini R, Pini S, Borghi G, Scaglione G, Calderara S, Fedeli E , et al. Anomaly detection for vision-based railway inspection. In: Dependable Computing-EDCC, 2020 Workshops: AI4RAILS, DREAMS, DSOGRI, SERENE 2020; 2020 Sep 7; Munich, Germany. p. 56–67. [Google Scholar]
6. Ji Z, Pan W, Liu S. Detecting foreign objects on transmission lines via improved YOLOv5 optimized by attention mechanism. In: 2024 IEEE 4th International Conference on Power, Electronics and Computer Applications (ICPECA); 2024; IEEE. p. 173–78. [Google Scholar]
7. He D, Yao Z, Jiang Z, Chen Y, Deng J, Xiang W. Detection of foreign matter on high-speed train underbody based on deep learning. IEEE Access. 2019 Dec;7:183838–46. doi:10.1109/ACCESS.2019.2960439. [Google Scholar] [CrossRef]
8. Xu X, Lei Y, Yang F. Railway subgrade defect automatic recognition method based on improved faster R-CNN. Sci Program. 2018;2018:1–10. doi:10.1155/2018/4832972. [Google Scholar] [CrossRef]
9. Jiang X, Wang S. Railway panorama: a fast inspection method for high-speed railway infrastructure monitoring. IEEE Access. 2021 Dec;9:150889–902. doi:10.1109/ACCESS.2021.3125645. [Google Scholar] [CrossRef]
10. Duan Y, Qiu S, Jin W, Lu T, Li X. High-speed rail tunnel panoramic inspection image recognition technology based on improved YOLOv5. Sensors. 2023 Jul;23(13):5986. doi:10.3390/s23135986. [Google Scholar] [PubMed] [CrossRef]
11. Banić M, Miltenović A, Pavlović M, Ćirić I. Intelligent machine vision based railway infrastructure inspection and monitoring using UAV. Facta Univ Ser: Mech Eng. 2019;17(3):357–64. doi:10.22190/FUME190507041B. [Google Scholar] [CrossRef]
12. Yadav M, Singh AK. Rural road surface extraction using mobile LiDAR point cloud data. J Indian Soc Remote Sens. 2018;46:531–8. doi:10.1007/s12524-017-0732-4. [Google Scholar] [CrossRef]
13. Wang Y, Chen Q, Zhu Q, Liu L, Li C, Zheng D. A survey of mobile laser scanning applications and key techniques over urban areas. Remote Sens. 2019;11(13):1540. doi:10.3390/rs11131540. [Google Scholar] [CrossRef]
14. Longley PA, Goodchild MF, Maguire DJ, Rhind DW. GIS data collection. In: Geographic information systems and science; 2001. p. 32–7. [Google Scholar]
15. Kim GH, Sohn HG, Song YS. Road infrastructure data acquisition using a vehicle-based mobile mapping system. Comput-Aided Civ Infrastruct Eng. 2006;21(5):346–56. doi:10.1111/j.1467-8667.2006.00441.x. [Google Scholar] [CrossRef]
16. Vignali V, Acerra EM, Lantieri C, Di Vincenzo F, Piacentini G, Pancaldi S. Building information modelling (BIM) application for an existing road infrastructure. Autom Constr. 2021;128:103752. doi:10.1016/j.autcon.2021.103752. [Google Scholar] [CrossRef]
17. Steel J, Drogemuller R, Toth B. Model interoperability in building information modelling. Softw Syst Model. 2012;11:99–109. doi:10.1007/s10270-010-0178-4. [Google Scholar] [CrossRef]
18. Shi S, Wang X, Li H. PointRCNN: 3D object proposal generation and detection from point cloud. In: Proceedings of the IEEE/CVF Conference on Computer Vision and Pattern Recognition (CVPR); 2019. p. 770–9. [Google Scholar]
19. Zhou Z, Zhao X, Wang Y, Wang P, Foroosh H. CenterFormer: center-based transformer for 3D object detection. In: European Conference on Computer Vision (ECCV). Cham: Springer Nature Switzerland; 2022. p. 496–513. [Google Scholar]
20. Shi S, Guo C, Jiang L, Wang Z, Shi J, Wang X, et al. PV-RCNN: point-voxel feature set abstraction for 3D object detection. In: Proceedings of the IEEE/CVF Conference on Computer Vision and Pattern Recognition (CVPR); 2020. p. 10529–38. [Google Scholar]
21. Forster A, Bosché F, Hyslop E, Wilson L, Turmel A. Automated defect detection and classification in ashlar masonry walls using machine learning. Autom Constr. 2019;106:102846. doi:10.1016/j.autcon.2019.102846. [Google Scholar] [CrossRef]
22. Bisheng Y, Fuxun L, Ronggang H. Progress, challenges and perspectives of 3D LiDAR point cloud processing. Acta Geodaetica et Cartographica Sinica. 2017;46(10):1509. [Google Scholar]
23. Yang H, Wang Y, Hu J, He J, Yao Z, Bi Q. Segmentation of track surface defects based on machine vision and neural networks. IEEE Sens J. 2021;22(2):1571–82. doi:10.1109/JSEN.2021.3133280. [Google Scholar] [CrossRef]
24. Yang T, Liu Y, Huang Y, Liu J, Wang S. Symmetry-driven unsupervised abnormal object detection for railway inspection. IEEE Trans Ind Inform. 2023;19(12):11487–98. doi:10.1109/TII.2023.3246995. [Google Scholar] [CrossRef]
25. Soilán M, Sánchez-Rodríguez A, Perez-Collazo C, Arias P. Review of laser scanning technologies and their applications for road and railway infrastructure monitoring. Infrastructures. 2019;4(4):58. doi:10.3390/infrastructures4040058. [Google Scholar] [CrossRef]
26. Carrilho A, Galo M, Santos R. Statistical outlier detection method for airborne LiDAR data. Int Arch Photogramm Remote Sens Spatial Inf Sci. 2018;42:87–92. doi:10.5194/isprs-archives-XLII-1-87-2018. [Google Scholar] [CrossRef]
27. Yuan H, Pang J, Mo J. Denoising algorithm for bilateral filtered point cloud based on noise classification. J Comput Appl. 2015;35(8):2305. [Google Scholar]
28. Peng Y, Deer L, Jingyu L, Jiwei Z, Heyuan Z, Zenghui C. Urban point cloud denoising algorithm based on least squares density clustering. Laser Infrared. 2020;50(11):1402–9. [Google Scholar]
29. Duan Y, Yang C, Chen H, Yan W, Li H. Low-complexity point cloud denoising for LiDAR by PCA-based dimension reduction. Opt Commun. 2021;482:126567. doi:10.1016/j.optcom.2020.126567. [Google Scholar] [CrossRef]
30. Qi CR, Yi L, Su H, Guibas LJ. PointNet++: deep hierarchical feature learning on point sets in a metric space. In: Advances in Neural Information Processing Systems. Vol. 30; 2017. [Google Scholar]
31. Qi CR, Su H, Mo K, Guibas LJ. PointNet: deep learning on point sets for 3D classification and segmentation. In: Proceedings of the IEEE Conference on Computer Vision and Pattern Recognition (CVPR); 2017. p. 652–60. [Google Scholar]
32. Yan Y, Mao Y, Li B. SECOND: sparsely embedded convolutional detection. Sensors. 2018;18(10):3337. doi:10.3390/s18103337. [Google Scholar] [PubMed] [CrossRef]
33. Liang Z, Cao J, Jiang S, Saxena D, Xu H. Hierarchical reinforcement learning with opponent modeling for distributed multi-agent cooperation. In: 2022 IEEE 42nd International Conference on Distributed Computing Systems (ICDCS); 2022; Bologna, Italy. p. 884–94. doi:10.1109/ICDCS54860.2022.00090. [Google Scholar] [CrossRef]
Cite This Article
 Copyright © 2025 The Author(s). Published by Tech Science Press.
This work is licensed under a Creative Commons Attribution 4.0 International License , which permits unrestricted use, distribution, and reproduction in any medium, provided the original work is properly cited.
 Downloads
 Citation Tools