
 Submit a Paper
 Propose a Special lssue
 Open Access
ARTICLE
Multimodal Gas Detection Using E-Nose and Thermal Images: An Approach Utilizing SRGAN and Sparse Autoencoder
1 Artificial Intelligence and Machine Learning Department, Symbiosis Institute of Technology, Symbiosis International (Deemed) University, Pune, 412115, India
2 Symbiosis Centre of Applied AI (SCAAI), Symbiosis International (Deemed) University, Pune, 412115, India
3 Centre for Advanced Modelling and Geospatial Information Systems (CAMGIS), School of Civil and Environmental Engineering, University of Technology Sydney, Ultimo, NSW 2007, Australia
4 Department of Geology and Geophysics, College of Science, King Saud University, Riyadh, 11362, Saudi Arabia
* Corresponding Author: Biswajeet Pradhan. Email:
(This article belongs to the Special Issue: Computer Vision and Image Processing: Feature Selection, Image Enhancement and Recognition)
Computers, Materials & Continua 2025, 83(2), 3493-3517. https://doi.org/10.32604/cmc.2025.060764
Received 09 November 2024; Accepted 04 March 2025; Issue published 16 April 2025
 View Full Text
 Download PDF
Abstract
Electronic nose and thermal images are effective ways to diagnose the presence of gases in real-time real-time. Multimodal fusion of these modalities can result in the development of highly accurate diagnostic systems. The low-cost thermal imaging software produces low-resolution thermal images in grayscale format, hence necessitating methods for improving the resolution and colorizing the images. The objective of this paper is to develop and train a super-resolution generative adversarial network for improving the resolution of the thermal images, followed by a sparse autoencoder for colorization of thermal images and a multimodal convolutional neural network for gas detection using electronic nose and thermal images. The dataset used comprises 6400 thermal images and electronic nose measurements for four classes. A multimodal Convolutional Neural Network (CNN) comprising an EfficientNetB2 pre-trained model was developed using both early and late feature fusion. The Super Resolution Generative Adversarial Network (SRGAN) model was developed and trained on low and high-resolution thermal images. A sparse autoencoder was trained on the grayscale and colorized thermal images. The SRGAN was trained on low and high-resolution thermal images, achieving a Structural Similarity Index (SSIM) of 90.28, a Peak Signal-to-Noise Ratio (PSNR) of 68.74, and a Mean Absolute Error (MAE) of 0.066. The autoencoder model produced an MAE of 0.035, a Mean Squared Error (MSE) of 0.006, and a Root Mean Squared Error (RMSE) of 0.0705. The multimodal CNN, trained on these images and electronic nose measurements using both early and late fusion techniques, achieved accuracies of 97.89% and 98.55%, respectively. Hence, the proposed framework can be of great aid for the integration with low-cost software to generate high quality thermal camera images and highly accurate detection of gases in real-time.Keywords
Abbreviations
| SRGAN | Super-Resolution Generative Adversarial Network |
| MAE | Mean Absolute Error |
| MSE | Mean Squared Error |
| RMSE | Root Mean Squared Error |
| CNN | Convolutional Neural Network |
| MOX | Metal-Oxide-Semiconductor |
| OSS | Open Sampling System |
| ELBA | Ensemble Learning-Based Approach |
| GFET | Graphene Field-Effect Transistor |
| HSI | Hue Saturation Intensity |
| SGD | Stochastic Gradient Descent |
| NQM | Noise Quality Measure |
| SSIC | Structural Similarity Index Score |
| DCT | Discrete Cosine Transform |
| ANN | Artificial Neural Network |
| LSTM | Long Short-Term Memory |
| SCAE | Sparse Convolutional Autoencoder |
| FEGAN | Feature-Oriented Enhanced Generative Adversarial Network |
| GAN | Generative Adversarial Network |
| LPG | Liquefied Petroleum Gas |
| VOCs | Volatile Organic Compounds |
| CRNN | Convolutional Recurrent Neural Network |
| LNG | Liquefied Natural Gas |
| PSNR | Peak Signal-to-Noise Ratio |
| SSIM | Structural Similarity Index |
| FSIM | Feature Similarity Index Measure |
| LPIPS | Learned Perceptual Image Patch Similarity |
| AUC | Area Under the Curve |
| MSLE | Mean Squared Logarithmic Error |
In contemporary industrial operations, ensuring safety amid the presence of potentially hazardous gasses is paramount. Gas detection systems play a pivotal role in maintaining safe environments, particularly within gas-related industries [1]. The efficacy of these systems heavily relies on the sensitivity of their detection sensors. Without sufficiently sensitive sensors, there’s a risk of false readings, which could lead to gas leakage [2]. Chemical factories, in particular, are susceptible to these risks, given the storage and handling of numerous poisonous, hazardous, and explosive chemicals. To mitigate these risks, industries employ sensors capable of swiftly detecting and alerting to the presence and concentration of various glasses, including flammable and toxic ones [3]. Commonly encountered gasses such as natural gas, liquefied petroleum gas (LPG), coal gas, and alkaline are among those necessitating vigilant monitoring. In this context, infrared gas sensors are widely employed, operating on the principle of non-dispersive infrared (NDIR) detection. These sensors effectively identify flammable and toxic gasses in the air at specific concentrations, thereby facilitating the maintenance of smooth industrial processes and ensuring robust safety monitoring protocols [4].
The chemical industry is a sector where the presence of hazardous gases can pose significant risks to personnel safety, environmental protection, and process integrity. Gas detection systems are therefore crucial in these environments, as they provide early warnings that enable prompt response which can help take preventive measures. Chemical plants often handle toxic gases such as hydrogen sulfide (H2S), chlorine (Cl2), ammonia (NH3), and various volatile organic compounds (VOCs), making effective gas detection systems essential to prevent potential fires or explosions. Monitoring oxygen levels is also critical to ensure a safe atmosphere within these facilities [5].
A robust gas detection system should be capable of monitoring a wide range of gases, be highly sensitive to detect low concentrations accurately and provide real-time monitoring with instant alarms in the event of gas leaks or abnormal gas levels. Sensor-based gas detection, often referred to as an electronic nose (e-nose), is a technology that mimics the human sense of smell by using an array of sensors to detect different gases. These portable, low-cost e-noses are widely used in various applications, including chemical industries, due to their ability to recognize the presence of gases by monitoring concentration levels. The e-nose systems typically employ metal-oxide-semiconductor (MOX) sensors, which are partially selective and can be used in open sampling systems (OSS) where sensors are directly exposed to the environment [6].
One of the challenges in gas detection using e-noses is the unbalanced datasets of gas sensor responses, especially in uncontrolled environments. To address this, researchers have proposed methods such as the Ensemble Learning-Based Approach (ELBA), which uses several one-class models to detect gas exposure events and learn baseline response patterns. Machine learning techniques have been increasingly integrated with e-noses to improve gas detection capabilities [7]. These smart gas sensors use machine learning algorithms to analyze sensor data, enabling the classification of gas-sensing patterns and providing important statistical information. For example, a graphene field-effect transistor (GFET) has been used as a gas sensor with machine learning analyses to classify different gases such as water, methanol, and ethanol [8].
Thermal camera imaging is a non-invasive and effective modality for gas detection. Specialized thermal imaging cameras like MLX90641 and other infrared cameras can be used to image and capture the entire survey area and analyze for gas leaks and other important events by measuring the temperature and radiant energy emitted [9]. Thermal images can capture the gas distributions which are not easily observable by the naked eye. Several automated detection systems are being developed that use machine and deep learning algorithms trained on huge volumes of thermal images. The following are the related works that have used thermal camera images and deep learning techniques for gas identification and relevant events [10].
Multimodal feature fusion is one adaptive strategy implemented to improve the performance of the machine and deep learning algorithms. Multimodal fusion refers to the integration of features from several modalities like image, tabular data, audio, video, and so on [11]. The combination of features from multiple modalities will result in the compensation of one modality by the other, reducing the chances of false positives and false negatives in the due process [12]. As a result, a combination of features from multiple modalities improves the accuracy of the algorithms trained on such data.
The conventional software used in the thermal camera to produce high-resolution thermal images is expensive, both cost-wise and computation-wise [13]. Usage of such software in real-time deployment would not be that effective. On the other hand, low-cost software is better compatible with low-end hardware devices for seamless deployment. However, these thermal cameras produce low-resolution images which would pose a difficulty for the machine and deep learning algorithms to process them. A compromising solution for this problem is the usage of interpolation and deep learning-based super-resolution techniques to improve the resolution of the thermal images, without the need for expensive software [14].
Another downside of using low-cost thermal imaging software is the generation of thermal images in grayscale, but the human-readable format is in RGB or HSV or other related color spaces. Hence usage of image processing and deep learning methods for the automated colorization of thermal images can be of great support and integration with the existing software [15].
The main novelty and contribution of this paper lie in its focus on integrating low-resolution data obtained from low-cost software for gas detection. Unlike existing methods that utilize high-quality thermal images from expensive thermal camera acquisition software, this study explores the use of both machine and deep learning algorithms on single modalities like electronic nose and thermal images, as well as their fusion as multimodal data. Additionally, it investigates deep learning techniques to enhance the resolution of thermal images and employs autoencoder models for automated colorization of these images, thus addressing a gap in the current literature. The following is the structure of the research paper. Section 1 deals with the introduction to the work, the need for the work, the industrial importance, the need for sensors, thermal imaging, and multimodal feature fusion for gas identification. Section 2 deals with the material used, the different techniques employed for multimodal classification, the SRGAN architecture used for image resolution enhancement along with training parameters, and the autoencoder architecture used for image colorization along with its training parameters. Section 3 deals with the results obtained for the multimodal classification, the image resolution enhancement, and image colorization processes along with discussions. Section 4 provides the conclusions and takeaways of the proposed work along with future directions.
The following section comprises literature on the methods related to the super-resolution of thermal images, automated colorization of thermal images, AI-based methods for gas detection using electronic nose, thermal imaging, and the combination of both using multimodal feature fusion. Table 1 comprises the different methods related to the usage of the machine and deep learning algorithms for gas identification using the data from an electronic nose.
2.1 Gas Identification through Thermal Imaging
Mao et al. [21] addressed the challenge of fast recognition of flammable and toxic gas species, crucial for gas sensing devices across numerous applications. To overcome this limitation, the paper proposed a novel hybrid approach, integrating convolutional and recurrent neural networks (CRNN), leveraging the long short-term memory module. This deep learning method excelled in capturing valuable transient features from the initial stages of the response curve. Through extensive experimentation, the proposed CRNN approach achieved an accuracy of 84.06% at 0.5 s and 98.28% at 4 s.
Bin et al. [22] developed a tensor-based approach for detection of the liquefied natural gas (LNG) leakage to prevent environments and governments from severe pollution and economic loss. In the dataset description, a thermal surveillance camera and LNG emitter at a grassland were used which included three videos from 10 to 30 m. Each video is recorded for 1 min, with approximately 30 s of leakage occurrence. Three categories of architectural frameworks were used that are statistical methods, deep learning, and Robust subspace, along with the classifiers SVM, Adaboost, gasnet, and resnet50 with accuracy of 69.93%, 55.53%, 58.87%, and 84.38%, respectively.
2.2 Multimodal Learning for Feature Fusion-Based Gas Identification
Rahate et al. [23] developed a multimodal co-learning approach for creating robustness for sensor fusion. The dataset used is multimodal with gas data, sensor data, and thermal image data. The results demonstrated that multi-task fusion is more robust to missing and noisy modalities than intermediate fusion. Having an additional low-resolution thermal modality supports co-learning and makes it robust to 20% missing sensor data, 90% missing thermal image data, and Gaussian and Normal noise.
Narkhede et al. [24] worked on developing a deep-learning algorithm for gas detection using multimodal data. The proposed multimodal deep neural network comprises two different types of architectures, namely, early fusion and late fusion. Both architectures consist of feature extraction layers, like the LSTM for the sensor array and CNN for the thermal camera. The proposed late fusion multimodal neural network produced 96% accuracy which was better than that of the LSTM network on the sensor array (83% accuracy) and CNN on the thermal images (92% accuracy), respectively.
Attallah [25] developed a deep learning pipeline for the multimodal fusion of electronic noses (gas sensors) and thermal images for multi-task classification of gas leak detection. The dataset comprises gas sensors and thermal images for 4 classes. Three convolutional neural networks were used for extracting the features from the thermal images and a bi-directional LSTM was used for extracting the features from the gas sensor array. Also, a multitask fusion architecture was developed, where discrete cosine transform (DCT) was applied to the three CNNs for fusion and classification. The conventional multimodal architecture and the multitask multimodal architecture produced accuracies of 98.47% and 99.25%, respectively.
2.3 Image Super-Resolution of Thermal Images
Cheng et al. [26] developed a generative-based architecture for blast chute. The dataset used contains thermal images of blast furnaces from various augmented angles. Specifically, the numerical simulation and generative adversarial network (GAN) are introduced to generate images with complete chute. Compared with other typical methods, the proposed method has higher PSNR and SSIM and lower MAE (PSNR = 33.801, SSIM = 0.980, MAE = 0.013). This method can provide a reference for heat condition monitoring of blast furnace chute. Further, it can guide the blast furnace operation and improve gas utilization.
Deepak et al. [27] worked on the development of a generative adversarial network (GAN) for the super-resolution of thermal images for industrial applications. The proposed GAN architecture comprises 5 residual blocks with the batch normalization layers excluded from the main block. The proposed GAN algorithm was able to successfully super enhance the resolution of the thermal images with an improvement of 2 decibels in the peak signal-to-noise ratio (PSNR) in comparison to image processing techniques and a structural similarity index score (SSIC) of 0.9825.
Zhu et al. [28] developed FEGAN, a feature-oriented enhanced generative adversarial network for enhancing the resolution of thermal images. The feature-oriented enhancement results in preserving the high-level edge features from low-resolution images. The proposed FEGAN algorithm increased the resolution of the thermal images, and in comparison with the ground truth produced PSNR of 27.18, SSIM of 0.6523, FSIM of 0.5500, and LPIPS of 0.1221, respectively.
2.4 Automated Colorization of Thermal Images
Dangle et al. [29] worked on the colorization of thermal images into realistic pictures presenting a formidable challenge. By leveraging a pre-trained YOLOv5 architecture, colorized and enhanced images are fed into the detection model, achieving a test accuracy of 92.1% for pedestrian detection. Additionally, the proposed CNN model achieves a test accuracy of 73.18% for thermal image colorization, providing perceptually realistic color images that are easily interpretable.
Çiftçi et al. [30] developed a deep encoder decoder-based convolutional neural network for the colorization of thermal images. The training dataset comprises 3584 thermal images which were resized to
Kuang et al. [31] worked on the development of a conditional generative adversarial network for the automated colorization of thermal infrared images through transformation mapping of coarse to fine images. A composite loss function is used to train the GAN algorithm which comprises four parts, namely, the standard adversarial loss, the content loss obtained through the mean square error of all the pixels, the perceptual loss obtained through the difference of features extracted from the VGG16 network and the TV loss for spatial smoothness difference. The proposed algorithm produced 15.85 PSNR, 4.44 NQM, and 0.55 SSIC scores, respectively. Table 2 summarizes and compares the existing works related to the application of deep neural networks for thermal gas images.
The above-mentioned methods are related to the usage of machine and deep learning algorithms for the task of gas detection using single modalities like electronic nose and thermal images separately and also fused as multimodal. This was followed by deep learning methods used to improve the resolution of the thermal images and autoencoder models for automated colorization of thermal images. The existing methods related to multimodal analysis of gas detection have used high quality thermal images obtained from expensive thermal camera acquisition software. These works have not focussed on the aspect of integrating low-resolution data obtained from low-cost software, and this formed the inspiration for the proposed work.
The dataset used for the proposed work is the MultiModalGasData. The dataset comprises two different modalities, where one modality is sensory information and another modality is the thermal image. There are a total of four classes, namely, smoke, perfume, no gas, and a combination of smoke and perfume. Each class has 1600 sensor measurements and thermal images of size 224 * 224 * 3 (RGB format), making a total of 6400 data. The sensory information is in CSV format and the thermal images are in PNG format. All the thermal images were acquired using the Seek Compact Thermal Camera, known for its small size and compactness, allowing for seamless integration with IoT devices. The camera has a frame rate of 9 kHz and captures images in the resolution of 206 * 156, which we later resized into 224 * 224.
The proposed workflow comprises three different phases, executed parallelly. The first phase deals with the development of the algorithm for the multimodal gas classification. Three different techniques, namely, early feature fusion, intermediate feature fusion, and late feature fusion were implemented and compared to identify the best algorithm. The second phase deals with the development of the SRGAN algorithm for the super-resolution of the thermal images. The third phase deals with the development of the autoencoder algorithm for the image colorization task for thermal images. Fig. 1 represents the proposed workflow in a diagrammatic fashion.
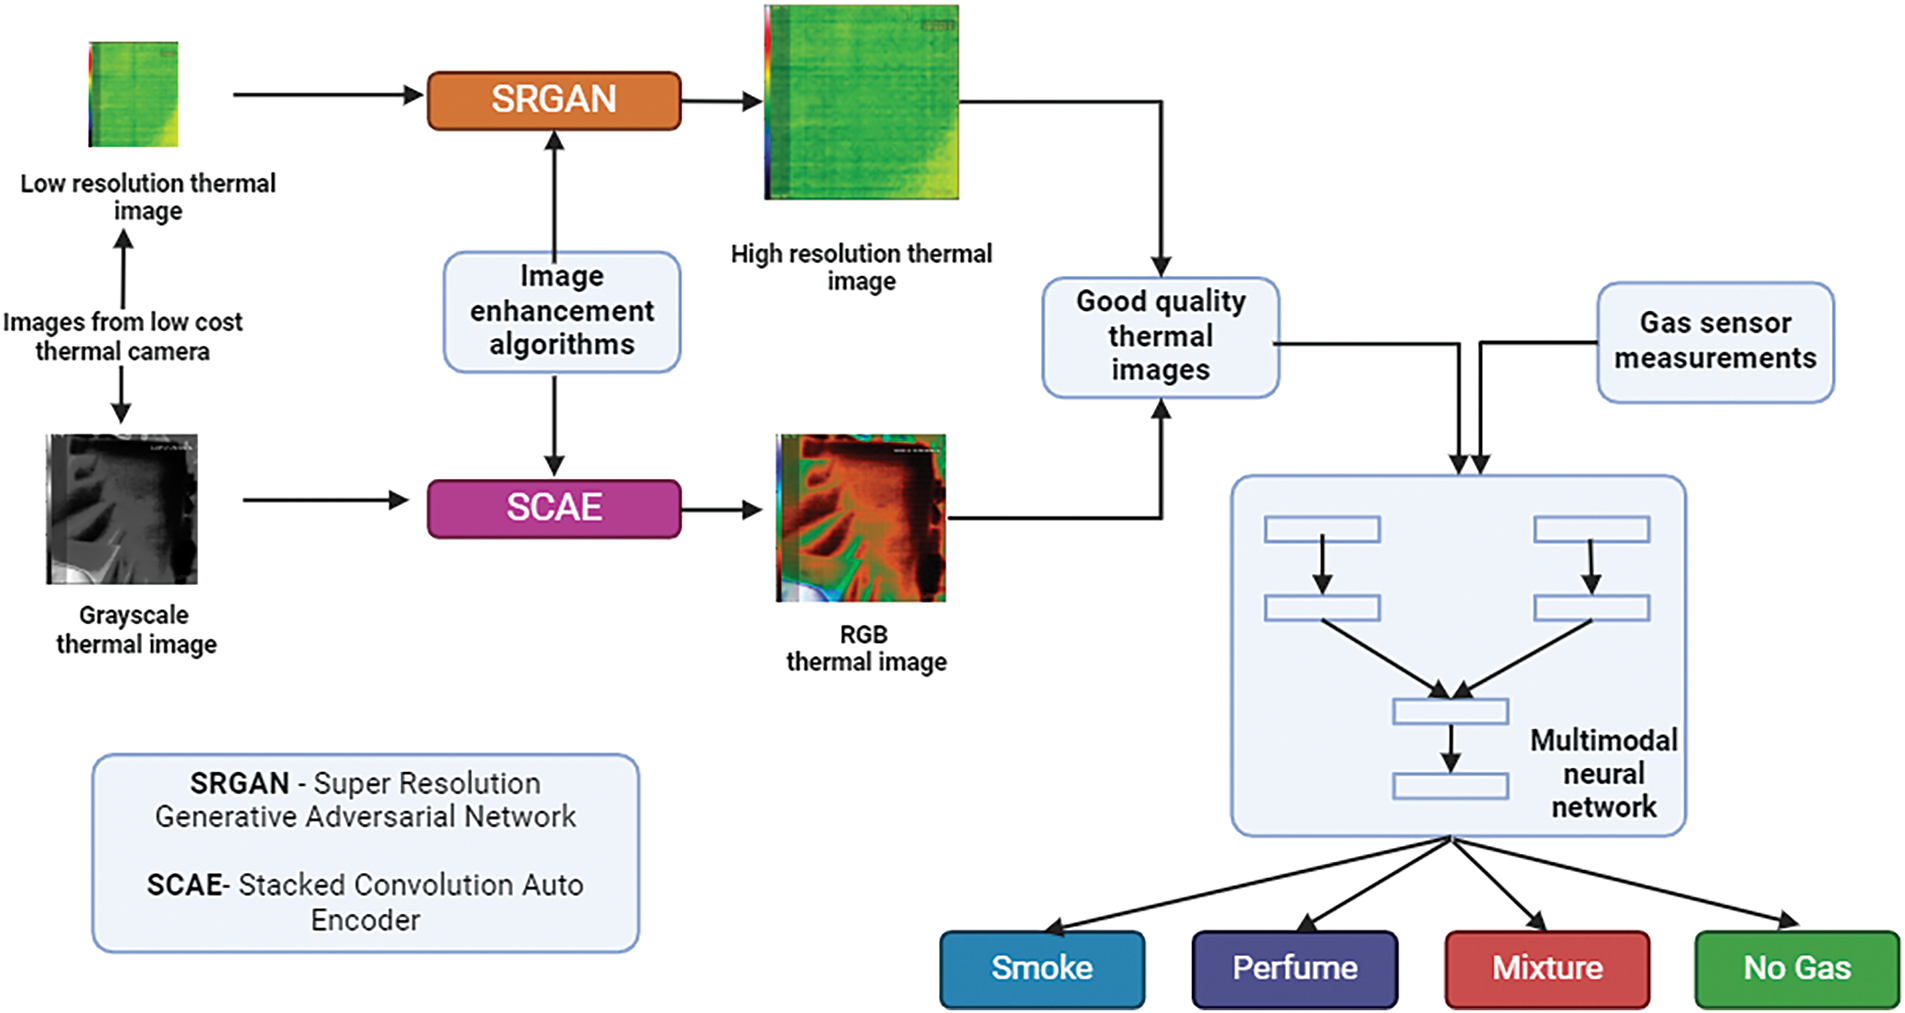
Figure 1: Pictorial representation of the proposed workflow
All the thermal images were resized to 256 * 256 * 3 and were rescaled to maintain the pixel intensity in the range of 0–1, respectively. The sensor data was scaled and normalized using standard scaler and normalizer functions present in sklearn, respectively. For the task of the super-resolution, the images were resized to the size of 64 * 64 * 3, respectively. For the task of image colorization, the images were resized to a size of 256 * 256 in grayscale format. The e-nose/chemical sensors are in structured format and were in good condition, hence there was no need for any data cleaning operations. All the features were scaled to the range of 0–1 by normalization.
Multimodal learning is defined as the development of machine learning algorithms that consider inputs of different modalities like image, audio, video, and tabular data [32]. In this work, multimodal learning has been implemented for tabular (sensor) and image (thermal camera) data types, respectively. The core idea of multimodal learning is to extract features from each modality individually and combine (fuse) them together to make the combined decision. Hence, the feature extraction part would be different for each modality, and then the features are fused followed by a common algorithm for decision making. In this work, neural networks were used for the multimodal classification process with Artificial Neural Network (ANN) for tabular data processing and Convolutional Neural Network (CNN) for image data processing, respectively.
There are three different strategies for multimodal feature fusion, namely, early fusion, intermediate fusion, and late fusion [33]. In early fusion, the features are fused in the initial stage. So the network will have two inputs, one for image and another for tabular. The input data are then either multiplied or concatenated and the rest of the network will have common processing layers for classification. In intermediate fusion, the CNN algorithm is used to extract features from the image, which is then combined with the tabular features, followed by common processing layers for classification. So one branch of the network will have convolution and pooling layers, which reduce the dimension and extract features from the images, whereas the other branch will have input tabular features. These features are concatenated together, followed by common processing layers for classification. In late fusion, the processing and decision-making are made for both the data types, and the features are fused in the pre-final layer. So both the branches of the network will have layers for feature extraction and decision-making, and the features are concatenated in the pre-final layer, followed by the output layer. In the proposed work, the early and late feature fusion techniques are used.
In this work, for the early fusion strategy, the image and tabular features were concatenated together, followed by a hidden layer with 64 neurons on the relu activation function and the output layer with 4 neurons of the SoftMax activation function. For late fusion, the EfficientNetB2 extract features which are concatenated with the tabular features, followed by two hidden layers, each with 64 neurons of relu activation function and an output layer. Fig. 2 presents the difference between early and late fusion techniques in a pictorial form.
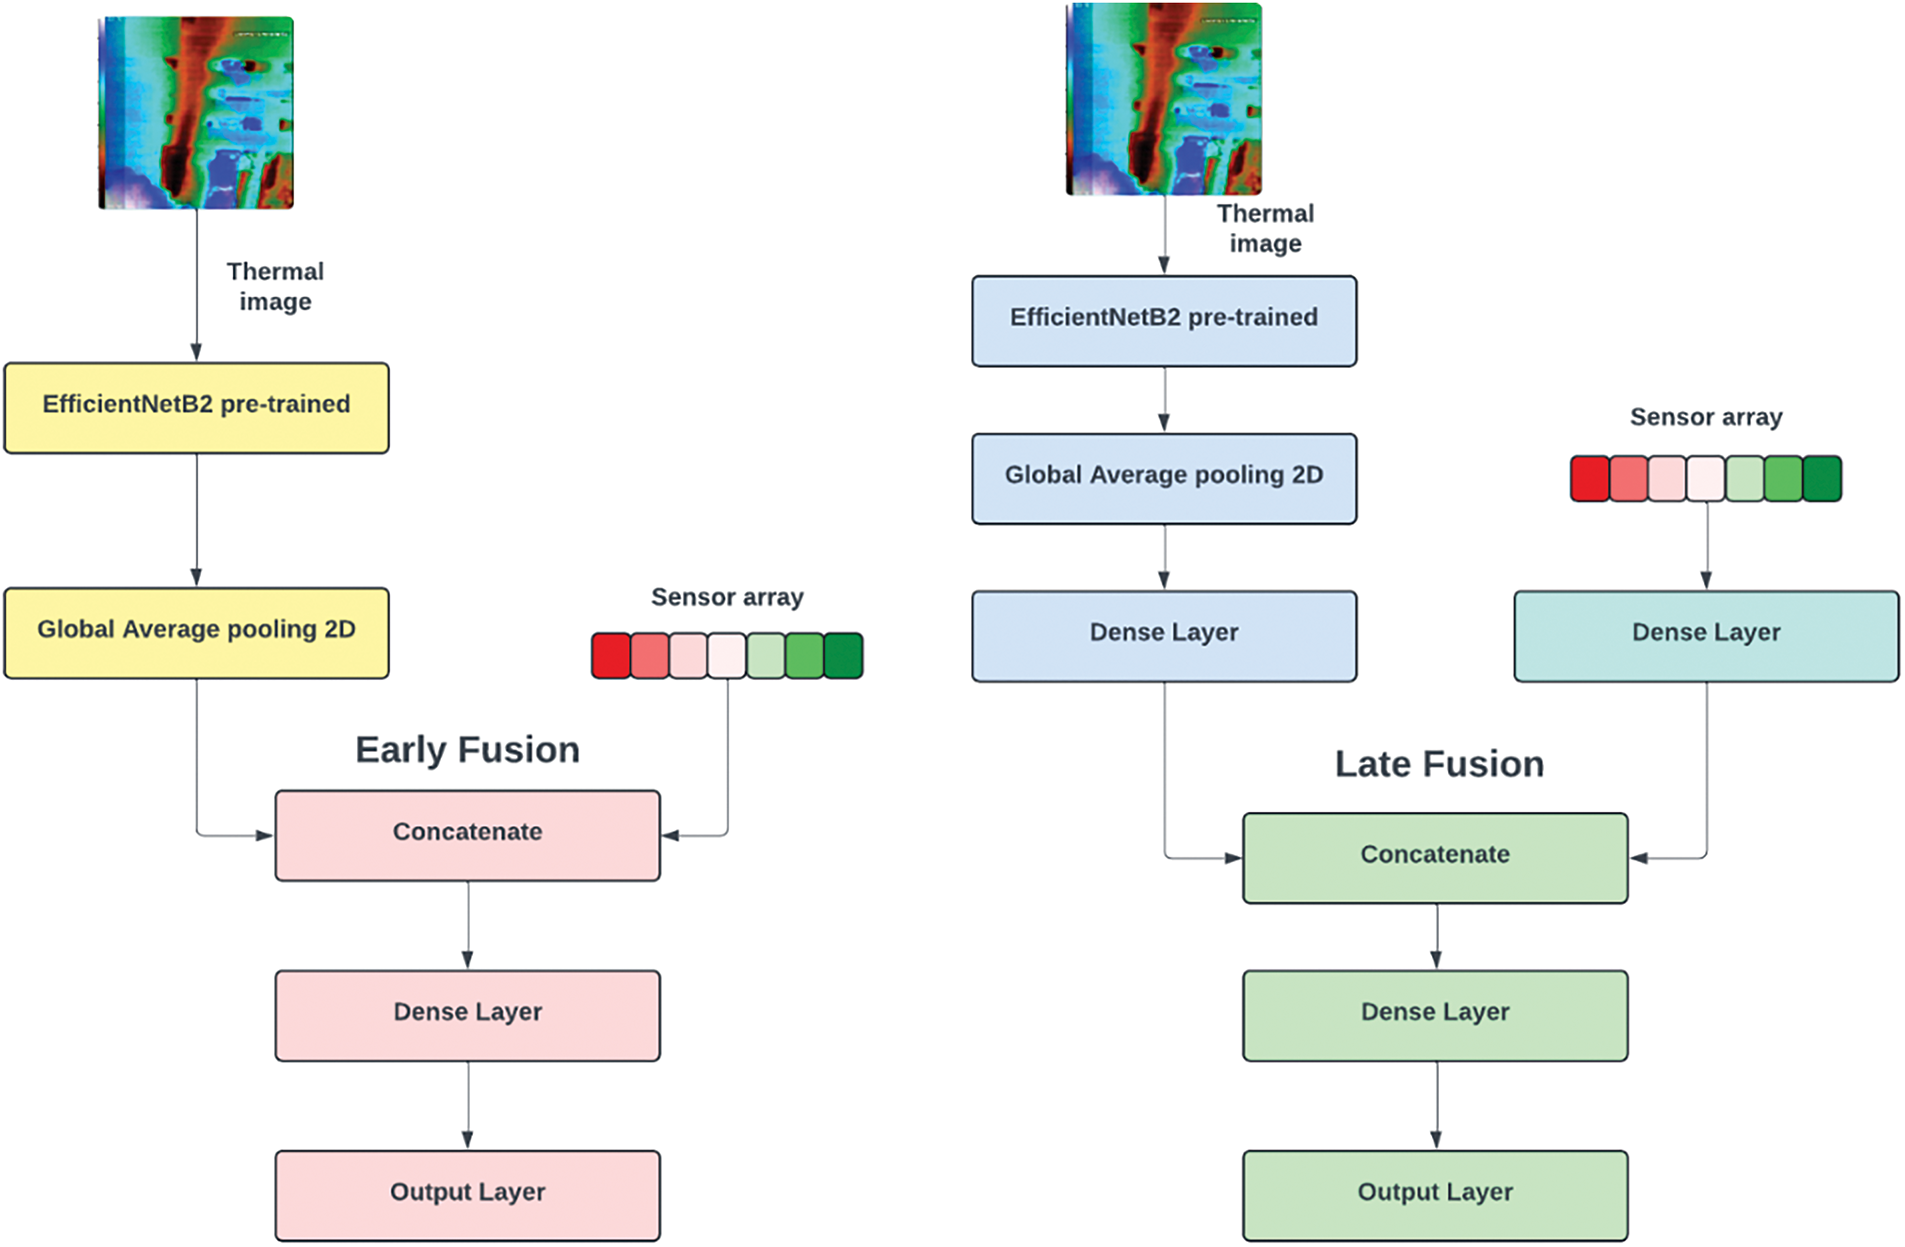
Figure 2: Pictorial representation of the architecture of the early and late feature fusion multimodal neural networks
All the models were trained using Adam optimizer with a loss function categorical cross entropy for 20 epochs with 8 batch sizes. Since the task is of classification, the metrics that were used for evaluating the model were accuracy, precision, recall, and AUC scores. Accuracy is defined as the ratio of the correct predictions to the total predictions. Precision is defined as the negatives predicted correctly to that of the total negatives. It is also called specificity and it is represented by sensitivity defined as the ratio of correctly predicted positives to that of the total positive predictions. This is also known as recall and is represented by AUC refers to the area under the curve. In this case, the curve is the P-R curve (Precision-Recall). This curve is obtained as a plot between the true positive rate and the false positive rate.
3.5 SRGAN for Image Enhancement
Super-resolution is the process of increasing the resolution of the data, primarily images. This concept has a wide range of applications in different fields like medical imaging, satellite imaging, drone imaging, and so on. In the proposed work, the super-resolution concept is used to enhance the resolution of the thermal images generated by a low-cost camera (like a mobile camera) up to the level of an image generated by a high-cost camera and expensive software.
Super Resolution Generative Adversarial Network (SRGAN) is a type of GAN algorithm used to generate high-resolution images. Just like the conventional GAN, the SRGAN comprises generator and discriminator networks, where the generator generates images from the latent space noise and the discriminator discriminates the generated data with that of the real data. In the case of SRGAN, there are some changes in both the generator and discriminator. The generator comprises upscaling blocks, which transpose convolutions, to increase the resolution of the image. With regards to the discriminator, a pre-trained VGG16 network is added in addition to the conventional discriminator.
The generator of the SRGAN algorithm initiates with an input layer of size 100 for latent space noise of Gaussian distribution (mean of 0 and standard deviation of 1), followed by a 9 * 9 convolution layer of 64 neurons with parametric relu (PRELU) activation function. This is followed by 2 residual blocks, with each block comprising two 3 * 3 convolution layers of 64 neurons with PRelu activation function and batch normalization. This block is followed by one layer of 3 * 3 convolution of 64 neurons with PRelu activation function and batch normalization. This is followed by two upsampling blocks, with each block comprising one 3 * 3 convolution of 256 neurons with PRelu activation function followed by an upsampling layer with 2 sampling factors. A total of two blocks result in 4 times upsampling. The generator model concludes with an output 3 * 3 convolution layer with 3 neurons, corresponding to the three channels of the upsampled image. This model accepts an input of 64 * 64 * 3 image, and then extracts important features from it, followed by increasing the resolution of the image to 256 * 256 * 3, which is four times the original size.
The discriminator of the SRGAN algorithm initiates with an input layer of size 256 * 256 * 3, followed by five discriminator blocks, each of 3 * 3 convolutions with leaky relu activation function and batch normalization with neurons of 64, 64, 128, 256, and 512, respectively. These blocks were followed by a flattened layer, a dense layer with 512 neurons of leaky relu activation function, and the output layer with sigmoid activation function, since it is a binary classification problem, with the class labels as low resolution and high-resolution data, respectively. Fig. 3 presents the architecture diagram for the proposed generator and discriminator models, respectively.
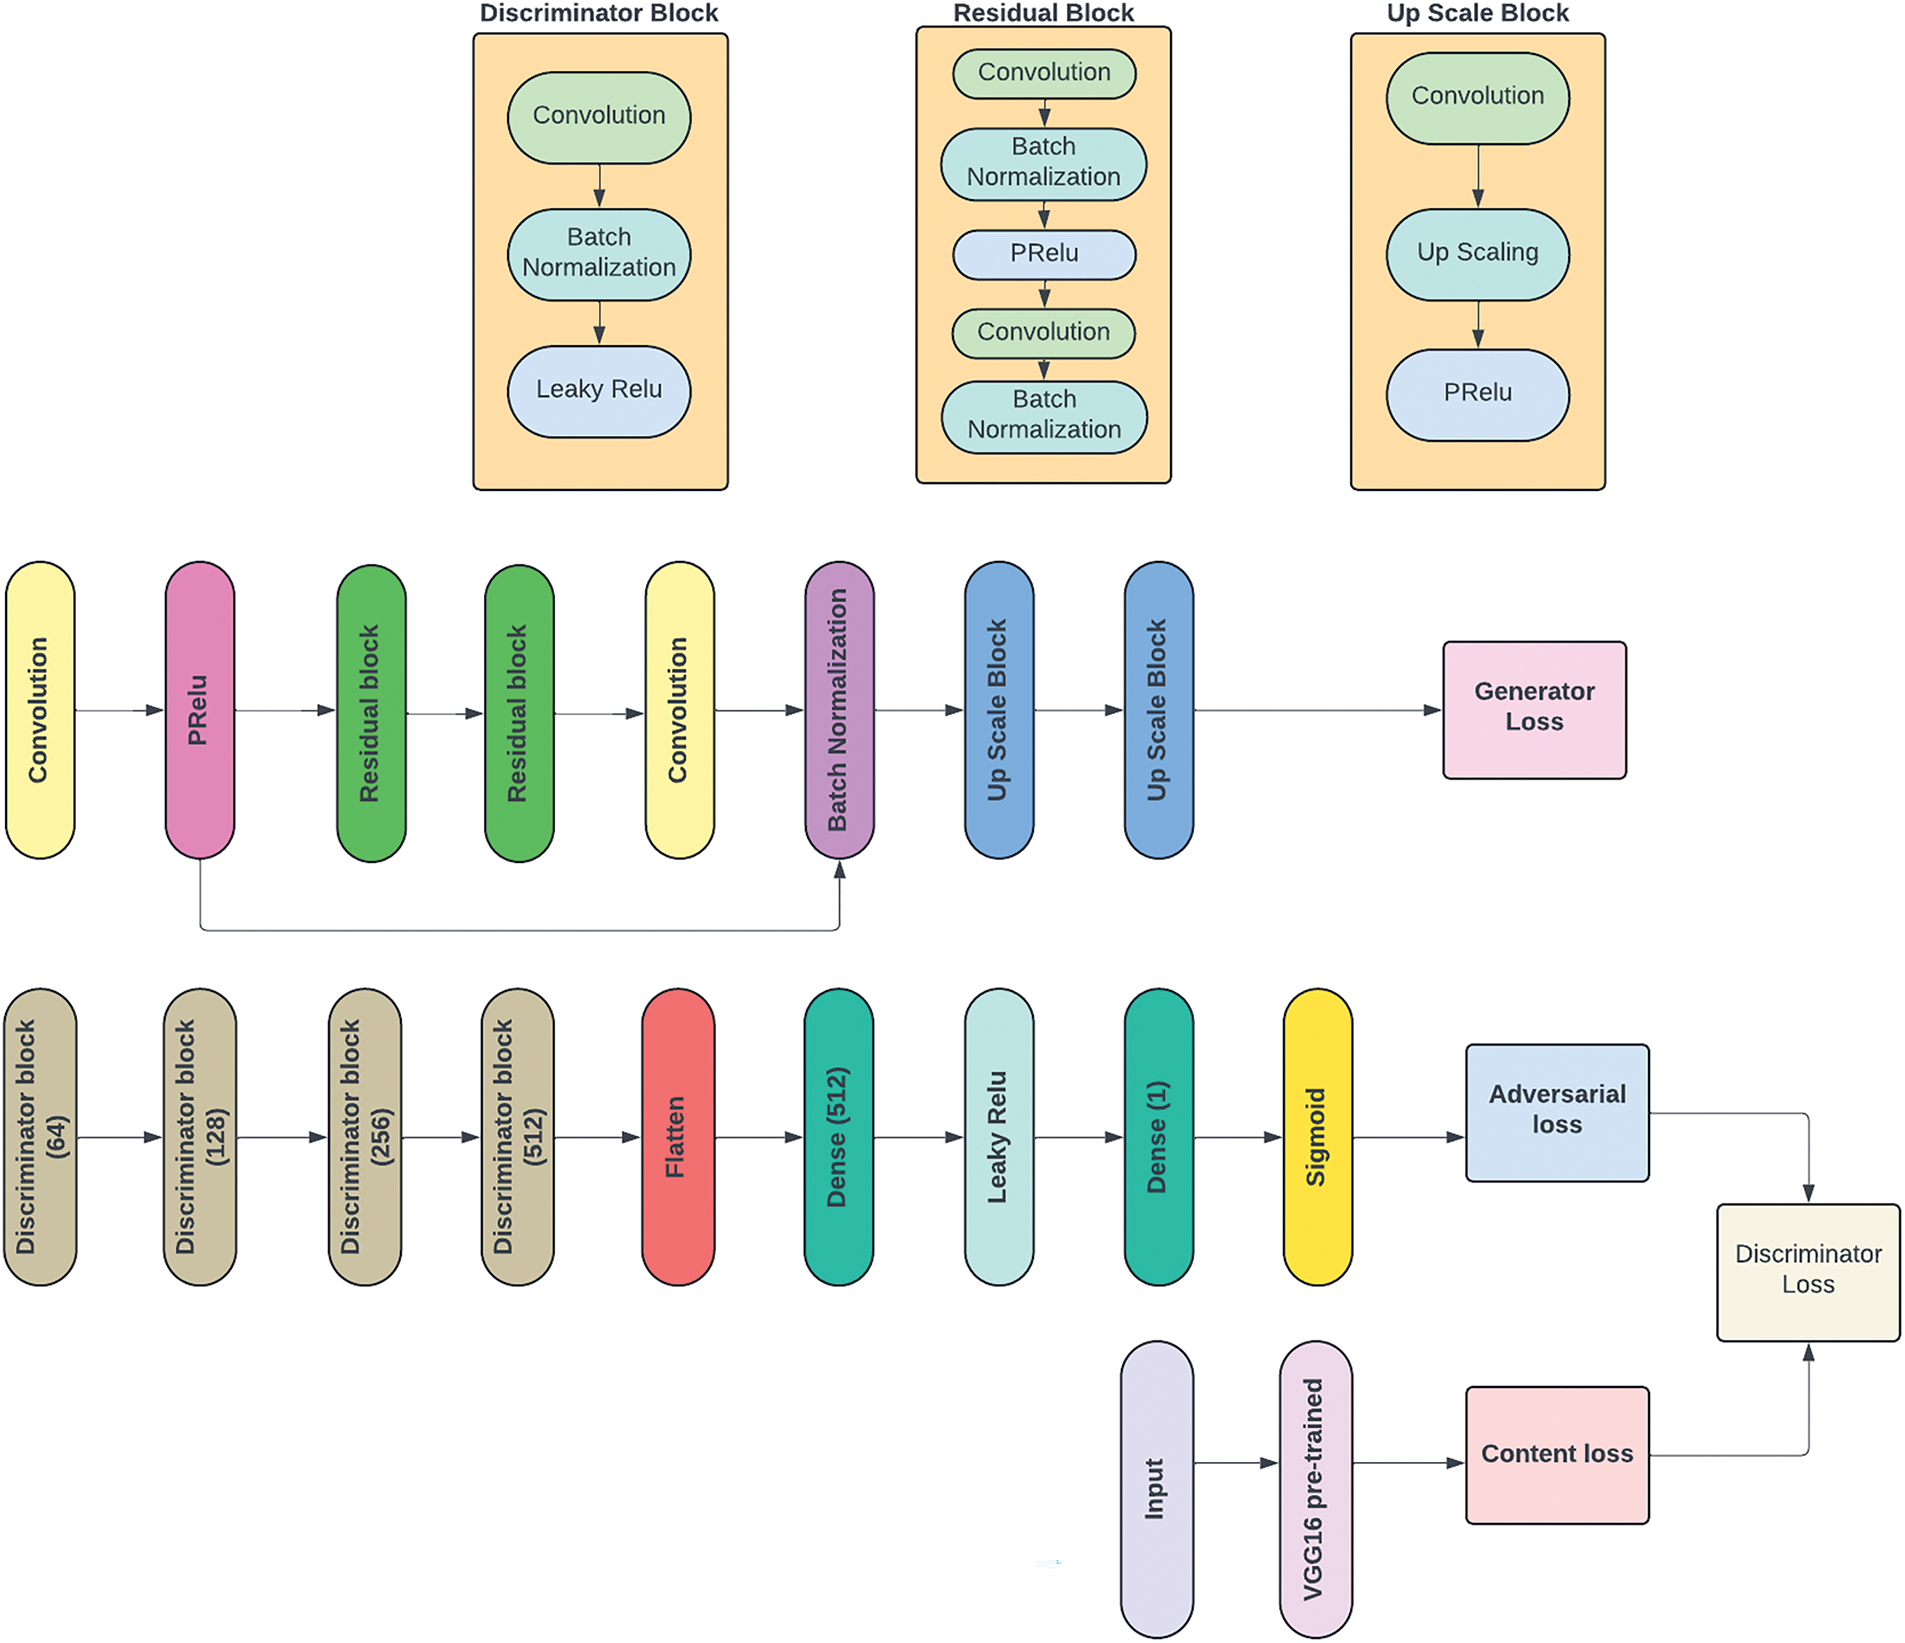
Figure 3: Pictorial representation of the architecture of the generator and discriminator of the SRGAN model
In practice, the discriminator is trained as a separate network with the real and generated data individually [34]. The composite GAN model is developed with both the generator and discrimiantor, by keeping the discriminator non-trainable (the weights are frozen). The standalone discriminator algorithm is trained with adam optimiser function of 0.0001 learning rate along with gradient clipping, followed by binary cross entropy loss function. The SRGAN algorithm is trained with a hybrid loss function, which is a combination of context loss and adversarial loss. The adversarial loss is obtained from the standard discriminator network by using binary cross entropy loss function. The pre-trained Vgg16 network extracts features from both the real and generated image, and then compares them, forming the content loss. The two loss functions are combined in the ratio of 1000:1 to make the hybrid loss function. The composite GAN algorithm is trained using this hybrid loss function along with adam optimizer.
For each epoch of training, the generator generates a batch of high resolution images, then the discriminator is trained on each batch of real and generated images separately, then the vgg16 extracts features from both the real and generated images and this loss function is combined with the loss function from the discriminator. Then the composite GAN model is trained using both the low and high resolution images along with the corresponding labels. On each iteration of training, the generator loss, the hybrid discriminator loss are recorded and the corresponding generator model is saved.
The evaluation metrics used to evaluate the performance of the SRGAN algorithm are Mean Absolute Error (MAE) [35], Root Mean Square Error (RMSE), Peak Signal to Noise Ratio (PSNR) [36] and Structural Similarity Index Score (SSIC) [37]. The MAE score computes the mean absolute difference between the pixels of the original and enhanced images, resulting in a straightforward comparison of the images. Lower MAE values indicate better enhancement. RMSE is yet another metric like MAE, which computes the root mean of the square difference of the pixels between the original and the enhanced images. Similar to the MAE, lesser values of RMSE indicate good enhancement. The PSNR is a standard metric used in electronics, defined as the ratio of the maximum power of the signal to that of the power of the noise. Higher values of PSNR indicate better enhancement, with typical values ranging between 30–50 dB and higher, indicating better image quality. The SSIC is kind of a qualitative measure, which evaluates the local structural patterns of the images, rather than the direct pixel comparison. This score ranges from −1 to +1 with −1 being of utmost dissimilarity and +1 being identical images.
3.6 Autoencoder for Image Colorization
Autoencoders are a set of generative models that can be useful to generate data. In this case, the autoencoders are used to generate colored thermal images from grayscale thermal images. The autoencoder comprises three parts, namely, the encoder, the latent space and the decoder. The encoder is responsible for compressing the data by reducing dimensions and extracting features from it. The extracted features form an intermediate representation of the data, referred to as latent space or code. The role of the decoder is to reconstruct back the data from the latent space. These autoencoder models are trained using regression losses, in the scope of reducing the reconstruction error.
In this paper, sparse convolutional autoencoders (SCAE) were used to generate colorized thermal images from grayscale images. This architecture induces sparsity into the latent space representation, resulting in better feature extraction and improvised performance. The SCAE algorithm comprises five encoder blocks and five decoder decoder blocks concatenated together. The five blocks comprise of
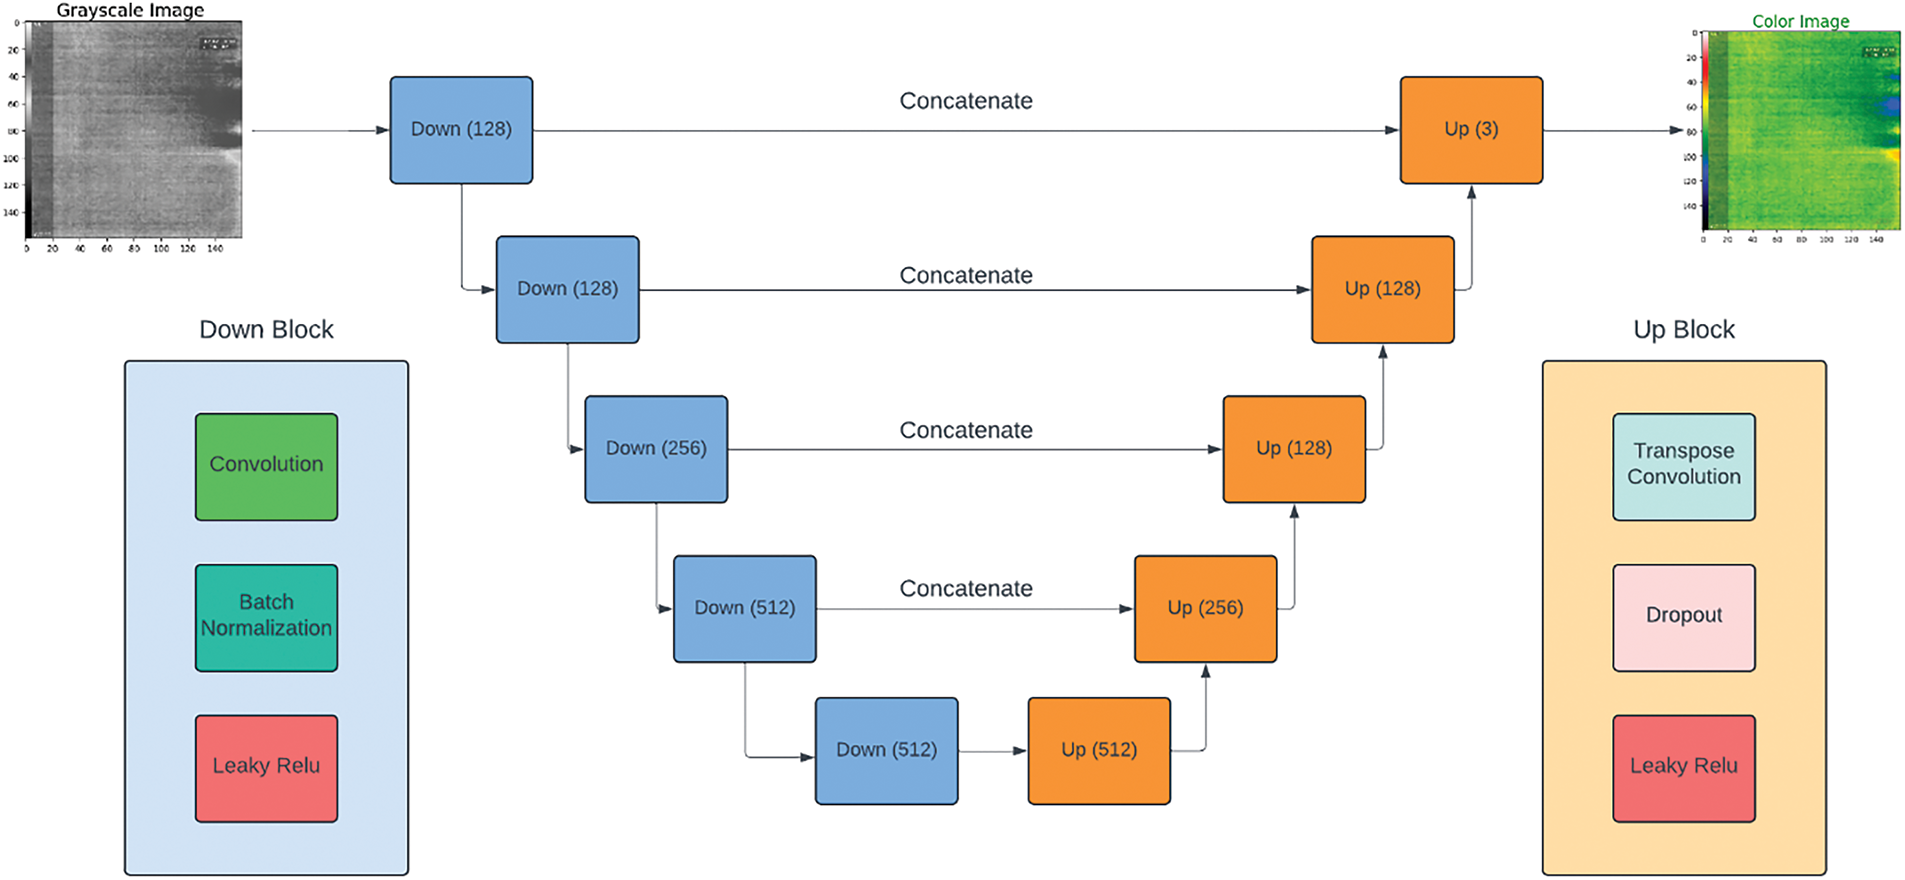
Figure 4: Pictorial representation of the stacked convolutional autoencoder
The metrics used for this task are Mean Squared Error, Root Mean Squared Error, Mean Squared Logarithmic Error and hinge error. These metrics are used to evaluate regression algorithms in general. In this case, it is used to evaluate the performance of the autoencoder in terms of reconstruction error.
The proposed multimodal neural network architecture following both early and late feature fusion were developed and trained on the multimodal data with a batch size of 8 for 10 epochs using the adam optimizer. All the deep learning algorithms were trained using the A400 GPU comprising of 128 GB ram and 2 cores. Table 3 presents the results of the trained multimodal architectures on the validation set.
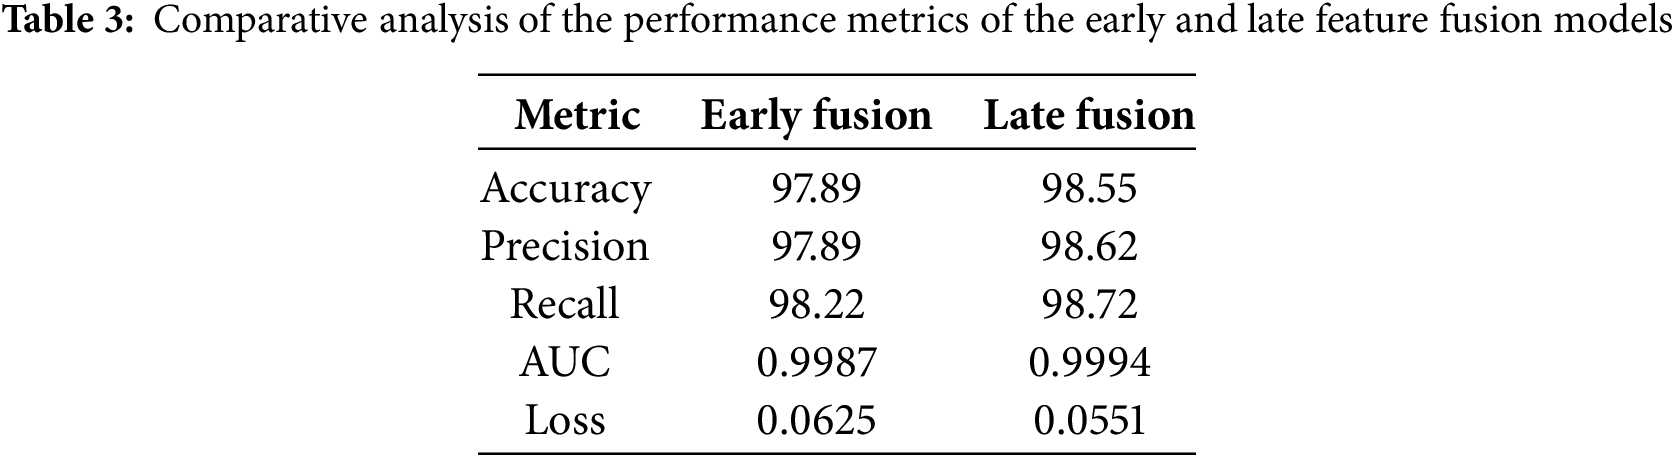
It can be observed from Table 3 that the multimodal neural network employing late feature fusion outperformed that of the early feature fusion in terms of performance metrics. Fig. 5 represents the plot of the different performance metrics over each epoch of the training of the early and late feature fusion multimodal neural network.
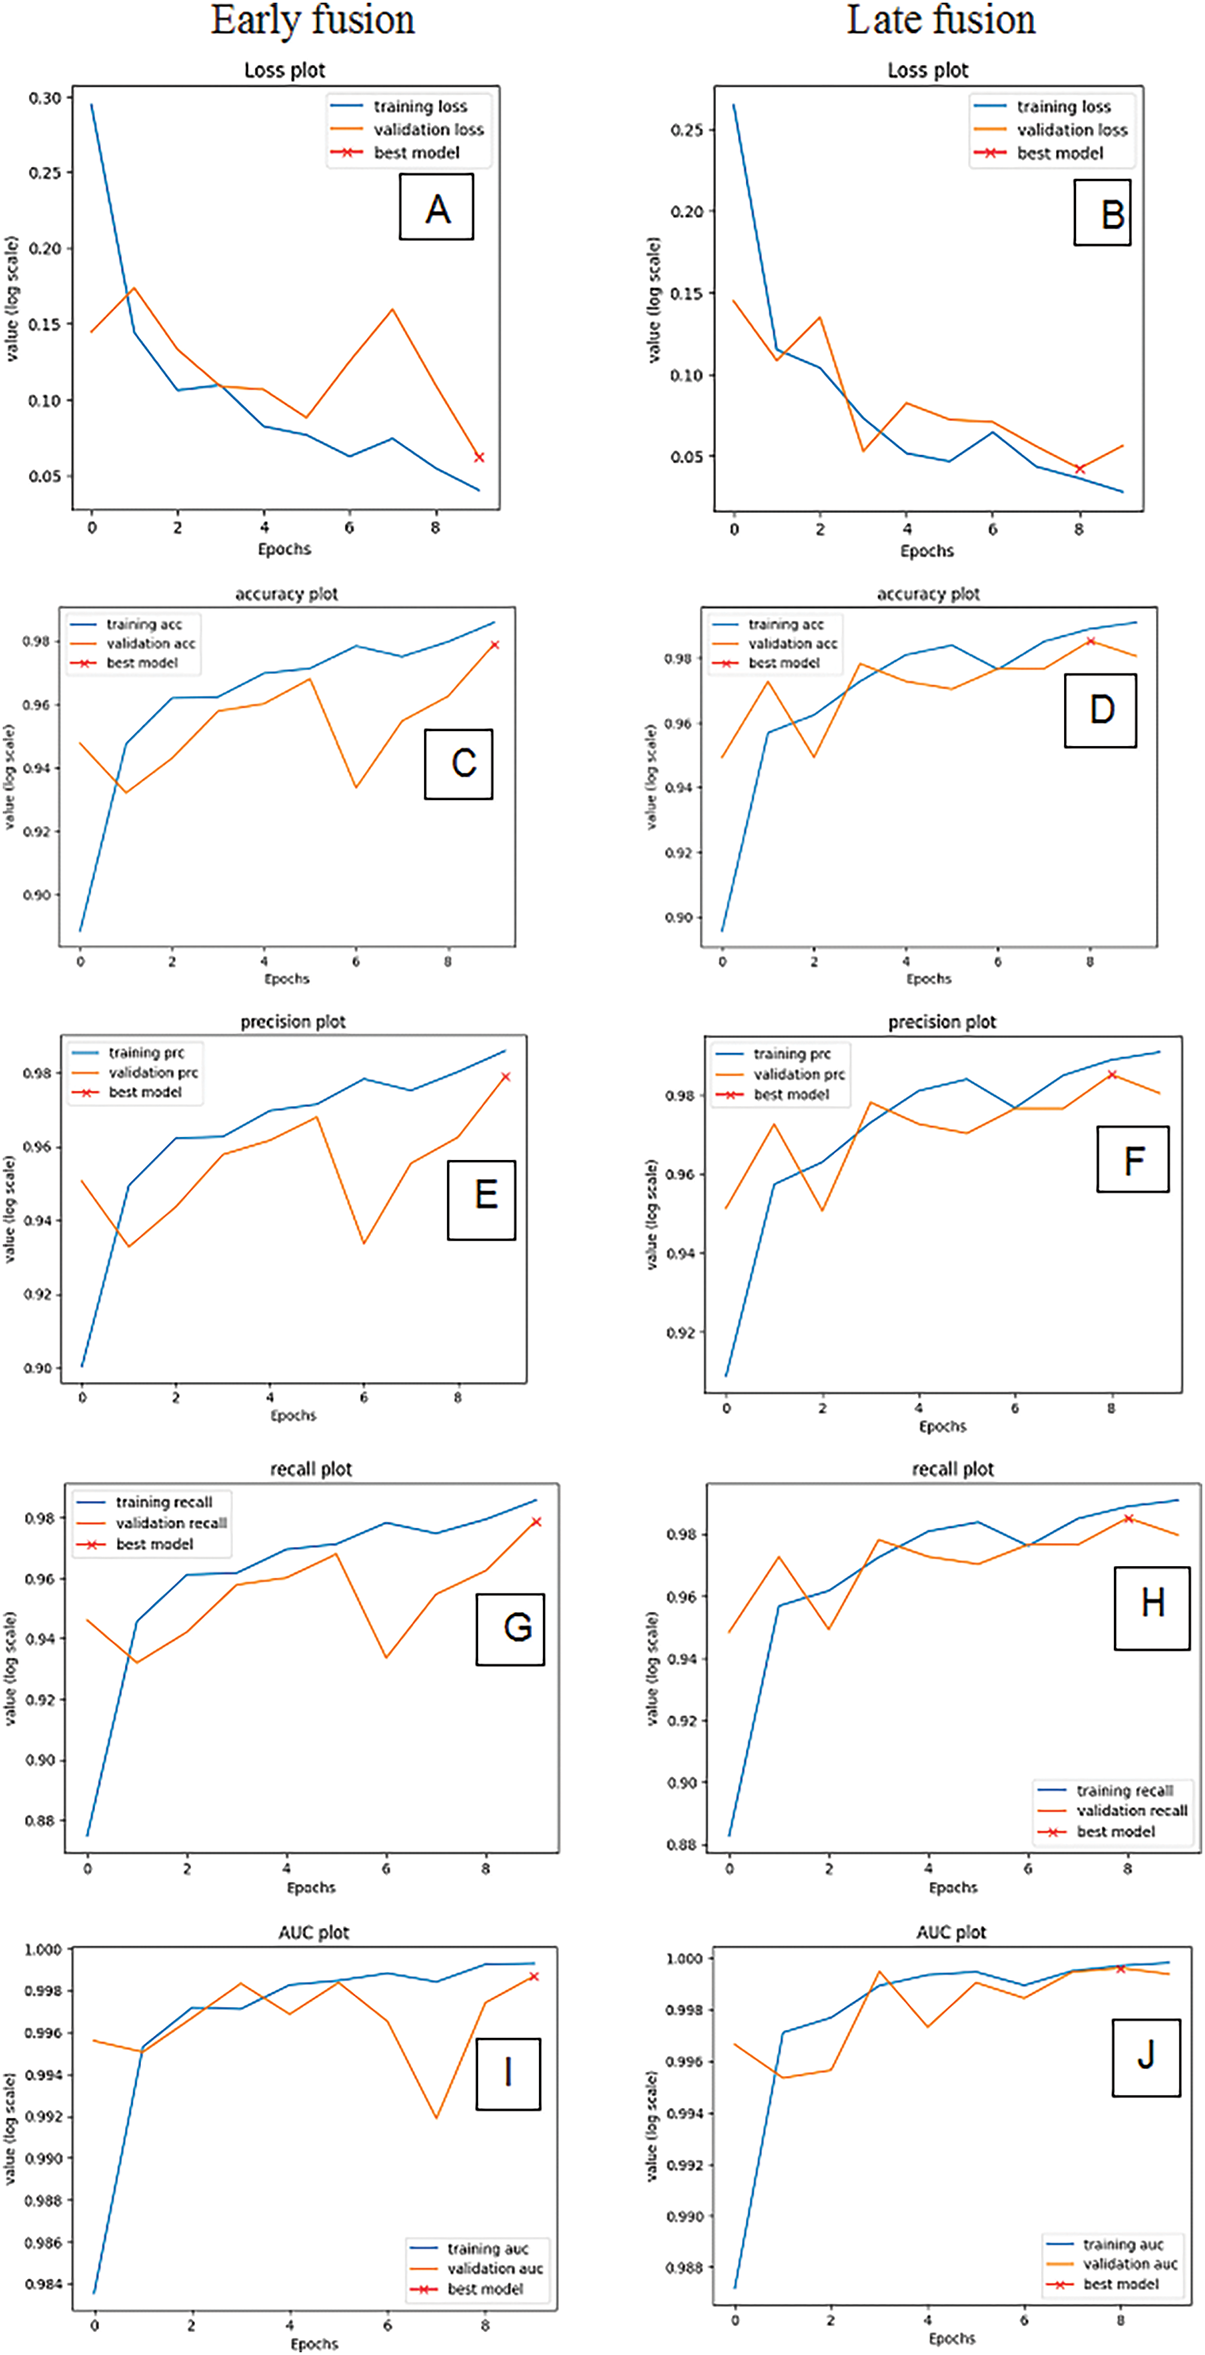
Figure 5: Plots of the performance metrics of the early and late feature fusion neural networks over epochs. (A) Loss values for early fusion; (B) Loss values for late fusion; (C) Accuracy values for early fusion; (D) Accuracy values of late fusion; (E) Precision values for early fusion; (F) Precision values for late fusion; (G) Recall values for early fusion; (H) Recall values for late fusion; (I) AUC values for early fusion; and (J) AUC values for late fusion
The multimodal convolutional neural network has trained well, showing no signs of overfitting or underfitting, as indicated by the plots from Fig. 5. Also, the models have achieved high classification accuracy, even at low epochs (10), indicating the powerful architecture of the models leading to enhanced performance. Fig. 6 presents the confusion matrix and classification report of both the early and late feature fusion multimodal neural networks on the validation set.
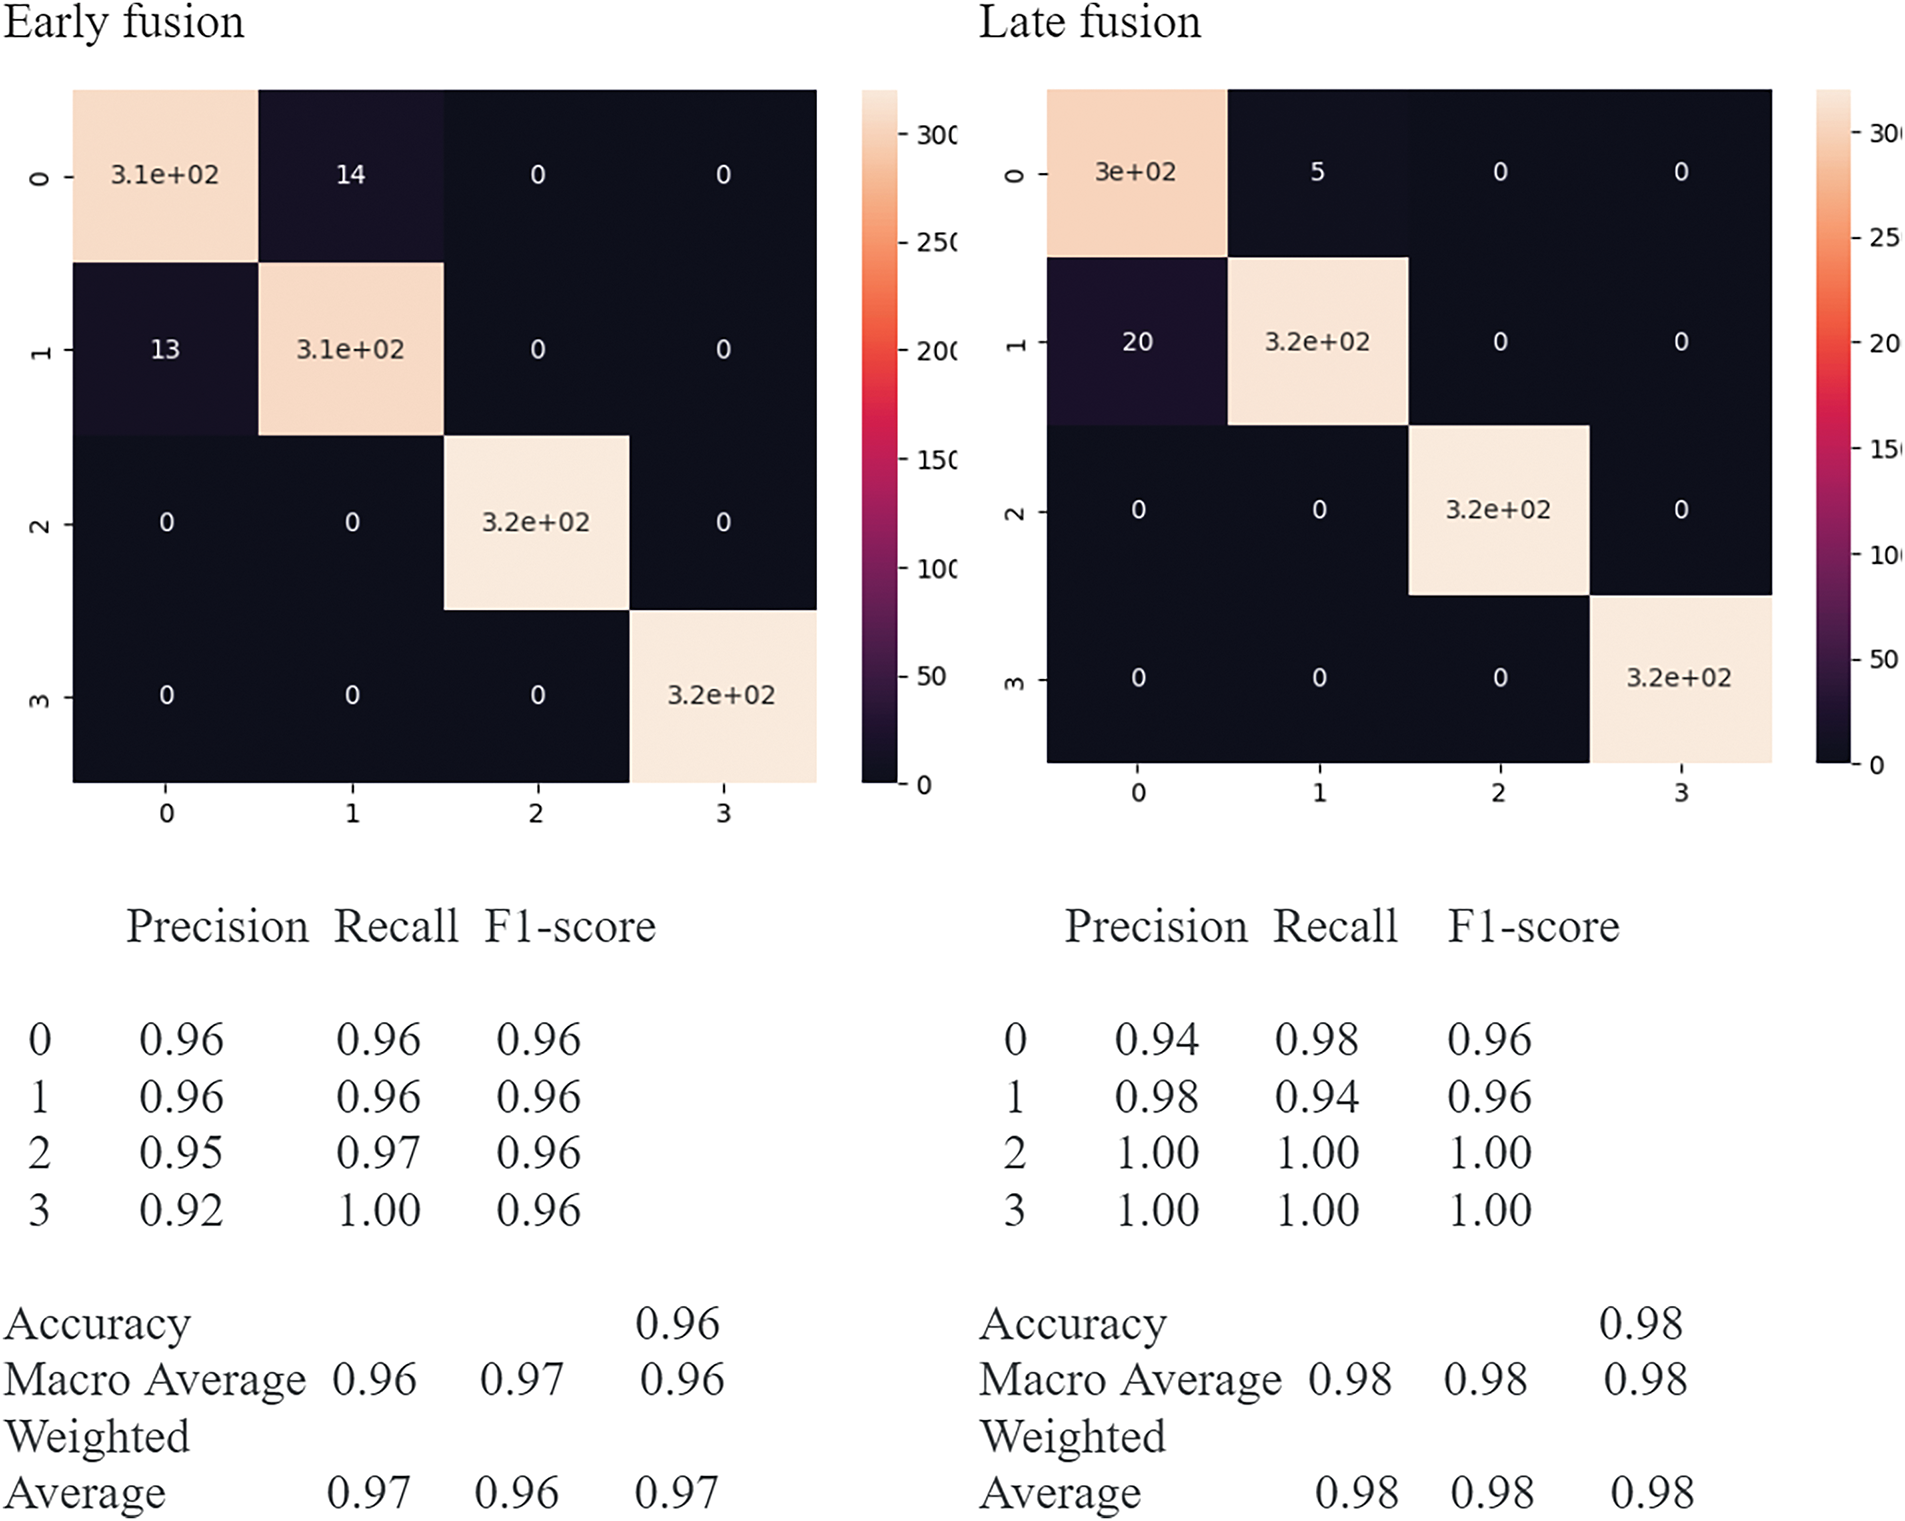
Figure 6: Confusion matrix and classification report of the trained early and late feature fusion models
As indicated in Fig. 6, the confusion matrices show very less false positive and negative cases and very high true positive cases, showing no sign of class imbalance. Also, the classification reports indicate very high precision, recall, and F-1 scores for all four classes. Hence based on the confusion matrix and classification report, it is evident that the trained model is good, showing no signs of overfitting, underfitting, or class imbalance.
4.2 Image Resolution Enhancement
The SRGAN algorithm was trained for 25 epochs with 64 batch sizes. The training dataset comprises 1600 low-resolution images of dimension 64 * 64 * 3 and 1600 high-resolution images of dimension 256 * 256 * 3, respectively. Table 4 presents the different metric values for the SRGAN algorithm in comparison with interpolation techniques.
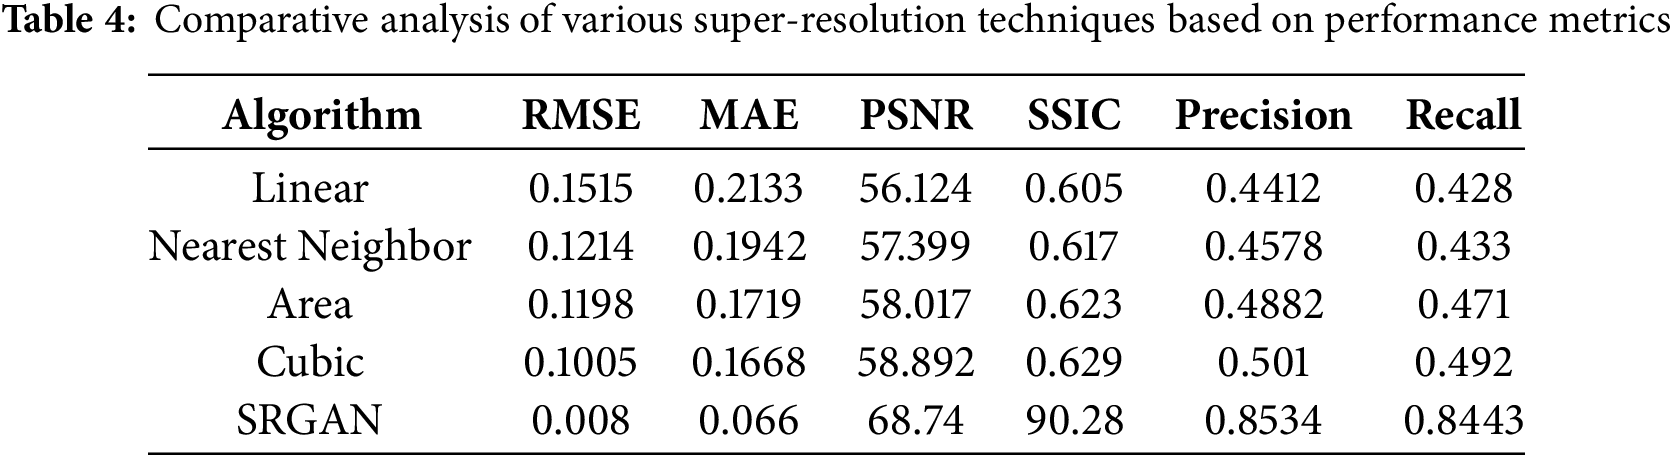
It is obvious from Table 4 that the trained SRGAN algorithm has produced very low RMSE, MAE, and very high PSNR and SSIC scores in comparison to that of the standard interpolation techniques. These results provide quantitative proof of the superior performance of the trained SRGAN algorithm. Fig. 7 represents the low-resolution input image, the high-resolution image generated by the SRGAN algorithm, and the corresponding ground truth high-resolution image at the initial stage of training (epoch-1).
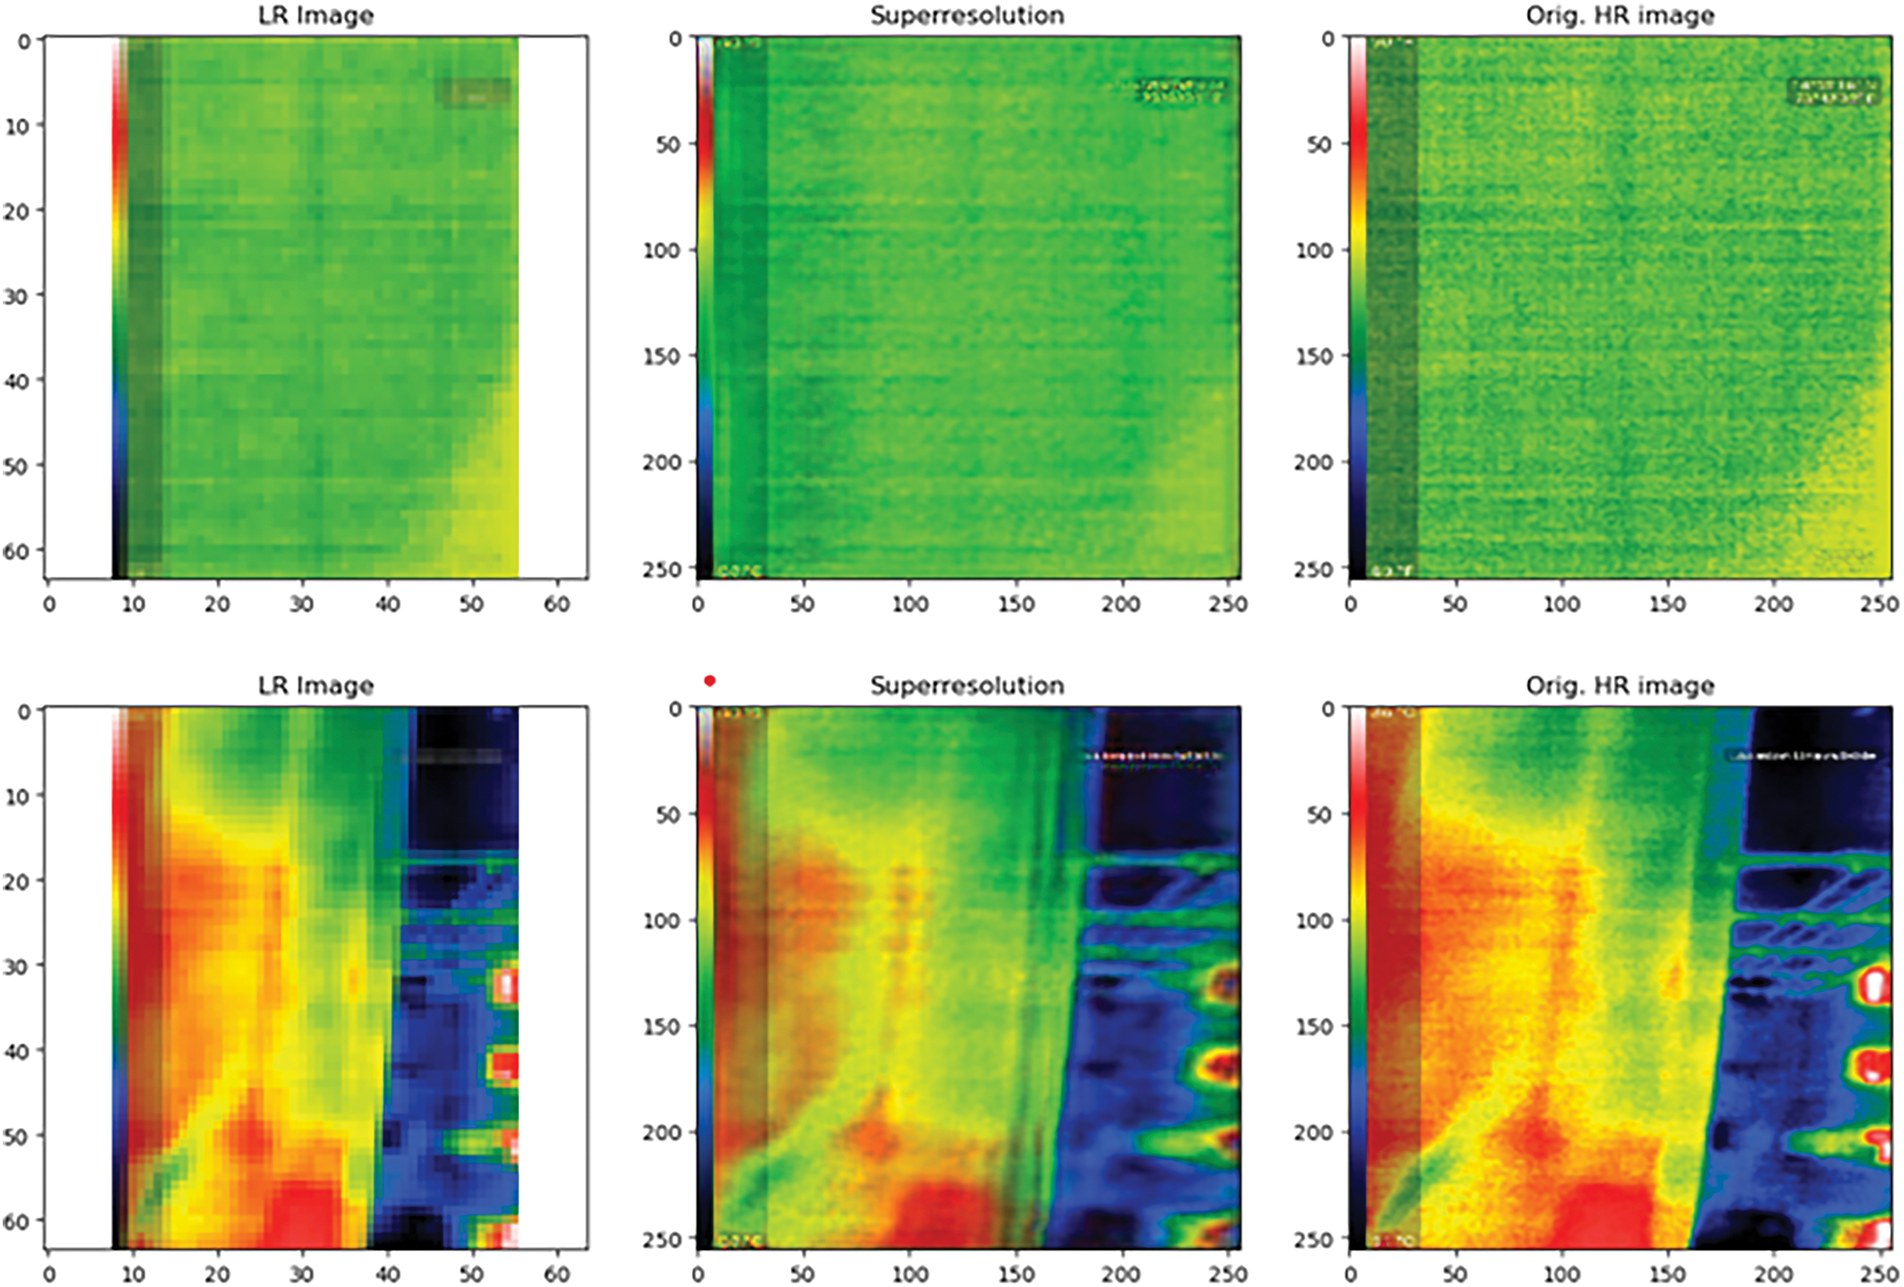
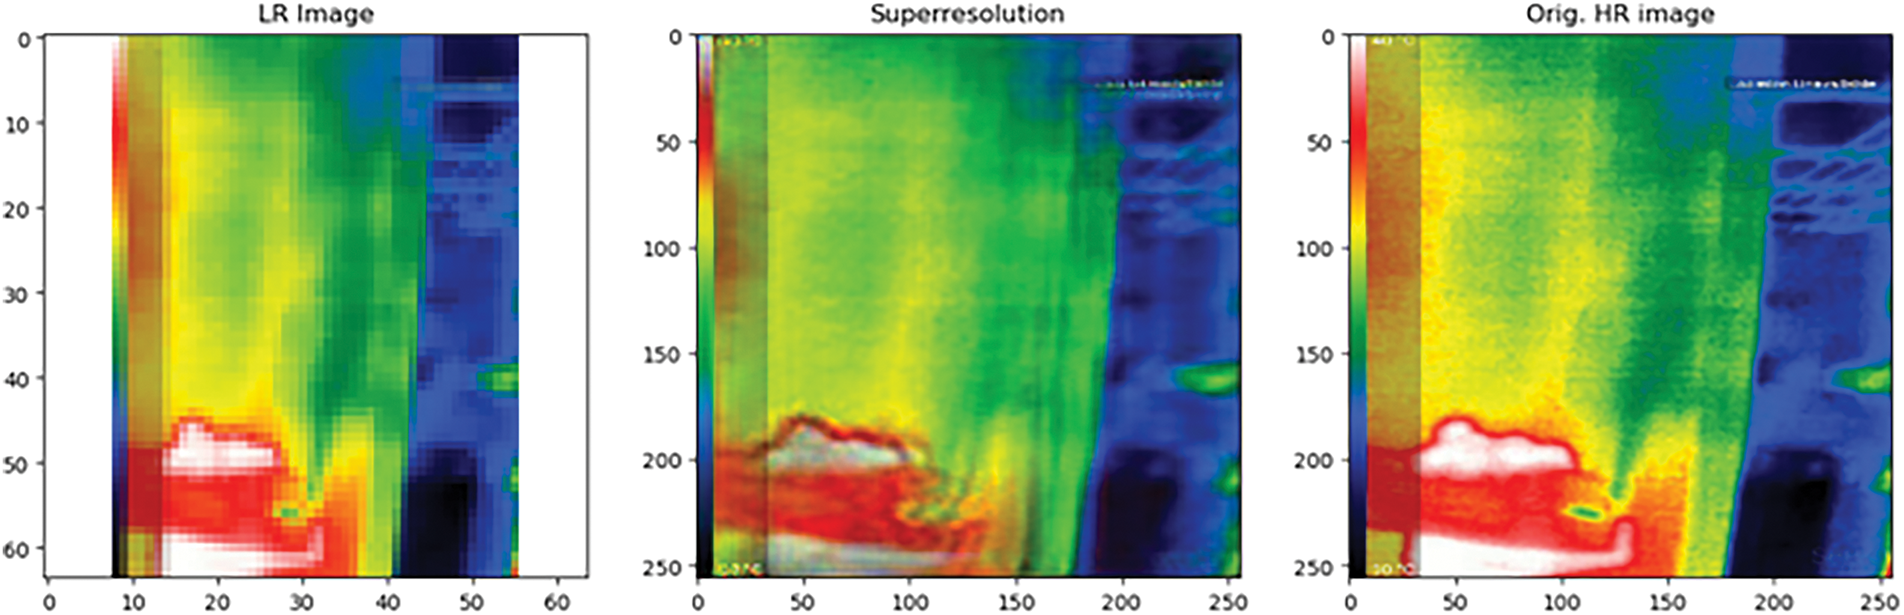
Figure 7: Low-resolution input image, the high-resolution image generated by the SRGAN algorithm, and the corresponding ground truth high-resolution image at the initial stage of training (epoch-1)
Fig. 8 presents the low-resolution input image, the high-resolution image generated by the SRGAN algorithm, and the corresponding ground truth high-resolution image at the middle stage of training (epoch-12).
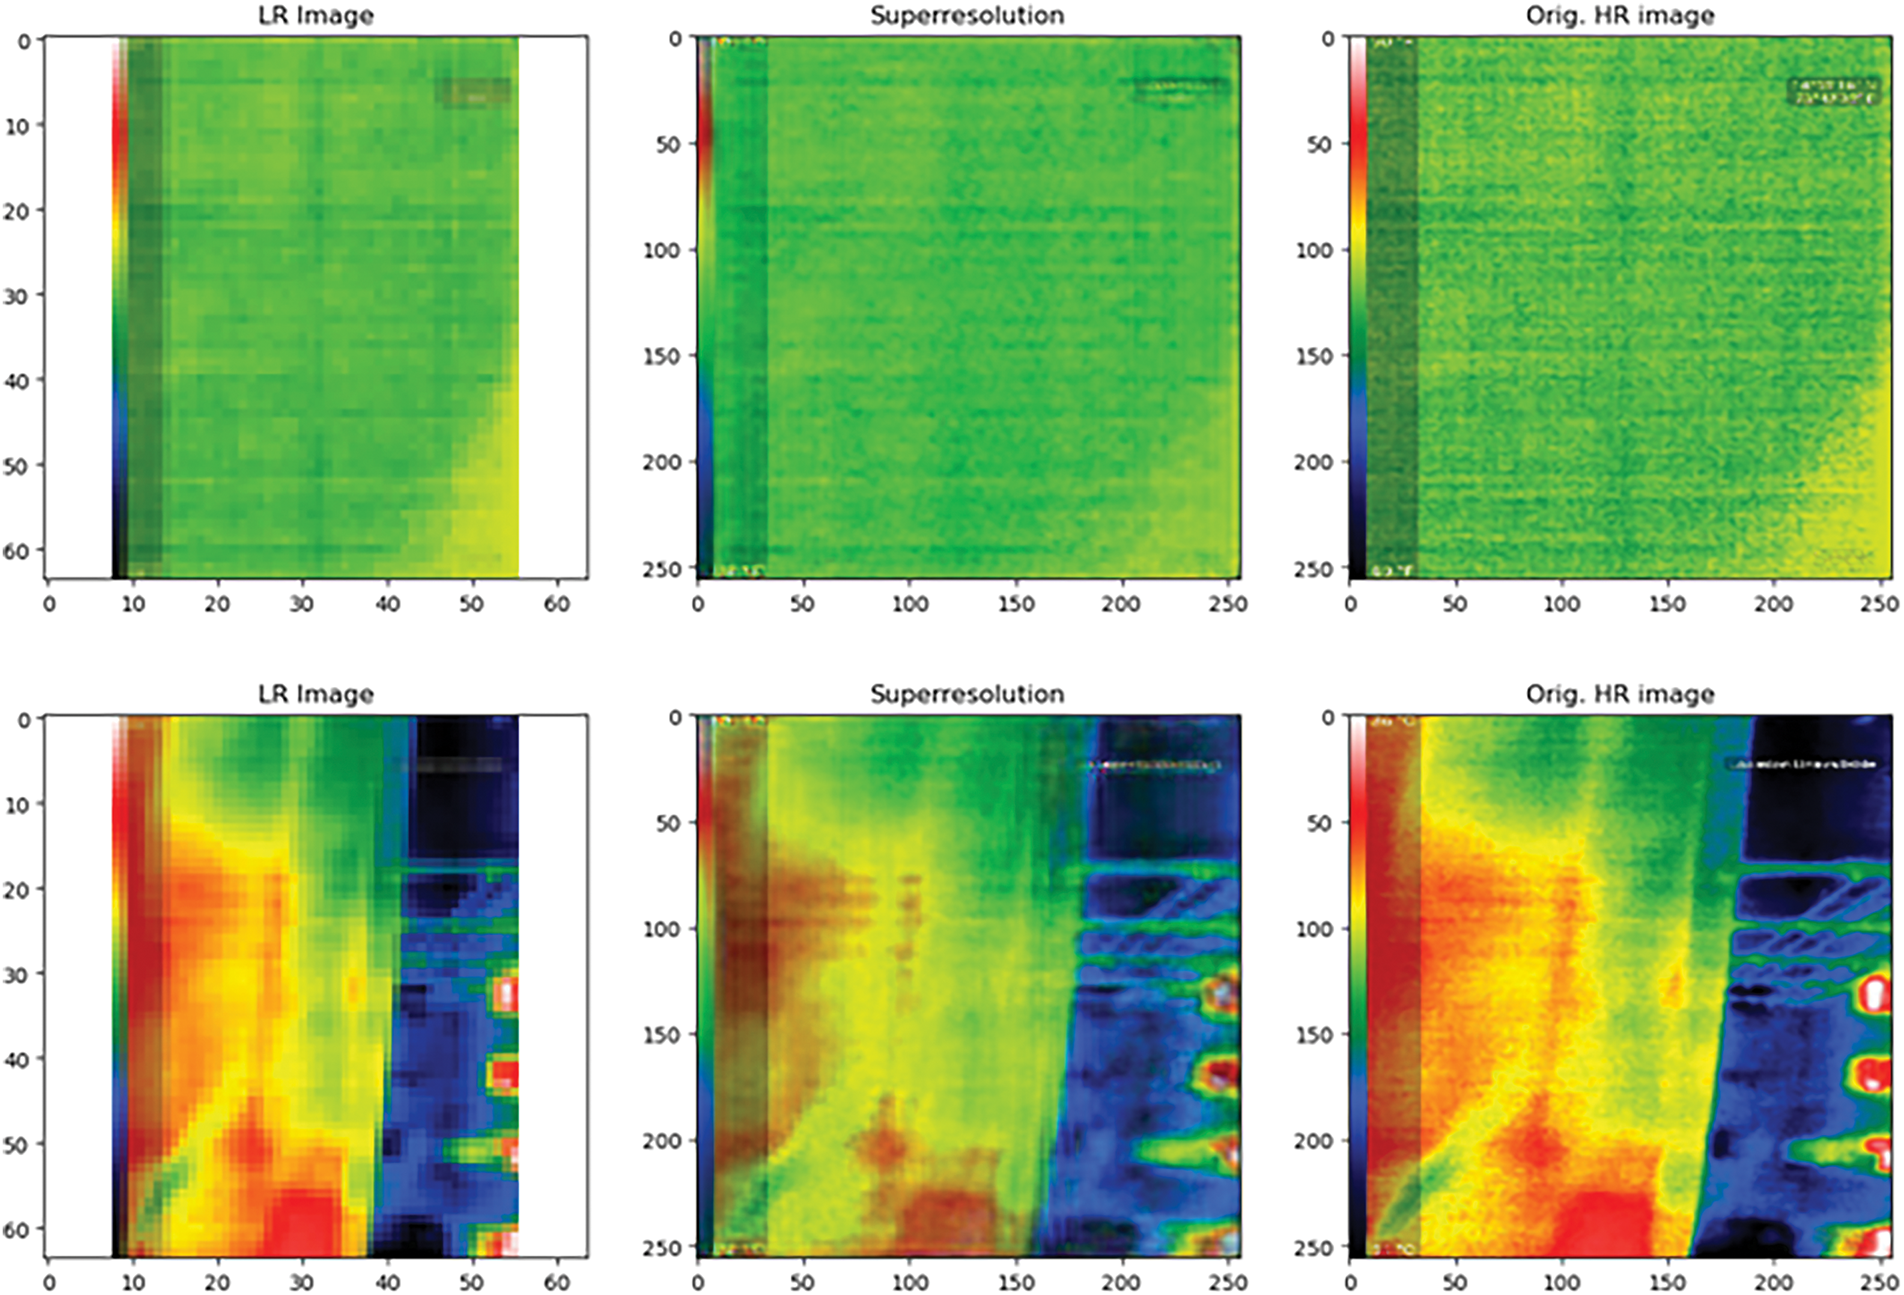
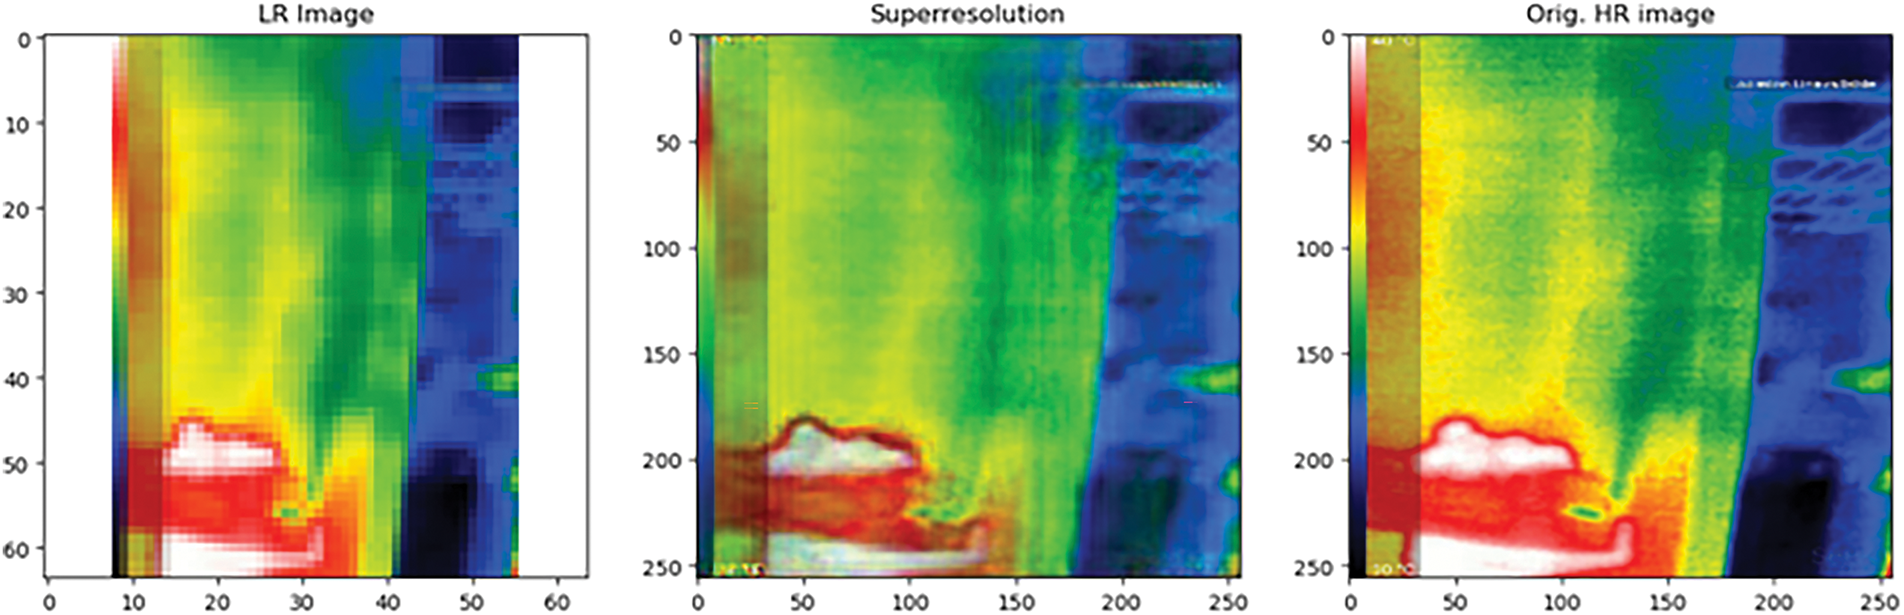
Figure 8: Low-resolution input image, the high-resolution image generated by the SRGAN algorithm, and the corresponding ground truth high-resolution image at the middle stage of training (epoch-12)
Fig. 9 presents the low-resolution input image, the high-resolution image generated by the SRGAN algorithm, and the corresponding ground truth high-resolution image at the last stage of training (epoch-25).
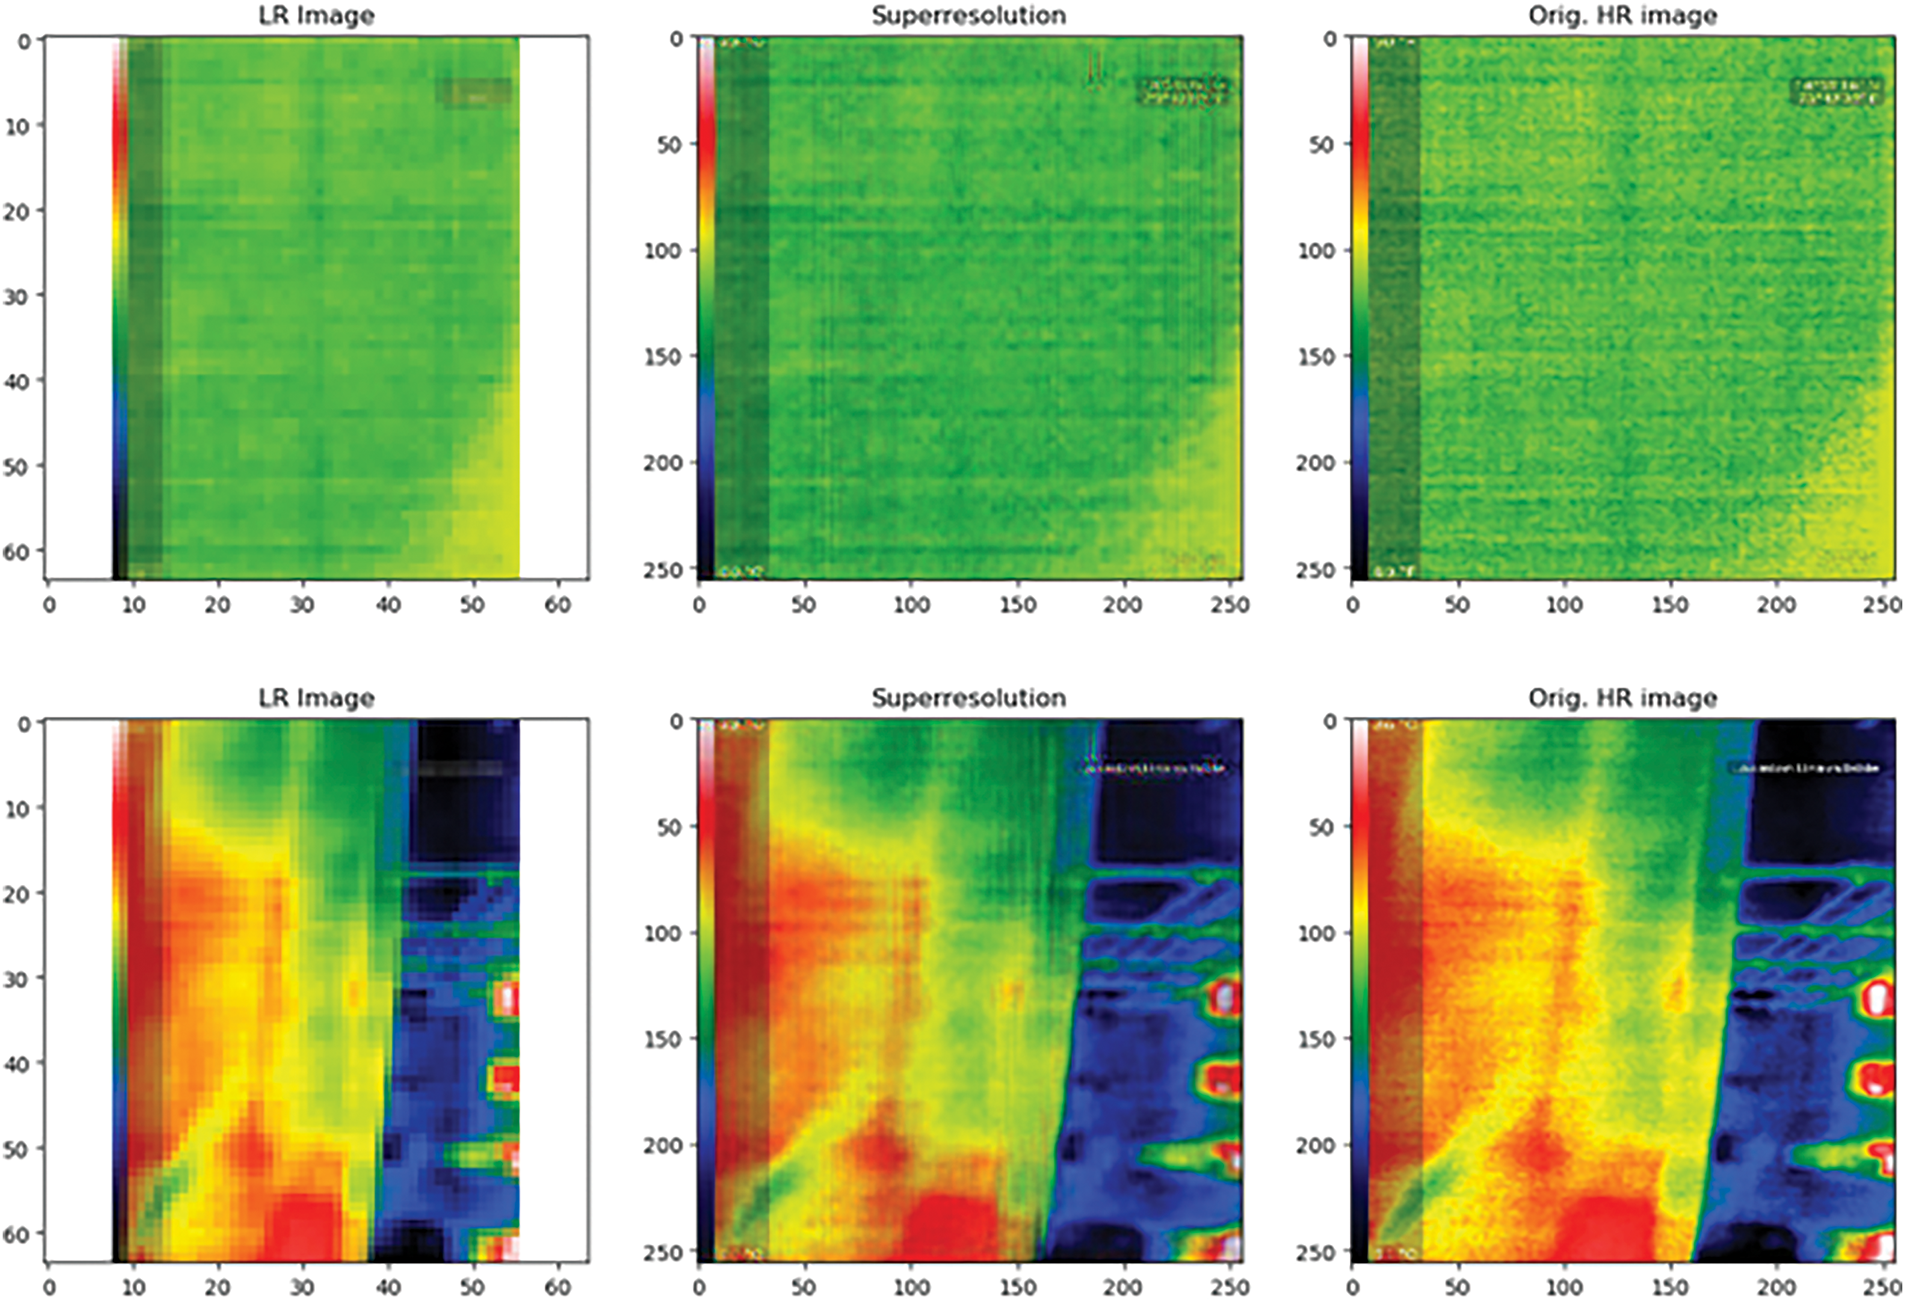
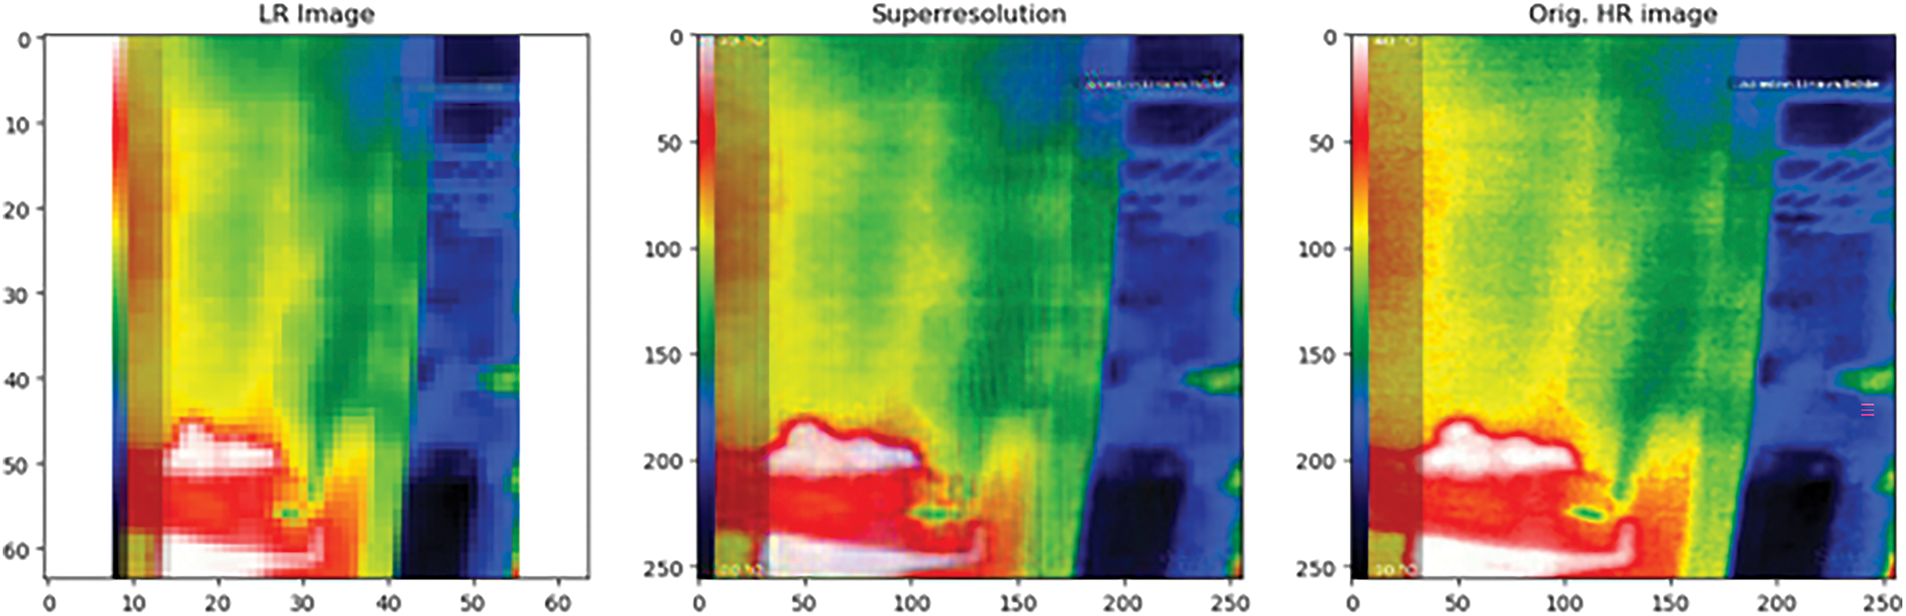
Figure 9: Low-resolution input image, the high-resolution image generated by the SRGAN algorithm, and the corresponding ground truth high-resolution image at the last stage of training (epoch-25)
Based on the visual inspection of Fig. 9, it is obvious that the SRGAN algorithm at the last epoch has performed well in generating high-resolution images better than in the initial epoch and the model has well learned the task, giving attention to minute details. This algorithm has been able to successfully generate high-resolution images from the low-resolution images, up to the level of ground truth, as proven both quantitatively and qualitatively.
The developed SCAE algorithm was trained with Adam optimizer with a learning rate of 0.0001, mean absolute loss function for 60 epochs, each of 100 steps for 4 batch sizes. Table 5 represents the loss values of the SCAE algorithm after training, for both training and validation datasets.
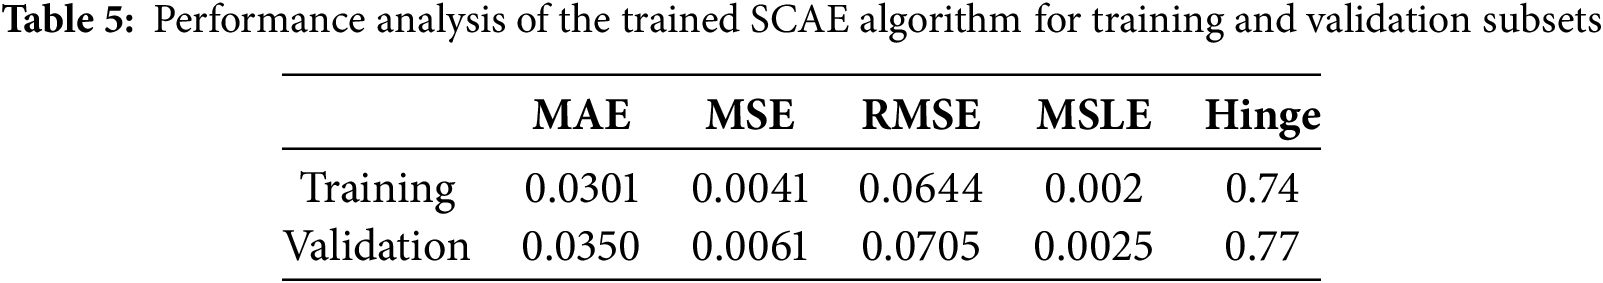
From a quantitative aspect, the trained SCAE algorithm has performed well by generating very little reconstruction error, in terms of MAE and MSE values, which are considered important metrics for evaluation. Fig. 10 presents the performance plots of the SCAE algorithm for each epoch of training, for different loss functions.
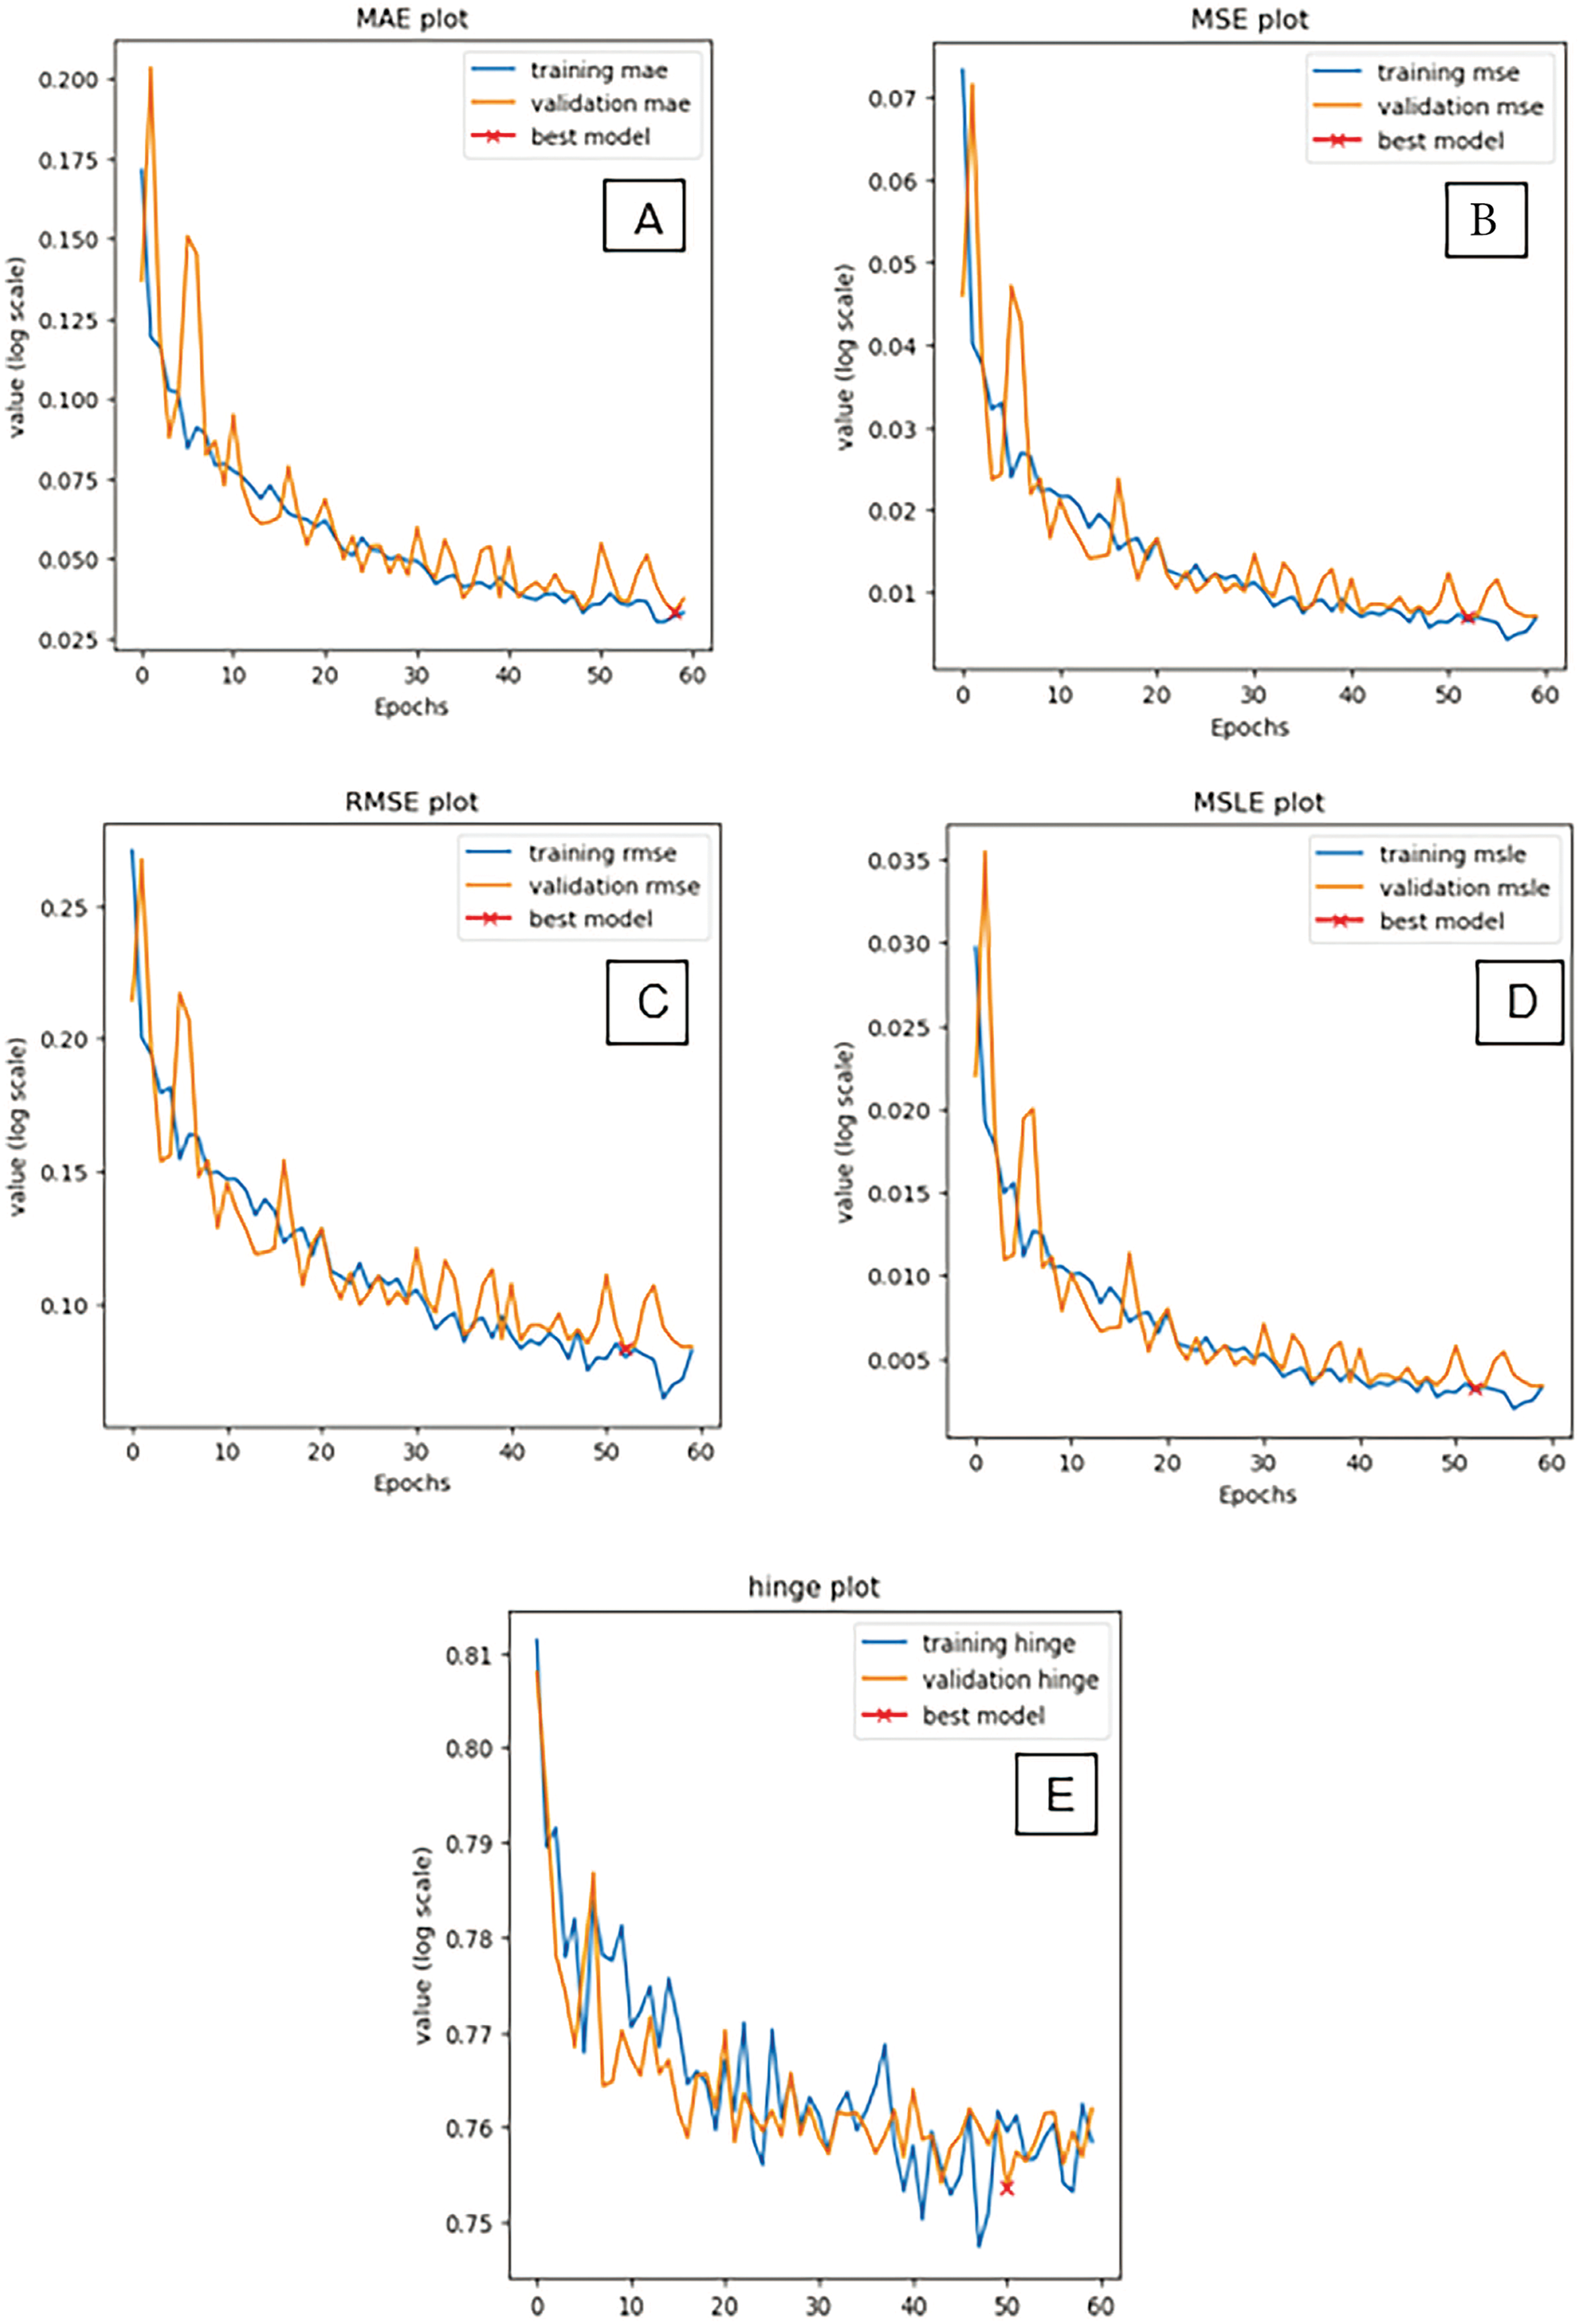
Figure 10: Loss plots of the SCAE algorithm over each epoch of training for different loss functions. (A) Mean squared error values; (B) Mean squared error values; (C) Root mean squared error values; (D) Mean squared logarithmic error values; and (E) Hinge loss values
The initial phases of the training have been observed with some fluctuations in the validation set, followed by a stable convergence and proper fitting. The model plots also support the fact of proper training of the SCAE algorithm and with better evaluation metrics, for both the training and validation sets. The graphs indicate no sign of underfitting and overfitting. Fig. 11 represents the original ground truth color image, the input grayscale image, and the colorized thermal image generated by the SCAE algorithm.

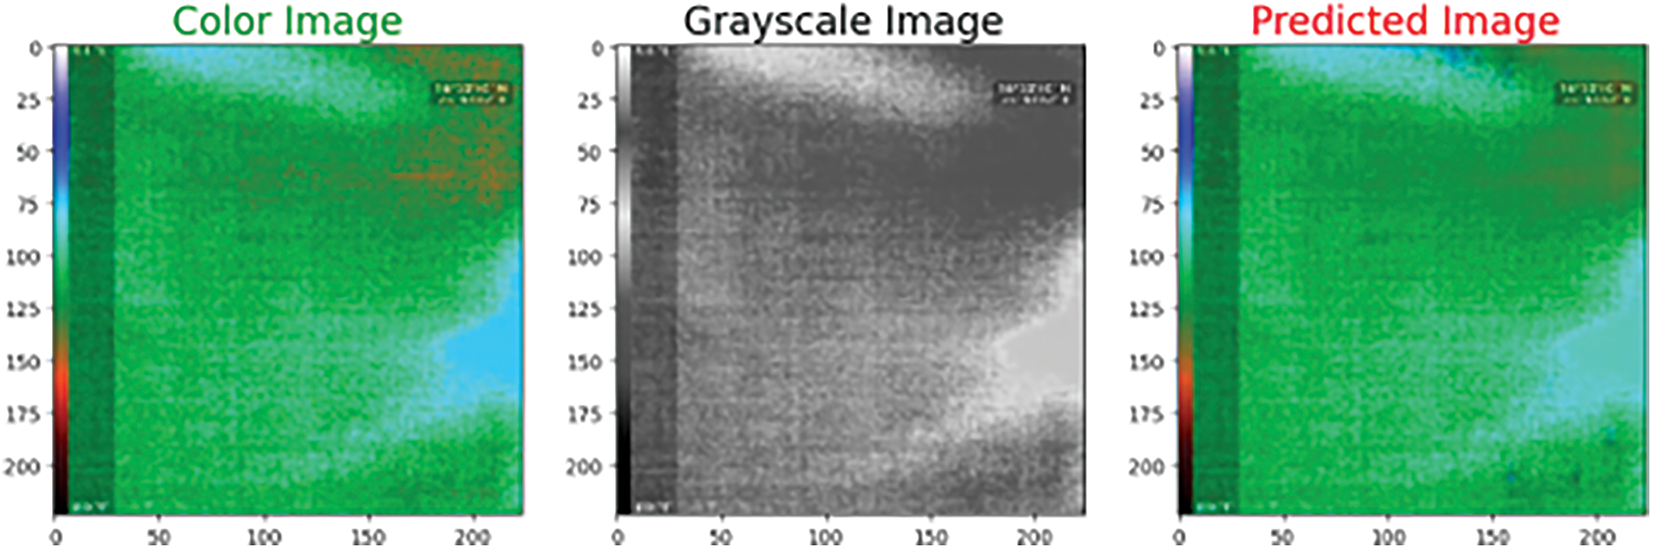
Figure 11: Original ground truth color image, the input grayscale image, and the colorized thermal image generated by the SCAE algorithm
From visual inspection, it is pretty obvious that the SCAE algorithm generates colorful images, similar to that of the ground truth images. Thus both the quantitative and qualitative analysis suggest that the trained SCAE algorithm was able to successfully generate colorized images from the input grayscale images.
The proposed work comprises three sections, the development of a super-resolution generative adversarial algorithm, the development of a stacked convolutional autoencoder, and the development of a multimodal convolutional neural network.
The SRGAN algorithm was trained on low-resolution images to generate high-resolution thermal gas images. The SRGAN algorithm was trained for 25 epochs and the model and the generator model were logged for each epoch. The model with the least loss or highest accuracy is generally considered the best, as in traditional deep learning approaches. However, this is not always true in generative learning approaches, and hence the generator from each epoch was manually tested for a set of low-resolution images and was compared with the real-time high-resolution images. The generator model at the initial epoch didn’t perform well, but gradually picked up and improved over epochs. From Figs. 7–9, it is evident that the performance of the SRGAN algorithm has eventually improved based on visual qualitative aspects. The final best model also showed enhanced quantitative results (SSIM, PSRN, MAE, RMSE, Precision, and Recall). For comparative analysis, the standard image interpolation techniques of different variants were taken. The trained SRGAN had shown enhanced performance, both quantitatively and qualitatively. The SRGAN algorithm however poses an extra computation burden but provides a promising result in the task of super-resolution of thermal gas images.
The stacked convolutional autoencoder algorithm was trained on the grayscale images to generate colorized thermal gas images. The SCAE algorithm was trained for 60 epochs with appropriate callbacks to log the best model. The quantitative evaluation of the trained SCAE was performed using different loss metrics, used to evaluate regression algorithms. In one view, the autoencoder is also performing a prediction task, and the best metric is to evaluate the difference between the actual and predicted image at the pixel level. Hence the regression-based loss metrics would be appropriate for the quantitative evaluation of the SCAE algorithm. The loss values for both the training and validation sets were less, indicating better performance of colorization by the autoencoder. Also, there was no overfitting or underfitting issue, as indicated by the values of the metrics in both the training and testing sets and also on the training plots in Fig. 10. Also, the trained SCAE algorithm was randomly tested on images of different classes and distributions, as displayed in Fig. 11, indicating good performance based on qualitative aspects.
The multimodal convolutional neural network was used to identify the type of gas based on the thermal gas image and sensor measurements from the electronic nose. The early and late fusion strategies were employed to fuse the features from both modalities. The late fusion strategy produced almost 2% improvement in all the evaluation metrics, in comparison to the early fusion strategy. The late fusion has more layers when compared to early fusion, hence providing the reason for the improved performance, as indicated by the higher values of the metrics. Also, the number of false positives and false negatives in late fusion is lesser than that of early fusion, which is very important, considering crucial industrial applications.
However, the proposed work has some limitations. One major limitation of the proposed work is the computational complexity introduced by the SRGAN model. Training the generator and discriminator for multiple iterations resulted in the computational burden on the processing systems. Also, deployment of the large SRGAN model, in combination with the autoencoder model, can cause latency issues in real-time predictions. Another issue is the fluctuations observed in the training of the multimodal neural network, especially in the validation set as mentioned in Fig. 5. Finally, the proposed work is limited to only two different types of gas, perfume, and smoke, respectively. Hence the models might not be able to capture and process the distributions formed by other types of gases.
The proposed method has considered two types of gases, namely, smoke and perfume. However, this technique can be extended to several other types of gases, including poisonous toxic gases in industries. One promising extension of the proposed work can be in the process of automated landmine detection. Landmines release certain chemicals, which can be detected through the electronic nose and thermal images. Hence applying the proposed work to such situations can aid in automated detection, reducing human intervention.
In this paper, a framework for multimodal classification, image resolution enhancement, and image colorization has been successfully developed. The developed multimodal classification algorithm was successful in identifying the different classes of gas with high accuracy. The multimodal feature fusion is of great application because even if one modality fails, the other modality backs up, resulting in enhanced classification accuracy. Out of the three methods, late fusion has produced the highest classification accuracy of 98.55%. Regarding the image colorization, the stacked convolutional autoencoder algorithm performed well, with high efficiency and low reconstruction error as indicated by loss values of 0.035 MAE and 0.006 MSE scores, respectively. Regarding image resolution enhancement, the SRGAN algorithm trained from scratch was able to successfully improvise the resolution of thermal images from 64 * 64 to 256 * 256 with the least error of 0.066 MAE, PSNR of 68.74, and high SSIM of 90.28, respectively.
On the whole, the proposed system can be useful for working with low-cost hardware, which generally generates low-resolution images in grayscale format. These algorithms can be useful for converting the images to the best form, without the need for high-cost hardware. The future direction of the proposed work can be the integration of the developed algorithms into a hardware system for real-time deployment and usage. A Raspberry Pi-based hardware system can be developed that stores the trained model of the SRGAN, the autoencoder, and the multimodal CNN. The electronic nose and low-cost thermal camera can be connected to the Raspberry Pi mini-computer. If the thermal image has a lower resolution, the resolution can be improvised using the trained SRGAN algorithm, and if the input thermal image is in grayscale, then the image can be colorized using the trained autoencoder algorithm. Once the quality of the image is improvised, the corresponding gas can be identified using the multimodal CNN algorithm. This work can also be extended to other gases, especially toxic gases in industrial environments, where the leak of such gases can be detrimental.
Acknowledgement: Not applicable.
Funding Statement: This research was funded by the Centre for Advanced Modelling and Geospatial Information Systems (CAMGIS), Faculty of Engineering and IT, University of Technology Sydney. Moreover, supported by the Researchers Supporting Project, King Saud University, Riyadh, Saudi Arabia, under Project RSP2025 R14.
Author Contributions: The authors confirm contribution to the paper as follows: study conception and design: Pratik Jadhav, Vuppala Adithya Sairam, Niranjan Bhojane, Abhyuday Singh; analysis and interpretation of results: Pratik Jadhav, Vuppala Adithya Sairam, Shilpa Gite, Biswajeet Pradhan, Mrinal Bachute; draft manuscript preparation: Abdullah Alamri, Biswajeet Pradhan, Pratik Jadhav, Vuppala Adithya Sairam. All authors reviewed the results and approved the final version of the manuscript.
Availability of Data and Materials: The dataset used for the research work is publicly available at https://data.mendeley.com/datasets/zkwgkjkjn9/2 (accessed on 2 January 2024).
Ethics Approval: Not applicable.
Conflicts of Interest: The authors declare no conflicts of interest to report regarding the present study.
References
1. Cen K, Yao T, Wang Q, Xiong S. A risk-based methodology for the optimal placement of hazardous gas detectors. Chin J Chem Eng. 2018;26(5):1078–86. doi:10.1016/j.cjche.2017.10.031. [Google Scholar] [CrossRef]
2. Murvay PS, Silea I. A survey on gas leak detection and localization techniques. J Loss Prev Process Ind. 2012;25(6):966–73. doi:10.1016/j.jlp.2012.05.010. [Google Scholar] [CrossRef]
3. Fonollosa J, Solórzano A, Marco S. Chemical sensor systems and associated algorithms for fire detection: a review. Sensors. 2018;18(2):553. doi:10.3390/s18020553. [Google Scholar] [PubMed] [CrossRef]
4. Hussain H, Kim J, Yi S. Characteristics and temperature compensation of non-dispersive infrared (NDIR) alcohol gas sensors according to incident light intensity. Sensors. 2018;18(9):2911. doi:10.3390/s18092911. [Google Scholar] [PubMed] [CrossRef]
5. Saxena P, Shukla P. A review on recent developments and advances in environmental gas sensors to monitor toxic gas pollutants. Environ Prog Sustain Energy. 2023;42(5):e14126. doi:10.1002/ep.14126. [Google Scholar] [CrossRef]
6. Monroy JG, González-Jiménez J, Blanco JL. Overcoming the slow recovery of MOX gas sensors through a system modeling approach. Sensors. 2012;12(10):13664–80. doi:10.3390/s121013664. [Google Scholar] [PubMed] [CrossRef]
7. Fan H, Schaffernicht E, Lilienthal AJ. Ensemble learning-based approach for gas detection using an electronic nose in robotic applications. Front Chem. 2022;10:863838. doi:10.3389/fchem.2022.863838. [Google Scholar] [PubMed] [CrossRef]
8. Hayasaka T, Lin A, Copa VC, Lopez LPJr, Loberternos RA, Ballesteros LIM, et al. An electronic nose using a single graphene FET and machine learning for water, methanol, and ethanol. Microsyst Nanoeng. 2020;6(1):50. doi:10.1038/s41378-020-0161-3. [Google Scholar] [PubMed] [CrossRef]
9. Katkoori AK, Raju B, Seelam K, Dudi BP. Automatic door unlocking system using facemask detection and thermal screening. In: International Conference on Artificial Intelligence of Things; 2023 Mar 30–31; Chandigarh, India. p. 48–59. [Google Scholar]
10. Yang J, Wang W, Lin G, Li Q, Sun Y, Sun Y. Infrared thermal imaging-based crack detection using deep learning. IEEE Access. 2019;7:182060–77. doi:10.1109/ACCESS.2019.2958264. [Google Scholar] [CrossRef]
11. Avila LF. Leak detection with thermal imaging. United States Patent US 6,866,089. 2005 Mar 15. [Google Scholar]
12. Jadin MS, Ghazali KH. Gas leakage detection using thermal imaging technique. In: Proceedings of the 2014 UKSim-AMSS 16th International Conference on Computer Modelling and Simulation; 2014 Mar 26–28; Cambridge, UK. p. 302–6. doi:10.1109/UKSim.2014.95. [Google Scholar] [CrossRef]
13. Zhang H, Hu Y, Yan M. Thermal image super-resolution based on lightweight dynamic attention network for infrared sensors. Sensors. 2023;23(21):8717. doi:10.3390/s23218717. [Google Scholar] [PubMed] [CrossRef]
14. Rivadeneira RE, Suárez PL, Sappa AD, Vintimilla BX. Thermal image superresolution through deep convolutional neural network. In: Image Analysis and Recognition: 16th International Conference, ICIAR 2019; 2019 Aug 27–29. Waterloo, ON, Canada. p. 417–26. [Google Scholar]
15. Vollmer M. Infrared thermal imaging. In: Computer vision: a reference guide. Berlin/Heidelberg, Germany: Springer; 2021. p. 666–70. [Google Scholar]
16. Luo Y, Ye W, Zhao X, Pan X, Cao Y. Classification of data from electronic nose using gradient tree boosting algorithm. Sensors. 2017;17(10):2376. doi:10.3390/s17102376. [Google Scholar] [PubMed] [CrossRef]
17. Khalaf W, Pace C, Gaudioso M. Gas detection via machine learning. Int J Comput Electr Autom Control Inf Eng. 2008;2:61–5. [Google Scholar]
18. Faleh R, Kachouri A. A hybrid deep convolutional neural network-based electronic nose for pollution detection purposes. Chemom Intell Lab Syst. 2023;237(1):104825. doi:10.1016/j.chemolab.2023.104825. [Google Scholar] [CrossRef]
19. Khalaf WMH. Electronic nose system for safety monitoring at refineries. J Eng Sustain Dev. 2012;16:220–8. [Google Scholar]
20. Peng P, Zhao X, Pan X, Ye W. Gas classification using deep convolutional neural networks. Sensors. 2018;18(1):157. doi:10.3390/s18010157. [Google Scholar] [PubMed] [CrossRef]
21. Mao G, Zhang Y, Xu Y, Li X, Xu M, Zhang Y, et al. An electronic nose for harmful gas early detection based on a hybrid deep learning method H-CRNN. Microchem J. 2023;195(1):109464. doi:10.1016/j.microc.2023.109464. [Google Scholar] [CrossRef]
22. Bin J, Rahman CA, Rogers S, Liu Z. Tensor-based approach for liquefied natural gas leakage detection from surveillance thermal cameras: a feasibility study in rural areas. IEEE Trans Ind Inform. 2021;17(12):8122–30. doi:10.1109/TII.2021.3064845. [Google Scholar] [CrossRef]
23. Rahate A, Mandaokar S, Chandel P, Walambe R, Ramanna S, Kotecha K. Employing multimodal co-learning to evaluate the robustness of sensor fusion for Industry 5.0 tasks. Soft Comput. 2023;27(7):4139–55. doi:10.1007/s00500-022-06802-9. [Google Scholar] [CrossRef]
24. Narkhede P, Walambe R, Chandel P, Mandaokar S, Kotecha K. MultimodalGasData: multimodal dataset for gas detection and classification. Data. 2022;7(8):112. doi:10.3390/data7080112. [Google Scholar] [CrossRef]
25. Attallah O. Multitask deep learning-based pipeline for gas leakage detection via E-nose and thermal imaging multimodal fusion. Chemosensors. 2023;11(7):364. doi:10.3390/chemosensors11070364. [Google Scholar] [CrossRef]
26. Cheng X, Cheng S. Thermal image generation for blast furnace chute based on generative adversarial network. Signal Image Video Process. 2023;17(5):2595–606. doi:10.1007/s11760-022-02476-w. [Google Scholar] [CrossRef]
27. Deepak S, Sahoo S, Patra D. Super-resolution of thermal images using GAN network. In: 2021 Advanced Communication Technologies and Signal Processing (ACTS); 2021 Dec 15–17; Rourkela, India. p. 1–5. doi:10.1109/ACTS53447.2021.9708340. [Google Scholar] [CrossRef]
28. Zhu L, Wu R, Lee BG, Nkenyereye L, Chung WY, Xu G. FEGAN: a feature-oriented enhanced GAN for enhancing thermal image super-resolution. IEEE Signal Process Lett. 2024;31:541–5. doi:10.1109/LSP.2024.3356751. [Google Scholar] [CrossRef]
29. Dangle A, Mundada R, Gore S, Shrungare J, Dalal H. Enhanced colorization of thermal images for pedestrian detection using deep convolutional neural networks. Procedia Comput Sci. 2023;218(4):2091–101. doi:10.1016/j.procs.2023.01.185. [Google Scholar] [CrossRef]
30. Çiftçi O, Akcayol MA. Thermal infrared colorization using deep learning. In: 2021 8th International Conference on Electrical and Electronics Engineering (ICEEE); 2021 Apr 9–11; Antalya, Turkey. p. 323–6. [Google Scholar]
31. Kuang X, Zhu J, Sui X, Liu Y, Liu C, Chen Q, et al. Thermal infrared colorization via conditional generative adversarial network. Infrared Phys Technol. 2020;107(1):103338. doi:10.1016/j.infrared.2020.103338. [Google Scholar] [CrossRef]
32. Bayoudh K, Knani R, Hamdaoui F, Mtibaa A. A survey on deep multimodal learning for computer vision: advances, trends, applications, and datasets. Vis Comput. 2022;38(8):2939–70. doi:10.1007/s00371-021-02166-7. [Google Scholar] [PubMed] [CrossRef]
33. Boulahia SY, Amamra A, Madi MR, Daikh S. Early, intermediate and late fusion strategies for robust deep learning-based multimodal action recognition. Mach Vis Appl. 2021;32(6):121. doi:10.1007/s00138-021-01249-8. [Google Scholar] [CrossRef]
34. Ledig C, Theis L, Huszár F, Caballero J, Cunningham A, Acosta A, et al. Photo-realistic single image super-resolution using a generative adversarial network. In: Proceedings of the 2017 IEEE Conference on Computer Vision and Pattern Recognition (CVPR); 2017 Jul 21–26; Honolulu, HI, USA. p. 105–14. doi:10.1109/CVPR.2017.19. [Google Scholar] [CrossRef]
35. Willmott CJ, Matsuura K. Advantages of the mean absolute error (MAE) over the root mean square error (RMSE) in assessing average model performance. Clim Res. 2005;30:79–82. doi:10.3354/cr030079. [Google Scholar] [CrossRef]
36. Korhonen J, You J. Peak signal-to-noise ratio revisited: is simple beautiful? In: 2012 Fourth International Workshop on Quality of Multimedia Experience; 2012 Jul 5–7; Melbourne, VIC, Australia. p. 37–8. doi:10.1109/QoMEX.2012.6263880. [Google Scholar] [CrossRef]
37. Brunet D, Vrscay ER, Wang Z. On the mathematical properties of the structural similarity index. IEEE Trans Image Process. 2011;21(4):1488–99. doi:10.1109/TIP.2011.2173206. [Google Scholar] [PubMed] [CrossRef]
Cite This Article
 Copyright © 2025 The Author(s). Published by Tech Science Press.
This work is licensed under a Creative Commons Attribution 4.0 International License , which permits unrestricted use, distribution, and reproduction in any medium, provided the original work is properly cited.
 Downloads
 Citation Tools