
 Submit a Paper
 Propose a Special lssue
 Open Access
ARTICLE
An Attention-Based CNN Framework for Alzheimer’s Disease Staging with Multi-Technique XAI Visualization
1 Department of Computer Engineering, Karabuk University, Karabük, 78050, Türkiye
2 Department of Computer Science, College of Computer Science and Mathematics, Tikrit University, Tikrit, 34001, Iraq
* Corresponding Author: Emrullah Sonuç. Email:
(This article belongs to the Special Issue: Medical Imaging Based Disease Diagnosis Using AI)
Computers, Materials & Continua 2025, 83(2), 2947-2969. https://doi.org/10.32604/cmc.2025.062719
Received 25 December 2024; Accepted 05 March 2025; Issue published 16 April 2025
 View Full Text
 Download PDF
Abstract
Alzheimer’s disease (AD) is a significant challenge in modern healthcare, with early detection and accurate staging remaining critical priorities for effective intervention. While Deep Learning (DL) approaches have shown promise in AD diagnosis, existing methods often struggle with the issues of precision, interpretability, and class imbalance. This study presents a novel framework that integrates DL with several eXplainable Artificial Intelligence (XAI) techniques, in particular attention mechanisms, Gradient-Weighted Class Activation Mapping (Grad-CAM), and Local Interpretable Model-Agnostic Explanations (LIME), to improve both model interpretability and feature selection. The study evaluates four different DL architectures (ResMLP, VGG16, Xception, and Convolutional Neural Network (CNN) with attention mechanism) on a balanced dataset of 3714 MRI brain scans from patients aged 70 and older. The proposed CNN with attention model achieved superior performance, demonstrating 99.18% accuracy on the primary dataset and 96.64% accuracy on the ADNI dataset, significantly advancing the state-of-the-art in AD classification. The ability of the framework to provide comprehensive, interpretable results through multiple visualization techniques while maintaining high classification accuracy represents a significant advancement in the computational diagnosis of AD, potentially enabling more accurate and earlier intervention in clinical settings.Keywords
Mild Cognitive Impairment (MCI) represents a critical intermediate stage between normal cognitive aging and dementia, characterized by cognitive decline that exceeds age-appropriate norms while preserving functional independence. This condition manifests across multiple cognitive domains, including memory, general cognitive ability, and executive function [1]. The significance of MCI lies in its potential role as a precursor to Alzheimer’s Disease (AD), with annual conversion rates ranging from 10% to 15% [2]. The scale of this public health challenge is critical, as evidenced by the Alzheimer’s Association estimate that approximately 5.7 million Americans 65 years and older lived with Alzheimer’s dementia in 2018, projections indicating that this number could more than double by the mid-century without therapeutic advances [3].
The lack of a definitive cure for AD underscores the critical importance of early detection and intervention in MCI to optimize patient outcomes [4]. A primary challenge is to differentiate between patients with MCI who will progress to AD and those who will remain stable. Although various biomarkers and testing approaches have been proposed [5], their longitudinal predictive capacity remains controversial. The development of reliable prognostic tools could significantly improve clinical decision making for high-risk MCI patients [6,7]. While traditional clinical evaluation has been the standard for differentiating between converting (MCIc) and non-converting (MCInc) MCI patients, machine learning approaches now offer enhanced diagnostic capabilities [8], leveraging comprehensive non-invasive data and facilitating the identification of novel biomarkers such as NFL, BACE1, and neurogranin [9,10]. Recent developments in Deep Learning (DL) have yielded significant improvements in AD diagnosis, progressing from 66% accuracy using T1-weighted MRI scans [11] to 98.5% accuracy using CNN-LSTM algorithms for early MCI detection [12]. Model interpretability remains critical, with eXplainable Artificial Intelligence (XAI) methods such as Shapley scores and XGBoost providing insights into predictive mechanisms and critical AD biomarkers [13].
This study proposes a framework integrates DL and XAI, offering both predictive accuracy and interpretability for clinical application. We evaluate four DL models using standard performance metrics to determine optimal task performance. The contributions of our study are summarized as follows. First, this study introduces a CNN model enhanced with an attention mechanism, which significantly improves the classification accuracy of AD stages. This model achieved an accuracy and F1-score of 99.18%, outperforming other state-of-the-art models for early stage AD classification. Second, our study incorporates XAI methods that use Gradient-weighted Class Activation Mapping (Grad-CAM), Local Interpretable Model-Agnostic Explanations (LIME) and attention mechanisms to provide visual interpretations of the model’s predictions. This enhances the reliability and clinical applicability of the model by elucidating the important areas of the brain that contribute to the classification decisions. Third, we evaluate four different architectures, including ResMLP, VGG16, Xception, and the proposed CNN with attention mechanism. The CNN with attention mechanism demonstrated superior performance compared to the other models, highlighting its effectiveness in AD stage classification. Fourth, the study addresses common challenges in AD diagnosis, such as class imbalance and computational requirements, by proposing a model that is both accurate and efficient, making it suitable for clinical settings. This novel approach advances both the detection of AD through MRI analysis and the broader field of medical diagnostics by combining robust AI with interpretable decision frameworks.
The rest of this paper is organized as follows: Section 2 presents related work in AD classification using DL approaches. Section 3 describes our proposed framework, including data preparation, model architectures, and explainability techniques. Section 4 presents our experimental results and provides detailed performance comparisons across different models. Section 5 concludes the study with a summary of our findings and suggestions for future work.
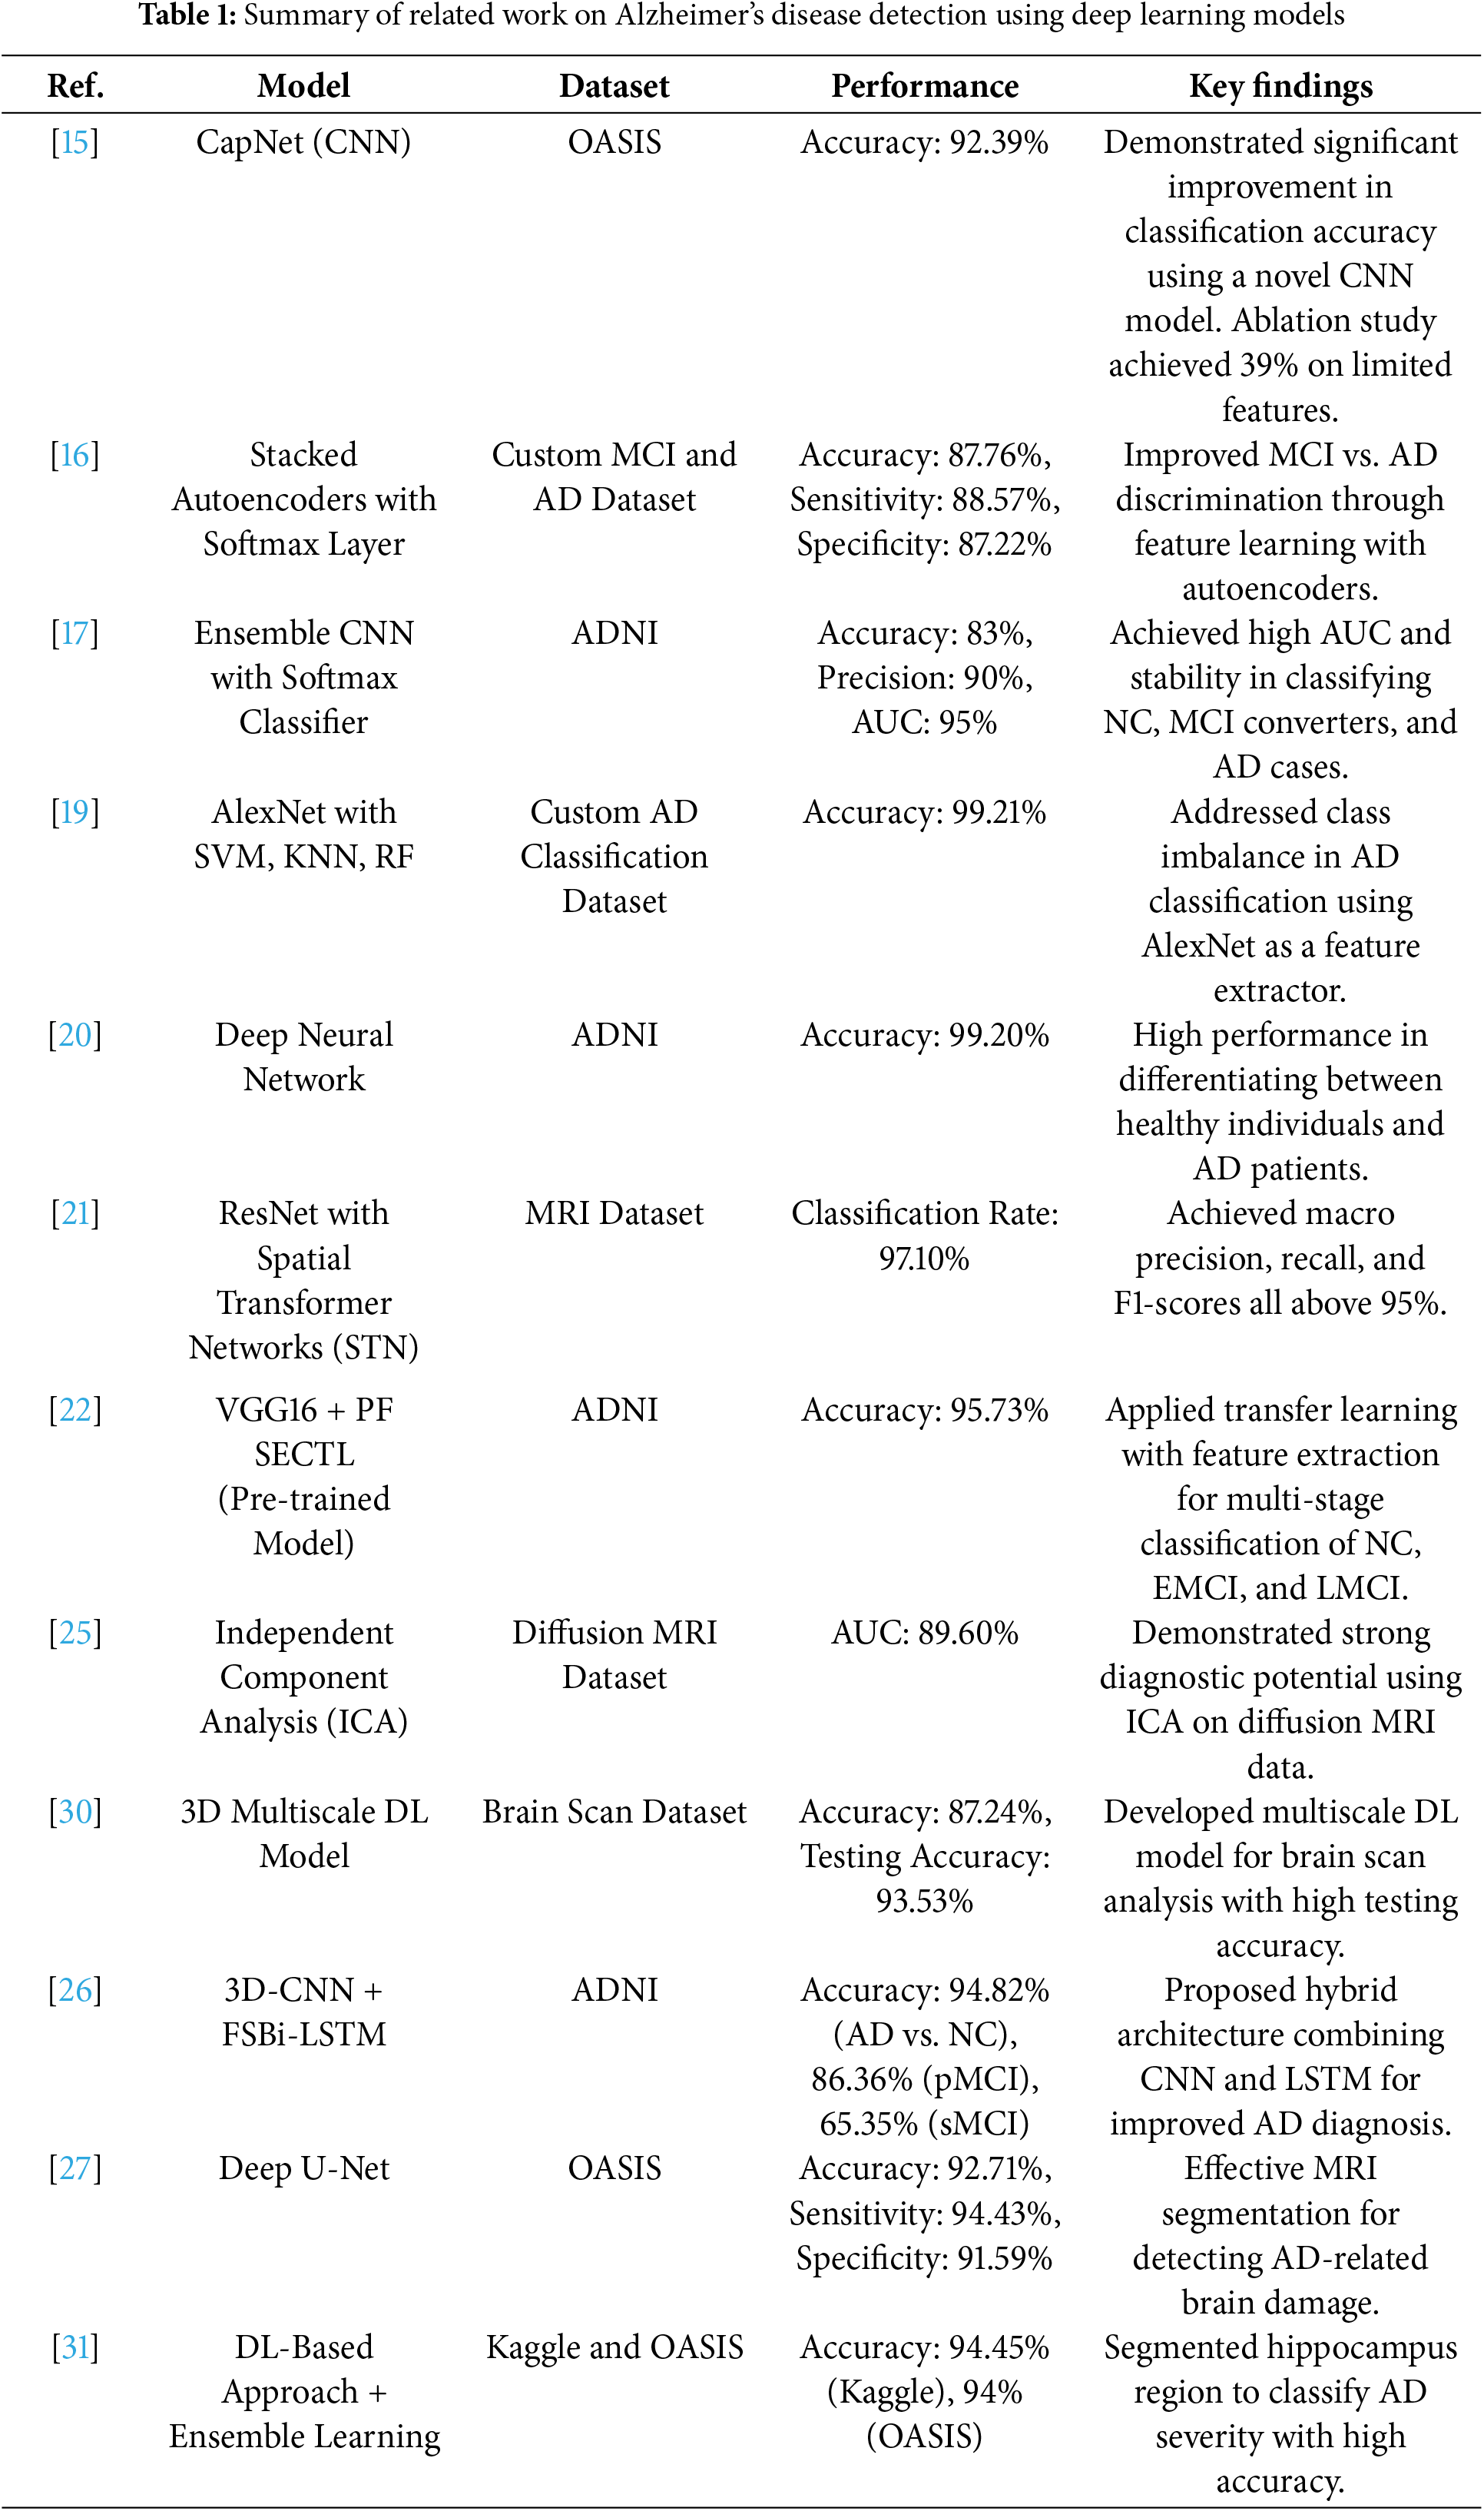
Early detection of AD is critical for patient care and disease management. DL has demonstrated superior performance over traditional methods in AD diagnosis, attracting significant attention from medical professionals [14]. Recent research has led to significant advances in DL-based AD diagnosis. Basheer et al.’s [15] CNN model, CapNet, achieved 92.39% accuracy on the OASIS dataset. Liu et al. [16] combined feature learning with stacked autoencoders and achieved 87.6% sensitivity and 76.5% accuracy in MCI-AD discrimination. Ortiz et al. [17] developed an ensemble CNN model that achieved over 90% accuracy and 95% AUC in discriminating between normal controls (NC) and AD cases, with strong performance in MCI cases [18]. Nawaz et al. [19] addressed class imbalance using AlexNet for feature extraction and achieved 99.21% accuracy with different classifiers. Basaia et al. [20] demonstrated DL’s ability to handle large datasets, achieving 99.20% accuracy in AD classification using the ADNI dataset. Sun et al. [21] integrated spatial transformation networks with non-local attention mechanisms and achieved 97.10% classification accuracy. Jain et al. [22] combined VGG16 with FreeSurfer preprocessing and achieved 95.73% accuracy using the PF SECTL model.
Recent DL innovations in AD diagnosis show significant progress [23–25], with Feng et al.’s [26] 3D-CNN with FSBi-LSTM achieving 94.82% accuracy for AD vs. NC classification, and Allioui et al.’s [27] deep U-net approach achieving 92.71% accuracy. State-of-the-art models show varying levels of performance (83%–99.21% accuracy), including CapNet (92.39%), stacked autoencoders (87.76%), and AlexNet with Support Vector Machine (SVM), K-Nearest Neighbors (KNN) and Random Forest (RF) classifiers (99.21%) [15,16,19]. While these advances are promising, challenges remain in accuracy, class imbalance, computational efficiency, and interpretability. Table 1 summarizes state-of-the-art DL models in AD diagnosis. Recent surveys [28,29] provide extensive details on recent DL approaches in predicting AD.
The proposed framework aims to systematically evaluate the performance of various DL models on a balanced dataset for AD classification. The process includes several key phases:
• Dataset Preparation: This initial phase involves gathering and preprocessing the data to ensure appropriate input formats for the models. A crucial aspect of this step is to balance the dataset to mitigate class imbalances that could potentially bias the results.
• Model Implementation: Four different architectures are implemented: ResMLP, VGG16, Xception, and the proposed CNN with attention mechanisms. Each model is trained independently on the balanced dataset to allow a fair comparison of their performance.
• Explainability Integration: The method incorporates explainability techniques, namely Grad-CAM, LIME, and attention mechanisms, into the evaluation process. This allows for visual interpretations of the models’ decision-making processes, and provides insight into the regions of the brain scans that contribute most significantly to classification decisions.
The proposed methodology evaluates different DL models for AD classification, as shown in Fig. 1. The process begins with dataset preparation and preprocessing, followed by implementation of four different architectures: ResMLP, VGG16, Xception, and CNN with attention mechanisms. Each architecture is trained on the balanced dataset to ensure a fair performance comparison. The evaluation framework combines accuracy metrics and multi-class metrics, complemented by XAI visualizations that highlight brain regions that influence decisions, thereby improving diagnostic transparency. The following sections analyze the role of architectural components and evaluate both technical performance and clinical relevance in AD DL models.
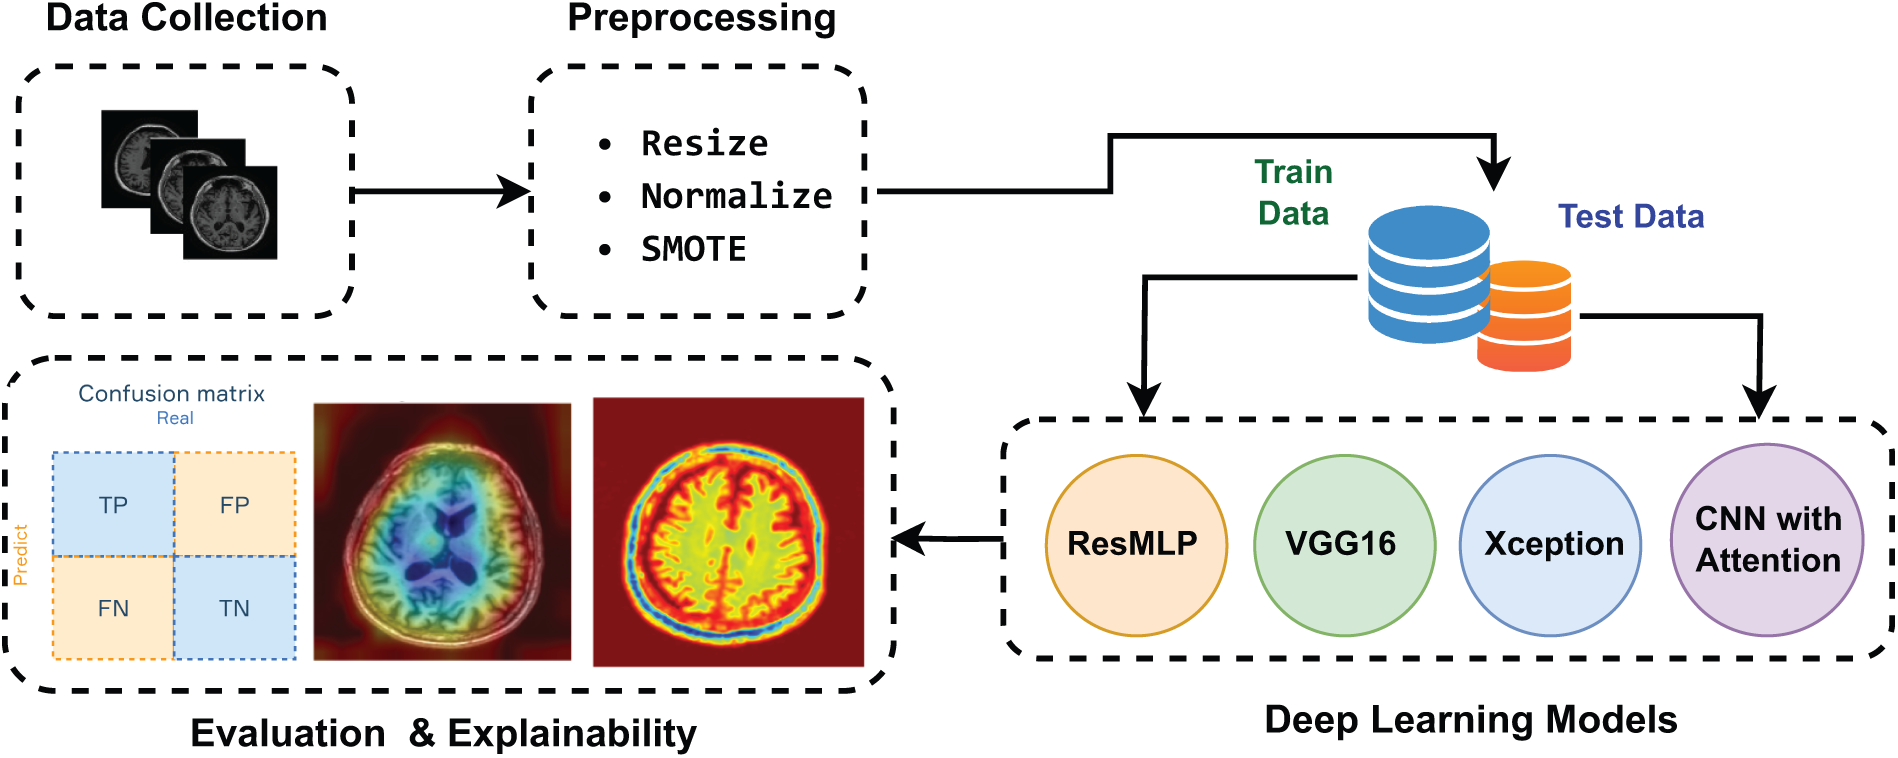
Figure 1: The scheme of the proposed framework
This study utilizes a dataset of 3714 MRI brain scans from the OMS Radiology Clinic1, categorized as NonDemented (834), MildDemented (1824), and VeryDemented (1056) cases. The dataset includes participants aged 70+ years and is optimized for the detection of Alzheimer’s-related brain degeneration. All scans were anonymized and normalized to preserve critical structures such as hippocampal atrophy and enlarged cerebrospinal fluid spaces, ensuring optimal preprocessing for DL model training and evaluation in dementia stage classification.
To address the class imbalance in our three-class dataset (NonDemented, MildDemented, and VeryDemented), we implemented the Synthetic Minority Oversampling Technique (SMOTE). SMOTE generates synthetic samples for minority classes by interpolation between existing samples, preserving the inherent structure of the data while balancing class distributions. The preprocessing pipeline included resizing MRI images to 224
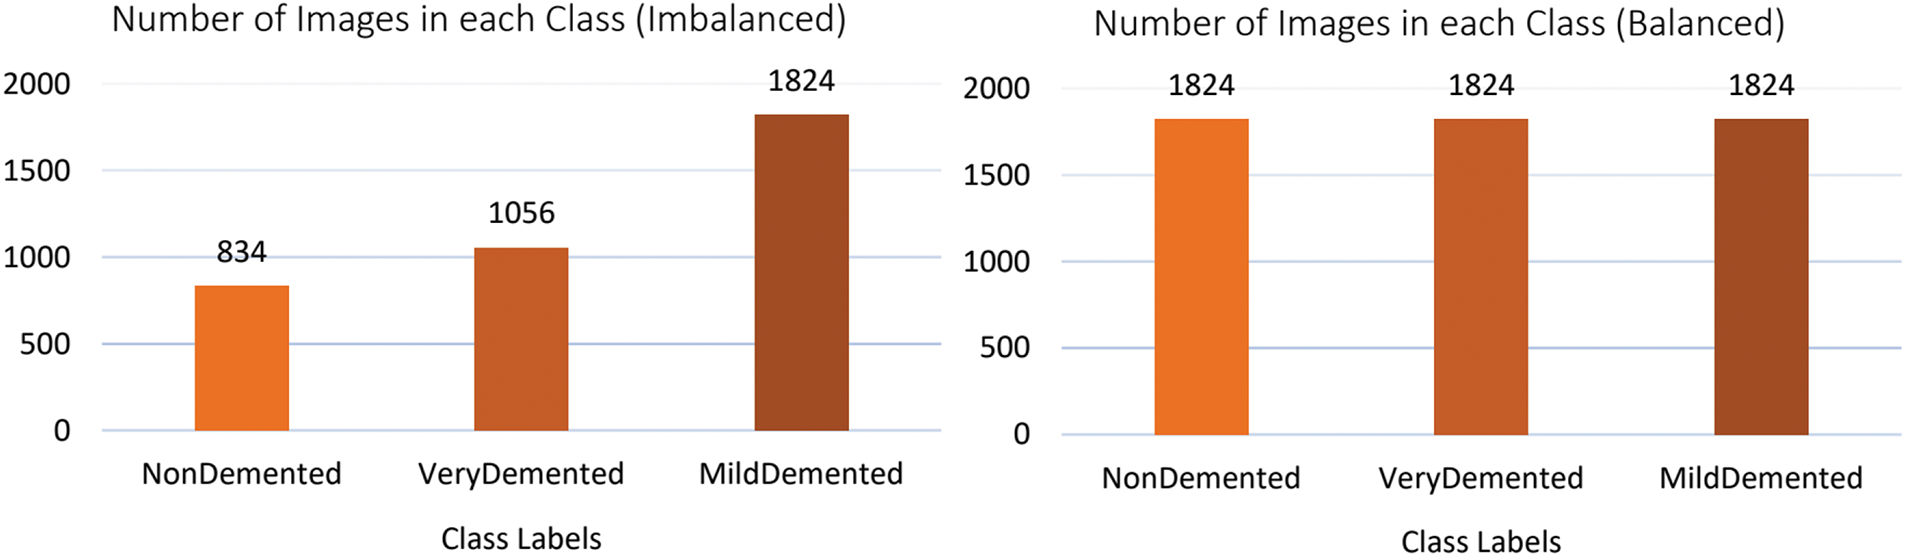
Figure 2: Class distribution of the original (imbalanced) and balanced dataset after applying SMOTE
3.3 The Proposed CNN with Attention Model
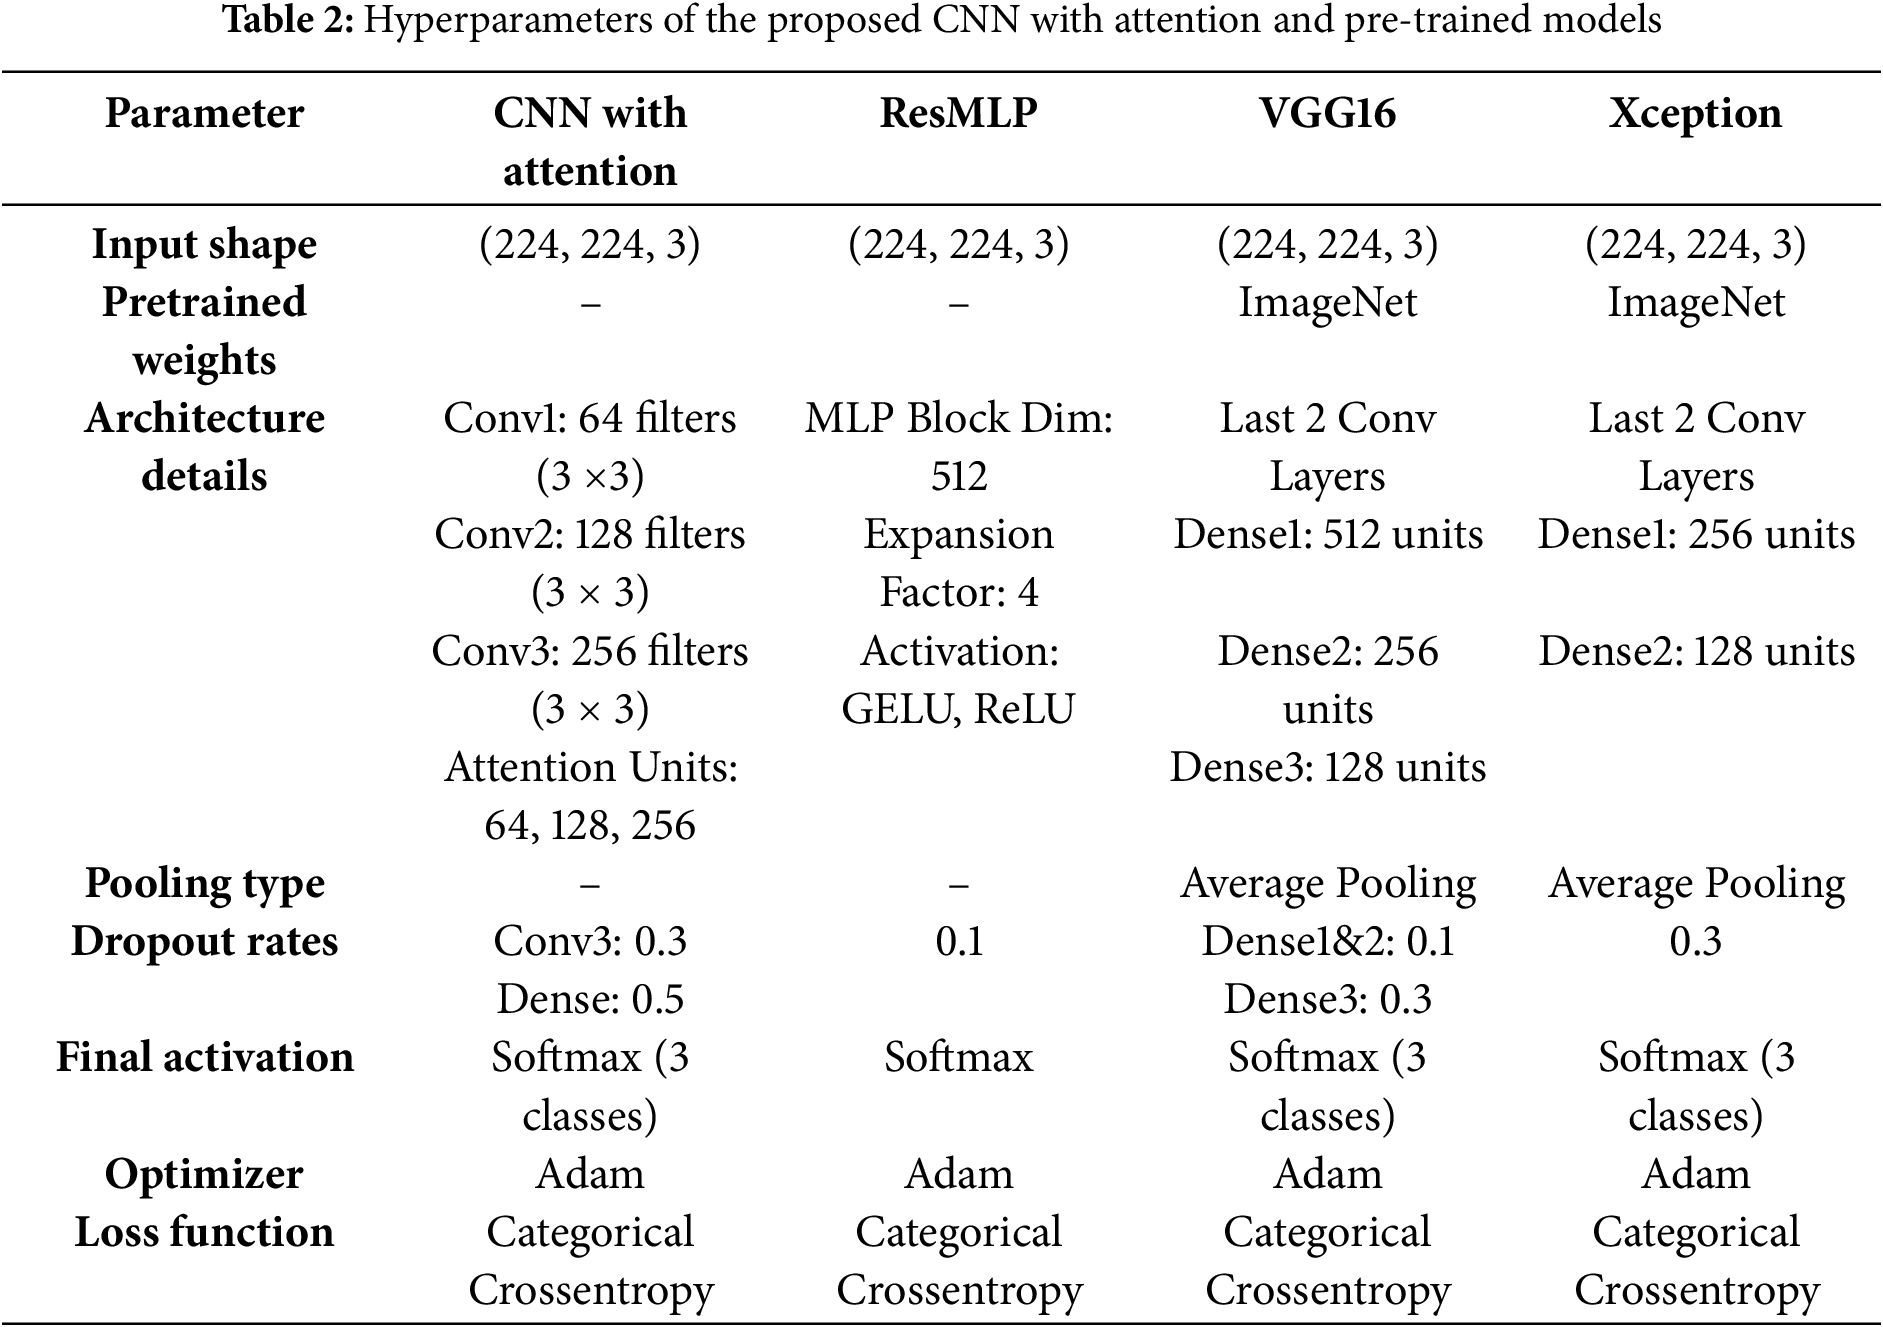
The proposed model integrates a CNN architecture with an attention mechanism. It accepts 224 × 224 RGB images as input, as shown in Table 2. The model integrates three convolutional blocks with attention mechanisms to optimize feature extraction for AD staging. Each design choice is justified as follows:
• Convolutional blocks with increasing filter sizes (64, 128, 256): The three-level hierarchical structure progressively increases filter sizes (64
• Attention Mechanism: Each convolutional block is augmented with an attention module to prioritize diagnostically critical regions (e.g., hippocampus, entorhinal cortex). Global average pooling compresses spatial features into channel-wise descriptors, followed by dimensionality reduction (to 8/16/32 units) and restoration.
• Dropout Layers (0.3 and 0.5): Dropout is applied after the third block (rate = 0.3) and before the softmax layer (rate = 0.5) to mitigate overfitting. Higher dropout in deeper layers counteracts noise in high-dimensional feature maps, while the final dropout regularizes the dense layer. This strategy balances generalization and specificity, which is critical for medical imaging with limited data.
• Dense Layer (256 units): The 256-unit dense layer after flattening serves as a nonlinear combiner of high-level features. This dimensionality balances computational efficiency and discriminative power, avoiding underfitting (too few units) or overparameterization (too many units).
• Softmax Output: A three-unit softmax layer corresponds to the three AD stages (NonDemented, MildDemented, VeryDemented), providing probabilistic class assignments suitable for clinical staging.
3.4 Other Pre-Trained Transfer Learning Models
3.4.1 ResMLP (Residual Multi-Layer Perceptrons)
The ResMLP model processes 224
• Two dense layers: the first expands the dimensionality 4x with GELU activation, the second restores the original dimensions.
• Dropout layers and layer normalization for regularization.
• Residual connections to address vanishing gradients.
The architecture concludes with a 128-unit dense layer (ReLU activation) and a three-neuron softmax layer for AD classification. The model uses 512-dimensional blocks and optimized dropout rates to balance accuracy and simplicity.
The model adapts the VGG16 architecture for AD classification, processing 224
• First dense layer: 512 units, ReLU activation, dropout (0.1).
• Second dense layer: 256 units, ReLU activation, dropout (0.1).
• Third dense layer: 128 units, dropout (0.3).
• Output layer: 3-unit softmax for AD classification.
The model implements Adam optimizer and categorical cross-entropy loss, and uses transfer learning to improve disease stage identification.
The adapted Xception architecture with depth-separable convolutions, which decomposes traditional operations into channel-wise filtering and 1
3.5 Explainable Artificial Intelligence (XAI)
XAI represents a critical advance in the development of transparent DL models for medical imaging, particularly in the context of neurodegenerative disease diagnosis [32]. While DL approaches have achieved satisfactory performance in medical image analysis, their inherent opacity poses significant challenges for clinical implementation. To address these limitations and provide comprehensive model interpretability, we employ multiple XAI methods. Our framework integrates Grad-CAM for continuous gradient-based visualization and LIME for complementary region-based explanations, along with attention mechanisms. This approach to explainability allows for both global and local interpretations of the model’s decision process, facilitating more reliable clinical validation.
3.5.1 Gradient-Weighted Class Activation Mapping (Grad-CAM)
XAI provide the reasoning behind the model’s diagnostic decisions. We use Grad-CAM technique that serves as a pivotal component of our XAI framework, enhancing the interpretability of the ViT-GRU model in diagnosing AD. Grad-CAM utilizes the gradients of the target class, flowing into the final convolutional layer of the model, to produce a localization map that highlights important regions in the input images, thus offering insights into the model’s decision-making process [33]. The Grad-CAM score for a given class
In this equation,
where Z is the number of pixels in the feature map
3.5.2 Local Interpretable Model-Agnostic Explanations (LIME)
To complement the Grad-CAM visualization and address its limitations in explaining complex MRI features, we incorporate LIME as an additional interpretability technique. LIME creates interpretable representations by approximating the model’s behavior locally around each prediction. For MRI analysis, LIME segments the image into superpixels and learns a locally linear model that approximates how the CNN makes predictions in that specific region. Unlike Grad-CAM, which focuses on class-specific activation maps, LIME provides feature-level explanations by identifying which segments of the brain image most strongly influence the model’s decision. This approach is particularly valuable for analyzing complex MRI patterns, where Grad-CAM’s activation maps may not fully capture the nuanced structural changes associated with different stages of AD. LIME generates explanations by perturbing the input image and observing how the model’s predictions change, providing insight into which regions are most critical for classification decisions.
Attention mechanisms are fundamental components in DL architectures, enabling selective focus on important input features [34]. This cognitive-inspired approach improves model performance in domains ranging from computer vision to natural language processing by dynamically weighting input elements based on their relevance. While widely implemented in various fields, the application of attention mechanisms as an explanatory tool remains relatively unexplored in medical imaging, particularly in disease diagnosis [35]. In AD detection, transformer-based models employ attention mechanisms to analyze neuroimaging data through a query key value framework, where input segments are weighted according to their diagnostic significance. In this study, two types of attentional mechanisms were used: spatial attention for region-specific feature identification, and dense-layer attention for pixel-wise weight distribution visualization. This process facilitates the identification of critical biomarkers, such as hippocampal atrophy and cortical thinning, while providing interpretable insights for clinical decision making.
The study implemented mathematical models in Python 3.11 (Anaconda), using an 80-20 train-test split on 3714 samples. Images were standardized to 224
4.2 Evaluation Metrics for AD Classification
The evaluation of DL models in AD classification employs multiple performance metrics, including accuracy, precision, recall, F1-score and ROC curves, each offering distinct insights into model performance [36].
4.3 The Proposed CNN with Attention Model Results and Evaluation
The CNN with Attention model demonstrated significant improvements in accuracy and effective loss reduction during training and evaluation, as shown in Fig. 3. Initially, the model had a training accuracy of 42.71% and a loss of 1.0702, with a validation accuracy of 63.34% and a loss of 0.8539, indicating initial learning but a need for better feature extraction. In the second epoch, the training accuracy improved to 66.86% and the validation accuracy to 83.54%, reflecting the influence of the attention mechanism in focusing on essential features. In the third epoch, training accuracy reached 84.14% and validation accuracy climbed to 93.52%, with reduced losses indicating improved error correction. In the fourth epoch, training accuracy is 91.21% and validation accuracy is 98.50%, with a significant decrease in validation loss, suggesting robust generalization. In the fifth epoch, training accuracy increased to 96.22% and validation accuracy to 98.75%. The final epoch yielded an impressive training accuracy of 98.17% and validation accuracy of 99.00%, demonstrating the model’s ability to extract informative features through its attention mechanism.

Figure 3: Training and validation performance curves for the CNN with attention model
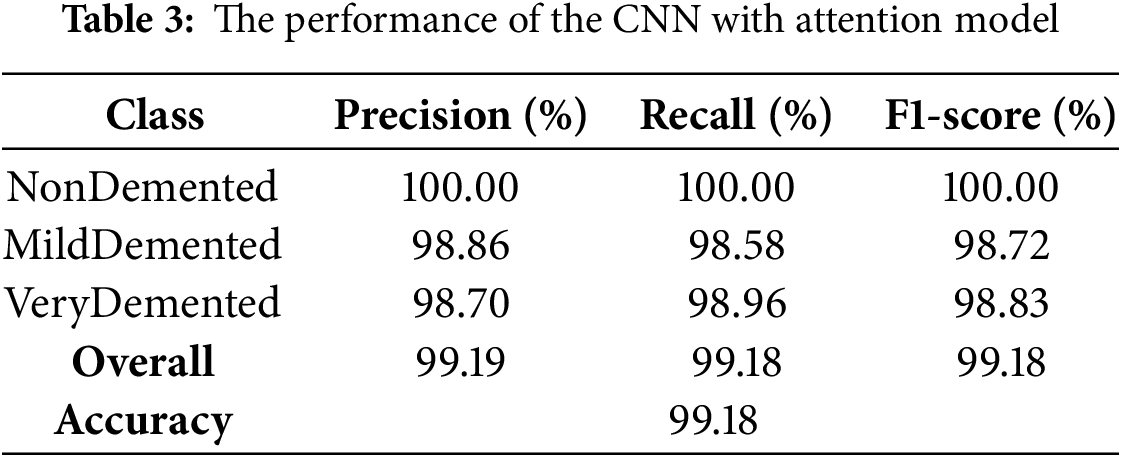
The CNN with Attention architecture demonstrated exceptional discriminative ability, achieving an overall accuracy 99.18%. The classification performance, as presented in Table 3. The model showed robust performance across the classes (VeryDemented and MildDemented), with precision, recall and F1-score metrics consistently above 98%. Specifically, the NonDemented class achieved perfect (100%) accuracy with precision, recall and F1-score metrics, validating the model’s effectiveness in classifying AD stage. These results indicate that the CNN with Attention model successfully distinguished between different dementia stages with high precision and recall, making it a reliable classifier for our dataset.
The ROC curves of the CNN with Attention model illustrated in Fig. 4. It performs well across all classes, with each class achieving an AUC of 0.99. These results indicate the model’s robust ability to distinguish between NonDemented, MildDemented, and VeryDemented stages of AD. The high AUC values reflect minimal false positives and false negatives, underscoring the effectiveness of the attention mechanism in improving feature extraction and classification accuracy. Overall, the model shows a strong ability to accurately identify cognitive states.
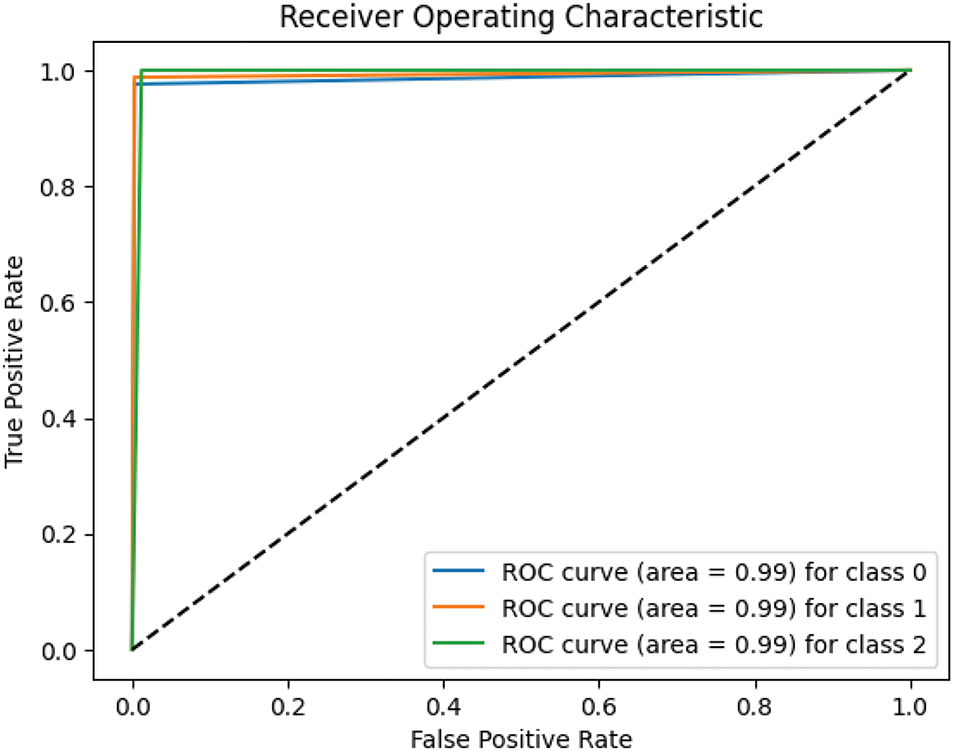
Figure 4: ROC curves of the CNN with attention model
4.4 ResMLP Model Results and Evaluation
The ResMLP model showed substantial convergence over eight epochs, as shown in Fig. 5, with training and validation accuracies improving from 38.02% and 50.37% to 95.79% and 96.01%, respectively. The validation loss decreased significantly from 1.0270 to 0.1262, demonstrating effective optimization and generalization without overfitting.

Figure 5: Training and validation performance curves for the ResMLP model
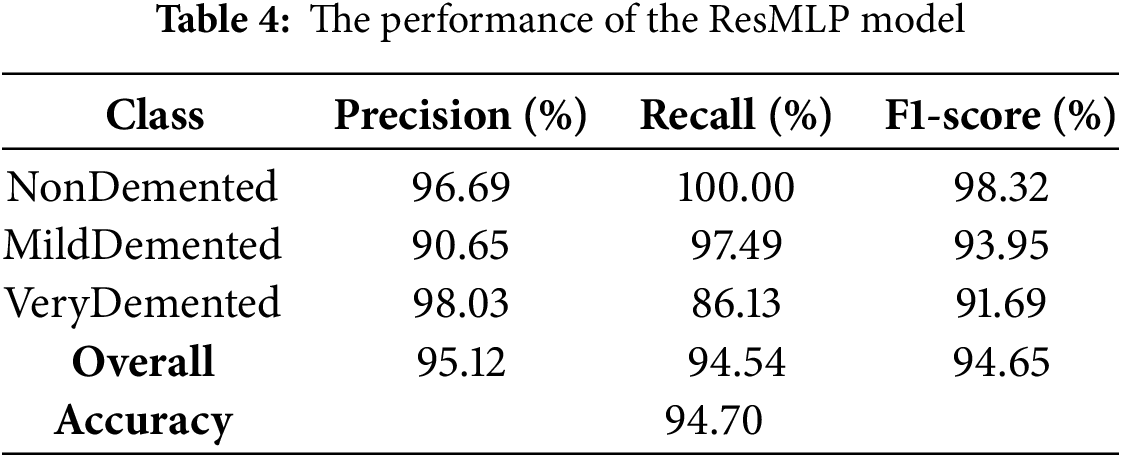
The model achieved an overall accuracy of 94.70%, with robust performance across all classes, as shown in Table 4. Class-specific metrics showed exceptional discrimination, particularly in the VeryDemented classification (precision: 98.03%), while the MildDemented and NonDemented classes showed strong recall rates of 97.49% and 100%, respectively. The model’s overall metrics (F1-score: 94.65%) and consistent convergence patterns (Fig. 5) confirm its effectiveness in AD stage classification.
The ResMLP model showed superior discriminative ability as evidenced by the ROC curves, as shown in Fig. 6, achieving AUC values greater than 0.99 in all classes (NonDemented: 0.9937, MildDemented: 0.9951, VeryDemented: 0.9977). The proximity of the curves to the ideal upper left corner validates the effectiveness of the model in classifying AD stage.

Figure 6: ROC curves of the ResMLP model
4.5 VGG16 Model Results and Evaluation
The VGG16 architecture showed consistent optimization over 15 epochs, as shown in Fig. 7, with training and validation accuracies improving significantly from initial values of 37.71% and 54.11% to final performances of 95.55% and 94.51%, respectively. The model showed a steady error reduction from an initial training loss of 2.2924, validating its effective convergence and generalization capabilities.

Figure 7: Training and validation performance curves for the VGG16 model
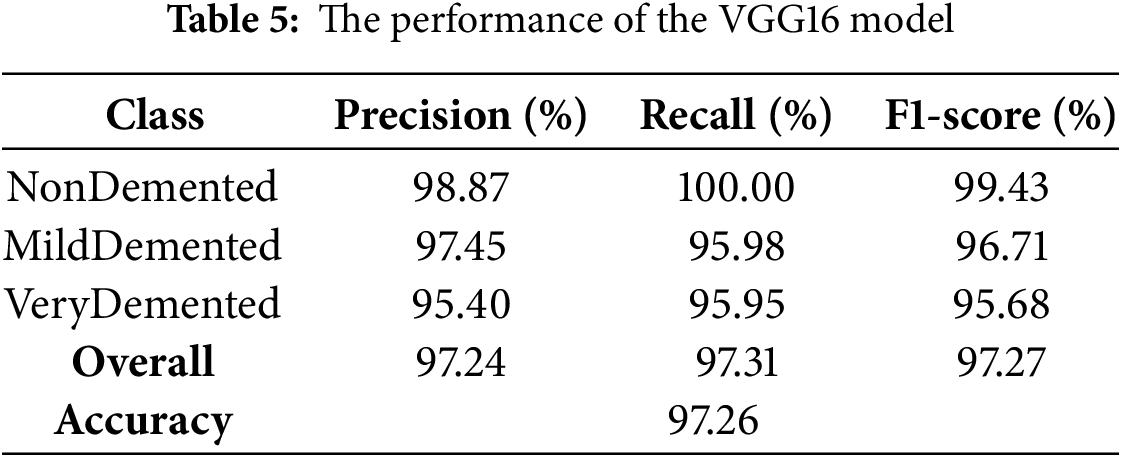
The VGG16 model demonstrated exceptional discriminative ability with an overall accuracy of 97.26% on the test set, as shown in Table 5. Class-specific metrics showed robust performance across all categories, with the NonDemented class achieving 98.87% precision, VeryDemented showing balanced metrics (96.95% for precision, recall, and F1-scores), and NonDemented showing strong recall (98.25%).
The VGG16 model demonstrated superior discriminative ability as evidenced by the ROC curves shown in Fig. 8, achieving excellent AUC values greater than 0.99 across all classes (NonDemented: 0.9978, MildDemented: 0.9986, VeryDemented: 0.9962), validating its effectiveness in AD stage classification.

Figure 8: ROC curves of the VGG16 model
4.6 Xception Model Results and Evaluation
The Xception architecture demonstrated consistent optimization over 10 epochs, as shown in Fig. 9, progressing from an initial training accuracy of 38.50% to final training and validation accuracies of 93.83% and 94.01%, respectively. The synchronized improvement between training and validation metrics confirms the model’s effective learning and generalization capabilities.

Figure 9: Training and validation performance curves for the Xception model
The Xception model demonstrated robust classification performance, achieving 91.87% accuracy on the test set (Table 6). Class-specific analysis showed high precision (


Figure 10: ROC curves of the Xception model
We conducted a comprehensive ablation study to evaluate the contribution of each key component in our proposed CNN with Attention framework. This analysis helps to understand the impact of different architectural choices and preprocessing steps on the performance of the model. Table 7 presents the results of removing different components from our framework, with the full model achieving 99.18% accuracy, 99.19% precision, 99.18% recall, and 99.19% F1-score.
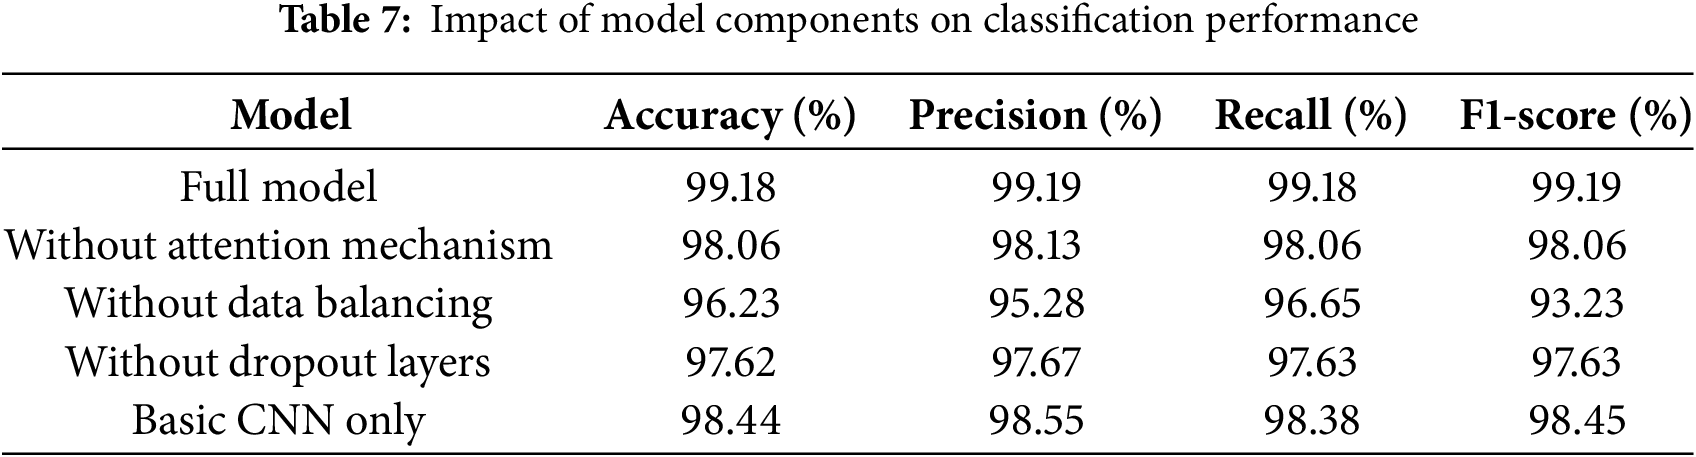
Removing the attention mechanism resulted in a modest decrease in performance (1.11% decrease in accuracy), with similar decreases in precision (98.13%) and recall (98.06%). Although the effect was less dramatic than originally hypothesized, it demonstrates that the attention mechanism contributes to the overall effectiveness of the model.
When SMOTE balancing was removed, accuracy decreased by 2.94% (to 96.23%), with similar decreases in precision and recall. This confirms that proper data balancing is critical for robust AD stage classification.
Removing dropout layers resulted in a 1.55% decrease in accuracy (to 97.62%), with corresponding decreases in precision (97.67%) and recall (97.63%). This moderate impact suggests that dropout plays an important role in preventing overfitting and maintaining model generalization.
Interestingly, the basic CNN architecture performs relatively well, achieving 98.44% accuracy, which is only 0.73% lower than the full model. This suggests that while our enhancements improve performance, the underlying CNN architecture is already quite effective for this classification task.
While individual elements contribute to model performance, their collective effect turned out to be less pronounced than originally hypothesized. Data balancing emerged as the most critical element, while the attention mechanism and dropout layers provided smaller but meaningful improvements to overall system performance.
4.8 The Proposed Model Explainability Analysis Using Multiple Visualization Techniques
This study employs multiple visualization techniques to provide a comprehensive explainability of the model’s decision process. We use both Grad-CAM and LIME to identify salient image regions that drive model predictions, as these methods provide complementary insights into the model’s areas of focus. Grad-CAM-generated attention maps align with clinical understanding by highlighting relevant anatomical structures such as the hippocampus and cortex regions known to show AD-related deterioration. At the same time, LIME provides a complementary explanation by segmenting regions that most strongly influence the model’s classifications, providing a more granular view of feature importance.
As shown in Fig. 11, we compare original MRI scans with both Grad-CAM and LIME visualizations across multiple cases. Grad-CAM (middle column) provides a continuous heat map where red indicates maximum contribution, effectively highlighting the gradients of importance across brain regions. LIME explanations (right column) provide a binary segmentation of influential regions, shown in yellow, providing a more precise delineation of areas the model considers critical for classification. The combination of these techniques improves model interpretability by providing both gradient-based (Grad-CAM) and segmentation-based (LIME) perspectives on feature importance. While Grad-CAM reveals the continuous spectrum of regional importance through color gradients, LIME’s binary segmentation helps validate these results by explicitly identifying the most critical regions. This dual visualization approach improves the interpretability of medical image analysis and provides medical experts with complementary tools to validate the model’s decision-making process against their clinical knowledge.

Figure 11: MRI scan visualizations using Grad-CAM and LIME explanability techniques for our dataset
The attention mechanism was also applied to reveal distinct patterns of focus across brain regions, as shown in Fig. 12. The figure shows the attention heatmaps and weight distributions for our dataset, highlighting the key areas that contributed most to the model’s classification decisions. The heatmaps show strong localized attention around specific brain structures, indicating that the model effectively focuses on regions relevant to disease detection. These results highlight the role of the attention mechanism in improving interpretability by pinpointing the most influential regions for classification. The observed variation between datasets highlights the adaptability of the attention-based model, while suggesting the need for dataset-specific tuning to optimize its performance.

Figure 12: Attention heatmaps and weight distributions for our dataset
The performance comparison of different models, as shown in Table 8, shows remarkable differences in accuracy, precision, recall, and F1-score. The proposed CNN with Attention model emerged as the top performer, achieving an impressive accuracy, along with perfect precision, recall, and F1-scores of over 99%. The VGG16 model, on the other hand, showed strong results with an accuracy of 97.26% and an F1-score of 97.27%. The ResMLP and Xception models showed comparatively lower scores, with accuracies of 94.70% and 91.87%, respectively, indicating a less effective performance in classifying the target categories. These results indicate that CNN with Attention architecture is the optimal choice for AD stage classification on our dataset.

We tested the proposed model using the widely established Alzheimer’s Disease Neuroimaging Initiative (ADNI) dataset [37]. This dataset contains 16,200 MRI scans with a resolution of 224
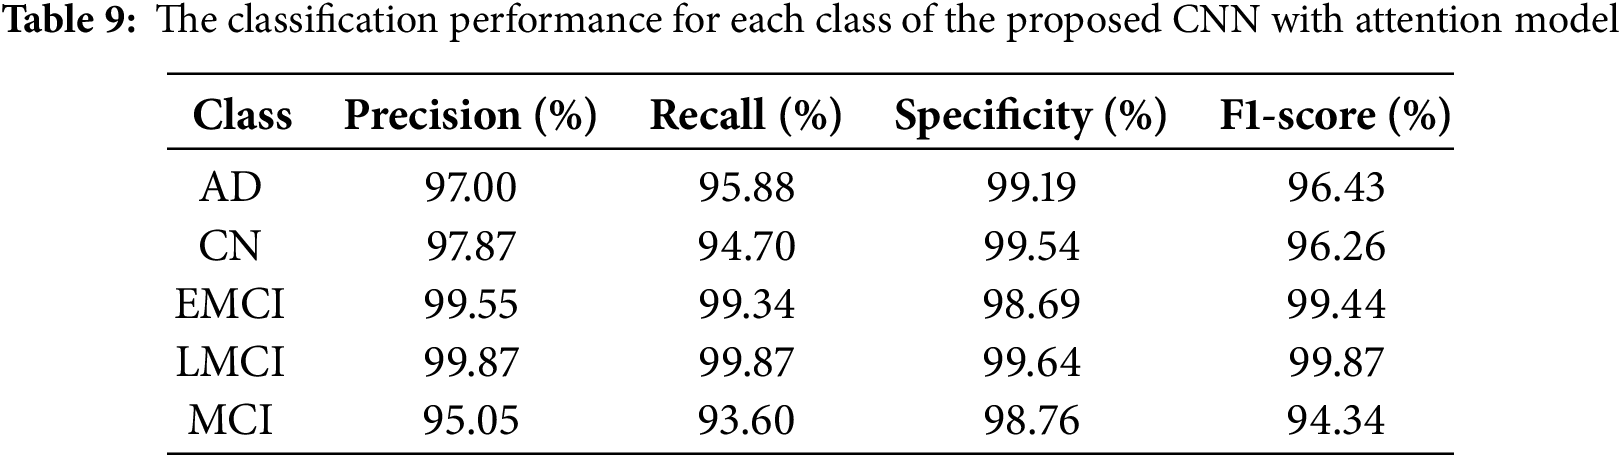
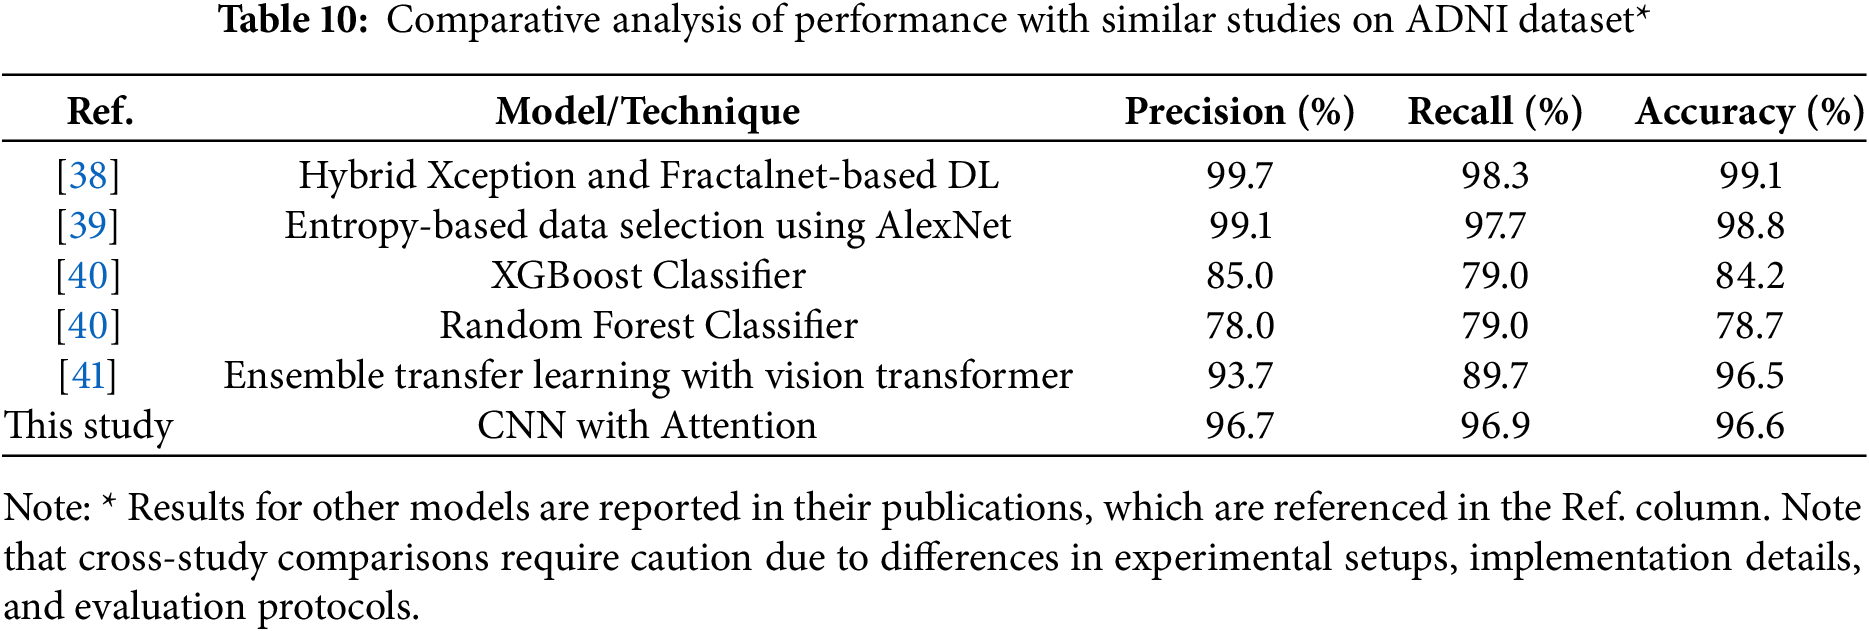
The comparative analysis shown in Table 10 demonstrates the strong performance of recent DL approaches for AD classification on ADNI dataset. According to the results on the table,while the hybrid Xception and Fractalnet-based DL model achieved slightly higher accuracy at 99.1%, and the entropy-based data selection approach using AlexNet showed strong performance at 98.8% accuracy, our model shows excellent balanced performance at 96.6% accuracy, 96.7% precision, and 96.9% recall. This is a significant improvement over traditional machine learning approaches such as XGBoost (84.2% accuracy) and Random Forest (78.7% accuracy). The balanced precision and recall metrics indicate our model’s robust and reliable classification capabilities across all stages of Alzheimer’s disease, a critical factor for clinical applications. Our model also demonstrates competitive performance against the ensemble transfer learning approach (96.5% accuracy), while offering a more streamlined single-model architecture. These results validate the effectiveness of our attention-based approach and suggest its strong potential for clinical applications in Alzheimer’s diagnosis. While direct comparisons between studies should be interpreted with caution due to differences in experimental design, our model shows competitive performance (96.6% accuracy) compared to results of other approaches. These results suggest the effectiveness of our attention-based approach, although we acknowledge that standardized evaluation protocols would be needed for accurate performance comparisons across methods.
This study has demonstrated the effectiveness of integrating multiple explainability techniques and attention mechanisms into DL frameworks for AD classification. Through a comprehensive evaluation of four different architectures (CNN with attention, ResMLP, VGG16, and Xception), our study establishes several significant findings in the field of computational AD diagnosis. The proposed CNN with attention model achieves superior performance metrics, with an accuracy of 99.18% on our dataset and 96.64% on the ADNI dataset, outperforming several recent approaches. This performance improvement can be attributed to three key innovations: the implementation of an attention mechanism that effectively identifies important features in brain MRI scans, the successful addressing of class imbalance through SMOTE preprocessing, and the integration of multiple XAI techniques (Grad-CAM and LIME) for comprehensive model interpretability.
The ablation study revealed the relative importance of different architectural components, with data balancing emerging as the most critical element (2.94% impact on accuracy), followed by dropout layers (1.55% impact), and the attention mechanism (1.11% impact). These results suggest that while individual components contribute incrementally to model performance, their collective implementation is essential for optimal results.
These findings suggest several promising directions for future research. First, the integration of multimodal data sources, including genomic information and cognitive assessment results, could further enhance the diagnostic capabilities of the model. Second, exploring more sophisticated attentional mechanisms could improve feature selection and interpretation. Finally, the framework’s success in overcoming class imbalance and interpretability challenges provides a foundation for applying similar approaches to other neurological disorders. In conclusion, this study advances both the technical capabilities and clinical applicability of AI-based diagnosis of AD. The framework’s ability to maintain high accuracy while providing interpretable results represents a significant step toward the practical implementation of AI systems in clinical settings, potentially enabling earlier and more accurate AD diagnosis and intervention.
Acknowledgement: The authors are sincerely thankful for the expertise and support provided by Dr. Omar M. Sultan and the team at the OMS Radiology Clinic. Their dedication to the advancement of medical research and commitment to this collaborative effort have been invaluable.
Funding Statement: The authors received no specific funding for this study.
Author Contributions: The authors confirm contribution to the paper as follows: study conception and design: Mustafa Lateef Fadhil Jumaili and Emrullah Sonuç; data collection: Mustafa Lateef Fadhil Jumaili; analysis and interpretation of results: Mustafa Lateef Fadhil Jumaili and Emrullah Sonuç; draft manuscript preparation: Mustafa Lateef Fadhil Jumaili and Emrullah Sonuç. All authors reviewed the results and approved the final version of the manuscript.
Availability of Data and Materials: The dataset used in the current study are available from the first author on reasonable request.
Ethics Approval: This study used retrospective, anonymized MRI brain scans provided by the OMS Radiology Clinic under the supervision of Dr. Omar M. Sultan, Specialist Radiologist at Tikrit University - College of Medicine. The dataset was provided specifically for Ph.D. research purposes in Computer Engineering at Karabuk University, with formal approval documented by the OMS Radiology Clinic. All images were fully anonymized prior to analysis, with no patient-identifying information retained. Since this research involved only retrospective analysis of anonymized medical images with no intervention or patient contact, it met the criteria for exemption from full ethical review according to institutional policy. The research adhered to the principles outlined in the Declaration of Helsinki for medical research involving human subjects.
Conflicts of Interest: The authors declare no conflicts of interest to report regarding the present study.
1This process was carried out in collaboration with Dr. Omar M. Sultan, a highly qualified specialist and renowned radiologist.
References
1. Portet F, Ousset PJ, Visser PJ, Frisoni GB, Nobili F, Scheltens P, et al. Mild cognitive impairment (MCI) in medical practice: a critical review of the concept and new diagnostic procedure. Report of the MCI Working Group of the European Consortium on Alzheimer’s Disease. J Neurol Neurosurg Psychiatry. 2006;77:714. [Google Scholar] [PubMed]
2. Association A. 2019 Alzheimer’s disease facts and figures. Alzheimer’s Dement. 2019;15(3):321–87. [Google Scholar]
3. Alzheimer’s Association. 2023 Alzheimer’s disease facts and figures. Alzheimer’s Dement. 2023;19:1598–695. [Google Scholar]
4. Mofrad SA, Lundervold A, Lundervold AS. A predictive framework based on brain volume trajectories enabling early detection of Alzheimer’s disease. Comput Med Imaging Graph. 2021;90(3):101910. doi:10.1016/j.compmedimag.2021.101910. [Google Scholar] [PubMed] [CrossRef]
5. Zhang T, Liao Q, Zhang D, Zhang C, Yan J, Ngetich R, et al. Predicting MCI to AD conversation using integrated sMRI and rs-fMRI: machine learning and graph theory approach. Front Aging Neurosci. 2021;13:688926. doi:10.3389/fnagi.2021.688926. [Google Scholar] [PubMed] [CrossRef]
6. Graff-Radford J, Yong KX, Apostolova LG, Bouwman FH, Carrillo M, Dickerson BC, et al. New insights into atypical Alzheimer’s disease in the era of biomarkers. Lancet Neurol. 2021;20(3):222. doi:10.1016/S1474-4422(20)30440-3. [Google Scholar] [PubMed] [CrossRef]
7. Blennow K, Zetterberg H. Biomarkers for Alzheimer’s disease: current status and prospects for the future. J Intern Med. 2018;284(6):643–63. doi:10.1111/joim.12816. [Google Scholar] [PubMed] [CrossRef]
8. Bron EE, Bron EE, Klein S, Papma JM, Jiskoot LC, Venkatraghavan V, et al. Cross-cohort generalizability of deep and conventional machine learning for MRI-based diagnosis and prediction of Alzheimer’s disease. Neuroimage Clin. 2021;31:102712. doi:10.1016/j.nicl.2021.102712. [Google Scholar] [PubMed] [CrossRef]
9. Vrahatis AG, Skolariki K, Krokidis MG, Lazaros K, Exarchos TP, Vlamos P. Revolutionizing the early detection of Alzheimer’s disease through non-invasive biomarkers: the role of artificial intelligence and deep learning. Sensors. 2023;23(9):4184. doi:10.3390/s23094184. [Google Scholar] [PubMed] [CrossRef]
10. Chang CH, Lin CH, Lane HY. Machine learning and novel biomarkers for the diagnosis of Alzheimer’s disease. Int J Mol Sci. 2021;22(5):2761. doi:10.3390/ijms22052761. [Google Scholar] [PubMed] [CrossRef]
11. Salvatore C, Cerasa A, Battista P, Gilardi MC, Quattrone A, Castiglioni I. Magnetic resonance imaging biomarkers for the early diagnosis of Alzheimer’s disease: a machine learning approach. Front Neurosci. 2015;9(20):144798. doi:10.3389/fnins.2015.00307. [Google Scholar] [PubMed] [CrossRef]
12. Balaji P, Chaurasia MA, Bilfaqih SM, Muniasamy A, Alsid LEG. Hybridized deep learning approach for detecting Alzheimer’s disease. Biomedicines. 2023;11(1):149. doi:10.3390/biomedicines11010149. [Google Scholar] [PubMed] [CrossRef]
13. Yi F, Yang H, Chen D, Qin Y, Han H, Cui J, et al. XGBoost-SHAP-based interpretable diagnostic framework for Alzheimer’s disease. BMC Med Inform Decis Mak. 2023;23(1):137. doi:10.1186/s12911-023-02238-9. [Google Scholar] [PubMed] [CrossRef]
14. Yamanakkanavar N, Choi JY, Lee B. MRI segmentation and classification of human brain using deep learning for diagnosis of Alzheimer’s disease: a survey. Sensors. 2020 Jun;20(11):3243. doi:10.3390/s20113243. [Google Scholar] [PubMed] [CrossRef]
15. Basheer S, Bhatia S, Sakri SB. Computational modeling of dementia prediction using deep neural network: analysis on OASIS dataset. IEEE Access. 2021;9:42449–62. doi:10.1109/ACCESS.2021.3066213. [Google Scholar] [CrossRef]
16. Liu S, Liu S, Cai W, Pujol S, Kikinis R, Feng D. Early diagnosis of Alzheimer’s disease with deep learning. In: IEEE 11th International Symposium on Biomedical Imaging; 2014 Apr 29–May 2; Beijing, China. p. 1015–8. [Google Scholar]
17. Ortiz A, Munilla J, Gorriz JM, Ramirez J. Ensembles of deep learning architectures for the early diagnosis of the Alzheimer’s disease. Int J Neural Syst. 2016;26(7):1650025. doi:10.1142/S0129065716500258. [Google Scholar] [PubMed] [CrossRef]
18. Ju R, Hu C, Zhou P, Li Q. Early diagnosis of Alzheimer’s disease based on resting-state brain networks and deep learning. IEEE/ACM Trans Comput Biol Bioinf. 2019 Jan;16(1):244–57. doi:10.1109/TCBB.2017.2776910. [Google Scholar] [PubMed] [CrossRef]
19. Nawaz H, Maqsood M, Afzal S, Aadil F, Mehmood I, Rho S. A deep feature-based real-time system for Alzheimer disease stage detection. Multimedia Tools Appl. 2021 Nov;80(28–29):35789–807. doi:10.1007/s11042-020-09087-y. [Google Scholar] [CrossRef]
20. Basaia S, Agosta F, Wagner L, Canu E, Magnani G, Santangelo R, et al. Automated classification of Alzheimer’s disease and mild cognitive impairment using a single MRI and deep neural networks. NeuroImage: Clin. 2019 Feb;21:101645. doi:10.1016/j.nicl.2018.101645. [Google Scholar] [PubMed] [CrossRef]
21. Sun H, Wang A, Wang W, Liu C. An improved deep residual network prediction model for the early diagnosis of Alzheimer’s disease. Sensors. 2021 Jun;21(12):4182. doi:10.3390/s21124182. [Google Scholar] [PubMed] [CrossRef]
22. Jain R, Jain N, Aggarwal A, Hemanth DJ. Convolutional neural network based Alzheimer’s disease classification from magnetic resonance brain images. Cognit Syst Res. 2019 Oct;57(2):147–59. doi:10.1016/j.cogsys.2018.12.015. [Google Scholar] [CrossRef]
23. Zuo Q, Hu J, Zhang Y, Pan J, Jing C, Chen X, et al. Brain functional network generation using distribution-regularized adversarial graph autoencoder with transformer for dementia diagnosis. Comput Model Eng Sci. 2023;137(3):2129. doi:10.32604/cmes.2023.028732. [Google Scholar] [PubMed] [CrossRef]
24. Akter L, Al-Islam F. Dementia identification for diagnosing Alzheimer’s disease using XGBoost algorithm. In: Proceedings of the 2021 International Conference on Information and Communication Technology for Sustainable Development, ICICT4SD 2021; 2021; Dhaka, Bangladesh. p. 205–9. [Google Scholar]
25. Schouten TM, Koini M, Vos FD, Seiler S, Rooij MD, Lechner A, et al. Individual classification of Alzheimer’s disease with diffusion magnetic resonance imaging. NeuroImage. 2017 May;152(2):476–81. doi:10.1016/j.neuroimage.2017.03.025. [Google Scholar] [PubMed] [CrossRef]
26. Feng C, Elazab A, Yang P, Wang T, Zhou F, Hu H, et al. Deep learning framework for Alzheimer’s disease diagnosis via 3D-CNN and FSBi-LSTM. IEEE Access. 2019;7:63605–18. doi:10.1109/ACCESS.2019.2913847. [Google Scholar] [CrossRef]
27. Allioui H, Sadgal M, Elfazziki A. Deep MRI segmentation: a convolutional method applied to Alzheimer disease detection. Int J Adv Comput Sci Appl. 2019;10(11):7. doi:10.14569/issn.2156-5570. [Google Scholar] [CrossRef]
28. Kaur A, Mittal M, Bhatti JS, Thareja S, Singh S. A systematic literature review on the significance of deep learning and machine learning in predicting Alzheimer’s disease. Artif Intell Med. 2024;154(1):102928. doi:10.1016/j.artmed.2024.102928. [Google Scholar] [PubMed] [CrossRef]
29. Hassen SB, Neji M, Hussain Z, Hussain A, Alimi AM, Frikha M. Deep learning methods for early detection of Alzheimer’s disease using structural MR images: a survey. Neurocomputing. 2024;576(1):127325. doi:10.1016/j.neucom.2024.127325. [Google Scholar] [CrossRef]
30. Ge C, Qu Q, Gu IY, Jakola AS. Multiscale deep convolutional networks for characterization and detection of Alzheimer’s disease using MR images. In: IEEE International Conference on Image Processing (ICIP); 2019 Sep 22–25; Taipei, Taiwan. p. 789–93. [Google Scholar]
31. Balasundaram A, Srinivasan S, Prasad A, Malik J, Kumar A. Hippocampus segmentation-based Alzheimer’s disease diagnosis and classification of MRI images. Arabian J Sci Eng. 2023 Jan;48(8):1–17. doi:10.1007/s13369-022-07538-2. [Google Scholar] [PubMed] [CrossRef]
32. Samek W. Explainable artificial intelligence: understanding, visualizing and interpreting deep learning models. arXiv:1708.08296. 2017. [Google Scholar]
33. Wang S, Zhang Y. Grad-CAM: understanding AI models. Comput Mater Contin. 2023;76(2):1321–4. doi:10.32604/cmc.2023.041419. [Google Scholar] [CrossRef]
34. Niu Z, Zhong G, Yu H. A review on the attention mechanism of deep learning. Neurocomputing. 2021;452:48–62. doi:10.1016/j.neucom.2021.03.091. [Google Scholar] [CrossRef]
35. Akbar S, Azam H, Almutairi SS, Alqahtani O, Shah H, Aleryani A. Contemporary study for detection of COVID-19 using machine learning with explainable AI. Comput Mater Contin. 2024;80(1):1075–104. doi:10.32604/cmc.2024.050913. [Google Scholar] [CrossRef]
36. Fareed MMS, Zikria S, Ahmed G, Mahmood S, Aslam M, Jillani SF, et al. ADD-Net: an effective deep learning model for early detection of Alzheimer disease in MRI scans. IEEE Access. 2022;10:96930–51. doi:10.1109/ACCESS.2022.3204395. [Google Scholar] [CrossRef]
37. Petersen RC, Aisen PS, Beckett LA, Donohue MC, Gamst AC, Harvey DJ, et al. Alzheimer’s disease Neuroimaging Initiative (ADNI) clinical characterization. Neurology. 2010;74(3):201–9. doi:10.1212/WNL.0b013e3181cb3e25. [Google Scholar] [PubMed] [CrossRef]
38. Aparna M, Rao BS. Xception-fractalnet: hybrid deep learning based multi-class classification of Alzheimer’s disease. Comput Mater Contin. 2023;74(3):6909–32. doi:10.32604/cmc.2023.034796. [Google Scholar] [CrossRef]
39. Lee B, Ellahi W, Choi JY. Using deep CNN with data permutation scheme for classification of Alzheimer’s disease in structural magnetic resonance imaging (sMRI). IEICE Trans Inf Syst. 2019;102(7):1384–95. doi:10.1587/transinf.2018EDP7393. [Google Scholar] [CrossRef]
40. Bogdanovic B, Eftimov T, Simjanoska M. In-depth insights into Alzheimer’s disease by using explainable machine learning approach. Sci Rep. 2022;12(1):6508. doi:10.1038/s41598-022-10202-2. [Google Scholar] [PubMed] [CrossRef]
41. Poonia RC, Al-Alshaikh HA. Ensemble approach of transfer learning and vision transformer leveraging explainable AI for disease diagnosis: an advancement towards smart Healthcare 5.0. Comput Biol Med. 2024;179(12):108874. doi:10.1016/j.compbiomed.2024.108874. [Google Scholar] [PubMed] [CrossRef]
Cite This Article
 Copyright © 2025 The Author(s). Published by Tech Science Press.
This work is licensed under a Creative Commons Attribution 4.0 International License , which permits unrestricted use, distribution, and reproduction in any medium, provided the original work is properly cited.
 Downloads
 Citation Tools