
 Submit a Paper
 Propose a Special lssue
 Open Access
ARTICLE
Optimizing Forecast Accuracy in Cryptocurrency Markets: Evaluating Feature Selection Techniques for Technical Indicators
1 IMIA Laboratory, Faculty of Sciences and Techniques, Moulay Ismail University of Meknès, Errachidia, 52003, Morocco
2 Department of Computer Science, Faculty of Science of Meknès, Moulay Ismail University of Meknès, Meknes, 50000, Morocco
* Corresponding Author: Yousef Farhaoui. Email:
Computers, Materials & Continua 2025, 83(2), 3411-3433. https://doi.org/10.32604/cmc.2025.063218
Received 08 January 2025; Accepted 13 March 2025; Issue published 16 April 2025
 View Full Text
 Download PDF
Abstract
This study provides a systematic investigation into the influence of feature selection methods on cryptocurrency price forecasting models employing technical indicators. In this work, over 130 technical indicators—covering momentum, volatility, volume, and trend-related technical indicators—are subjected to three distinct feature selection approaches. Specifically, mutual information (MI), recursive feature elimination (RFE), and random forest importance (RFI). By extracting an optimal set of 20 predictors, the proposed framework aims to mitigate redundancy and overfitting while enhancing interpretability. These feature subsets are integrated into support vector regression (SVR), Huber regressors, and k-nearest neighbors (KNN) models to forecast the prices of three leading cryptocurrencies—Bitcoin (BTC/USDT), Ethereum (ETH/USDT), and Binance Coin (BNB/USDT)—across horizons ranging from 1 to 20 days. Model evaluation employs the coefficient of determination (R2) and the root mean squared logarithmic error (RMSLE), alongside a walk-forward validation scheme to approximate real-world trading contexts. Empirical results indicate that incorporating momentum and volatility measures substantially improves predictive accuracy, with particularly pronounced effects observed at longer forecast windows. Moreover, indicators related to volume and trend provide incremental benefits in select market conditions. Notably, an 80%–85% reduction in the original feature set frequently maintains or enhances model performance relative to the complete indicator set. These findings highlight the critical role of targeted feature selection in addressing high-dimensional financial data challenges while preserving model robustness. This research advances the field of cryptocurrency forecasting by offering a rigorous comparison of feature selection methods and their effects on multiple digital assets and prediction horizons. The outcomes highlight the importance of dimension-reduction strategies in developing more efficient and resilient forecasting algorithms. Future efforts should incorporate high-frequency data and explore alternative selection techniques to further refine predictive accuracy in this highly volatile domain.Keywords
The cryptocurrency market has emerged as a significant component of the global financial system. The inherent complexity and high volatility of these markets pose substantial challenges for investors and traders in making informed decisions [1]. The increasing integration of cryptocurrencies into mainstream finance intensified the need for sophisticated prediction models that could help traders make profits within these markets, known for their high volatility [2]. While traditional approaches like fundamental analysis and technical analysis remain prevalent, their effectiveness is often limited by the unique characteristics of cryptocurrency markets, including 24/7 trading, global accessibility, and heightened sensitivity to market sentiment [3].
Technical analysis, which relies on historical price patterns and technical indicators, faces challenges in handling the complex, non-linear relationships inherent in these markets. Recent research suggests that integrating multiple technical indicators through advanced analytical frameworks can significantly enhance prediction accuracy [4,5]. Machine learning approaches have demonstrated superior capability in capturing the intricate patterns within cryptocurrency price movements. These methods excel at processing large volumes of historical data and identifying complex relationships that might be imperceptible through traditional analysis. However, the effectiveness of machine learning models heavily depends on the quality and relevance of input features, particularly in multi-horizon forecasting scenarios where different technical indicators may exhibit varying degrees of predictive power across different time frames. By using algorithms to analyze large volumes of data, this method can identify complex trends and provide more accurate forecasts. Machine learning models, fueled by historical price data and technical characteristics, allow price prediction to be treated as a classification or regression problem.
This study addresses several critical gaps in current cryptocurrency price prediction research. First, while existing studies often focus on single-currency, next-day predictions, we extend our analysis to multiple major cryptocurrencies (Bitcoin, Ethereum, and Binance Coin) across various prediction horizons. Second, we employ a comprehensive set of over 130 technical indicators, substantially expanding upon the typical 20–30 indicators used in previous studies [6,7]. Third, we implement multiple feature selection methods to identify the most relevant indicators for different prediction horizons, addressing the challenge of feature relevance across temporal scales [8].
Our research makes several contributions to the field: (1) We provide a systematic evaluation of feature selection methods across multiple cryptocurrencies and prediction horizons, offering insights into the temporal stability of technical indicators; (2) We implement a walk-forward approach to ensure robust model validation and realistic performance assessment; (3) We employ regression models that are particularly sensitive to feature selection, enabling a more nuanced understanding of feature importance; and (4) We develop practical recommendations for implementing these findings in real-world trading scenarios.
The document is structured as follows: Section 2 presents related work, discussing previous research on feature selection methods in the cryptocurrency field. Section 3 details data collection and preprocessing methods, as well as the feature selection algorithms used. Section 4 presents the results obtained while Section 5 analyzes them and discusses their significance. Finally, Section 6 summarizes the key findings and suggests directions for future research.
Recent advances in cryptocurrency price prediction have focused on three main areas: feature selection methodologies, technical indicator optimization, and prediction model architectures. Here, we review relevant literature across these dimensions while highlighting the gaps our research addresses.
Feature selection has emerged as a critical component in cryptocurrency price prediction. Moodi et al. [9] examined various technical indicators and regression methods, demonstrating that appropriate feature selection can significantly improve model performance. Their work with 123 technical indicators showed that certain combinations of features could improve prediction accuracy by up to 76.7% compared to baseline models. Building on this, Pabuccu and Barbu [6] introduced Feature Selection with Annealing (FSA), comparing it against traditional methods like LASSO and Boruta. Their study across multiple cryptocurrencies demonstrated that FSA could enhance model performance regardless of the problem type.
In a more focused study, Nagaraj et al. [10] applied recursive feature elimination (RFE) to select optimal technical indicators from a set of 35 features. Their results showed significant improvements in classification accuracy, achieving AUC (Area Under Curve) scores of 0.90 and 0.93 for different assets. Similarly, Contreras et al. [11] explored genetic algorithms for feature selection in predicting cryptocurrency time series monotonicity, demonstrating the effectiveness of evolutionary approaches in handling complex market data.
Recent research has shown increasing sophistication in the integration of technical indicators. Wei et al. [2] combined technical and fundamental analysis, highlighting the complementary nature of these approaches in cryptocurrency markets. Their work demonstrated that certain technical indicators become more relevant during specific market conditions, suggesting the need for adaptive feature selection approaches. Akhiat et al. [12] introduced the Noisy Random Forest (NRF) method to improve feature selection by adding noisy features to filter out irrelevant variables. This approach proved particularly effective in cryptocurrency markets, where noise and volatility are prevalent. Zhu et al. [4] further explored this direction by examining 27 factors for Bitcoin price prediction, emphasizing the importance of adaptive feature selection in volatile markets.
While most existing studies focus on single-day predictions, some recent work has begun to explore multi-horizon forecasting. Naganjaneyulu et al. [13] presented hierarchical strategies based on multiple technical indicators, proposing innovative methods to select relevant indicators depending on market conditions and prediction horizons. Alsubaie et al. [14] demonstrated that optimal indicator selection could vary significantly across different prediction horizons, achieving improved accuracy with at least ten carefully selected indicators.
Based on our literature review, we identify several research gaps that our study addresses:
1. Few works address feature selection in cryptocurrencies, unless explicitly mentioned the reviewed works use stocks or other tradable assets data.
2. Few reviewed studies used multiple feature selection methods.
3. Limited scope in feature selection: Most studies utilize a relatively small set of technical indicators (20–50) and often employ single feature selection methods.
4. Single-horizon focus: The majority of existing research focuses on single-day predictions, lacking analysis of feature importance across different time horizons.
5. Validation methodology: Few studies implement walk-forward validation, which better reflects real-world trading conditions.
6. Multi-currency analysis: Limited research exists on comparing feature selection effectiveness across different cryptocurrencies.
Our study addresses these gaps by using 3 feature selection methods from filter-, wrapper-, and embedded-based selection techniques, to analyze over 130 technical indicators across Bitcoin (BTC/USDT), Ethereum (ETH/USDT), and Binance coin (BNB/USDT), and multiple prediction horizons (from 1 to 20). By employing Mutual Information (MI), Recursive Feature Elimination (RFE), and Random Forest Importance (RFI), we aim to systematically evaluate the relevance of different technical indicators in cryptocurrency price prediction.
Building on this approach, our study specifically addresses the following research questions:
1. How does the effectiveness of different feature selection methods (MI, RFE, RFI) vary across different cryptocurrencies (BTC, ETH, BNB), different prediction horizons (1–20 days), and different regression models (Huber, SVR, KNN)?
2. What is the temporal stability of selected technical indicators across different prediction horizons, and how does this impact model performance?
3. How do different categories of technical indicators (momentum, trend, volatility, volume) contribute to prediction accuracy at various time horizons?
This section details the dataset employed for Bitcoin (BTC/USDT), Ethereum (ETH/USDT), and Binance coin (BNB/USDT) price forecasting, the feature selection methods investigated, the machine learning models applied, and the evaluation metrics used to assess the performance of the models.
3.1 Data Collection and Preprocessing
We obtained minute-by-minute historical trading data for three major cryptocurrencies (Bitcoin, Ethereum, and Binance Coin) paired with USDT from the Binance exchange [15]. The data spans from August 2017 (November 2017 for BNB) to January 2025, providing a comprehensive dataset that captures various market conditions.
Each dataset contains OHLCV (Open, High, Low, Close, Volume) values and the number of transactions for each minute. Following [16], we aggregated the minute-by-minute data into daily windows, calculating daily OHLCV values to reduce noise and computational complexity while maintaining essential price information [17].
Using the pandas-ta Python library [18], we generated over 130 technical indicators across four main categories:
• Volatility: Volatility indicators measure the magnitude and frequency of price fluctuations, giving insight into market risk and potential price swings.
• Momentum: Momentum indicators assess the speed and strength of price movements, identifying potential trend reversals or continuations.
• Volume: Volume indicators analyze trading activity, confirming trends or signaling potential reversals when combined with price data.
• Trend: Trend indicators help identify the overall direction of the market, whether bullish, bearish, or neutral.
In this study, we used the logarithmic returns of the closing price as the target variable to predict future variations in Bitcoin’s price. Logarithmic returns are preferred over simple returns due to their time additivity and symmetry [19], which allow for a more accurate analysis of cumulative returns and balanced treatment of gains and losses.
We employed three empirically chosen feature selection methods—Mutual Information, Recursive Feature Elimination (RFE), and Random Forest Importance—each offering a distinct approach to identifying the most relevant technical indicators. Each of these methods is used to get 20 features of the technical indicators, which are used as input for our models. These methods were selected because they represent the three main categories of feature selection methods: filter-based, wrapper-based, and embedded techniques.
Mutual Information (MI) is a statistical measure used to quantify the dependence between two random variables [20], evaluating the amount of information that the knowledge of one variable provides about the other, thereby capturing both linear and nonlinear dependencies between them [21]. As a filter-based feature selection method, MI falls under the category of techniques that assess the relevance of each feature by examining its statistical relationship with the target variable independently of any learning algorithm [22]. This capability is crucial for identifying non-linear relationships in volatile and complex markets like Bitcoin, where traditional linear assumptions often fall short. Formally, the mutual information between two random variables
where MI is zero when X and Y are statistically independent as depicted in Formula (2).
3.3.2 Recursive Feature Elimination (RFE)
Recursive Feature Elimination (RFE) represents a wrapper-based method. Wrapper methods involve training a model iteratively and evaluating feature subsets based on model performance [23]. RFE recursively removes the least important features based on the model’s performance, providing a systematic way of identifying the most relevant features [20]. This approach is particularly effective in ensuring that only the most impactful indicators are retained while accounting for interactions between features, thus minimizing noise in the prediction model.
3.3.3 Random Forest Importance (RFI)
Random Forest Importance belongs to the embedded category of feature selection techniques. Embedded methods perform feature selection during the process of model training [24]. Random Forest Importance ranks features based on their contribution to reducing model error in an ensemble framework, offering insights into the importance of features as they interact within the model.
3.4 Machine Learning Algorithms
In this study, we employ three regression models that are particularly sensitive to feature selection: Support Vector Regression (SVR), Huber Regressor, and K-Nearest Neighbors (KNN) Regressor.
3.4.1 Support Vector Regression (SVR)
The SVR model constructs a hyperplane in a high-dimensional space that maximizes the margin while ensuring that the prediction error remains within an ε-insensitive tube. Given a dataset
subject to
where:
•
•
•
•
The Huber Regressor combines the properties of linear regression with robust error estimation. It minimizes the Huber loss function, which is less sensitive to outliers than the squared error loss. The Huber loss function is defined as:
where
3.4.3 K-Nearest Neighbors (KNN) Regressor
The KNN regressor predicts the target value for an observation by averaging the responses of its k nearest neighbors in the feature space. Formally, if
3.5 Model Validation and Evaluation
We implemented a walk-forward validation [25] to simulate real-world trading conditions and ensure robust model evaluation. Our validation strategy involves:
1. Setting an initial training window of two years
2. Using a validation window of six months
3. Implementing a step size of one month
4. Retraining models at each step
For performance evaluation, we employ two primary metrics: R2 and RMSLE.
3.6.1 Coefficient of Determination (R2 Score)
The coefficient of determination, R2, is a key measure for evaluating the quality of a regression model, indicating the proportion of variance in the data that is explained by the mode [26]. The higher the R2 value, the better the model captures the variations in the observed data. Formula (6) shows how the R2 Score is calculated. Where n is the number of measurements, yi is the value of the i-th observation in the validation dataset,
3.6.2 Root Mean Squared Logarithmic Error
The RMSLE (Root Mean Squared Logarithmic Error) is a performance metric for regression models, particularly useful when the target values span multiple orders of magnitude. It measures the difference between the logarithms of predicted and actual values, giving more weight to large proportional errors [27]. The formula for calculating RMSLE is given by Formula (7).
where:
• n is the number of data points.
• ŷi is the predicted value for observation i.
• yi is the actual value for observation i.
• log is the natural logarithmic function.
This section summarizes our experimental findings on feature selection methods and machine learning models (SVR, Huber, KNN) for predicting BTC/USDT, ETH/USDT, and BNB/USDT prices. The experimental protocol comprised: (1) identifying an optimal subset of 20 technical indicators (after confirming that 20 balanced complexity and accuracy), (2) establishing a baseline model (benchmark) trained on the full feature set across 1–20-day horizons, and (3) comparing each reduced feature set from Mutual Information (MI), Recursive Feature Elimination (RFE), and Random Forest Importance (RFI) with the baseline. Negative values in figures were excluded to highlight the most salient data.
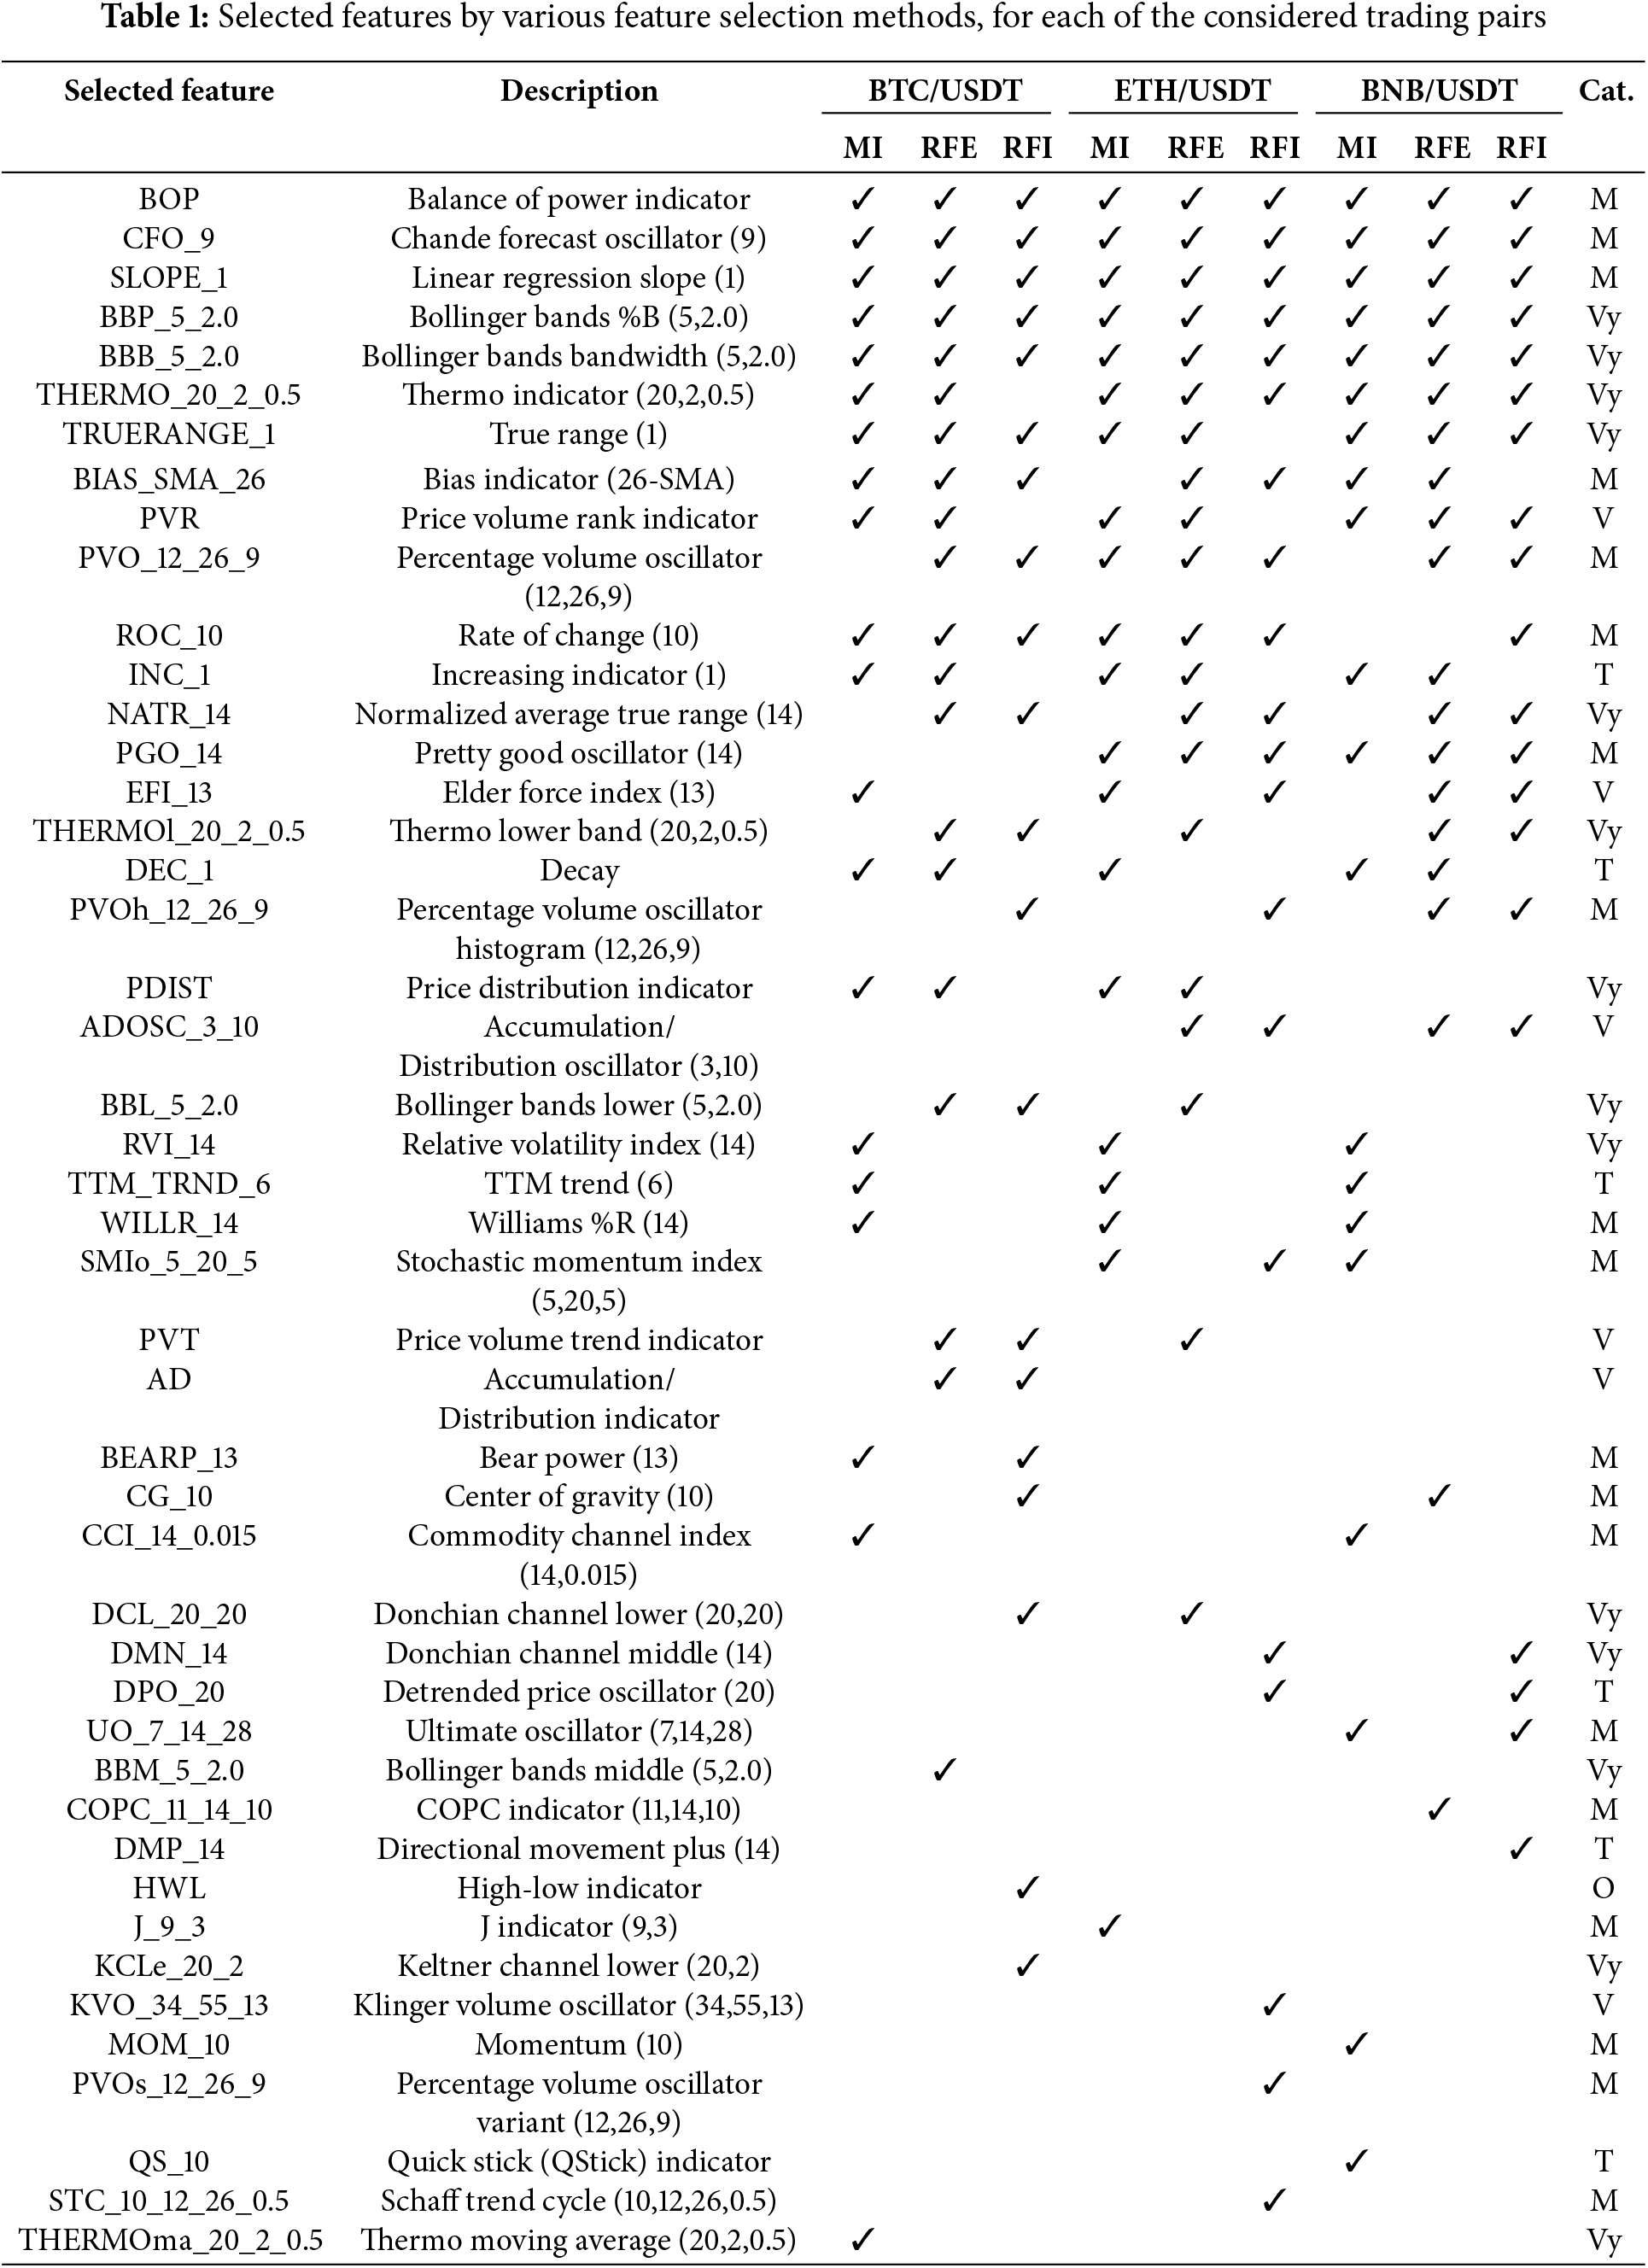
Table 1 lists the selected technical indicators (46 unique technical indicators), with concise descriptions, and whether they were selected by MI, RFE, or RFI for each trading pair. The “Cat.” column denotes categories assigned by pandas-ta to each technical indicator (M: Momentum, V: Volume, Vy: Volatility, T: Trend, O: Overlap).
We evaluated each model’s R2 and RMSLE across 1–20-day horizons. Figs. 1–18 illustrate performance for SVR, Huber, and KNN on BTC/USDT, ETH/USDT, and BNB/USDT using both the full (baseline or benchmark) and reduced feature sets (selected 20 features).
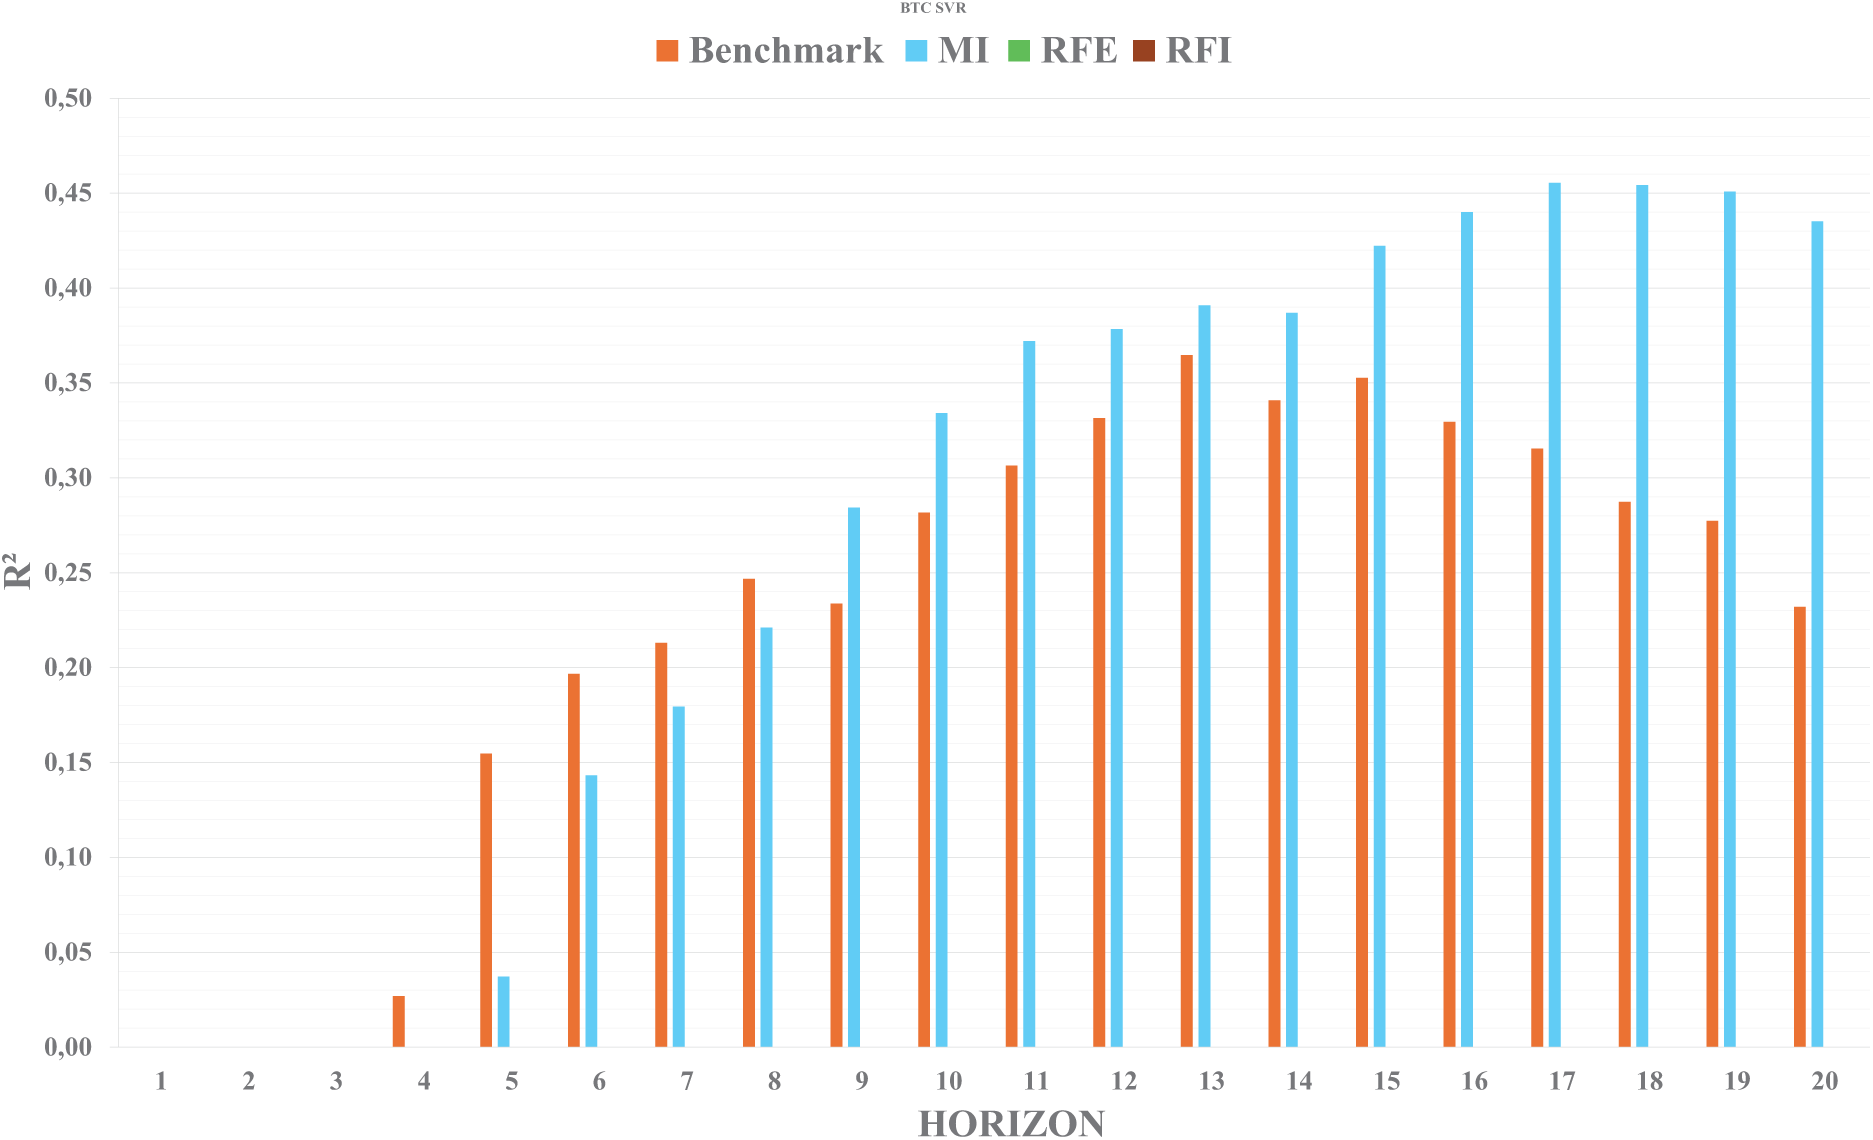
Figure 1: SVR model R2 results for BTC/USDT pair using different feature sets
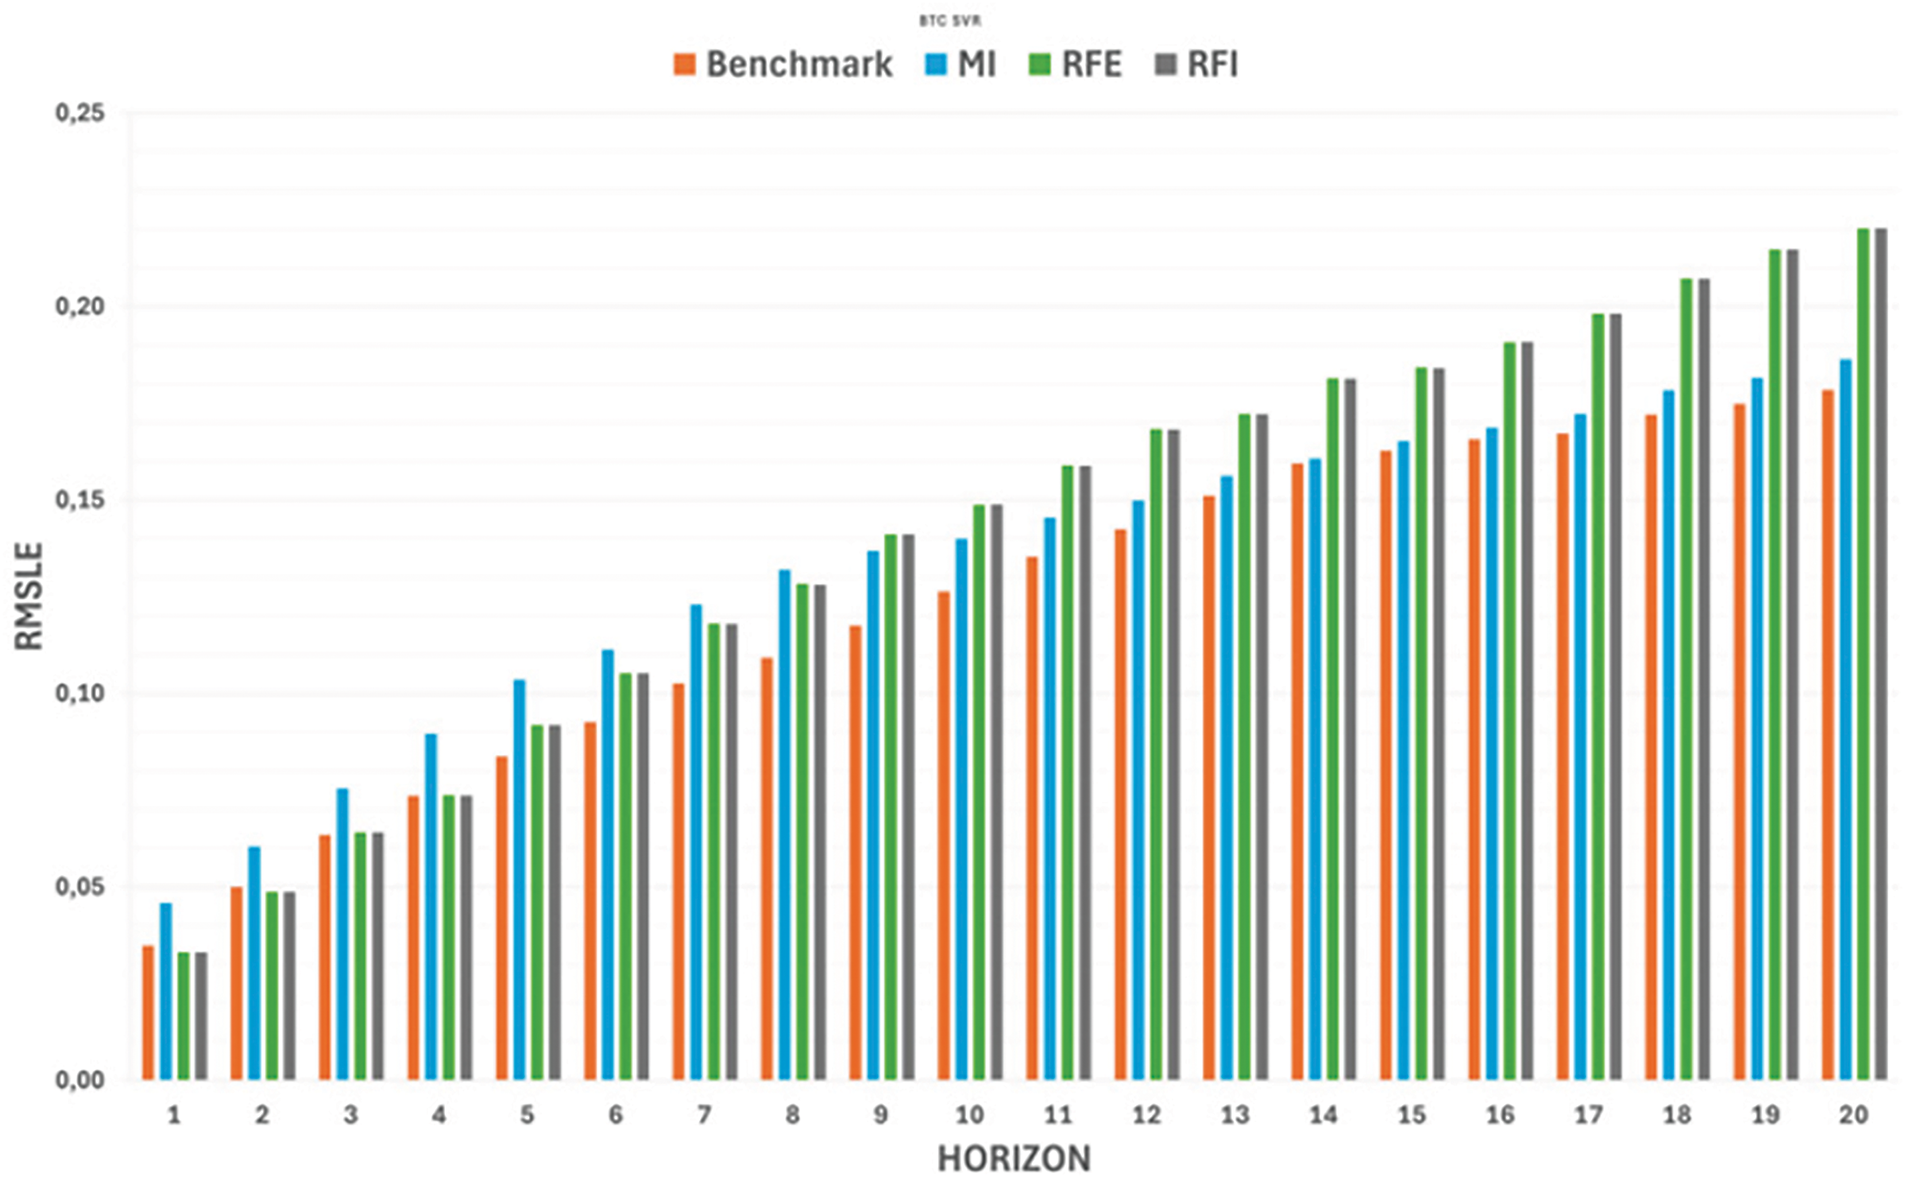
Figure 2: SVR model RMSLE results for BTC/USDT pair using different feature sets
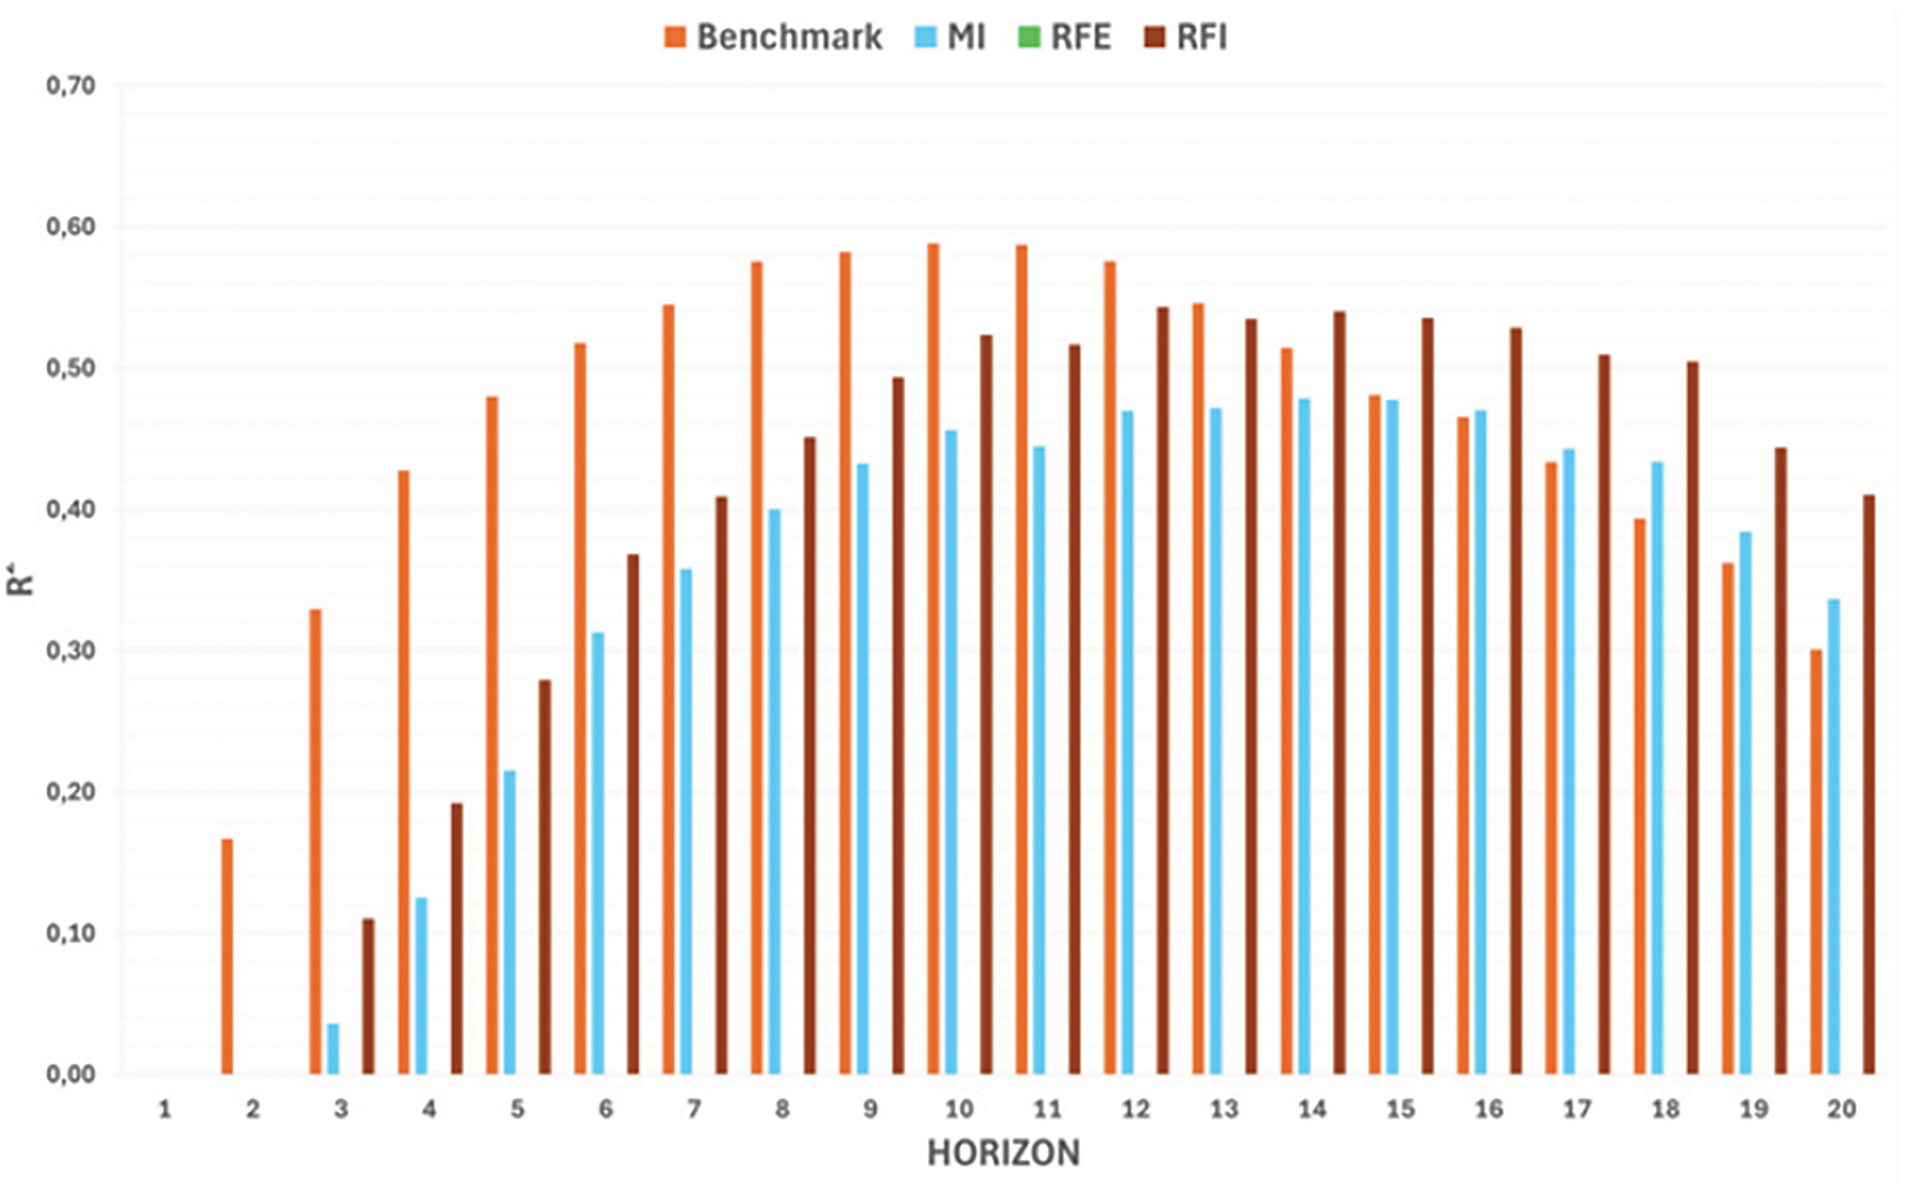
Figure 3: SVR model R2 results for ETH/USDT pair using different feature sets
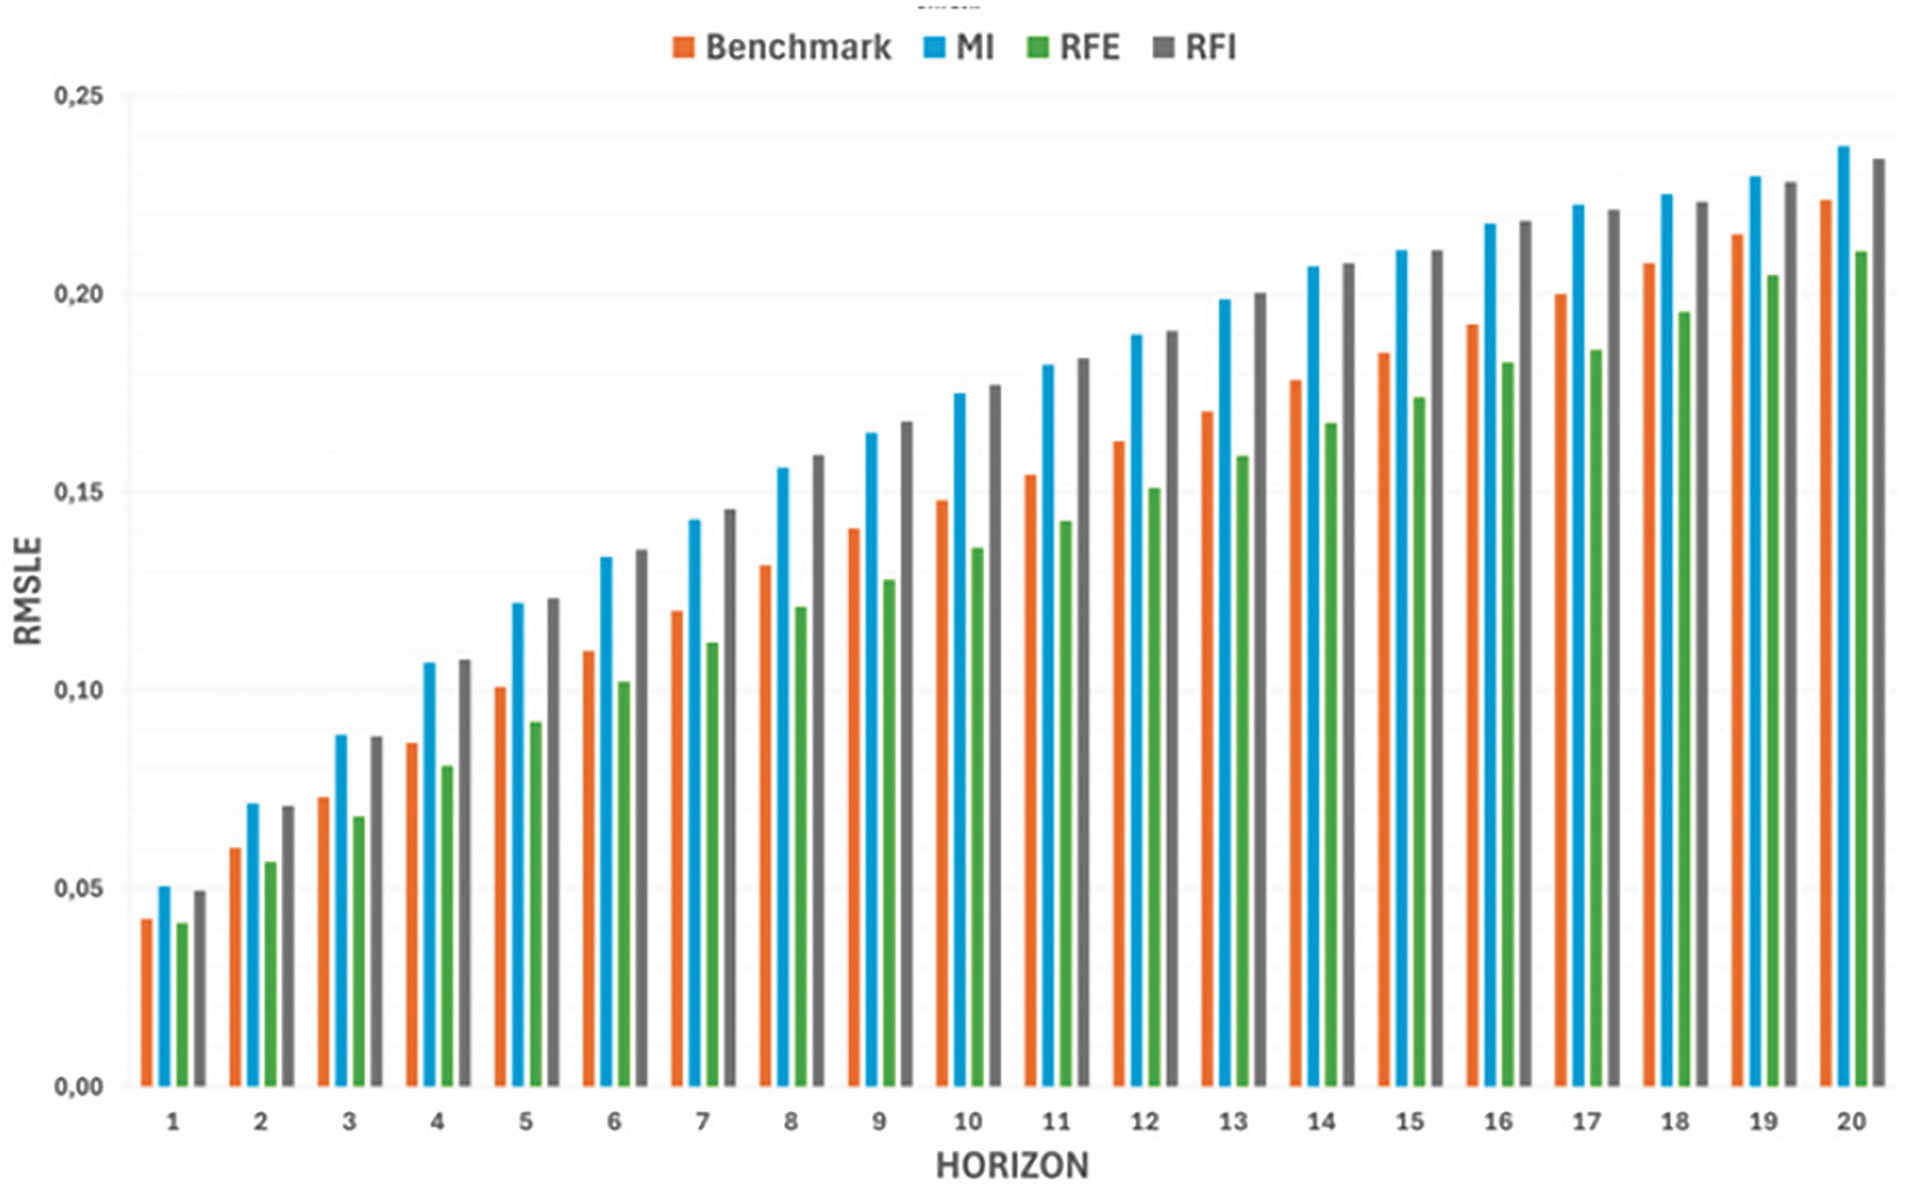
Figure 4: SVR model RMSLE results for ETH/USDT pair using different feature sets
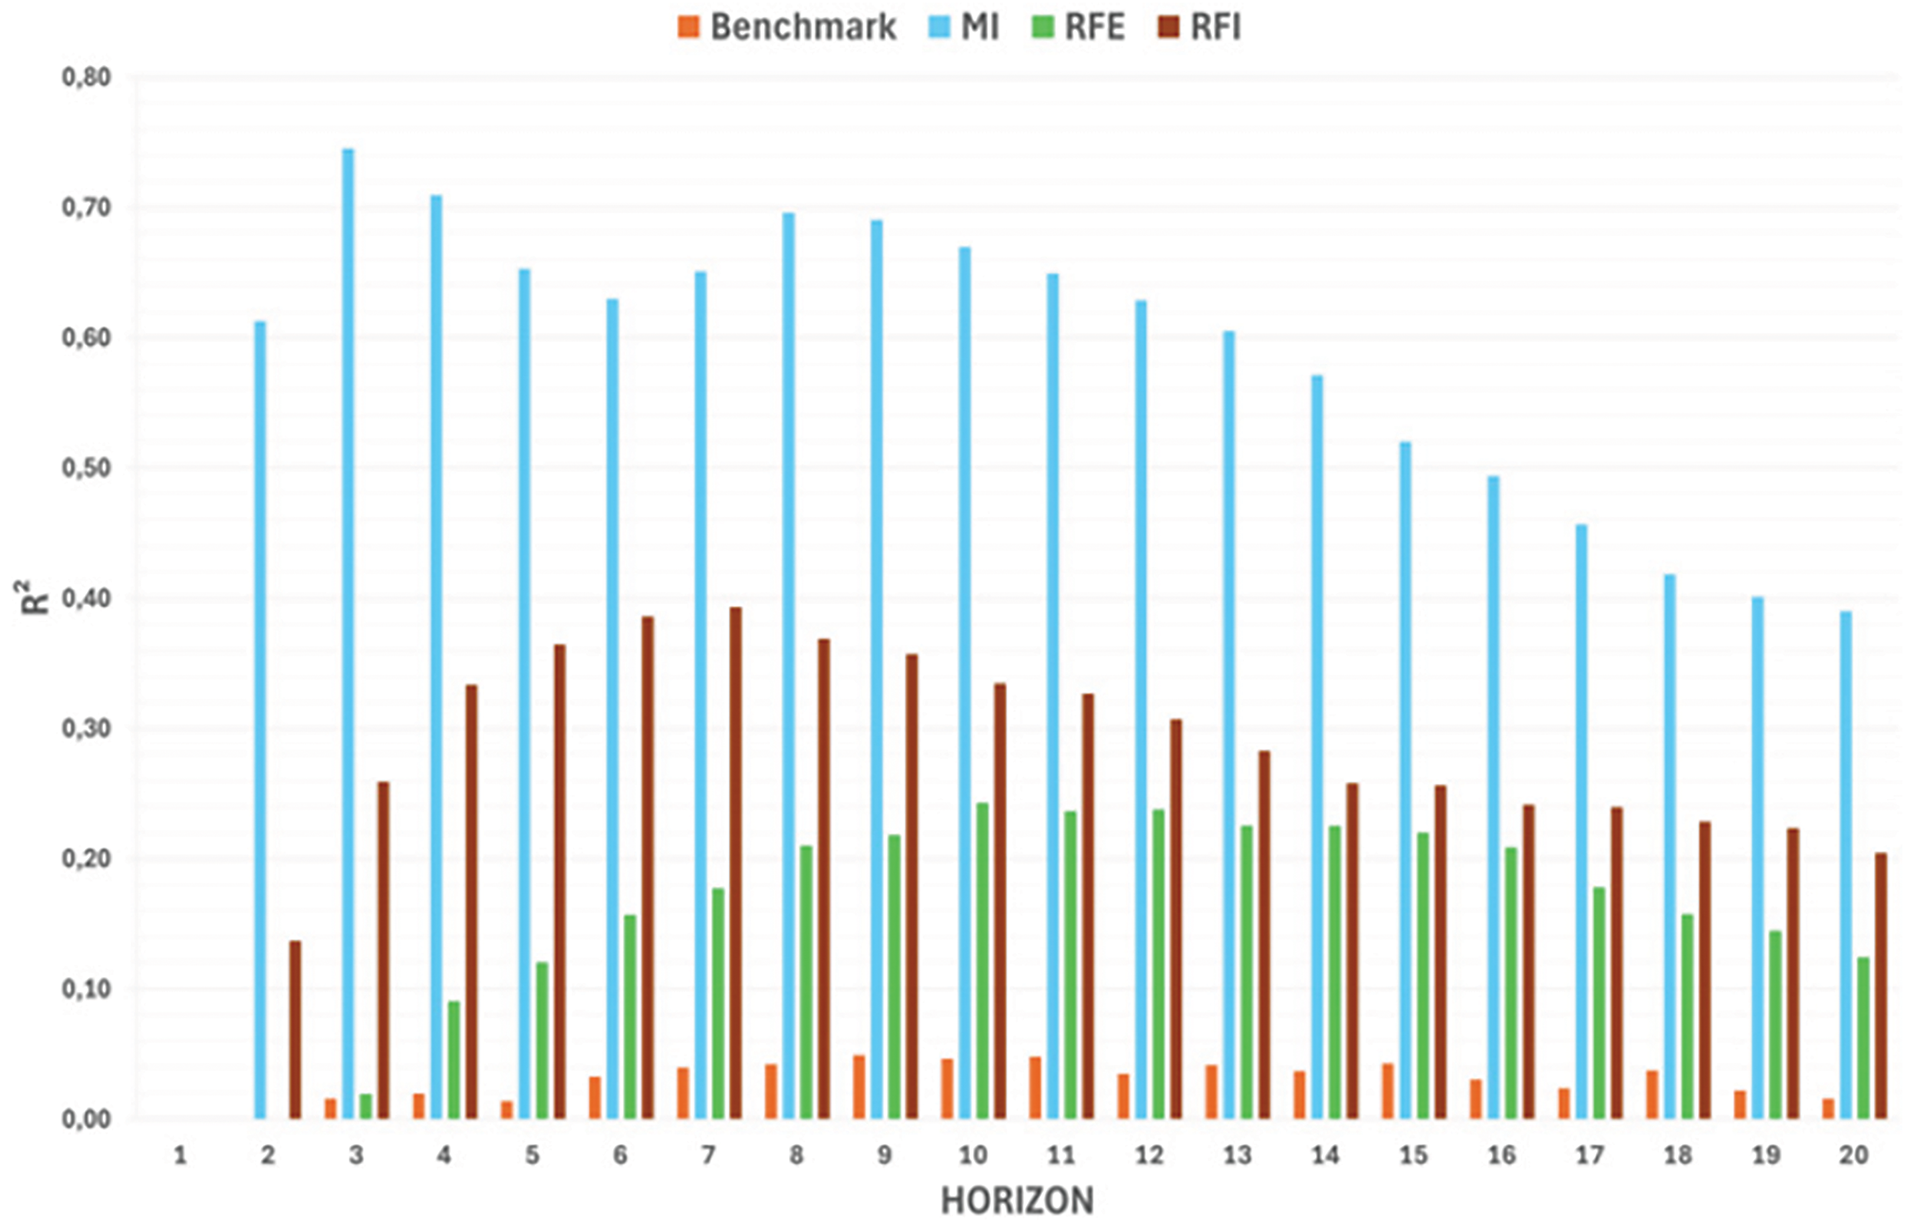
Figure 5: SVR model R2 results for BNB/USDT pair using different feature sets
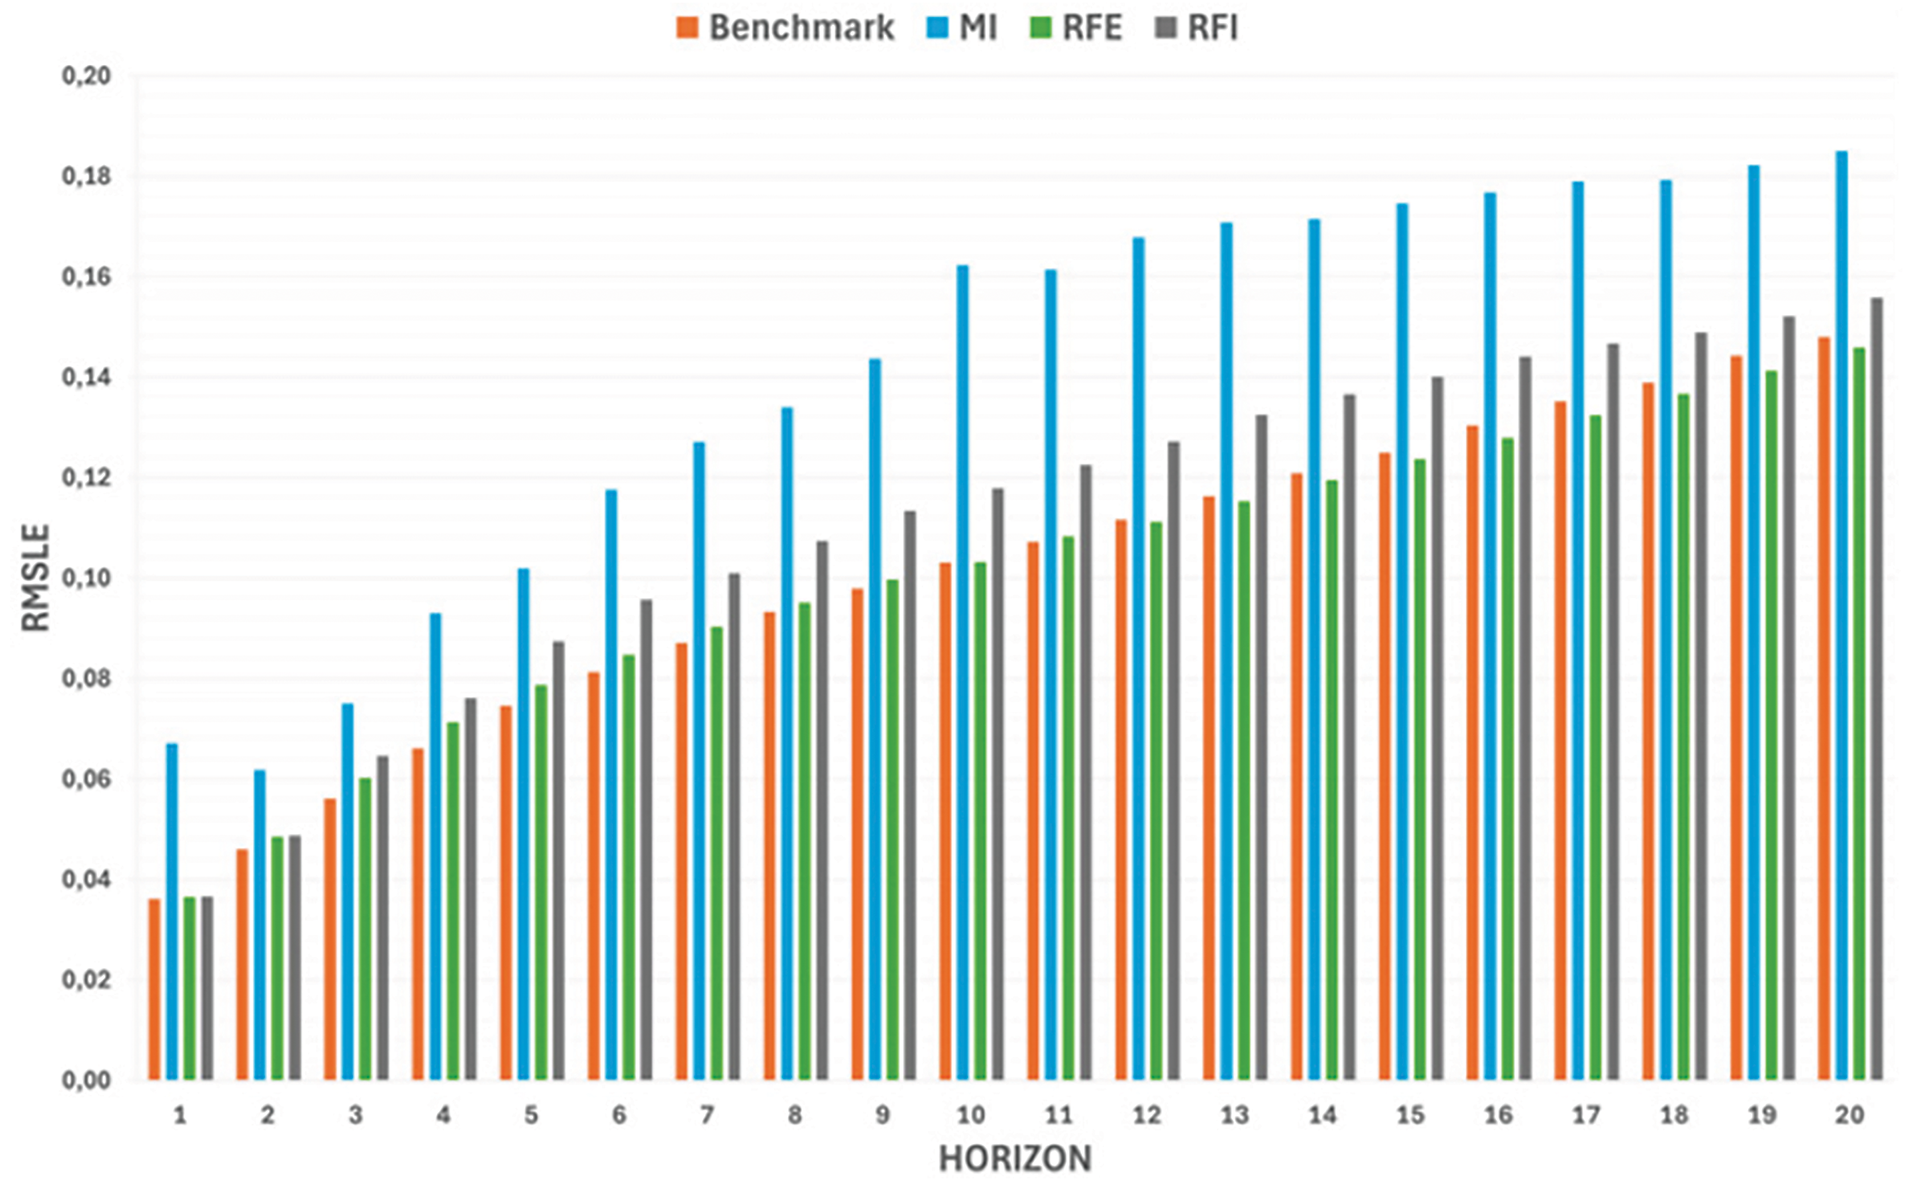
Figure 6: SVR model RMSLE results for BNB/USDT pair using different feature sets
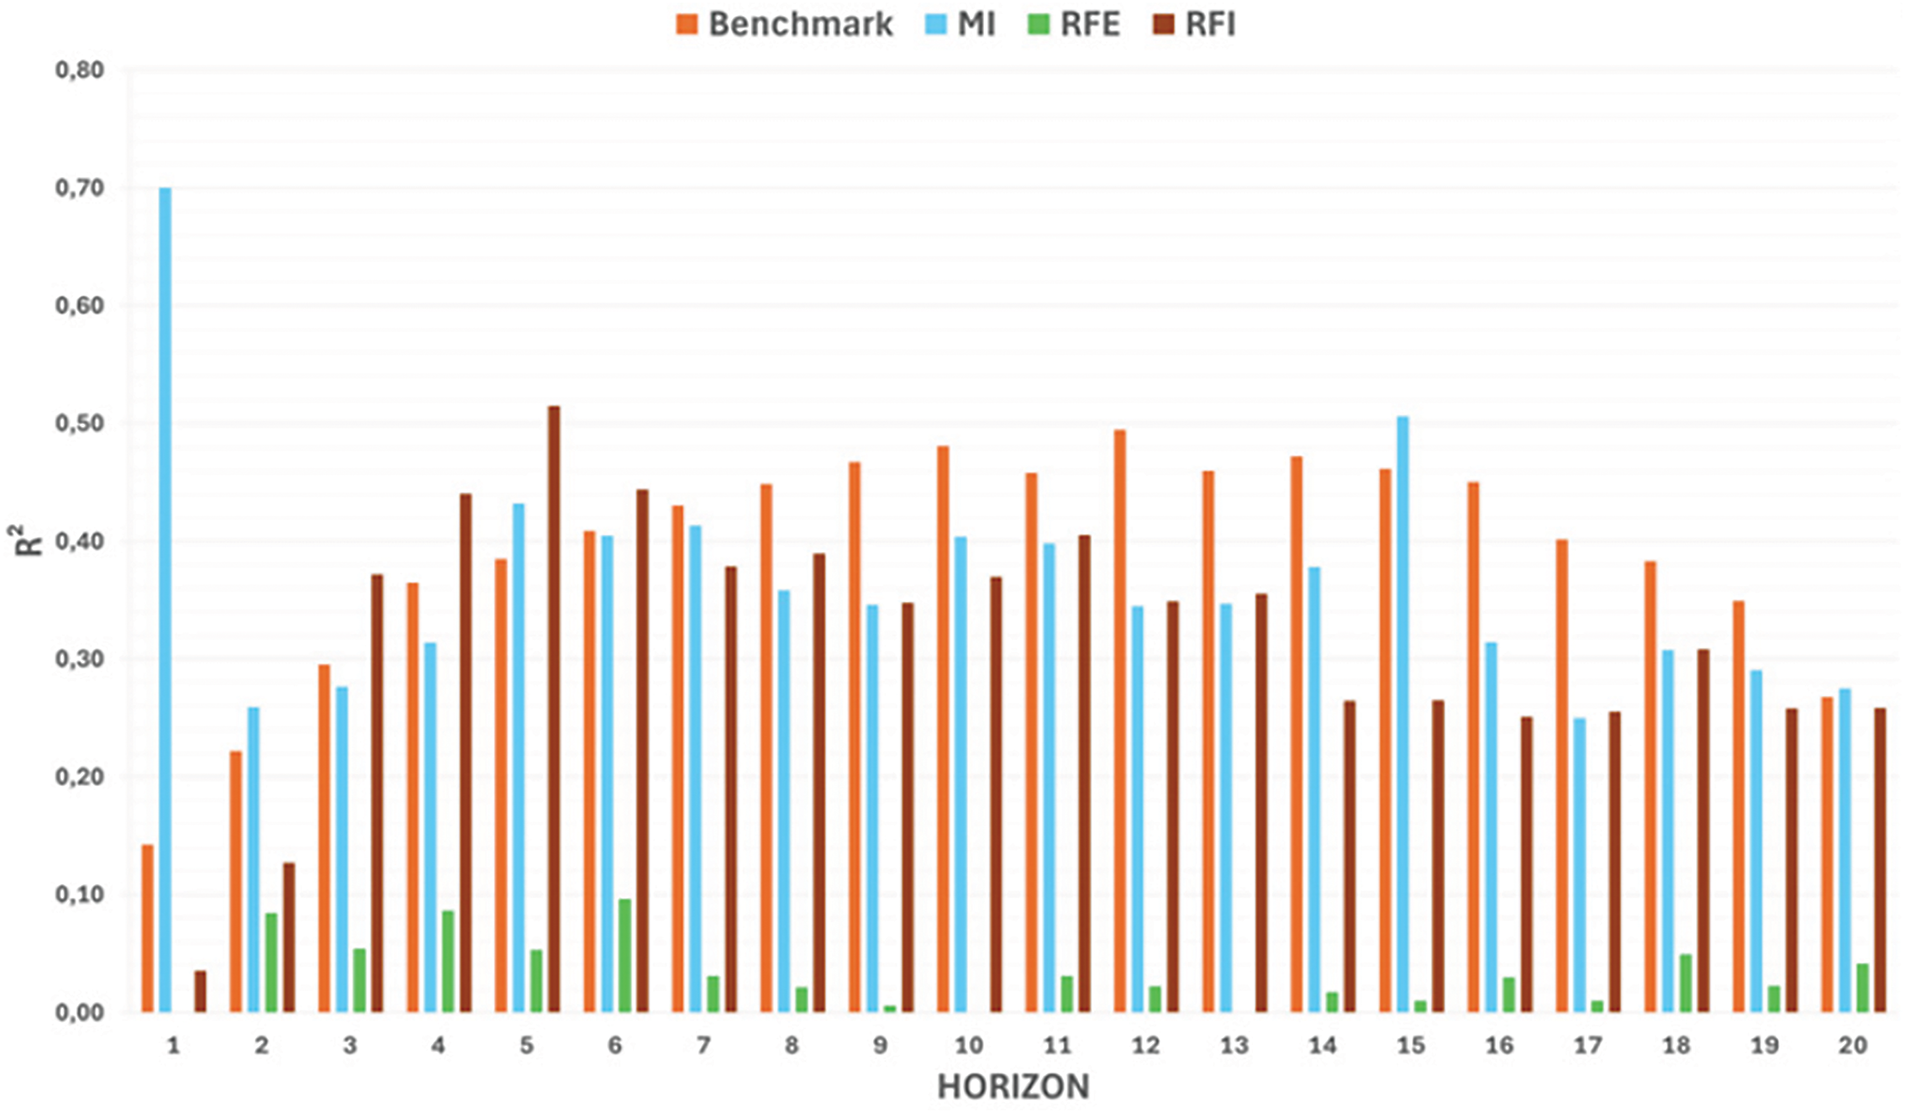
Figure 7: Huber model R2 results for BTC/USDT pair using different feature sets
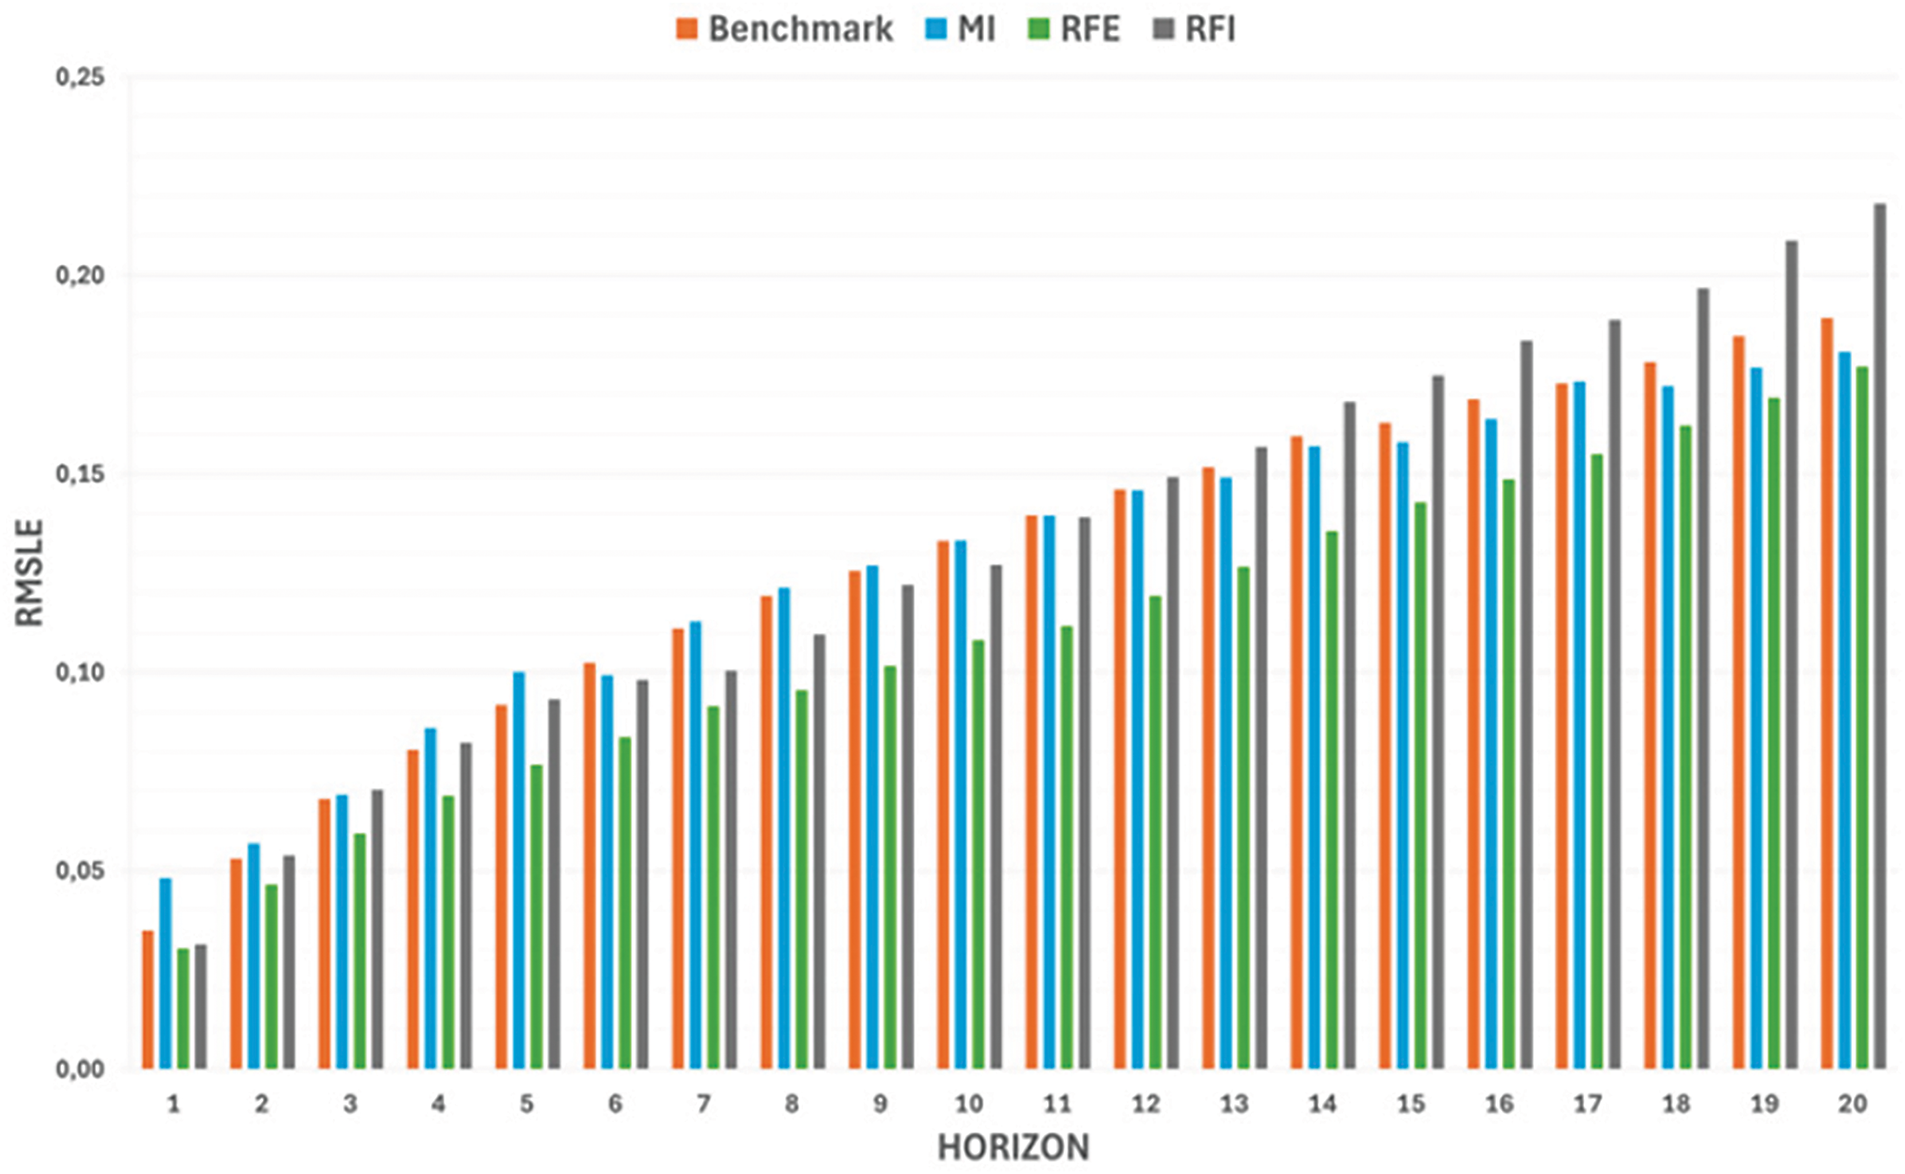
Figure 8: Huber model RMSLE results for BTC/USDT pair using different feature sets
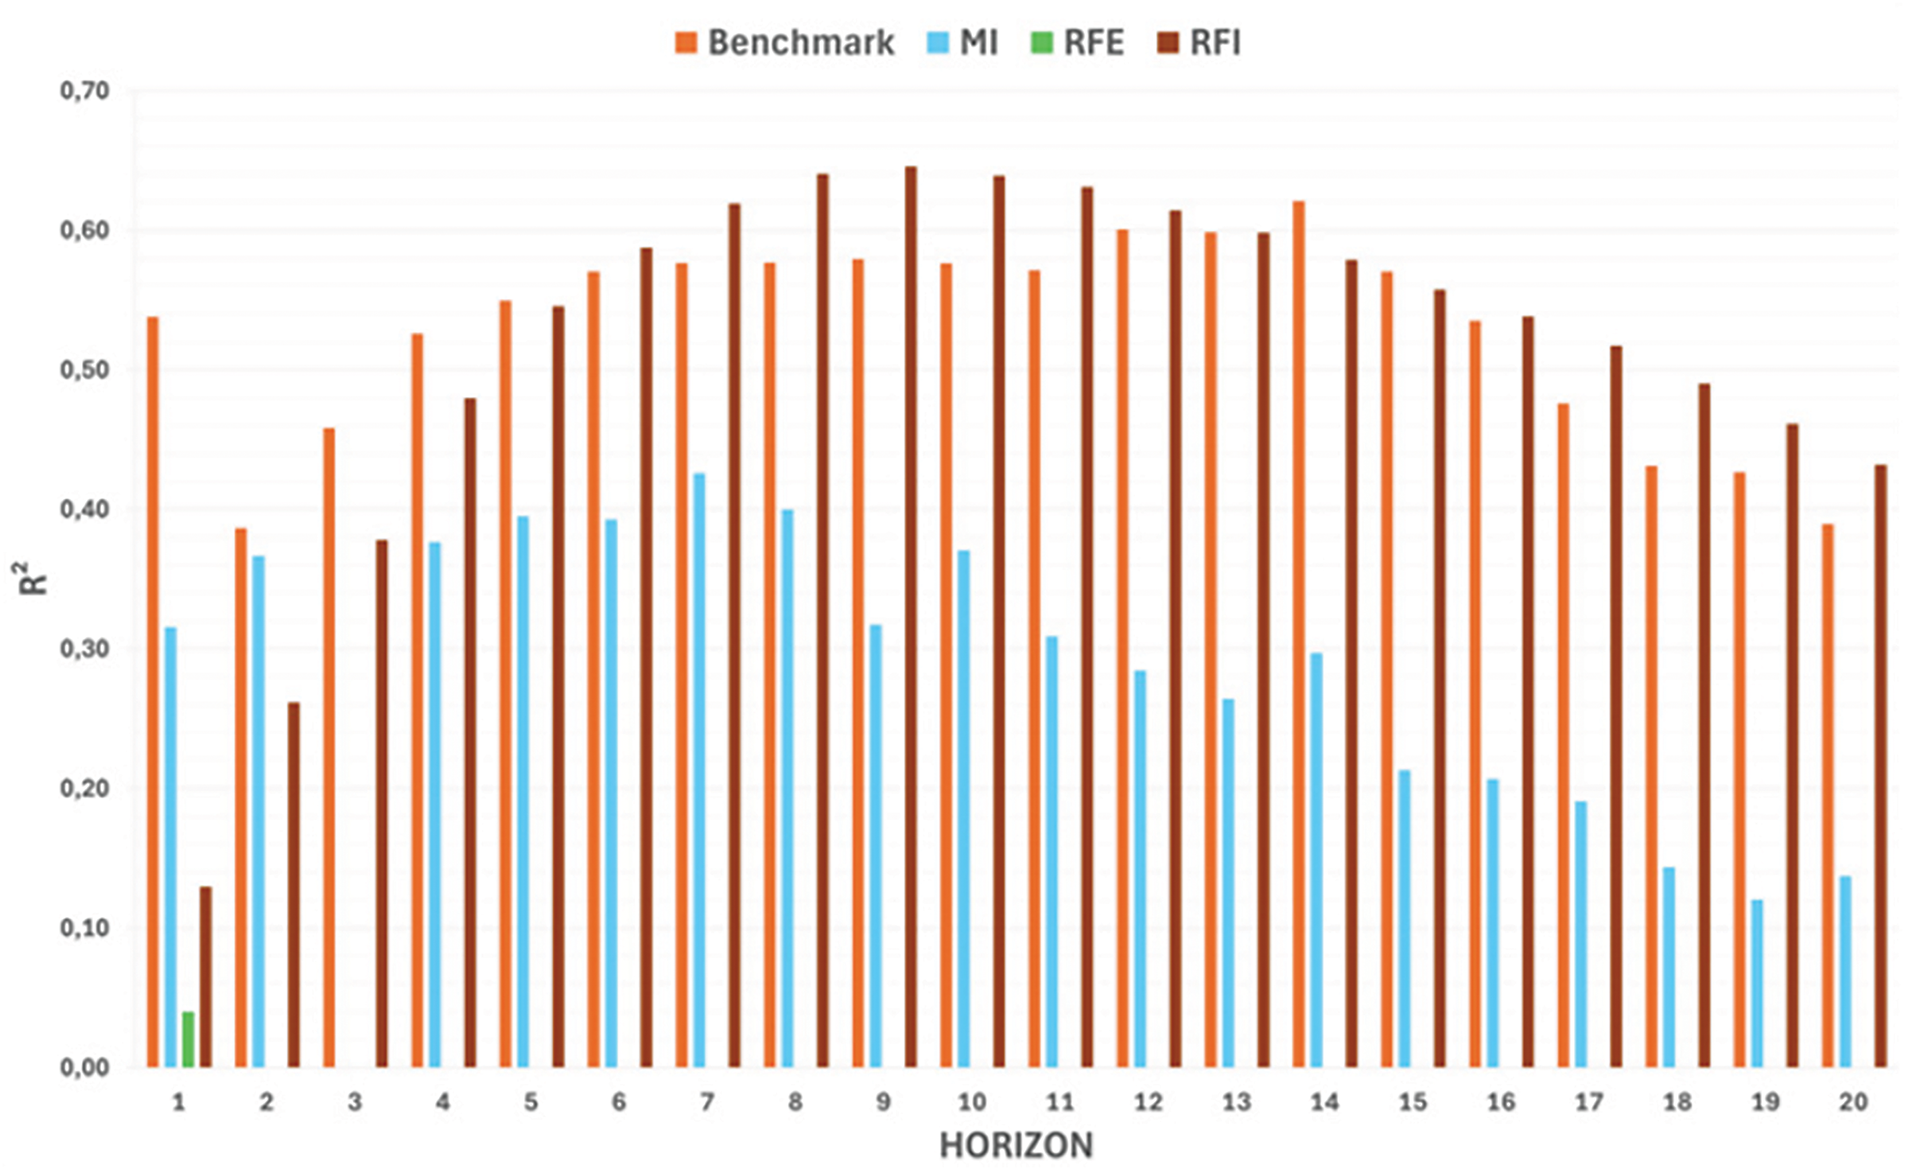
Figure 9: Huber model R2 results for ETH/USDT pair using different feature sets
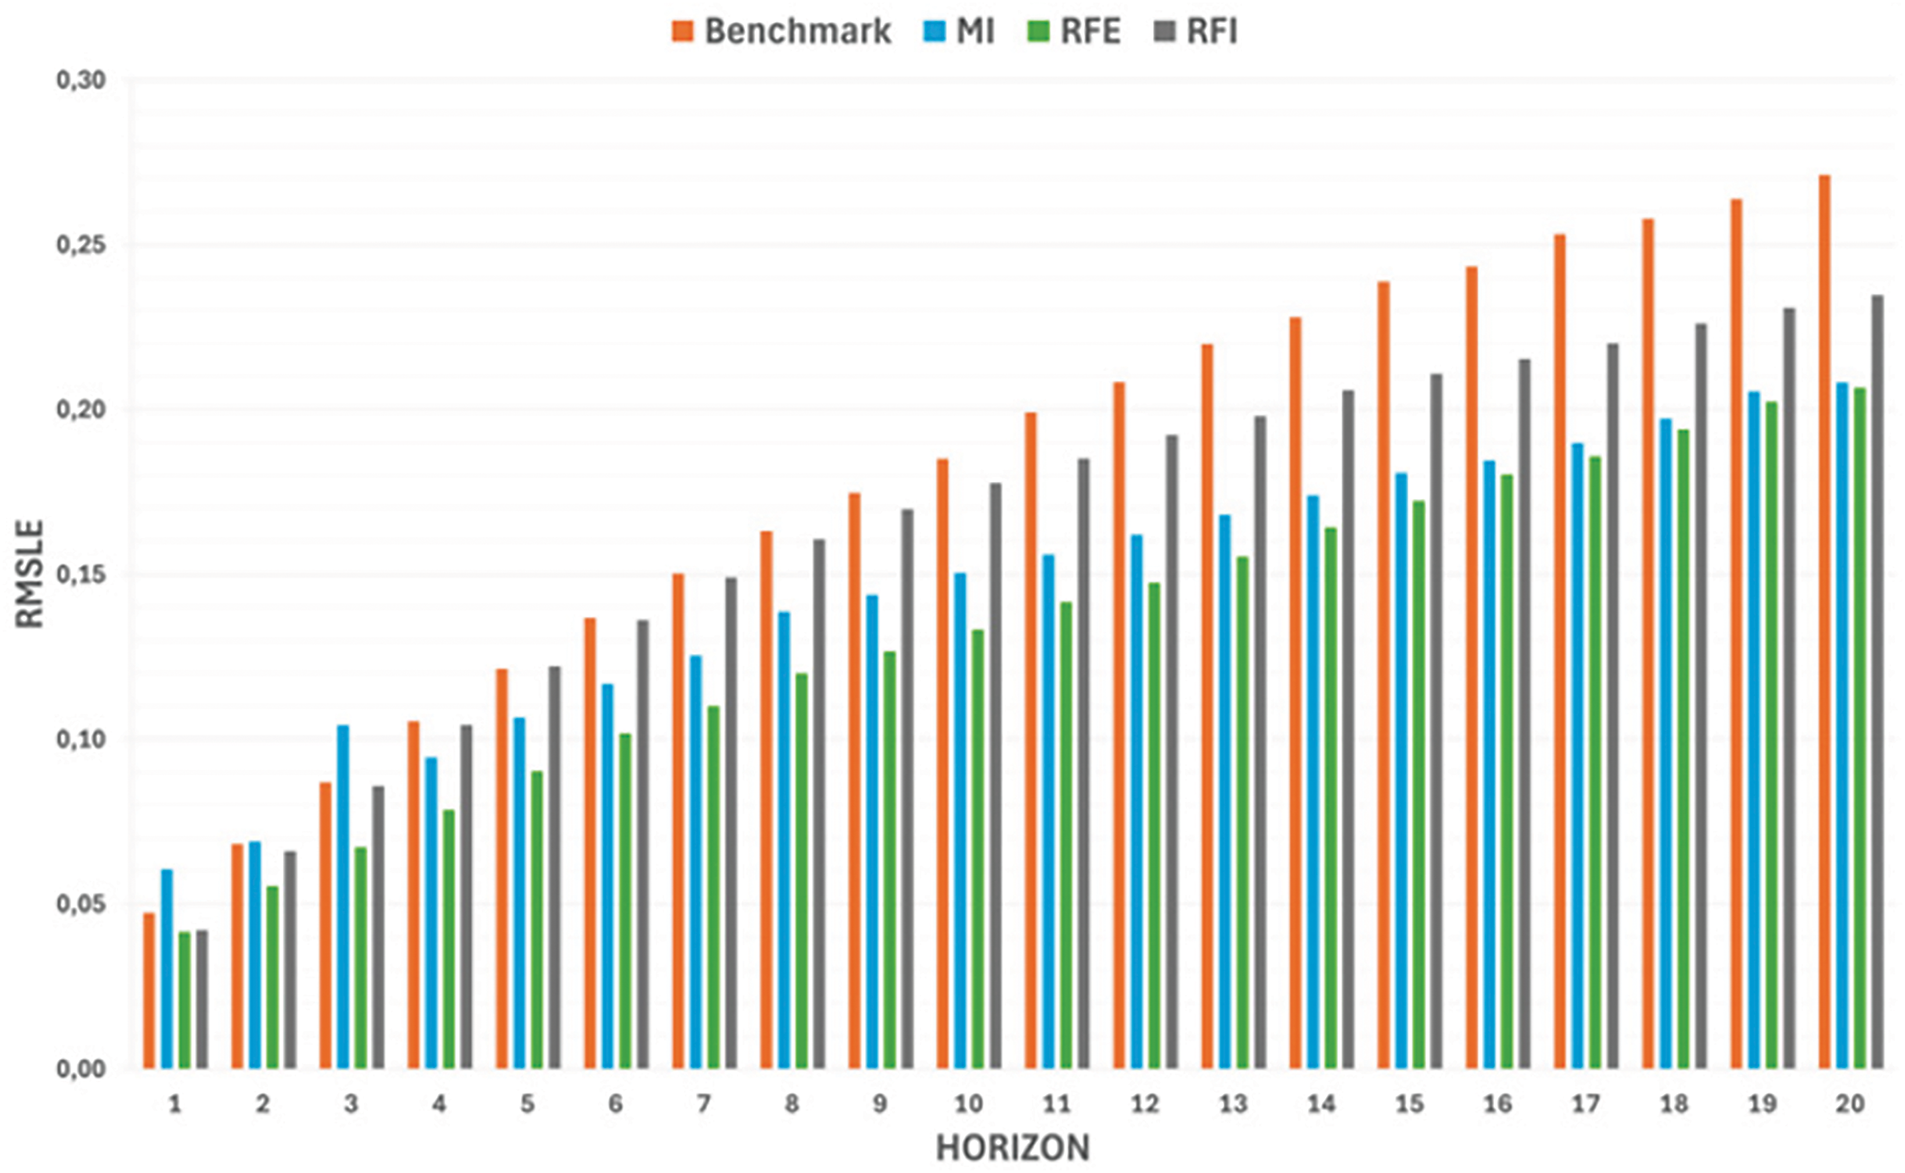
Figure 10: Huber model RMSLE results for ETH/USDT pair using different feature sets
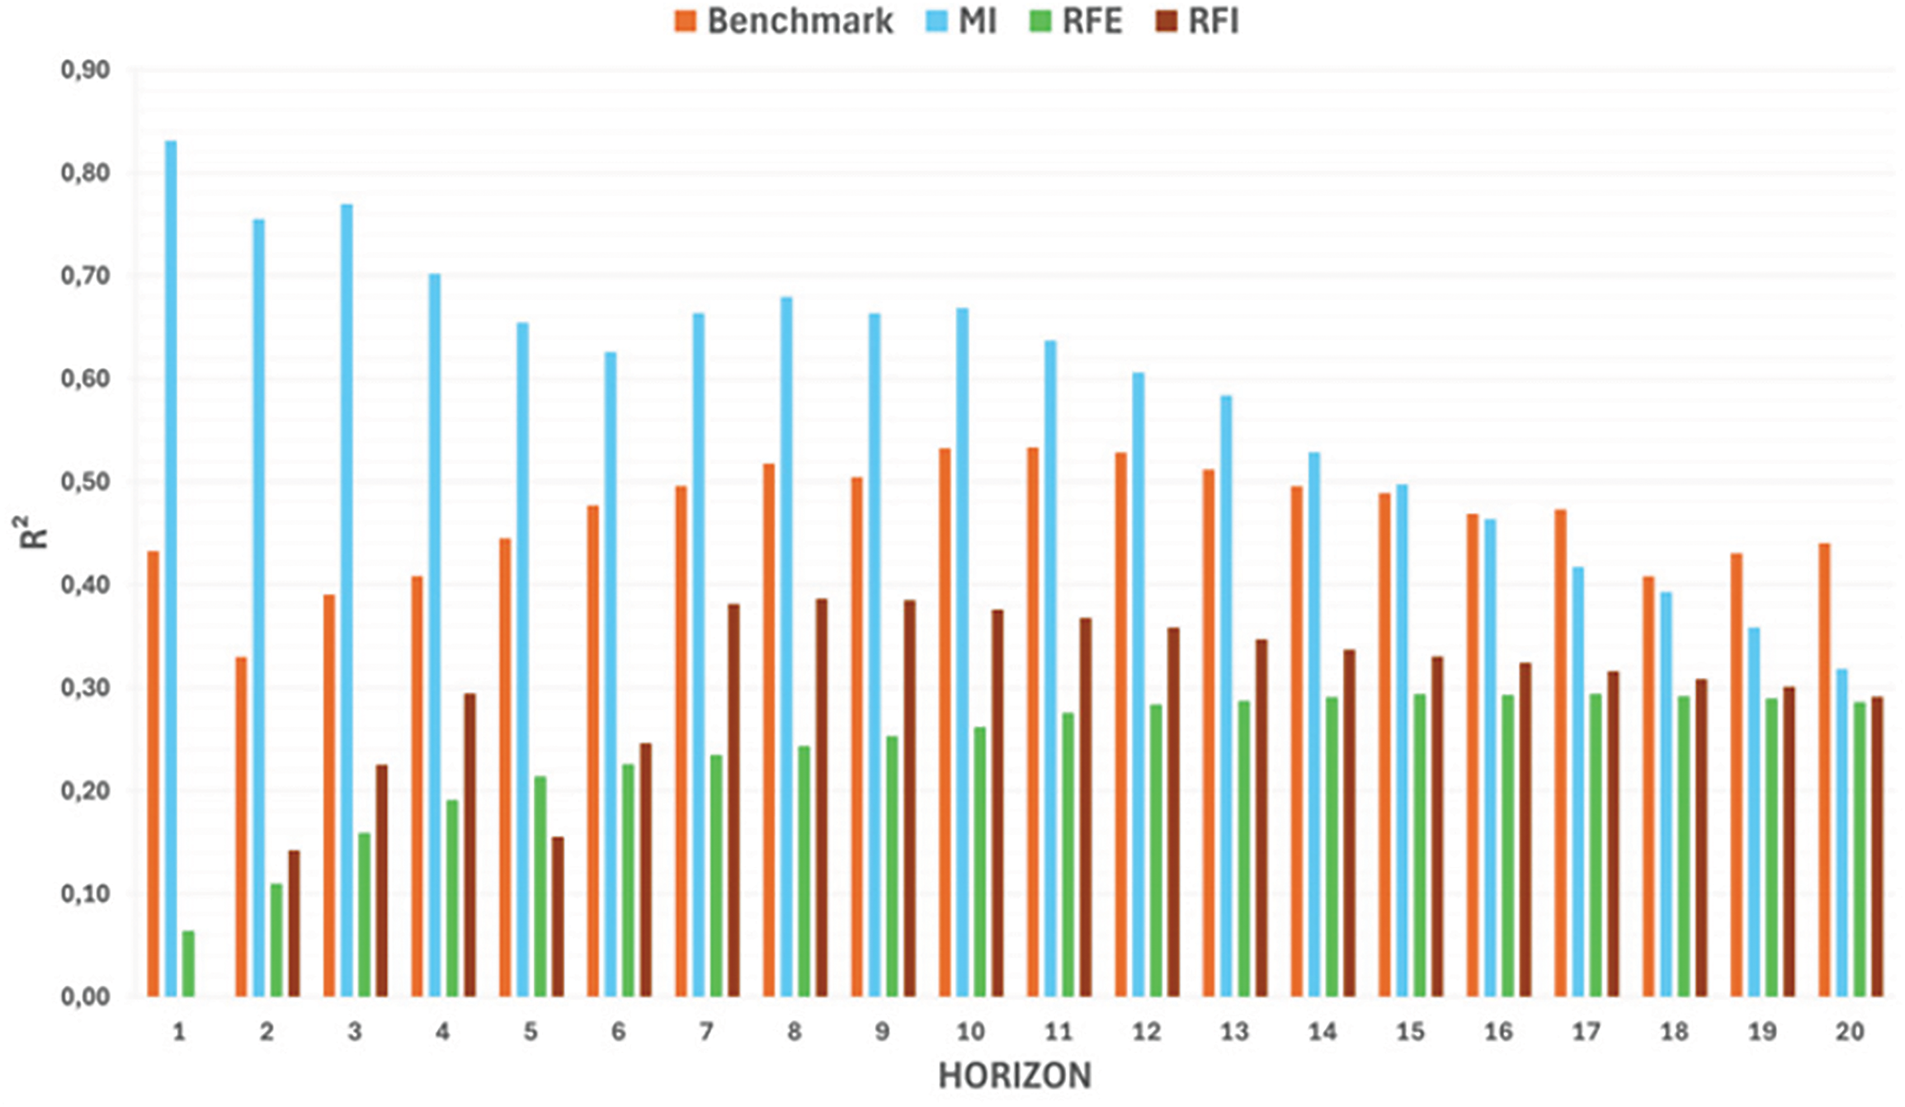
Figure 11: Huber model R2 results for BNB/USDT pair using different feature sets
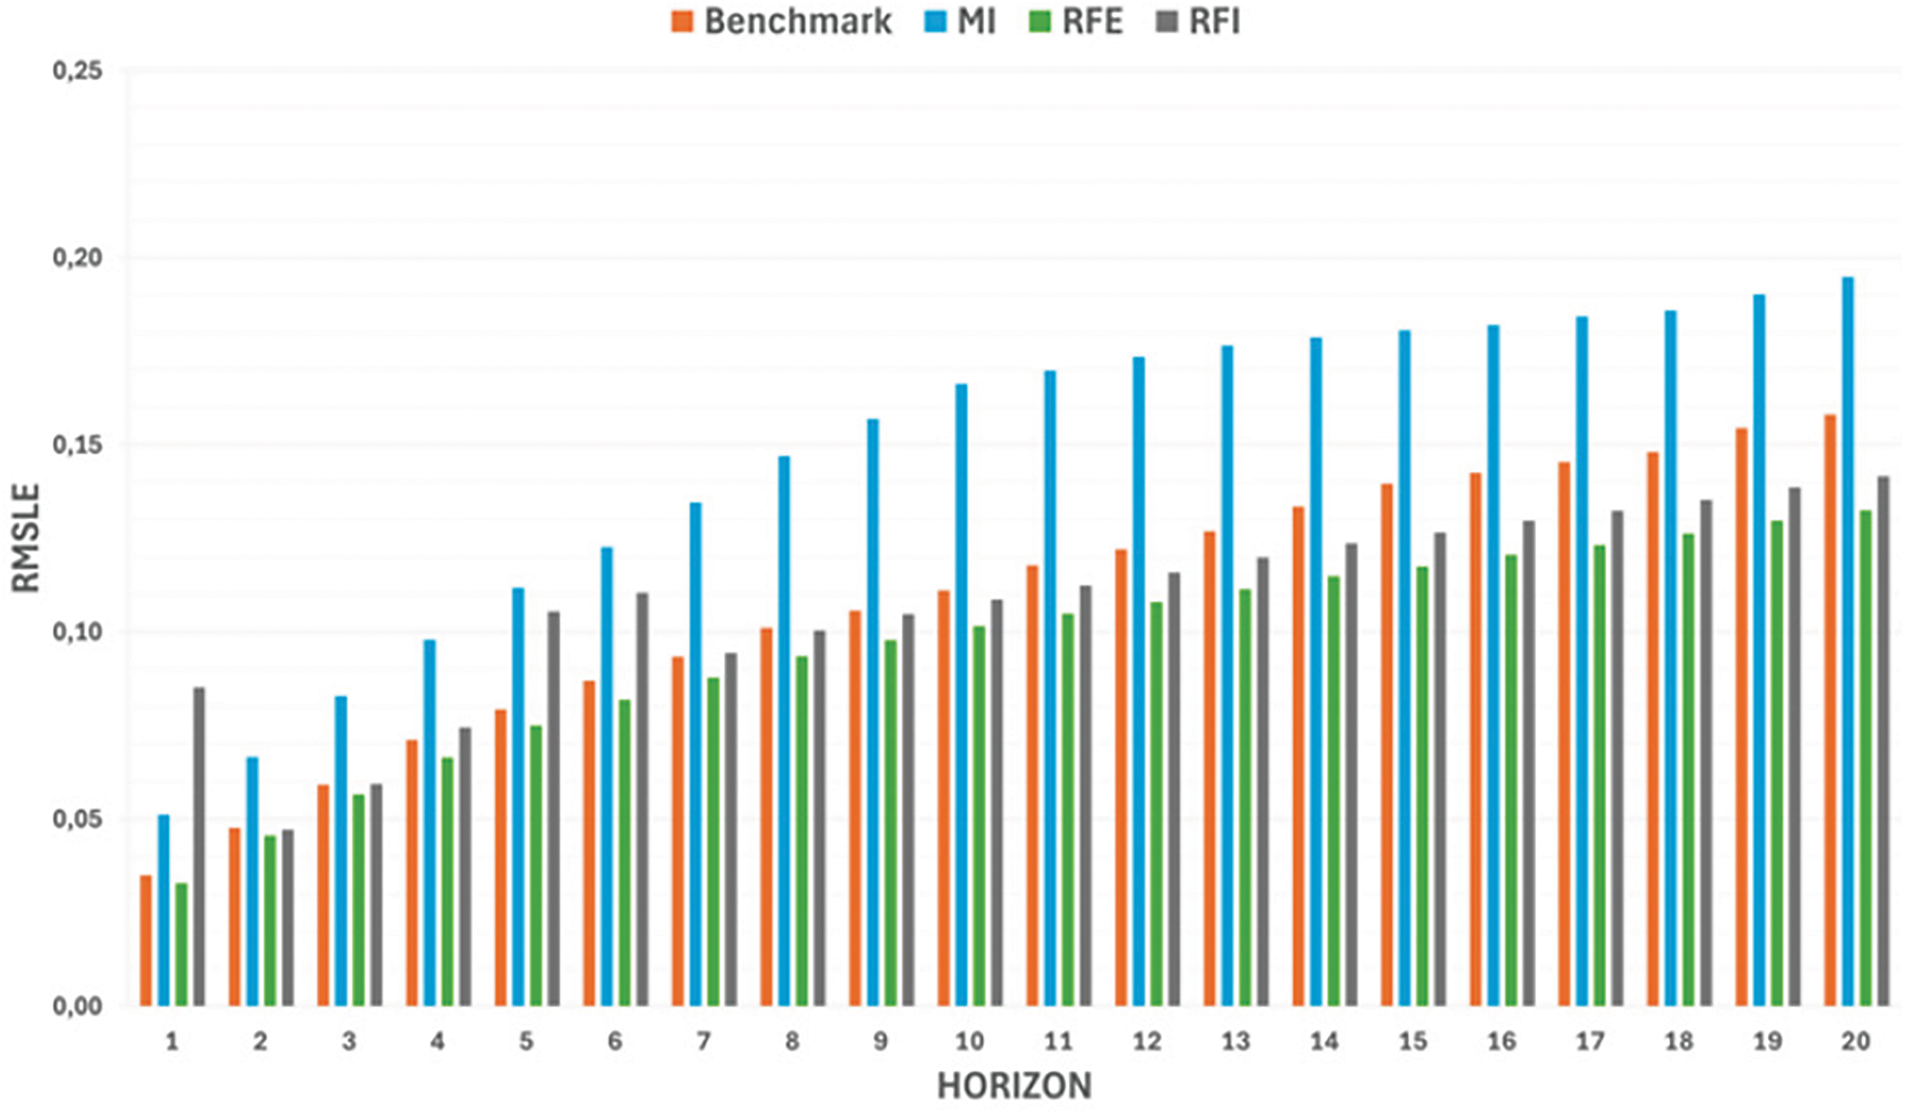
Figure 12: Huber model RMSLE results for BNB/USDT pair using different feature sets
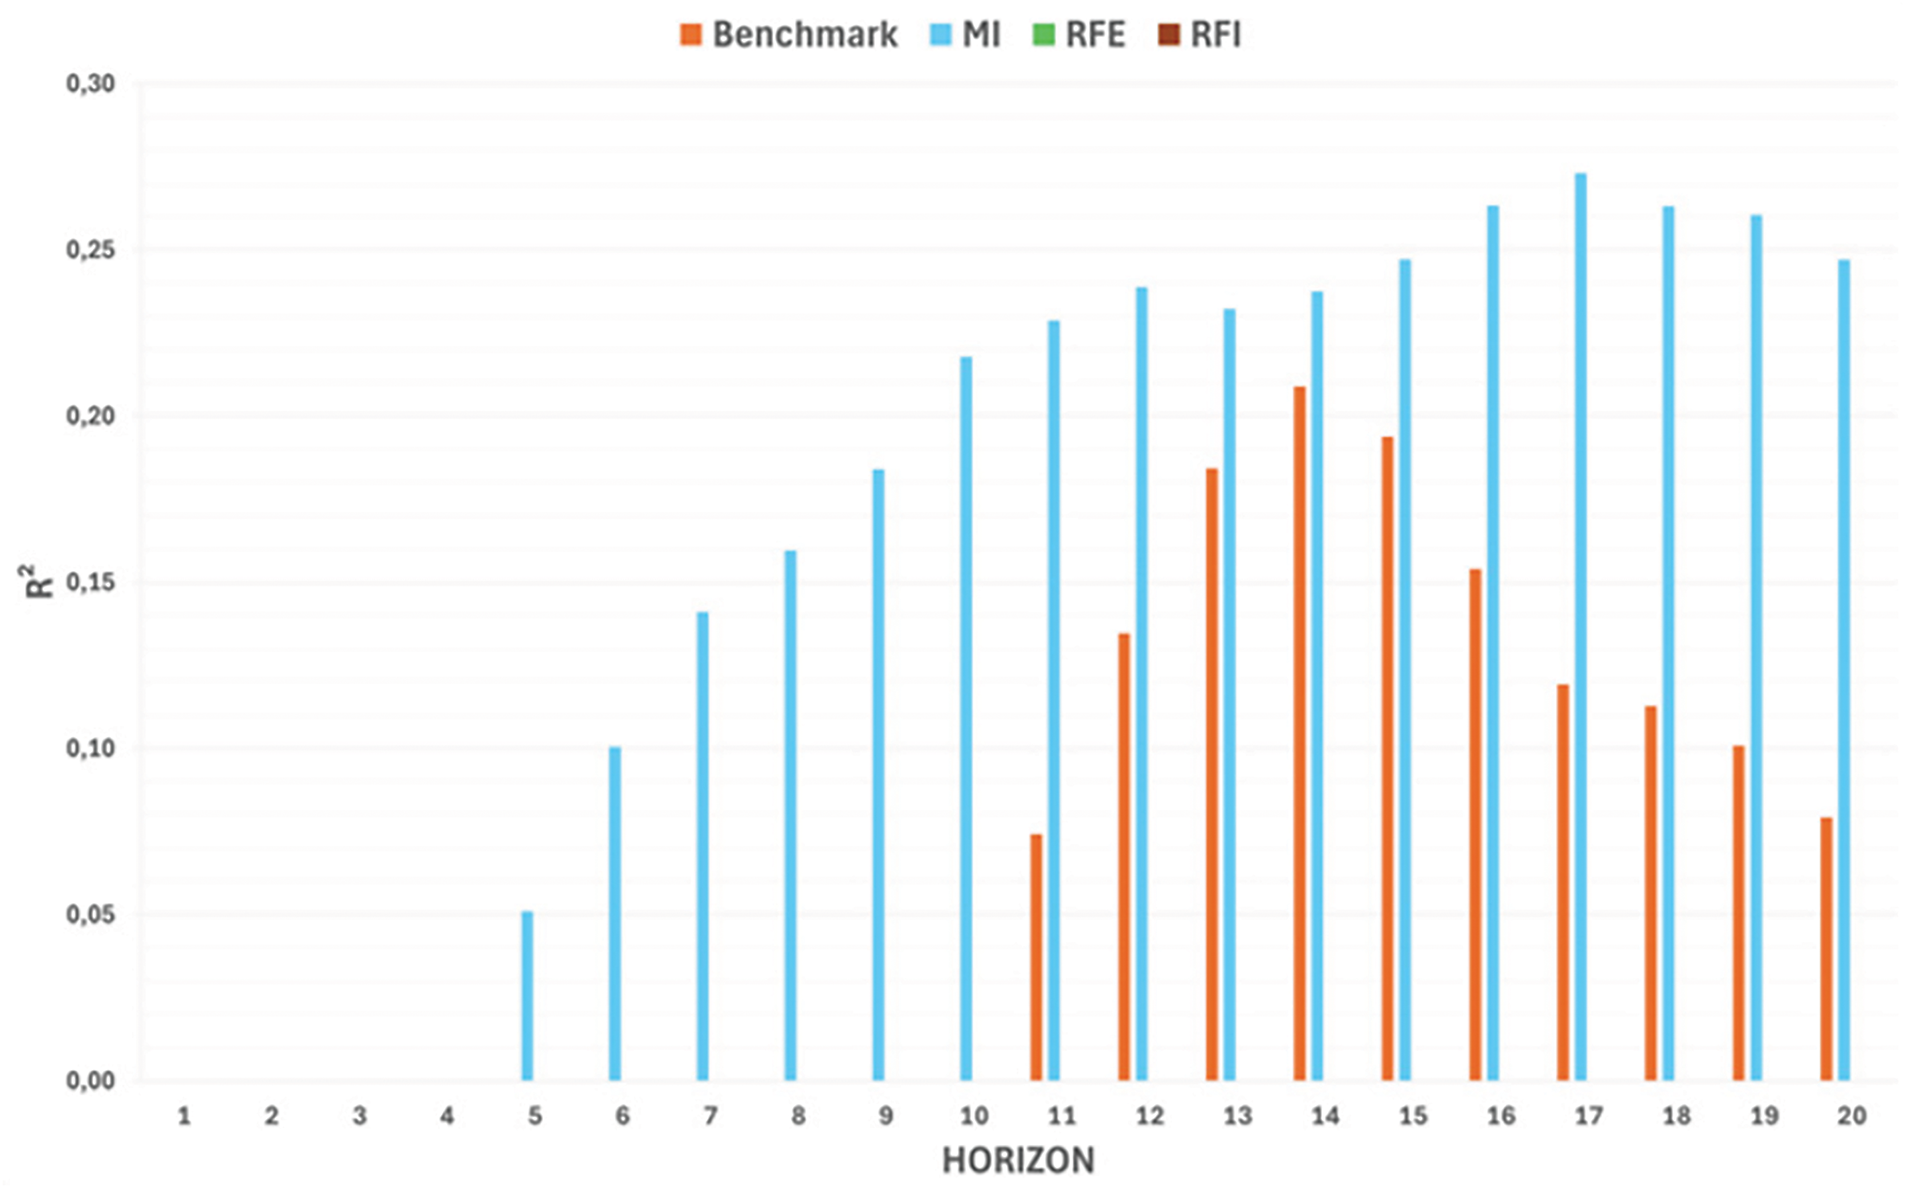
Figure 13: KNN model R2 results for BTC/USDT pair using different feature sets
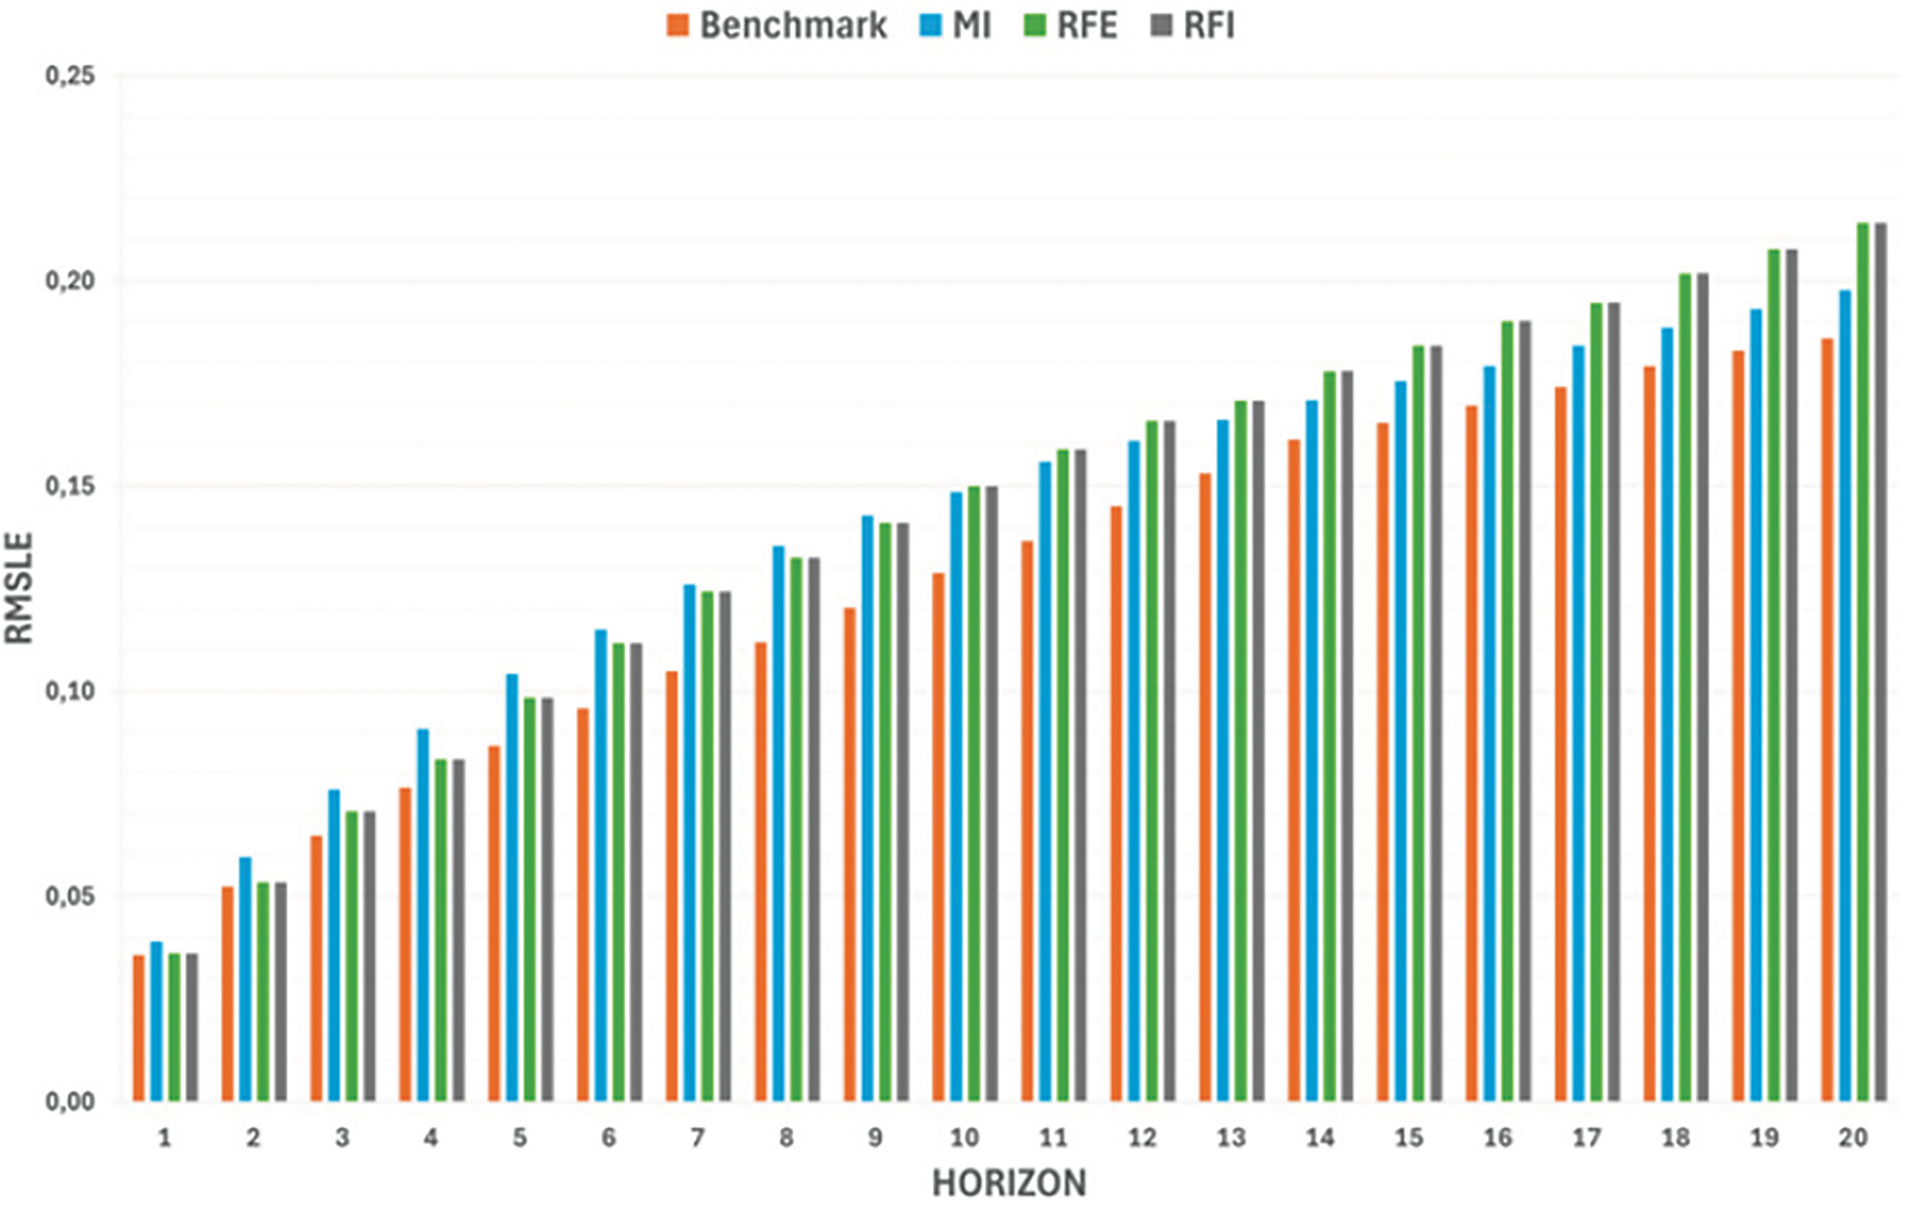
Figure 14: KNN model RMSLE results for BTC/USDT pair using different feature sets
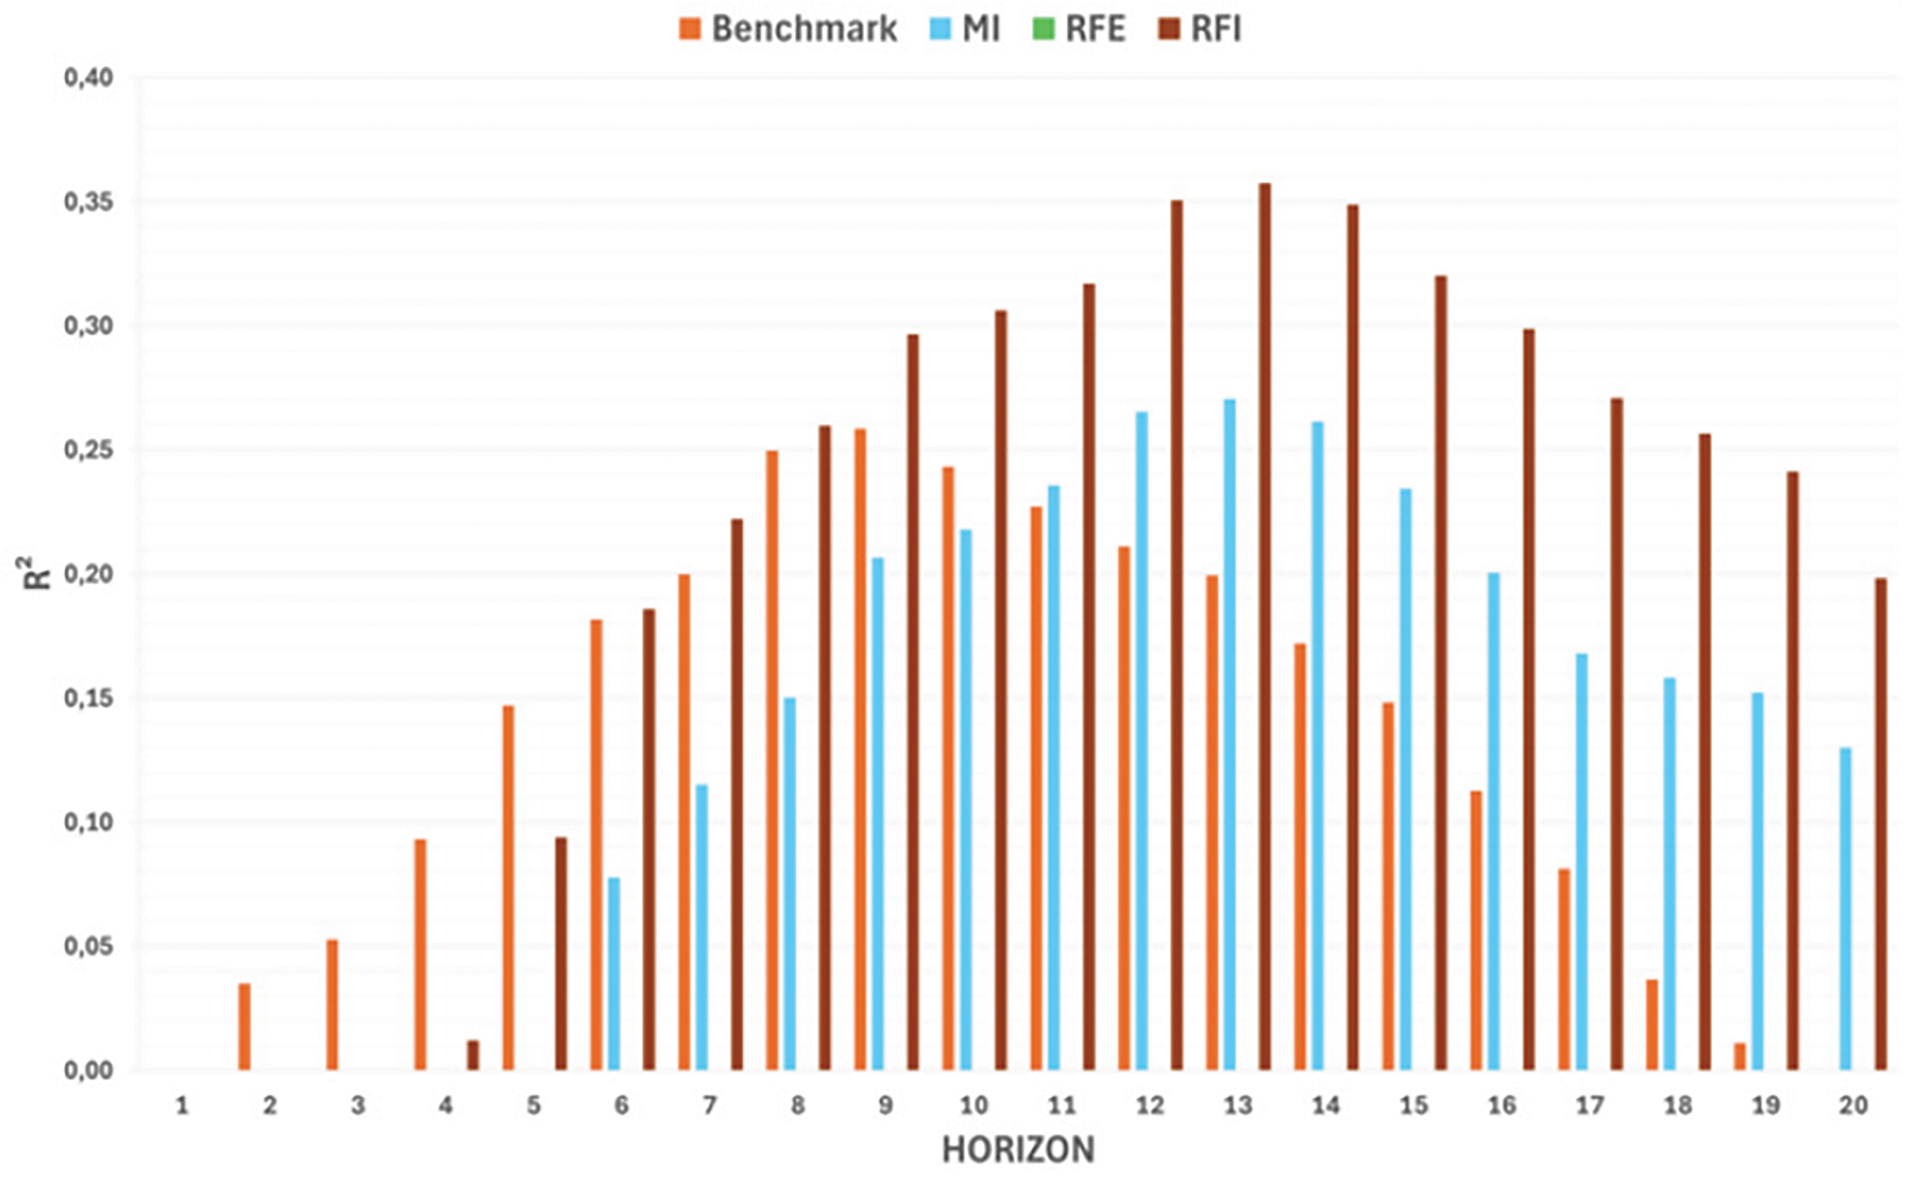
Figure 15: KNN model R2 results for ETH/USDT pair using different feature sets
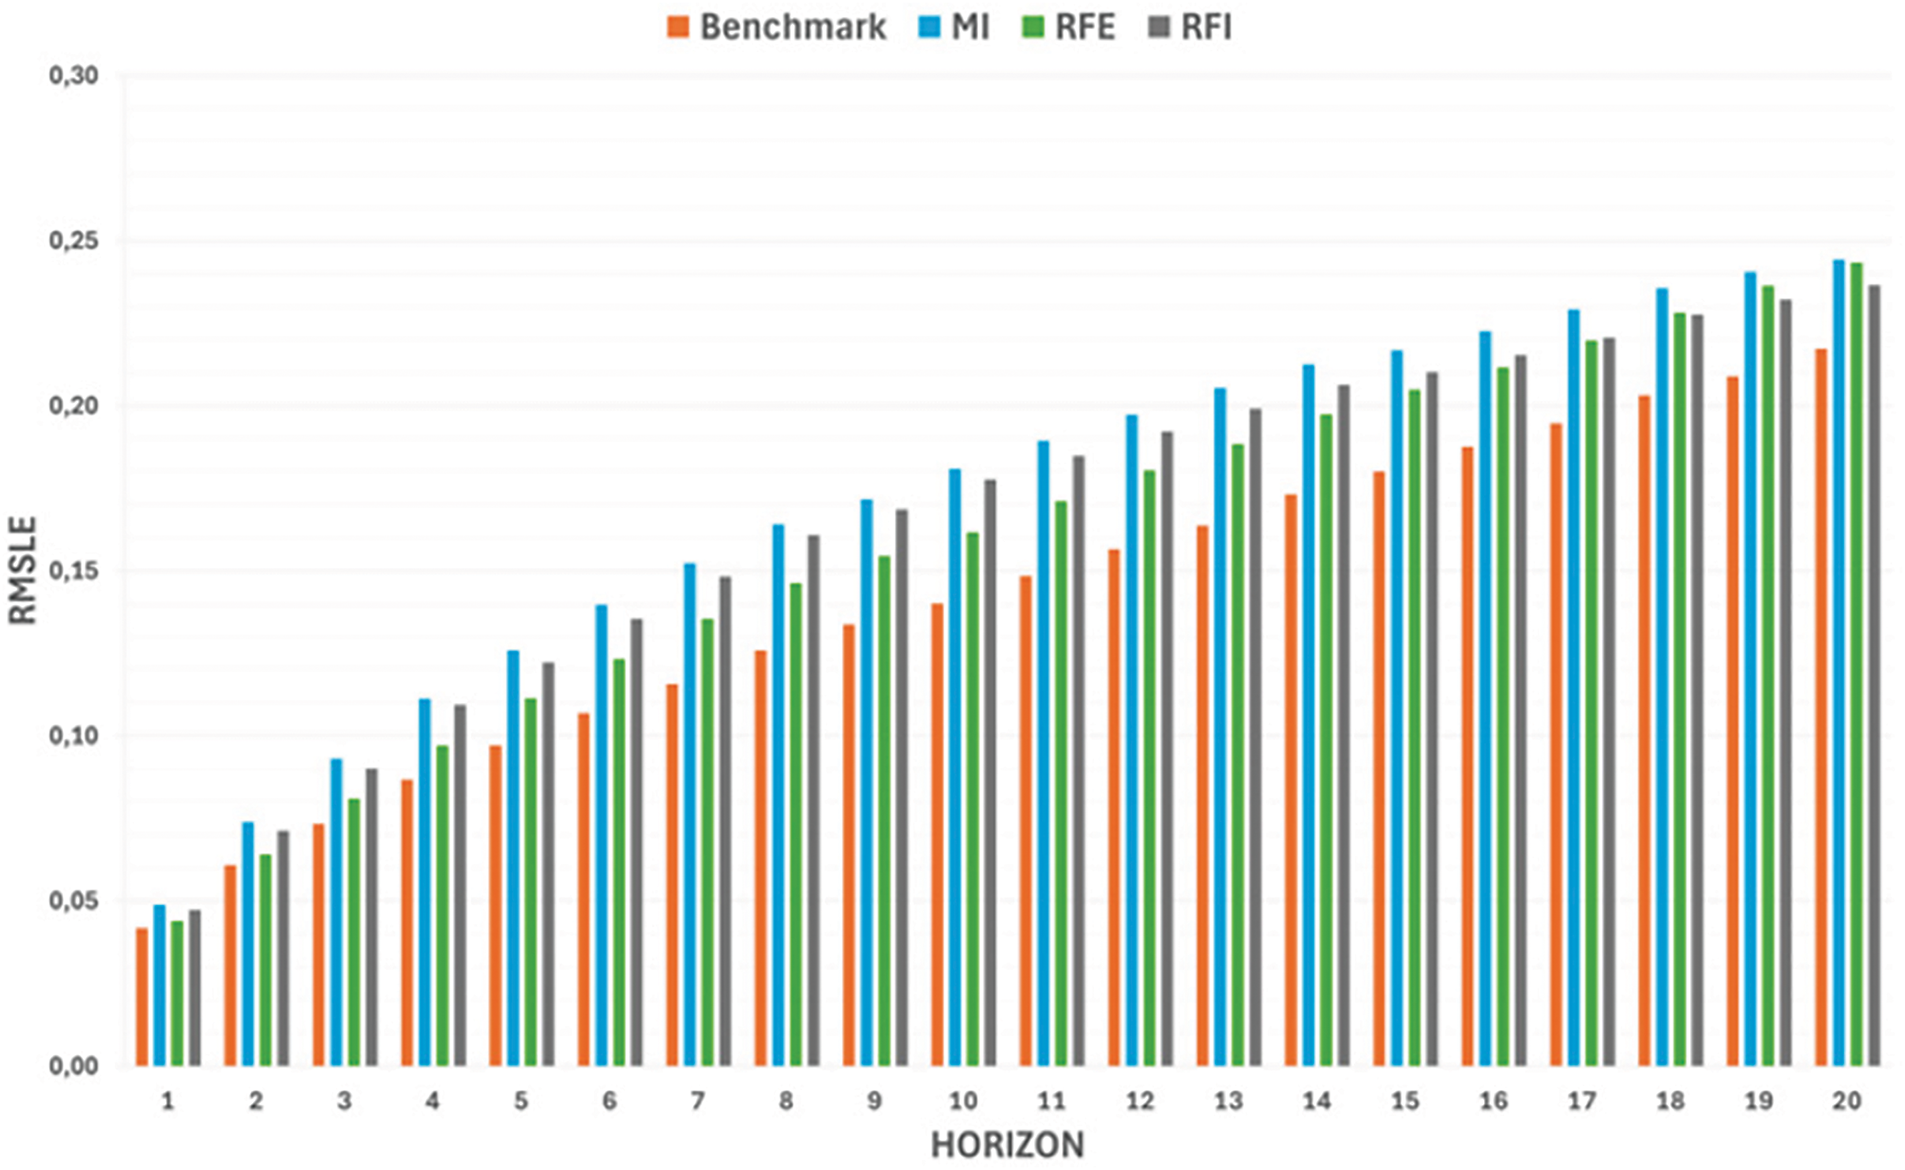
Figure 16: KNN model RMSLE results for ETH/USDT pair using different feature sets
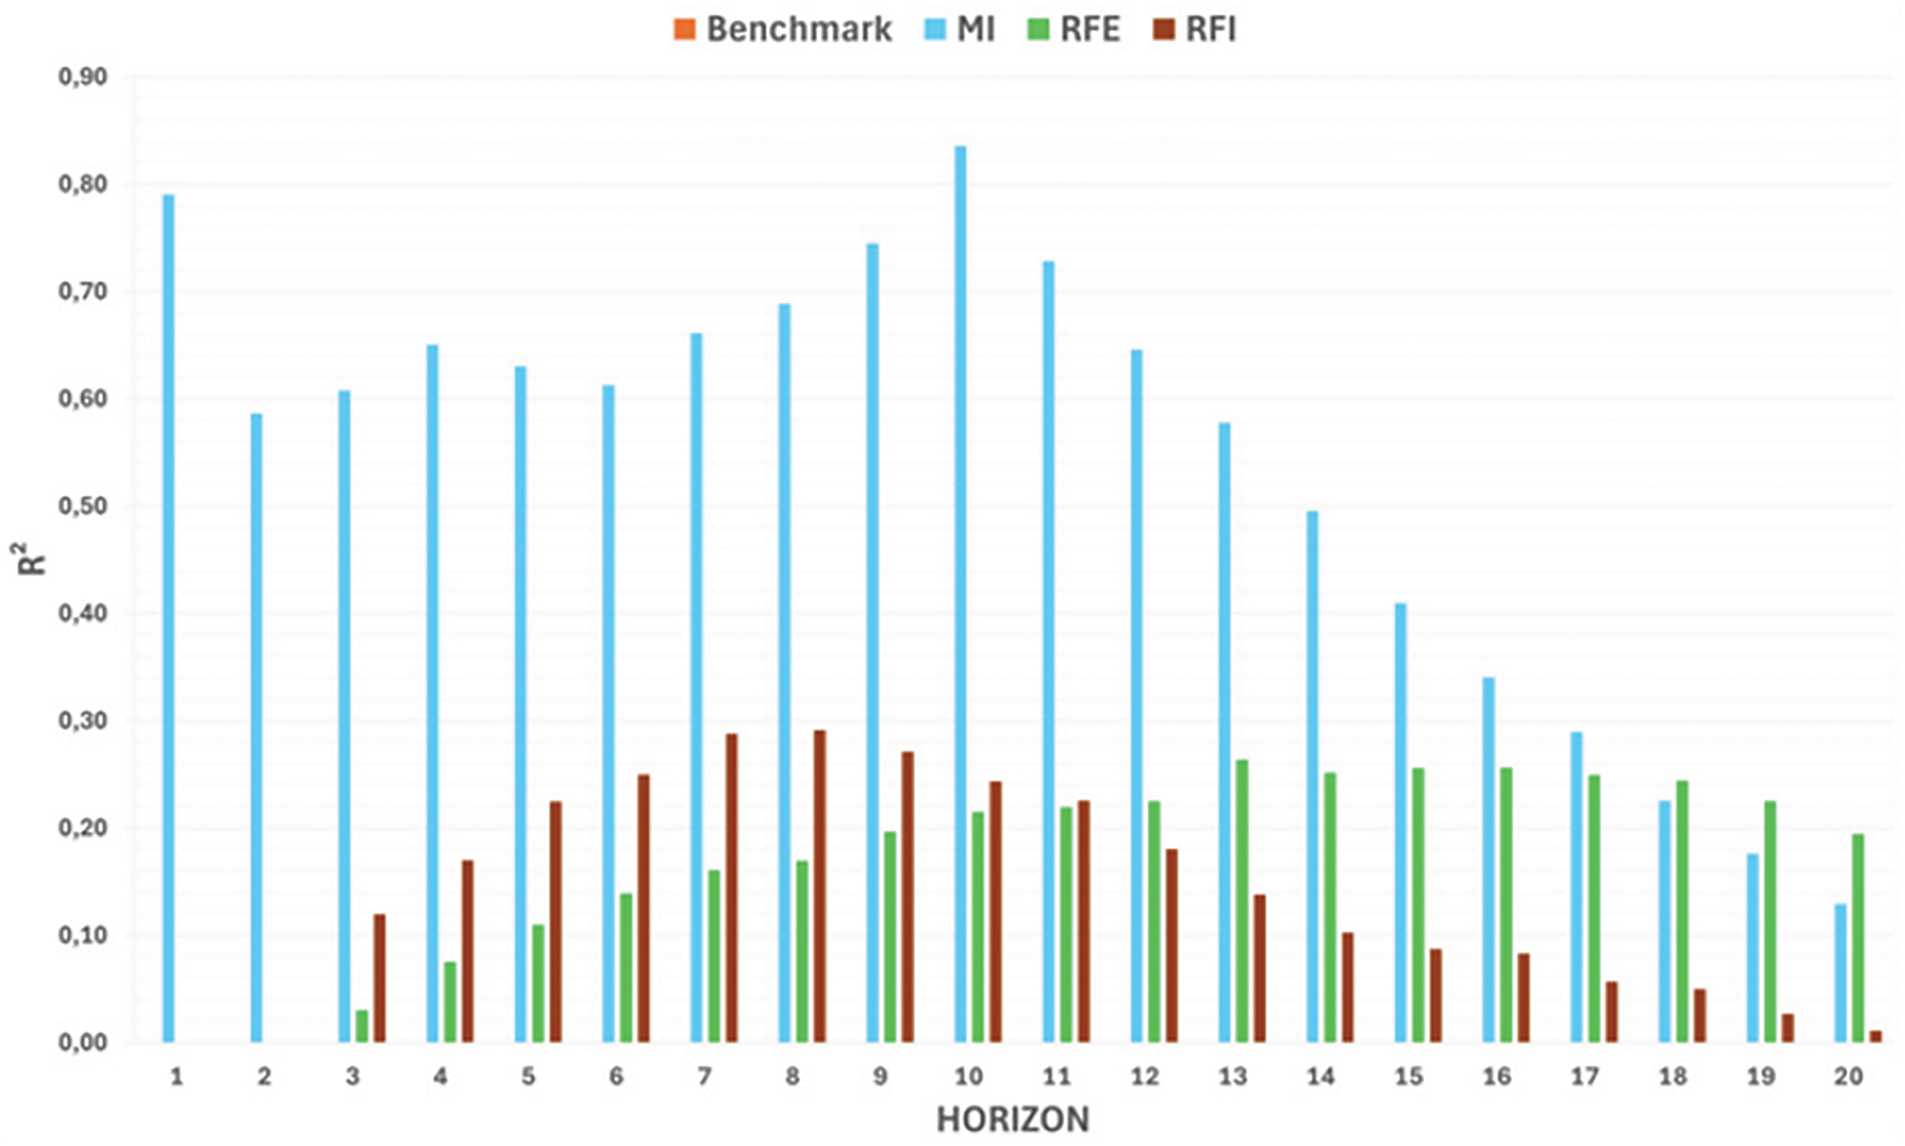
Figure 17: KNN model R2 results for BNB/USDT pair using different feature sets
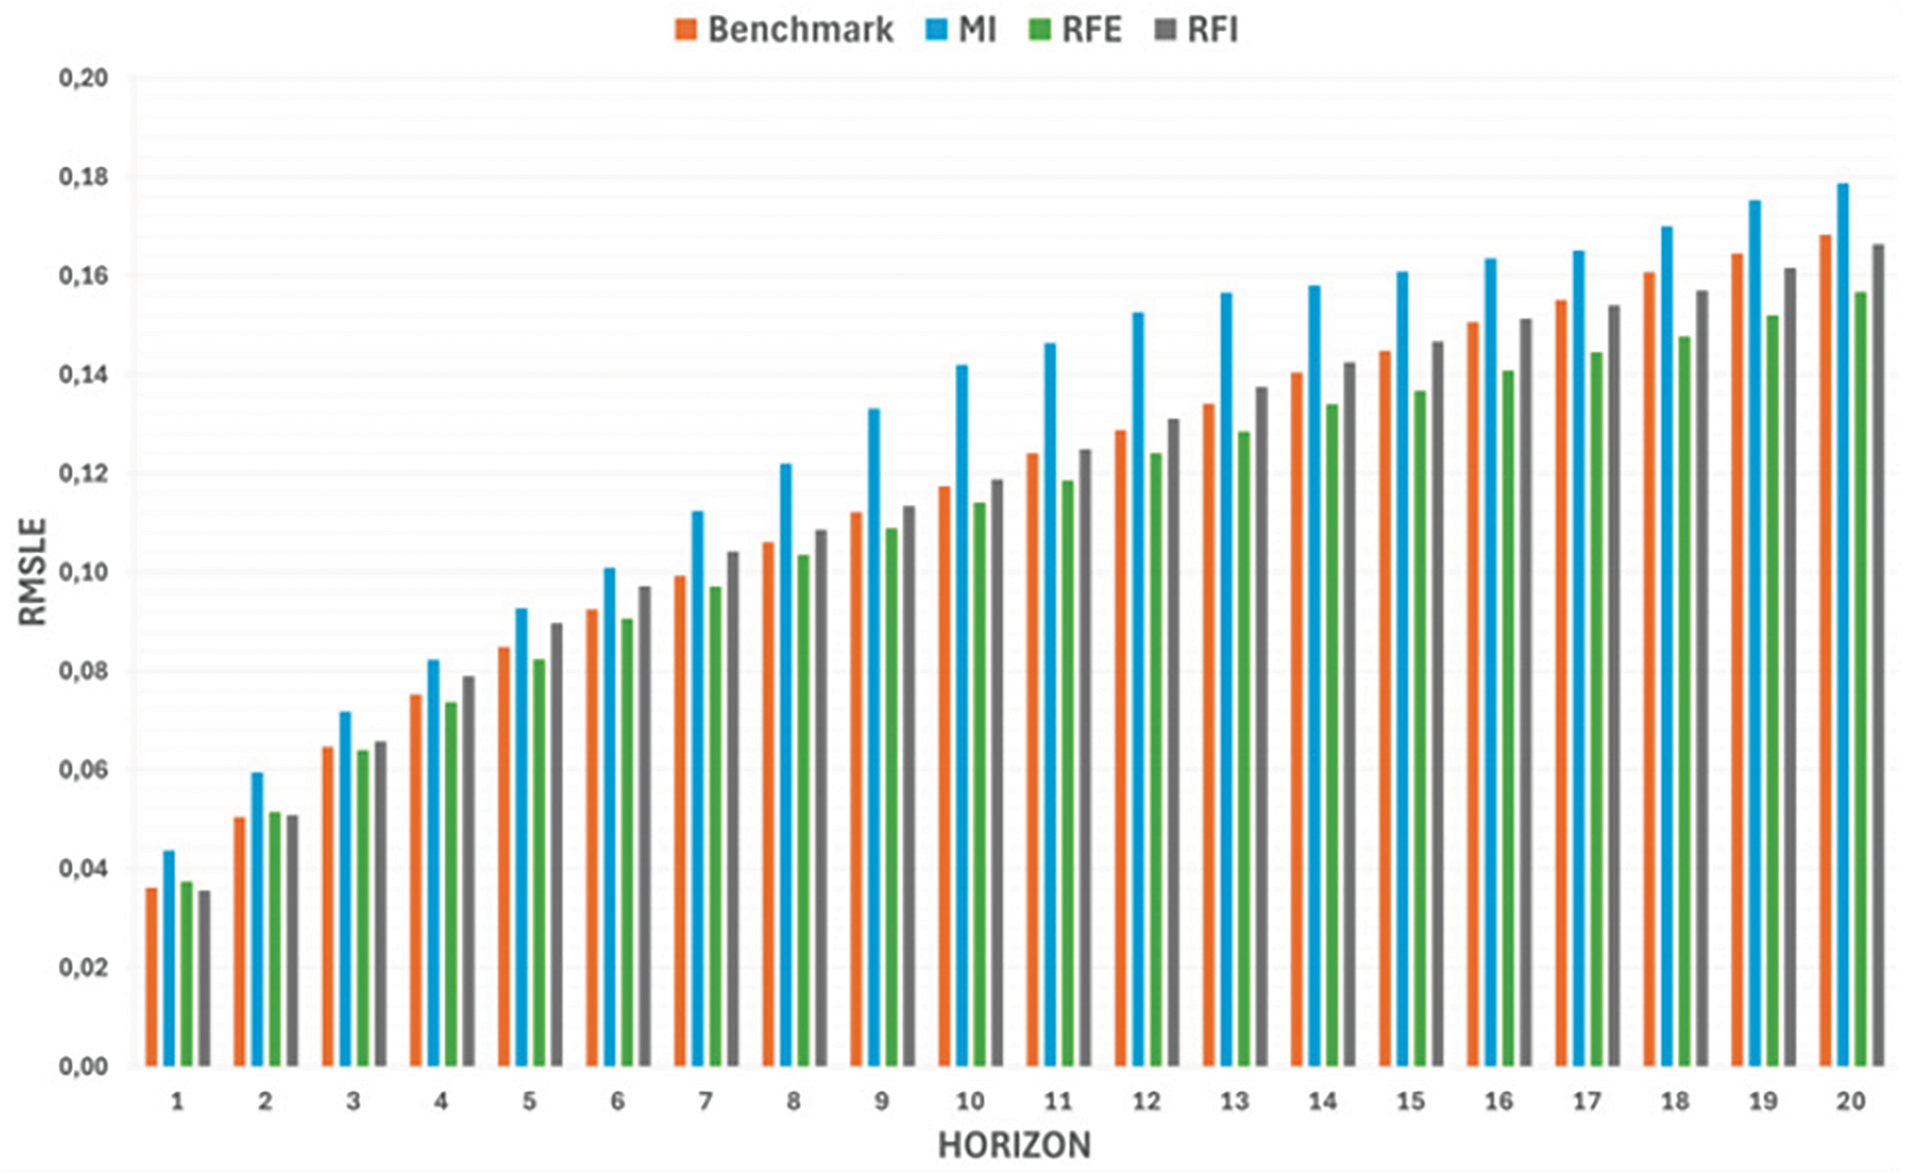
Figure 18: KNN model RMSLE results for BNB/USDT pair using different feature sets
4.2.1 Support Vector Regressor
• BTC/USDT (Figs. 1 and 2): Short-term horizons (1–5 days) showed modest R2, but performance improved around days 6–12. MI-based features outperformed the baseline in the longer term (13–20 days). RMSLE increased with the horizon which indicates bigger errors for longer horizons. This was the same for all other models and pairs. Hence starting from here, we will no longer comment on the RMSLE values.
• ETH/USDT (Figs. 3 and 4): Benchmark was the best for short to mid-term horizons, while RFI surpasses MI and RFE for long-term horizons.
• BNB/USDT (Figs. 5 and 6): BNB displayed notable short-term results under MI (with a peak R2 > 0.7 around day 3), although medium-range forecasts converged across methods.
• BTC/USDT (Figs. 7 and 8): MI outperformed other subsets in the early horizons, but the baseline model tended to dominate in medium-to-long terms.
• ETH/USDT (Figs. 9 and 10): The baseline model dominated the short horizons while RFI surpassed MI and RFE in all horizons except the early ones where MI was near the benchmark model.
• BNB/USDT (Figs. 11 and 12): Early and mid-term horizons were dominated by MI, while the baseline method led to longer forecasts.
• BTC/USDT (Figs. 13 and 14): R2 remained low in short horizons but improved slightly for medium terms using MI.
• ETH/USDT (Figs. 15 and 16): RFI-based features produced better mid-range R2 than MI or RFE, while they failed to get any results compared to the base model at early horizons, in longer horizons both RFI and MI were better than the baseline model.
• BNB/USDT (Figs. 17 and 18): BNB showed higher predictive performance with MI (notably >0.8 in medium horizons), although results weakened after day 12.
Our discussion focuses on three dimensions: (1) trading pair distinctions, (2) feature selection methods, and (3) technical indicator categories. We also interpret model-specific outcomes and offer practical recommendations.
5.1 Feature Selection Analysis by Trading Pair
Table 1 shows that Mutual Information (MI) selected eight momentum and seven volatility indicators for BTC/USDT, while Recursive Feature Elimination (RFE) prioritized nine volatility and six momentum indicators, and Random Forest Importance (RFI) chose nine momentum and eight volatility indicators. Across these methods, volatility was especially prominent in BTC selection sets (e.g., Bollinger Bands, True Range), Although volume features were comparatively fewer (2–3 across methods), the Accumulation/Distribution Oscillator (ADOSC_3_10) and Price Volume Rank (PVR) offered supplemental information, particularly under RFE and RFI.
For Ethereum, momentum indicators appear with the greatest frequency. MI and RFI selected nine and seven momentum features, respectively, while RFE selected 11—its highest momentum count among all three trading pairs. Volatility indicators ranged from five (RFE) to nine (RFI), suggesting that ETH price fluctuations, while partly volatility-driven, rely more on rapid-change metrics such as SLOPE_1 and CFO_9. Volume indicators (e.g., PVR, EFI_13) also appeared in each method’s selection for ETH/USDT. The Huber Regressor R2 plot (covering horizons of 1–20 days) further indicated that combining momentum and volume features can enhance short-to-medium-term prediction for ETH.
BNB/USDT displayed the most balanced distribution across categories. MI selected 10 momentum and 5 volatility features, along with 4 trend indicators. RFE also targeted multiple momentum and volatility features, though at slightly lower counts, while RFI emphasized momentum (9 selections) and volume (3 selections). Trend-based indicators such as DPO_20, INC_1, and DEC_1 were more common for BNB than for BTC or ETH. These findings imply that BNB price movements benefit from a broader mix of momentum, trend, and volatility elements when constructing a predictive feature set.
5.2 Feature Selection Method Performance
When summing across all trading pairs, MI chose 27 momentum, 18 volatility, 10 trend, and 5 volume indicators. This distribution underscores MI’s strong preference for momentum signals (e.g., BOP, CFO_9, SLOPE_1) while still identifying key volatility measures (e.g., Bollinger Band metrics) and select trend features (e.g., INC_1, DEC_1).
RFE’s overall selections leaned slightly toward volatility (24 total across pairs) and momentum (22 total), with fewer trend (5) and volume (9) indicators. This pattern highlights RFE’s balance between reacting to short-term market shifts (momentum) and accounting for price dispersion (volatility). RFE also uncovered moderate contributions from volume metrics such as PVR and EFI_13, suggesting a synergy between volatility and volume signals in certain horizons (particularly for BTC).
RFI displayed the strongest emphasis on momentum (28 total across pairs) and substantial coverage of volatility (20). The method also identified a single overlap indicator, high-low indicator (HWL), for the BTC/USDT set. This outcome points to the capacity of tree-based models to capture complex, non-linear relationships among momentum and volatility factors. In certain instances—e.g., ETH/USDT mid-term predictions—RFI features (especially momentum oscillators) drove more stable forecasts compared to pure volatility- or volume-centric subsets.
5.3 Technical Indicator Category Analysis
Momentum formed the largest category (19 unique indicators, ~41% of the total unique selected technical indicators). BOP, CFO_9, and SLOPE_1, each registered nine total appearances (i.e., chosen by all three methods for every pair). PVO_12_26_9, ROC_10, and PGO_14 showed moderate-to-high selection frequencies, highlighting the broad importance of relative price changes and oscillatory signals in capturing market sentiment shifts.
Volatility indicators contributed a significant portion of the selected features overall (14 unique indicators, 30% of the total). Bollinger Band Percent (BBP_5_2.0) and Bollinger Band Bandwidth (BBB_5_2.0) each appeared nine times across all pairs and methods. True Range (TRUERANGE_1) and Thermo (THERMO_20_2_0.5) also consistently ranked highly.
Volume indicators were less frequent overall (6 unique features). PVR had seven total appearances (the highest among volume metrics), reinforcing the notion that price-volume convergence can confirm momentum or volatility signals. Elder Force Index (EFI_13) also contributed to medium- and long-horizon modeling by integrating price and volume flux.
Trend indicators (6 unique across all selections) had varying importance by trading pair. INC_1 and DEC_1 were more frequently selected for BTC/USDT and BNB/USDT, aiding in short-term direction detection.
Only one Overlap category indicator (HWL) was selected, exclusively under RFI for BTC/USDT. Its limited appearance suggests that simpler overlapping metrics (e.g., High–Low range) may be less informative than specialized volatility, momentum, or trend measures in most crypto-market contexts.
5.4 Models Performance Analysis
Three regression models—Support Vector Regression (SVR), Huber Regressor, and K-Nearest Neighbors (KNN)—were evaluated over 1–20-day horizons. Each model was tested with the baseline (full) feature set, as well as the subsets identified by MI, RFE, and RFI.
• SVR
∘Short term (1–5 days): Across BTC/USDT, ETH/USDT, and BNB/USDT, R2 values tended to be low for all the feature selection models. However, BNB exhibited an early spike in R2 (>!0.7) under MI around day 3.
∘ Medium-term (6–12 days): ETH/USDT peaked here, with RFI surpassing MI and RFE on some horizon. The baseline model was near the best-performing feature selection method except for BNB where MI continued the lead.
∘ Long-term (13–20 days): R2 stabilized at moderate levels. MI occasionally outperformed RFE and RFI, particularly for BTC and BNB.
•Huber Regressor
∘ Short term (1–5 days): MI-based features boosted early predictions for BTC/USDT and BNB/USDT, whereas the baseline feature set still yielded strong results for ETH/USDT.
∘ Medium-term (6–12 days): The baseline model regained superiority for BTC/USDT, while RFI offered more accurate ETH/USDT mid-horizon forecasts. BNB performance favored MI, though RMSLE climbed slightly.
∘ Long-term (13–20 days): The baseline typically delivered the highest R2 for BTC/USDT and BNB/USDT, with RFI occasionally surpassing it for ETH/USDT.
•KNN
∘ Short term (1–5 days): BTC/USDT and ETH/USDT scored low R2, whereas BNB/USDT under MI occasionally reached comparatively higher accuracy.
∘ Medium-term (6–12 days): BNB/USDT peaked (>0.8 for some horizons) under MI. ETH/USDT performance favored RFI.
∘ Long term (13–20 days): BTC/USDT saw gradual R2 gains, whereas ETH and BNB results tended to decline, indicating that KNN may struggle to generalize well for extended horizons.
Overall, the combination of momentum and volatility indicators is essential for capturing short-term price oscillations and market volatility, whereas trend and volume features consistently refined medium-to-long-horizon forecasts. RFE and RFI often highlighted nuanced volatility–momentum interactions, while MI successfully extracted momentum-dominant subsets that performed strongly in certain BTC and BNB scenarios.
These outcomes underline the importance of tailoring feature selection to each cryptocurrency pair and predictive time frame. For BTC/USDT, volatility-driven methods are particularly beneficial; for ETH/USDT, momentum-oriented strategies may outperform; and for BNB/USDT, a broad, balanced combination of indicators offers robust results. Model-wise, SVR, and Huber typically outperformed KNN in generalization, although strong feature selection can significantly elevate KNN’s short-to-medium term accuracy.
This study offers a comprehensive exploration of technical indicator selection in cryptocurrency price prediction. By examining multiple feature selection methods and machine learning regressors, the findings indicate that volatility- and momentum-based indicators play critical roles in enhancing forecasting accuracy, while volume and trend technical indicators can contribute to performance improvements in specific horizons.
Despite a strong empirical foundation, several constraints affect the scalability of the approach. First, relying on daily aggregation may mask intra-day trading opportunities and price fluctuations critical for real-time decision-making. Second, the analysis focuses on three large-cap cryptocurrencies, which may limit the generalizability of these findings to a broader universe of digital assets with differing liquidity and market structures. Third, the study employs only one representative algorithm from each category of feature selection methods, potentially leaving out more specialized or hybrid approaches.
Future work can deepen these insights by integrating shorter time-frame data to capture high-frequency market dynamics, expanding the investigation to additional cryptocurrencies or token classes, and applying a broader suite of feature selection and modeling techniques. Incorporating fundamental metrics, such as macroeconomic indicators and on-chain analytics, may offer a more complete perspective on price formation mechanisms. By addressing these avenues, subsequent research can further refine the predictive capability of machine learning models in cryptocurrency markets.
Acknowledgement: Not applicable.
Funding Statement: The authors received no specific funding for this study.
Author Contributions: The authors confirm their contribution to the paper as follows: Conceptualization: Ahmed El Youssefi, Abdelaaziz Hessane, Imad Zeroual, Yousef Farhaoui; Methodology: Ahmed El Youssefi, Abdelaaziz Hessane, Imad Zeroual, Yousef Farhaoui; Software: Ahmed El Youssefi, Abdelaaziz Hessane; Validation: Ahmed El Youssefi, Abdelaaziz Hessane, Imad Zeroual, Yousef Farhaoui; Formal analysis: Ahmed El Youssefi, Abdelaaziz Hessane, Imad Zeroual, Yousef Farhaoui; Investigation: Ahmed El Youssefi, Abdelaaziz Hessane, Imad Zeroual, Yousef Farhaoui; Resources: Ahmed El Youssefi, Abdelaaziz Hessane; Data curation: Ahmed El Youssefi, Abdelaaziz Hessane; Writing—original draft preparation: Ahmed El Youssefi, Abdelaaziz Hessane; Writing—review & editing: Ahmed El Youssefi, Abdelaaziz Hessane, Imad Zeroual, Yousef Farhaoui; Visualization: Ahmed El Youssefi; Supervision: Imad Zeroual, Yousef Farhaoui; Project administration: Imad Zeroual, Yousef Farhaoui. All authors reviewed the results and approved the final version of the manuscript.
Availability of Data and Materials: The data used within this study are openly available at https://data.binance.vision/ (accessed on 1 January 2025).
Ethics Approval: Not applicable.
Conflicts of Interest: The authors declare no conflicts of interest to report regarding the present study.
References
1. Katsiampa P, Corbet S, Lucey B. High frequency volatility co-movements in cryptocurrency markets. J Int Financ Mark Inst Money. 2019;62(2–3):35–52. doi:10.1016/j.intfin.2019.05.003. [Google Scholar] [CrossRef]
2. Wei M, Kyriakou I, Sermpinis G, Stasinakis C. Cryptocurrencies and lucky factors: the value of technical and fundamental analysis. Int J Fin Econ. 2024;29(4):4073–104. doi:10.1002/ijfe.2863. [Google Scholar] [CrossRef]
3. Almansour BY, Alshater MM, Almansour AY. Performance of ARCH and GARCH models in forecasting cryptocurrency market volatility. Ind Eng Manag Syst. 2021;20(2):130–9. doi:10.7232/iems.2021.20.2.130. [Google Scholar] [CrossRef]
4. Zhu Y, Ma J, Gu F, Wang J, Li Z, Zhang Y, et al. Price prediction of Bitcoin based on adaptive feature selection and model optimization. Mathematics. 2023;11(6):1335. doi:10.3390/math11061335. [Google Scholar] [CrossRef]
5. Hamayel MJ, Owda AY. A novel cryptocurrency price prediction model using GRU, LSTM and bi-LSTM machine learning algorithms. AI. 2021;2(4):477–96. doi:10.3390/ai2040030. [Google Scholar] [CrossRef]
6. Pabuccu H, Barbu A. Feature selection with annealing for forecasting financial time series. Financ Innov. 2024;10(1):87. doi:10.1186/s40854-024-00617-3. [Google Scholar] [CrossRef]
7. Venkatesh B, Anuradha J. A review of feature selection and its methods. Cybern Inf Technol. 2019;19(1):3–26. doi:10.2478/cait-2019-0001. [Google Scholar] [CrossRef]
8. Wright CS. Bitcoin: a peer-to-peer electronic cash system. SSRN Electron J. 2008;3440802:10–2139. doi:10.2139/ssrn.3440802. [Google Scholar] [CrossRef]
9. Moodi F, Jahangard-Rafsanjani A, Zarifzadeh S. Feature selection and regression methods for stock price prediction using technical indicators. arXiv:2310.09903. 2023. doi:10.48550/ARXIV.2310.09903. [Google Scholar] [CrossRef]
10. Nagaraj N, Vikranth BM, Yogesh N. Recursive feature elimination technique for technical indicators selection. In: International Conference on Intelligent Systems and Pattern Recognition; 2022 Mar 24–26; Hammamet, Tunisia. Cham, Switzerland: Springer International Publishing; 2022. p. 139–45. doi:10.1007/978-3-031-08277-1_12. [Google Scholar] [CrossRef]
11. Contreras RC, Xavier da Silva VT, Xavier da Silva IT, Viana MS, Santos FLD, Zanin RB, et al. Genetic algorithm for feature selection applied to financial time series monotonicity prediction: experimental cases in cryptocurrencies and Brazilian assets. Entropy. 2024;26(3):177. doi:10.3390/e26030177. [Google Scholar] [PubMed] [CrossRef]
12. Akhiat Y, Manzali Y, Chahhou M, Zinedine A. A new noisy random forest based method for feature selection. Cybern Inf Technol. 2021;21(2):10–28. doi:10.2478/cait-2021-0016. [Google Scholar] [CrossRef]
13. Naganjaneyulu GVSSKR, Prashanth G, Revanth M, Narasimhadhan AV. Multi indicator based hierarchical strategies for technical analysis of crypto market paradigm. Int J Electr Comput Eng Syst. 2023;14(7):765–80. doi:10.32985/ijeces.14.7.4. [Google Scholar] [CrossRef]
14. Alsubaie Y, El Hindi K, Alsalman H. Cost-sensitive prediction of stock price direction: selection of technical indicators. IEEE Access. 2019;7(2):146876–92. doi:10.1109/ACCESS.2019.2945907. [Google Scholar] [CrossRef]
15. Binance Data Collection [Online]. [cited 2025 Jan 1]. Available from: https://data.binance.vision/?prefix=data/spot/. [Google Scholar]
16. El Youssefi A, Hessane A, El Allaoui A, Zeroual I, Farhaoui Y. Heikin Ashi candlesticks for cryptocurrency returns clustering. In: The International Conference on Artificial Intelligence and Smart Environment; 2022 Nov 24–26; Errachidia, Morocco. p. 481–5. doi:10.1007/978-3-031-26254-8_69. [Google Scholar] [CrossRef]
17. El Youssefi A, Hessane A, Farhaoui Y, Zeroual I. Cryptocurrency returns clustering using japanese candlesticks: towards a programmatic trading system. In: Advanced technology for smart environment and energy. Cham, Switzerland: Springer International Publishing; 2023. p. 93–103. doi:10.1007/978-3-031-25662-2_8. [Google Scholar] [CrossRef]
18. Pandas-ta [Online]. [cited 2024 Dec 29]. Available from: https://twopirllc.github.io/pandas-ta/. [Google Scholar]
19. El Youssefi A, Hessane A, Zeroual I, Farhaoui Y. Utilizing machine learning and deep learning for predicting crypto-currency trends. Salud, Ciencia Y Tecnología—Serie De Conferencias. 2024;3:638. doi:10.56294/sctconf2024638. [Google Scholar] [CrossRef]
20. Mahayana D, Madyaratri SA, Fadhl ‘Abbas M. Predicting price movement of the BTCUSDT pair using LightGBM classification modeling for cryptocurrency trading. In: 2022 12th International Conference on System Engineering and Technology (ICSET); 2022 Oct 3–4; Bandung, Indonesia. p. 1–6. doi:10.1109/ICSET57543.2022.10010808. [Google Scholar] [CrossRef]
21. Vergara JR, Estévez PA. A review of feature selection methods based on mutual information. Neural Comput Appl. 2014;24(1):175–86. doi:10.1007/s00521-013-1368-0. [Google Scholar] [CrossRef]
22. Cho DH, Moon SH, Kim YH. Genetic feature selection applied to KOSPI and cryptocurrency price prediction. Mathematics. 2021;9(20):2574. doi:10.3390/math9202574. [Google Scholar] [CrossRef]
23. Priyatno AM, Ramadhan Sudirman WF, Musridho RJ. Feature selection using non-parametric correlations and important features on recursive feature elimination for stock price prediction. Int J Electr Comput Eng. 2024;14(2):1906. doi:10.11591/ijece.v14i2.pp1906-1915. [Google Scholar] [CrossRef]
24. Varma V, Engineer ML. Embedded methods for feature selection in neural networks. arXiv:2010.05834. 2020. doi:10.48550/ARXIV.2010.05834. [Google Scholar] [CrossRef]
25. Razmi S, Barak S. Adaptive crypto trading using directional change and meta-learning. Rochester, NY, USA: SSRN-Elsevier; 2024. doi:10.2139/ssrn.5017215. [Google Scholar] [CrossRef]
26. Chicco D, Warrens MJ, Jurman G. The coefficient of determination R-squared is more informative than SMAPE, MAE, MAPE, MSE and RMSE in regression analysis evaluation. PeerJ Comput Sci. 2021;7(3):e623. doi:10.7717/peerj-cs.623. [Google Scholar] [PubMed] [CrossRef]
27. Saheed YK, Ayobami RM, Orje-Ishegh T. A comparative study of regression analysis for modelling and prediction of bitcoin price. In: Blockchain applications in the smart era. Cham, Switzerland: Springer International Publishing; 2022. p. 187–209. doi:10.1007/978-3-030-89546-4_10. [Google Scholar] [CrossRef]
Cite This Article
 Copyright © 2025 The Author(s). Published by Tech Science Press.
This work is licensed under a Creative Commons Attribution 4.0 International License , which permits unrestricted use, distribution, and reproduction in any medium, provided the original work is properly cited.
 Downloads
 Citation Tools