
 Submit a Paper
 Propose a Special lssue
 Open Access
ARTICLE
A Multi-Layers Information Fused Deep Architecture for Skin Cancer Classification in Smart Healthcare
1 Department of Computer Science, HITEC University, Taxila, 47080, Pakistan
2 Department of Artificial Intelligence, College of Computer Engineering and Science, Prince Mohammad Bin Fahd University, Al-Khobar, 31952, Saudi Arabia
3 Department of Information Systems, College of Computer and Information Sciences, Princess Nourah bint Abdulrahman University, Riyadh, 11671, Saudi Arabia
4 Center for Computational Social Science, Hanyang University, Seoul, 01000, Republic of Korea
5 Department of Computer Science, Hanynag University, Seoul, 01000, Republic of Korea
* Corresponding Authors: Muhammad Attique Khan. Email: ; Byoungchol Chang. Email:
(This article belongs to the Special Issue: Deep Learning and IoT for Smart Healthcare)
Computers, Materials & Continua 2025, 83(3), 5299-5321. https://doi.org/10.32604/cmc.2025.063851
Received 25 January 2025; Accepted 28 February 2025; Issue published 19 May 2025
 View Full Text
 Download PDF
Abstract
Globally, skin cancer is a prevalent form of malignancy, and its early and accurate diagnosis is critical for patient survival. Clinical evaluation of skin lesions is essential, but several challenges, such as long waiting times and subjective interpretations, make this task difficult. The recent advancement of deep learning in healthcare has shown much success in diagnosing and classifying skin cancer and has assisted dermatologists in clinics. Deep learning improves the speed and precision of skin cancer diagnosis, leading to earlier prediction and treatment. In this work, we proposed a novel deep architecture for skin cancer classification in innovative healthcare. The proposed framework performed data augmentation at the first step to resolve the imbalance issue in the selected dataset. The proposed architecture is based on two customized, innovative Convolutional neural network (CNN) models based on small depth and filter sizes. In the first model, four residual blocks are added in a squeezed fashion with a small filter size. In the second model, five residual blocks are added with smaller depth and more useful weight information of the lesion region. To make models more useful, we selected the hyperparameters through Bayesian Optimization, in which the learning rate is selected. After training the proposed models, deep features are extracted and fused using a novel information entropy-controlled Euclidean Distance technique. The final features are passed on to the classifiers, and classification results are obtained. Also, the proposed trained model is interpreted through LIME-based localization on the HAM10000 dataset. The experimental process of the proposed architecture is performed on two dermoscopic datasets, HAM10000 and ISIC2019. We obtained an improved accuracy of 90.8% and 99.3% on these datasets, respectively. Also, the proposed architecture returned 91.6% for the cancer localization. In conclusion, the proposed architecture accuracy is compared with several pre-trained and state-of-the-art (SOTA) techniques and shows improved performance.Keywords
The skin is the most significant body part by surface area in the human body. It shields the inner organs and is sensitive to external factors [1]. UV exposure is a critical external factor that adversely impacts the skin. Excessive exposure and lack of protection mechanisms lead to fatal skin diseases such as melanoma [2]. Every year, there is a significant rise in skin diseases. The largest organ is needed to enhance understanding of skin diseases [3]. Skin cancer is the term for the unusual growth of new skin cells and is a fatal skin disease [4]. Skin cancer is generally categorized into benign and malignant forms, distinguishing whether the condition is inactive or actively progressing. However, it has seven significant categorizations: Actinic keratosis (akiec), Vascular lesions (vasc), Basal cell carcinoma (bcc), Melanocytic nevi (nv), Dermatofibroma (df), Melanoma (mel), Benign keratosis-like lesions (bkl).
It is the most common malignancy in the United States. In the US, skin cancer claims the lives of about two people every hour. In 2023, there is an estimated 4.4% rise in the number of melanoma deaths. In the United States, an estimated 97,610 persons, among which 58,120 men and 39,490 women, will receive a diagnosis of invasive skin cancer in 2023. In 2020, the diagnosed melanoma cases were 324,635, whereas 57,043 deaths were reported. Also, white people are 20 times more likely than people with dark skin to develop melanoma. The diagnostic age is 65 on average. Compared to men, women receive more melanoma diagnoses before they reach the age of 50, whereas men have a higher prevalence after the age of 50. Melanoma predominantly manifests with age, yet its occurrence extends to younger individuals, encompassing those under 30 [5]. Notably, it stands among the prevalent cancers identified in young adults, mainly among women. In 2020, approximately 2400 instances of melanoma were projected to be detected in individuals aged 15 to 29.
The incidence of melanoma witnessed a significant upward trend for several decades. However, in the early 2000s, the annual diagnosis rates for individuals under 50 stabilized in women and exhibited a decline of approximately 1% per year in men [4]. Although only making a small fraction, e.g., 1%, of all skin cancer diagnoses in the United States, melanoma is a primary reason for deaths caused by skin cancer. On the other hand, between 2011 and 2020, the annual rate of mortality from melanoma declined by around 3% for individuals over 50% and 5% for persons under 50. Medical advancements have led to this progress.
Traditionally, many invasive and noninvasive techniques were utilized for skin cancer diagnosis. These techniques include biopsy, sonography, fluorescence spectroscopy, and dermoscopy [6]. Among all traditional clinical methods, the use of dermoscopy is comparatively high due to its noninvasive nature. Dermoscopy is a digital device that involves using handheld devices to illuminate subsurface structures of the skin [7]. These devices facilitate the optical penetration of light rays beyond the skin surface, reducing surface reflection [8]. It has higher classifying power than the naked eye clinical analysis, which gives a maximum of 60% accuracy [7], but still, the correctness depends on the dermatologist’s practice. The ABCD rule was developed for dermoscopy to diagnose skin lesions in clinical trials [9]. The parameters of this rule include asymmetry, border irregularity, color, and differential structures. These parameters graded the lesions in benign or malignant [10]. With the use of computerized techniques, the diagnostics performance has been improved for the experts and clinicians with limited experience in dermoscopy [11].
Significant contributions are made to automated skin lesion diagnosis to counter traditional approaches’ limitations [12]. The application of computational intelligence has remarkably increased the diagnostic accuracy of skin lesions [13]—the endurance rate of skin cancer patients determined by multiple factors. One of the prime factors in this regard is the premature detection of skin cancer. The involvement of Computer-Aided Diagnostic (CAD) systems has significantly facilitated the timely detection of skin lesions [14]. The gradual decline in the mortality rate of skin cancer and recent studies validate the impact of computer-aided diagnostic systems [15].
CAD systems follow predefined steps to detect and classify lesions [16]. These steps generally follow the sequence: preprocessing followed by separation of an object from the background, feature extraction, feature selection, and finally, classification [15]. This sequence can be modified according to the methodology followed by CAD systems. The core step for automated diagnosis in these CAD systems is extracting features. These features are defining parameters to distinguish between classes of skin lesions. Initially, CAD systems were based on handcrafted image feature extraction [11]. These handcrafted features are inadequate to solve the challenges of publicly available datasets, including imbalanced datasets, complicated images, interclass similarity, and intra-class differences. Most recently, deep feature extraction has gained attention in intelligent CAD systems. It has provided promising results in different domains and the field of automated medical diagnosis [17,18].
With the emergence of intelligent techniques, automatic diagnosis is improving daily. However, along with advancements in tools and techniques, new challenges keep surfacing in the medical field [16,19]. Big and complicated datasets are becoming publicly available, posing new research challenges [20]. Particularly for skin cancer, much of the research is based on the binary classification of lesions; however, skin cancer is categorized into seven major classes. The datasets of skin lesions are highly imbalanced, along with complications like inter-class similarity and intra-class differences. Researchers have contributed to addressing these problems, but improvements are required to develop a robust and efficient multiclass skin lesion diagnosis system. With the emergence of deep neural networks, concerns like computational complexity and resource consumption emerged. Therefore, there is a dire need for a framework that considers all these challenges and provides an accurate, robust, computationally efficient solution. This research presents an automated framework for efficiently classifying skin lesions into multiple classes. Significant contributions of this work are:
- We proposed two deep learning architectures, QuadRes-Net and PentRes-Net, inspired by the ResNet architecture. Both models have fewer parameters and are more efficient than the ResNet50 and ResNet101 architectures.
- The proposed models’ hyperparameters have been initialized using Bayesian Optimization. Usually, they are initialized using a hit-trail method.
- A novel technique, Information Entropy Controlled Distance, is proposed for the fusion of higher entropy value features for improved accuracy and less computational time.
- GradCAM-based interpretability is performed on the original images to capture the critical prediction information. A detailed ablation study was performed, and the proposed work was compared with some recent methods.
The manuscript unfolds in the subsequent sequence. Initially, Section 2 provides a summary of related work, encompassing an overview of existing techniques. Following that, in Section 3, the proposed methodology is delineated, encompassing the explanation of datasets, proposed deep learning models, and complete framework. A description of the findings is covered in Section 4. Lastly, Section 5 concludes the manuscript.
Significant advancements have been made in automated medical diagnosis in the past decade [16]. Several computerized techniques have been introduced in the literature for the classification and localization of skin lesions [21,22]. Skin lesion segmentation is pivotal in automated dermatological image analysis, presenting substantial opportunities for enhancing diagnosis, treatment planning, and disease monitoring. Despite the hurdles, progress in segmentation methodologies, notably those rooted in deep learning, shows potential for achieving more precise and dependable lesion delineation in clinical settings. Skin lesion segmentation involves identifying and isolating areas of interest (lesions) within medical images, such as dermoscopic or clinical photographs. Its primary objective is to precisely differentiate the lesion area from the surrounding healthy skin, enabling further analysis and diagnosis [23].
Skin lesion classification entails grouping lesions into distinct categories determined by their visual attributes, including color, shape, texture, and irregularity of borders. By analyzing these traits, classification algorithms strive to discern between benign and malignant lesions, thereby assisting in precise diagnosis and formulation of treatment strategies. Skin lesion classification is a crucial aspect of automated dermatological image analysis, holding considerable promise for improving early detection, decision-making, and patient care. Addressing data variability, class imbalance, and model interpretability challenges is paramount for advancing and integrating classification algorithms effectively into clinical practice. Before deep learning approaches, segmentation was based on basic classic image processing. These traditional segmentation techniques can be broadly classified as follows: It segments images into numerous regions based on pixel intensity, grouping pixels with similar grey values. In [24], the authors tackle the challenges of skin lesion images by presenting a new contrast enhancement technique and segmenting the lesion area by a novel OCF (optimized color feature)-based technique for lesion segmentation, utilizing the YCbCr color space for feature extraction, optimized by a Genetic Algorithm (GA). A multilevel probability-based threshold function is developed to categorize the optimized features into their respective colors, which are then converted into the binary form using maximum probability-based thresholding. An existing saliency-based method is also applied, and its information is integrated to refine the lesion.
Authors in [25] presented a two-step system consisting of a preprocessing algorithm and a lesion segmentation network. The hairline removal algorithm uses morphological operators and is designed to eliminate noise artifacts. The processed images are then input into a convolutional neural network (CNN) for lesion segmentation. This novel CNN framework is built from scratch, following an encoder-decoder architecture. The layers are uniquely sequenced to perform both downsampling and upsampling, resulting in a high-resolution segmentation map. In [26], authors extracted lesion area by using the U-Net model that subsequently enhanced the classification accuracy. To address the segmentation challenges, the authors in [27] aimed to implement a novel Sailfish-based Gradient Boosting Framework (SbGBF) for accurately recognizing and segmenting the SL region. The boosting mechanism, rich with noise removal features, optimizes the segmentation process.
The boosting parameters are activated to eliminate noise variables in the trained SL data. Subsequently, the sailfish fitness function is applied to trace region features in the preprocessed SL images, leading to the final segmentation. In [28], authors gave a collaborative learning deep convolutional neural networks (CL-DCNN) model based on the teacher-student learning method for dermatological segmentation and classification. The self-training method was introduced to generate high-quality pseudo-labels. The segmentation network is selectively retrained through a classification network that screens the pseudo-labels. Specifically, high-quality pseudo-labels were obtained for the segmentation network using a reliability measure method.
Class activation maps were also employed to enhance the segmentation network’s localization capability. Furthermore, the classification network’s recognition ability was improved by providing lesion contour information through lesion segmentation masks. In [2], the authors suggested an end-to-end deep learning framework based on the segmentation method. The author presented a novel S-MobileNet and used a mish activation instead of ReLU. The framework was implemented in HAM10000 and ISIC datasets, and they achieved 98.15% accuracy. The drawback of this work was the authors did not address the data unbalancing problem. Ref. [29] presented an inherent learning using the deep learning models for the classification of skin cancer. The authors integrate an explainable AI algorithm with the proposed model. They evaluated the framework using the HAM10000 dataset, gained the highest accuracy of 92.89%, and visualized the learned feature. In [30], the authors presented a novel generative AI model for preventing the data imbalance problem in skin cancer. The authors presented an ST-GAN network that generated skin cancer images and employed the proposed classification model. They used the HAM10000 dataset for the evaluation and improved accuracy by 16% from the SOTA techniques.
This work achieved a classification accuracy of 82.1%. In [31], a unified CAD model that involves preprocessing, a novel architecture for segmentation and transfer learning, is presented, followed by feature extraction, fusion, and selection. Finally, the features are classified using SVM. For the ISIC2019 dataset, this approach achieved 93.47% accuracy. In [32], authors investigated the performance of 17 different CNNs for skin lesion classification and established that DenseNet201 with Cubic SVM/ Fine KNN gained a top accuracy of 92.34%. In [33], authors took advantage of and combined transformers and CNNs to build an efficient skin lesion classification system. This system was assessed using the ISIC2019 dataset and achieved an accuracy of 97.2%. In [34], a new segmentation framework is given, and classification is performed using extracted features from pre-trained DenseNet201. It achieved the accuracy of 91.7%. In [35], authors presented a novel contrast enhancement technique and then used modified DarkNet-53 and DenseNet-201 for transfer learning. Extracted features are combined and then optimized using the modified marine predator optimizer. The ISIC2019 dataset was utilized for evaluation, and an accuracy of 98.8% was attained. In [36], a new model for segmentation was presented, after which the segmented images’ local and global characteristics were extracted and classified using EfficientNetB1. This work achieved an accuracy of 91.73% for the ISIC2019 dataset.
In [37], authors presented a system for skin lesion classification focusing on transfer learning and feature optimization. In [38], authors presented a semantic segmentation model, then some essential features were nominated by the Binary Dragonfly Algorithm (BDA), and finally, grouping was done using SqeezNet. This work achieved an accuracy of 98.77%. In [39], ShuffleNet is modified using SqeezNet excitation blocks, and a lightweight CNN is presented. The accuracy achieved by this work is 98.1% for the ISIC2019 dataset. In [40], the authors presented an AI-based method for skin lesion classification. A residual deep convolution neural network was utilized for this work, and an accuracy of 94.65% was achieved for the ISIC2019 dataset.
In [41], authors used deep learning to present AI-driven skin cancer classification. They employed pertained vision transformers and conducted a comparative analysis among the deep learning models. They utilized the ISIC2019 dataset for the experimental process. They achieved better results from the state-of-the-art methods. The primary limitation of this work was the fixed hyperparameters that affect the generalization of the proposed framework. In [42], authors suggested a lightweight deep-learning model for the classification of skin cancer disease. They performed experiments on publicly available datasets with two classes, achieving 92% accuracy. The limitation of the proposed work was that the number of training samples was small for the efficient learning of the proposed model. In [43], the authors suggested an optimized CNN for dermatological lesion classification. They created a CNN from scratch and a novel data augmentation method. The authors selected the HAM1000 dataset for the experimental process and gained 97.78% accuracy. The limitation of this work was the extensive utilization of the pooling layer that removes the valuable features from the feature maps.
Challenges: Despite all these research advancements, many difficulties in skin lesion segmentation and accurate classification require the research community’s attention for effective and efficient solutions. Most of these past research studies for skin lesion classification have focused on segmentation and then used transfer learning for classification tasks. Most of the previous works have not focused on the design of new models from scratch. In addition, hyperparameter optimization was rarely focused on. The preprocessing and segmentation steps are eluded in the proposed work, and two novel deep-learning architectures are proposed to efficiently classify skin lesions into several classes.
The detailed theoretical and mathematical justification for the suggested methodology is provided in this section. Fig. 1 depicts the proposed method for skin lesion classification and segmentation. Data augmentation was performed using the proposed method, and two models were trained. The proposed CNN models in this work are QuadRes-Net and PentRes-Net. Hyperparameters of both models have been initialized using the Bayesian Optimization algorithm. After that, we trained both models and extracted testing features. The testing features are fused using a serial approach, reducing the amount of irrelevant information using information entropy. The final resultant vector is further passed to classifiers for the final classification. An explainable AI technique named LIME is also applied to analyze the interpretability of a proposed model. Also, the LIME output is concatenated with the mean-saliency technique for the lesion segmentation. The details of each step in the proposed method are given below.

Figure 1: Proposed framework for multiclass skin lesion classification
This study employs two well-known datasets, HAM10000 (Human Against Machine) [44] and ISIC2019 [45], to assess the proposed framework. The HAM10000 dataset included 10,015 dermoscopic images. The nature of the images of this dataset is RGB. The number of images in each class includes 327 (AKIEC), 1099 (BKL), 514 (BKL), 514 (BCC), 115 (DF), 1113 (MEL), 6705 (NV), 142 (VASC), respectively.
The 25,331 images in the ISIC2019 dataset are divided into eight classes. The number of images in the melanocytic nevi class is 12,875; for the melanoma class, it is 4522; for the BKL class, it is 2624 images; for the BCC class, it contains 3323 images; the SCC class includes 253 images; the VL class has 628 images; the DF class has 239 images; and AK includes 867 images, respectively. The sample images of each lesion type in these datasets are shown in Fig. 1 (second half).
The class distributions of both datasets indicate an imbalanced problem. To resolve this problem, a simple flip-and-rotate approach to data augmentation is adopted. The resultant balanced datasets contain both the original and augmented images. Table 1 displays the class distributions of each dataset before and after augmentation.

3.2 Proposed QuadRes-Net Model
The proposed model, named QuadRes-Net, is visually illustrated in Fig. 2. The motivation behind implementing the quadres model. The quad structure allows the network to highlight malignant regions’ global patterns, shapes, and irregularities and identify the irregular borders and color distribution essential to skin cancer. The model has an input layer that accepts the input image size of 299 × 299 × 3. It is followed by a convolutional layer named conv comprising 32 filters of dimension 7 × 7× 3 with a step value of 2. Applying the ReLU activation layer resulted in obtaining a feature map of size 150 × 150 × 32. The output of the first ReLU activation is forwarded to a first residual block. The first block contains conv_1 comprising 64 kernels of size 3 × 3 × 32 with a step size of 1, a batch norm, relu_1, and conv_2 with 32 filters of dimension 7 × 7 × 64 with a step of 1. The outcome of this block of size 150 × 150 × 32 is added to the identity mapping, and the results are convolved with the following conv_3 weight layer comprising 64 filters of size 3 × 3 × 32 with a step of 2 Max pooling layer of size 3 × 3 with the stride of 1, is placed next playing its vital role in the reduction of spatial dimensions.

Figure 2: Proposed QuadRes-Net model for skin lesion classification
An output of size 75 × 75 × 64 enters the second residual block from the max pooling layer. The second block encompasses conv_5, which has 128 filters of dimension
The third block first convolves the input of size
The final block comprises the first weight layer with 256 filters of dimension
3.3 Proposed PentRes-Net Model
The second proposed deep learning model, PentRes-Net, consists of a 64-layered CNN architecture. The proposed architecture is shown in Fig. 3. Its parts are convolutional, max pooling, batch normalization, flattening, dense, ReLU activation, and input and output layers. The proposed model accepts the input of size

Figure 3: Proposed PentRes-Net model for skin lesion classification
The accepted input is then convolved by the conv layer with 32 filters of dimension 3 × 3 × 3 with a step size 2. After convolution, the output of size
After applying nonlinear activation, an output of size
The input of size
3.4 Training and Features Extraction
Fig. 4 illustrates the training process of the proposed deep learning model on augmented skin lesion datasets. All parameters were trained for both models, such as 19.4 M (million) for QuadRes-Net and 28.2 M for PentRes-Net. The balanced HAM10000 and ISIC 2019 datasets are employed to train the models. The Global Average Pooling (GAP) layer is chosen and activated for the QuadRes-Net model. As an activation function, the entropy loss function is employed. Deep features are extracted on this layer, and a feature vector of dimension Nx1024 is obtained.
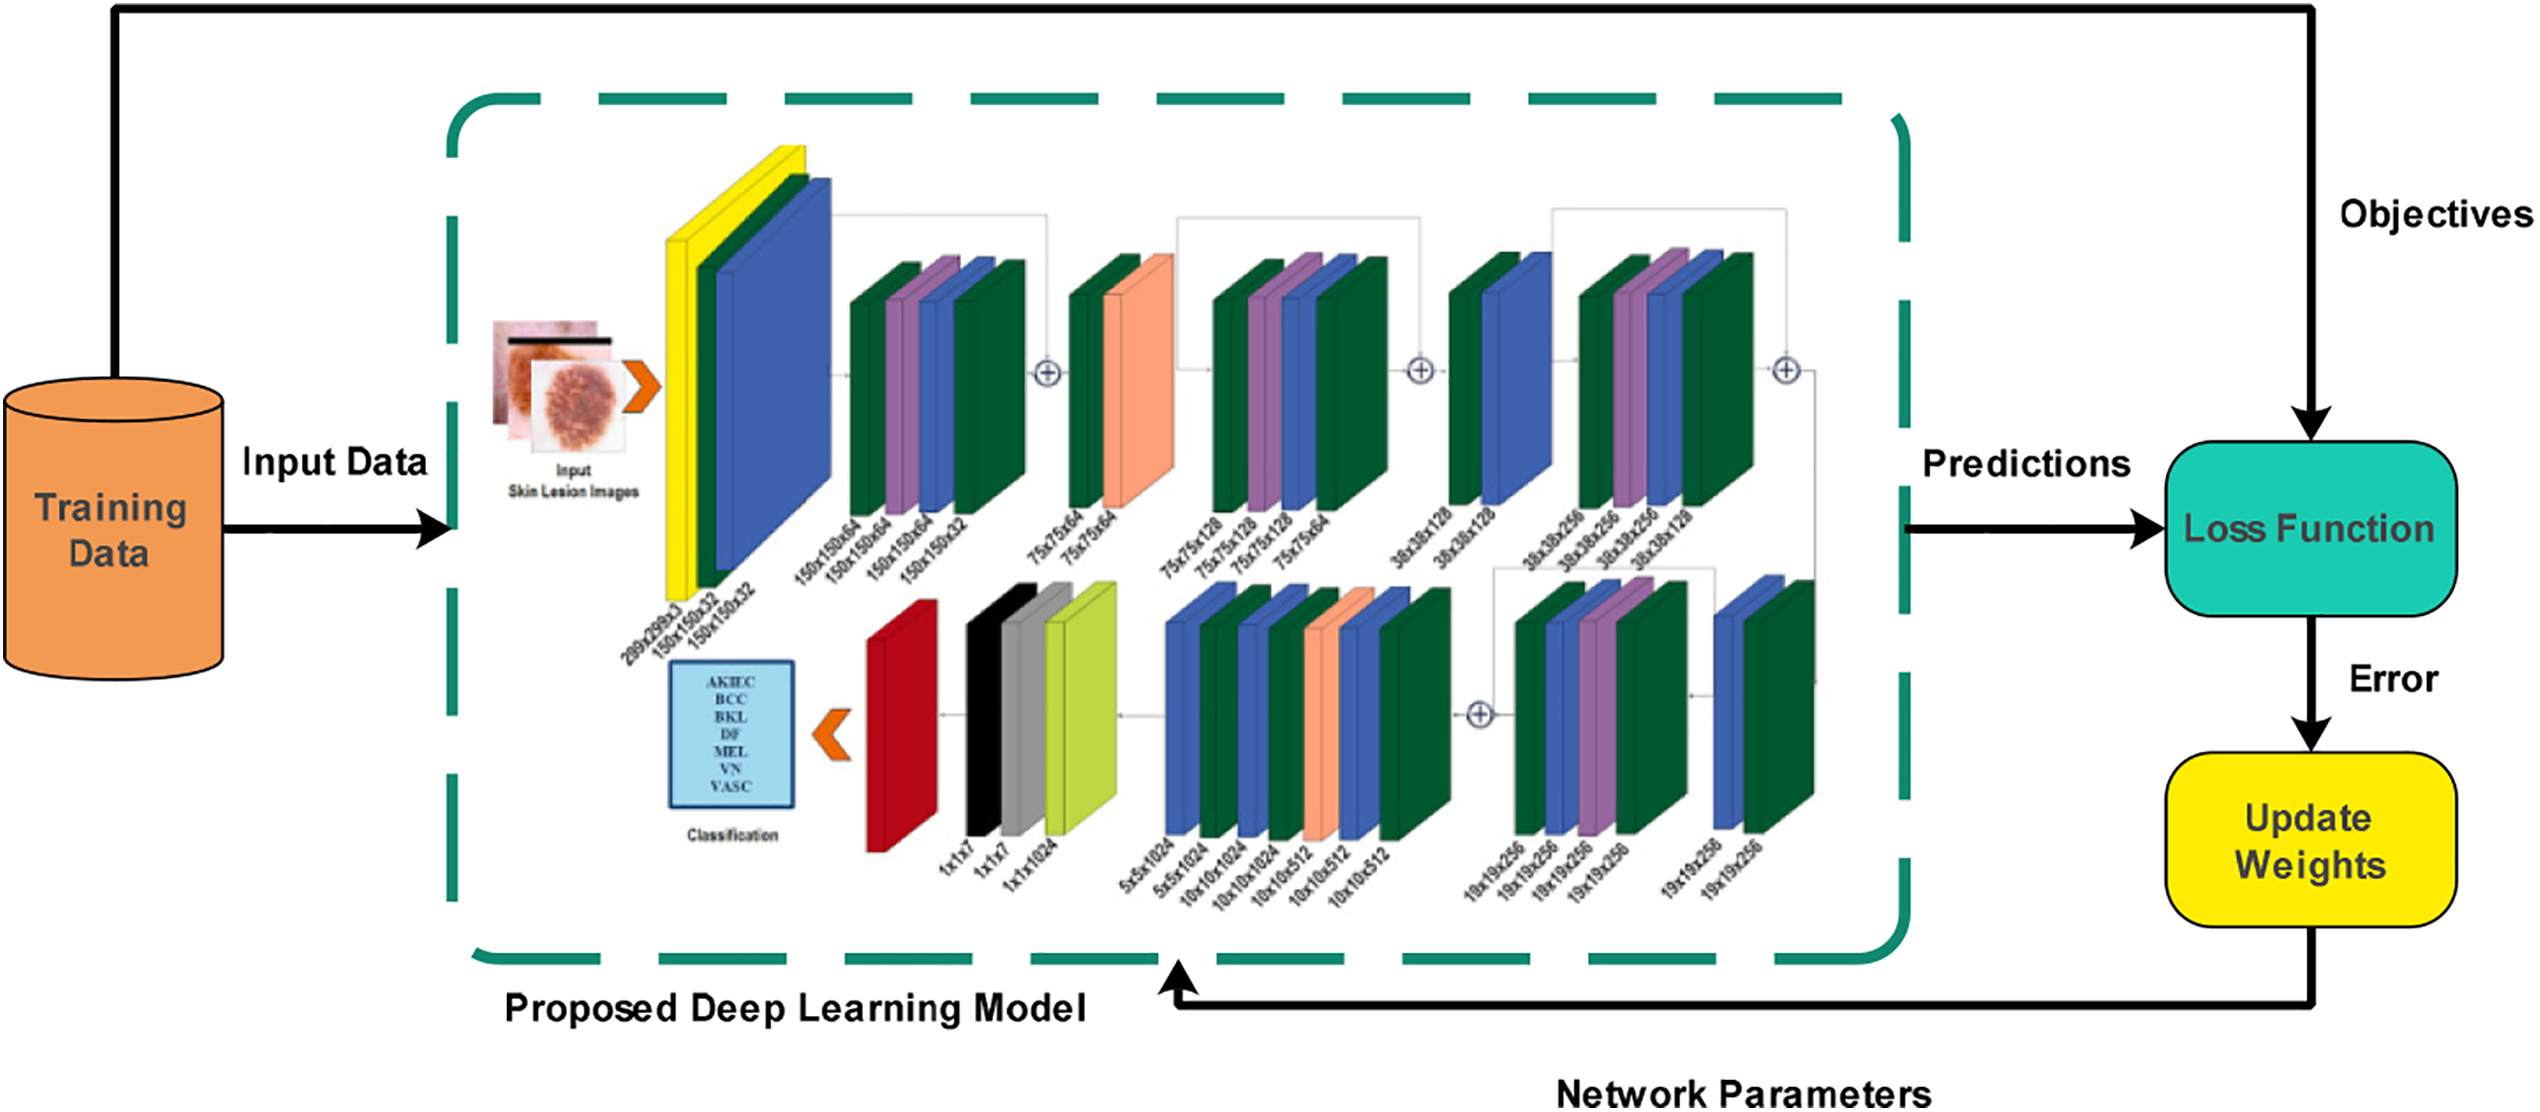
Figure 4: Proposed deep learning model learning using training data for skin lesion classification task
Similarly, in the model PentRes-Net, the Global Average pooling (GAP) layer is selected, and feature extraction is activated. The entropy loss function was employed as an activation function to obtain a feature vector of dimension Nx2048.
The process of merging several feature vectors into one feature vector is termed feature fusion. In this work, we aim to fuse the features of the proposed QuadRes-Net and PentRes-Net into a single feature vector for better accuracy. However, the simple fusion process increased the computational time and added redundant features, which increased the uncertainty of the extracted features. Therefore, we proposed a Serial controlled Information Entropy fusion technique that improved the accuracy and reduced the computational time.
Given two extracted feature vectors known as QuadRes-Net and PentRes-Net, denoted by
The obtained fused vector of dimension
where
where
Finally, the entropy value is computed for the final fused feature vector. The max entropy value features are selected in this work for the final fused feature vector—the dimension of the fused vector for this work is
The findings of the experiments that are conducted to assess the proposed framework are elaborated in this section. The framework is tested using two publicly accessible datasets, HAM10000 and ISIC2019. The training and testing results have been determined through an equal distribution strategy of 50:50. The hyperparameters of this work are stochastic gradient descent, epoch’s value of 50, momentum of 0.706, learning rate of 0.0010, and mini-batch size of 64. These hyperparameters are initialized using a Bayesian optimization (BO) technique. 5-fold cross-validation is employed to prevent overfitting. For the classification results, several classifiers have been employed, including Linear SVM, Fine KNN, Medium Quadratic SVM, Cosine KNN, Gaussian SVM, Cubic KNN, Coarse Gaussian SVM, and Weighted KNN. The 10-fold cross-validation approach is implemented for testing results. The performance of each classifier is computed based on the following measures: accuracy, sensitivity, precision, F1-Score, and classification time. The entire framework is simulated using MATLAB2023b on a PC with 128 GB of RAM and 12 GB graphics card RTX3060.
Multiple experiments were conducted to test the proposed framework on both selected datasets. Initially, the results are computed for each model separately, such as QuadRes-Net and PentRes-Net. After that, the fusion results are computed and compared to each single step. Further, a detailed ablation study was also performed to validate the proposed framework performance.
4.2 Results of HAM10000 Dataset
Classification outcomes for the model QuadRes-Net using the HAM10000 dataset are presented in Table 2. Results of different classifiers used in the experiment are presented. Fine KNN has accomplished the maximum accuracy of 84.2% and attained the sensitivity, precision, and F1-Score of 85.82%, 85.15%, and 85.49%, respectively. The rest of the classifiers have achieved an accuracy of 78.3%, 82.6%, 84.1%, 78.3%, 76.6%, 76.9%, 71.6%, 77.1%, 74.9%, and 82.7%, respectively. Cubic SVM has achieved the second-highest accuracy of 84.1%, but the classification time is much higher than Fine KNN’s. Overall, the computational time of the classification process is noted for each classifier and given in this table.

Table 2 (second half) summarizes the classification results of the model PentRes-Net for the HAM10000 dataset. Among all the ten classifiers, the Cubic SVM achieved the maximum accuracy of 83.9% and the maximum sensitivity, precision, and F1-Score of 85.11%, 84.6%, and 84.8%, respectively. Weighted KNN of 83.2% achieved second-best accuracy. The classification accuracy and computation times for different classifiers are comparable with the results of the proposed model QuadRes-Net. There is neither a considerable spike in the accuracies nor an observable dip in the computation time of SVM classifiers; however, the computation time for Cubic SVM and other classifiers is low for model PentRes-Net compared to model QuadRes-Net.
Table 3 presents the classification results of the proposed fusion technique. The proposed fusion was performed on feature vectors from QuadRes-Net and PentRes-Net deep neural networks on the HAM10000 dataset. The fusion step has remarkably increased the classification accuracy, as shown in this table. The classification time is also significantly reduced compared to experiments 1 and 2 (QuadRes-Net and PentRes-Net). Quadratic SVM has gained the maximum accuracy of 90.7%, and the sensitivity, precision, and F1-Score values are 91.38%, 91.27%, and 91.32%, respectively. The rest of the classifiers also obtained improved accuracy of 90.0%, 90.7%, 80.4%, 88.5%, 84.8%, 87.4%, 85.7%, 82.8%, 85.7%, 84.3%, and 87.4%, respectively. The confusion matrix of Quadratic SVM is illustrated in Fig. 5. This figure shows that the BKL and MEL classes have higher false positive rates, whereas the others show better prediction performance.

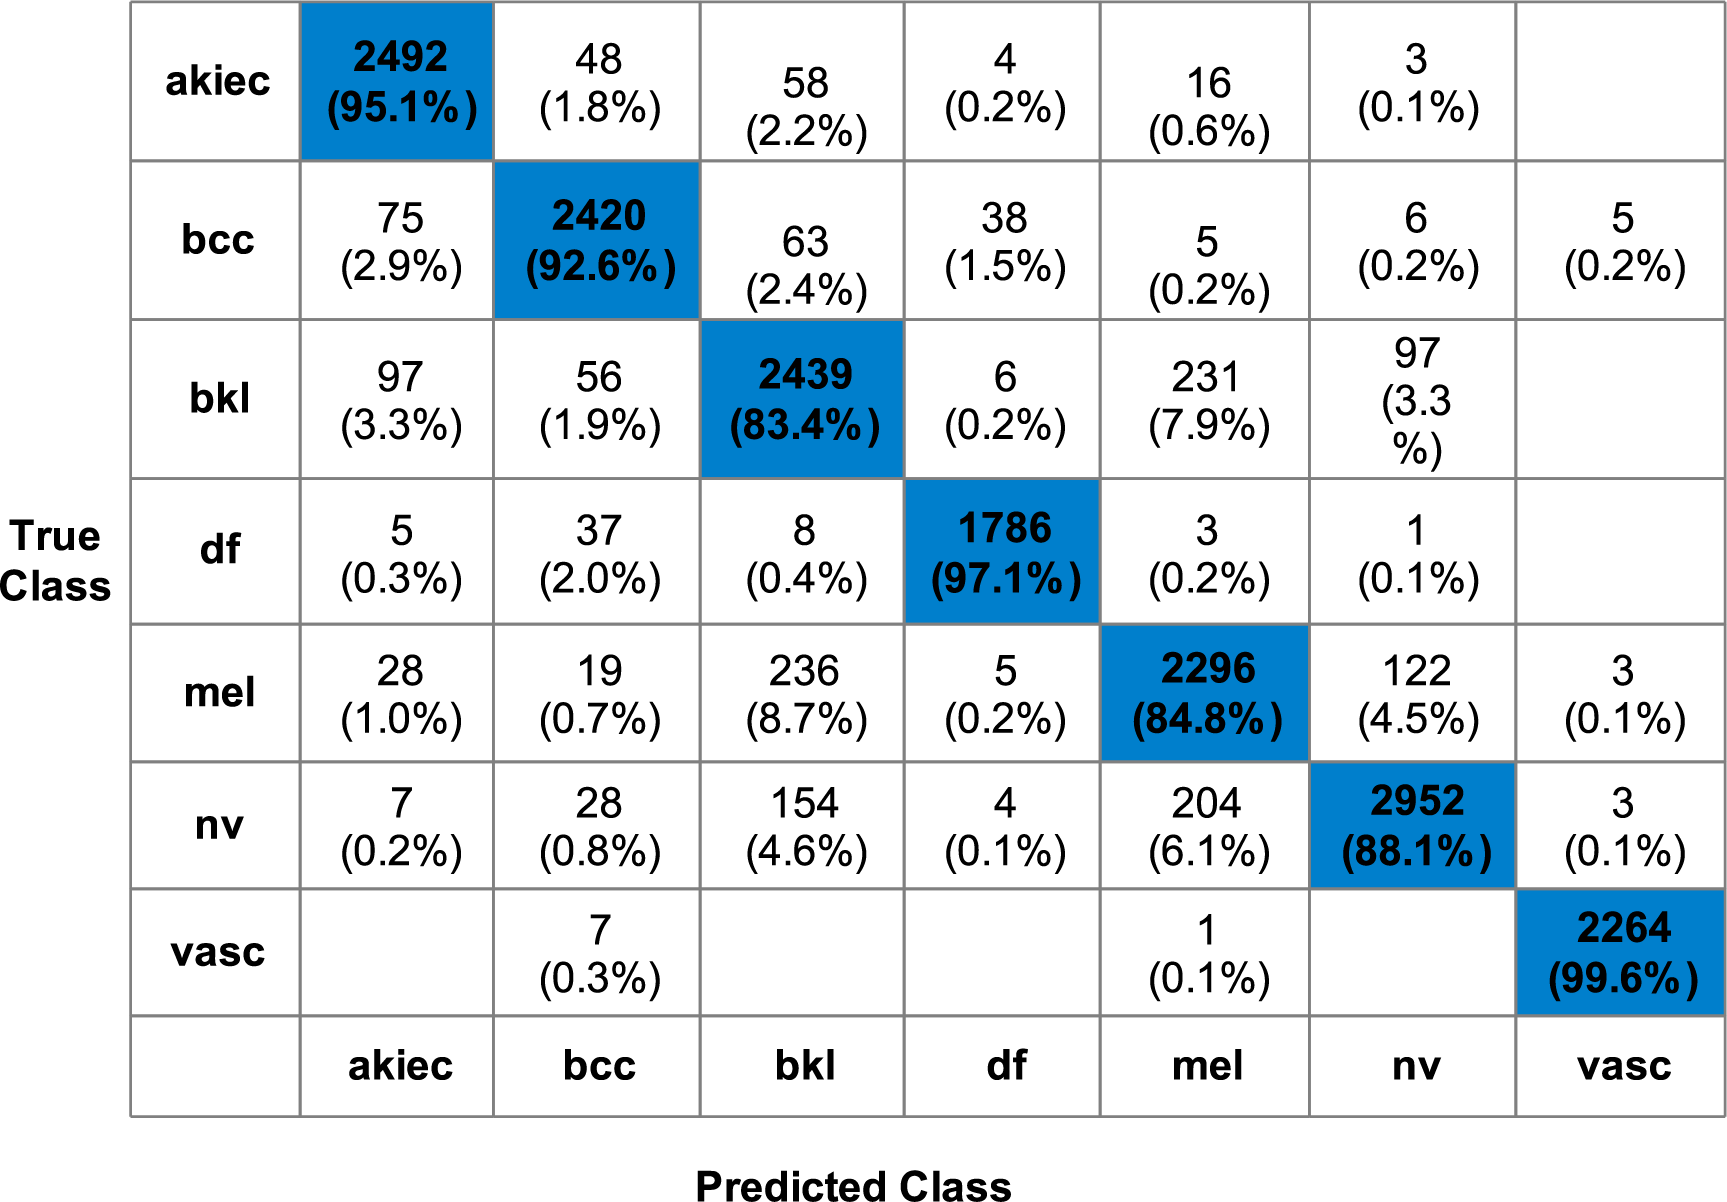
Figure 5: Confusion Matrix for Quadratic SVM for proposed methodology using HAM10000 dataset
4.3 Results for ISIC2019 Dataset
For the ISIC2019 dataset, classification experiments were conducted using the proposed QuadRes-Net and PentRes-Net models. Table 4 presents the classification results of model QuadRes-Net for the ISIC2019 dataset. The Fine KNN topped accuracy with 98.5% among the ten classifiers. Further, the sensitivity achieved was 98.45, the precision value was 98.525, and the F1-Score of 98.48%, respectively. A weighted KNN of 98.0% achieved the second-best accuracy. The classification accuracy and computation times for different classifiers are given in Table 5. The computational time of each classifier is noted for this experiment, and cubic SVM shows less time than the other classifiers.


Table 4 summarizes the classification results of the model PentRes-Net for the ISIC2019 dataset. Fine KNN outperformed the rest of the classifiers for this experiment with 98.51% accuracy. Weighted KNN gave the second-best accuracy with 98.41%. The highest sensitivity, precision, and F1-Score were also achieved by Fine KNN with the values of 98.47%, 98.57%, and 98.52%, respectively. Furthermore, it is evident that the suggested PentRes-Net model required a little longer computing time than the QuadRes-Net model; however, an improvement has occurred in the accuracy, precision, sensitivity, and F1-Score.
In the last stage, extracted features are fused using a novel fusion technique as presented in the proposed Section 3. Table 5 presents the overview of classification results achieved by utilizing the fused feature vector for the ISIC2019 dataset. The fusion step has impacted the classification results and computation time positively. Fine KNN outperformed the other classifiers by gaining 99.3% accuracy and a sensitivity value of 99.2%, a precision of 99.28%, and an F1-Score achieved of 99.22%, respectively. Fig. 6 shows the Fine KNN classifier’s confusion matrix that can be utilized to confirm the computed performance measures. This figure shows that each class’s correct prediction rate is above 98%, which is a strength of the proposed fusion process.
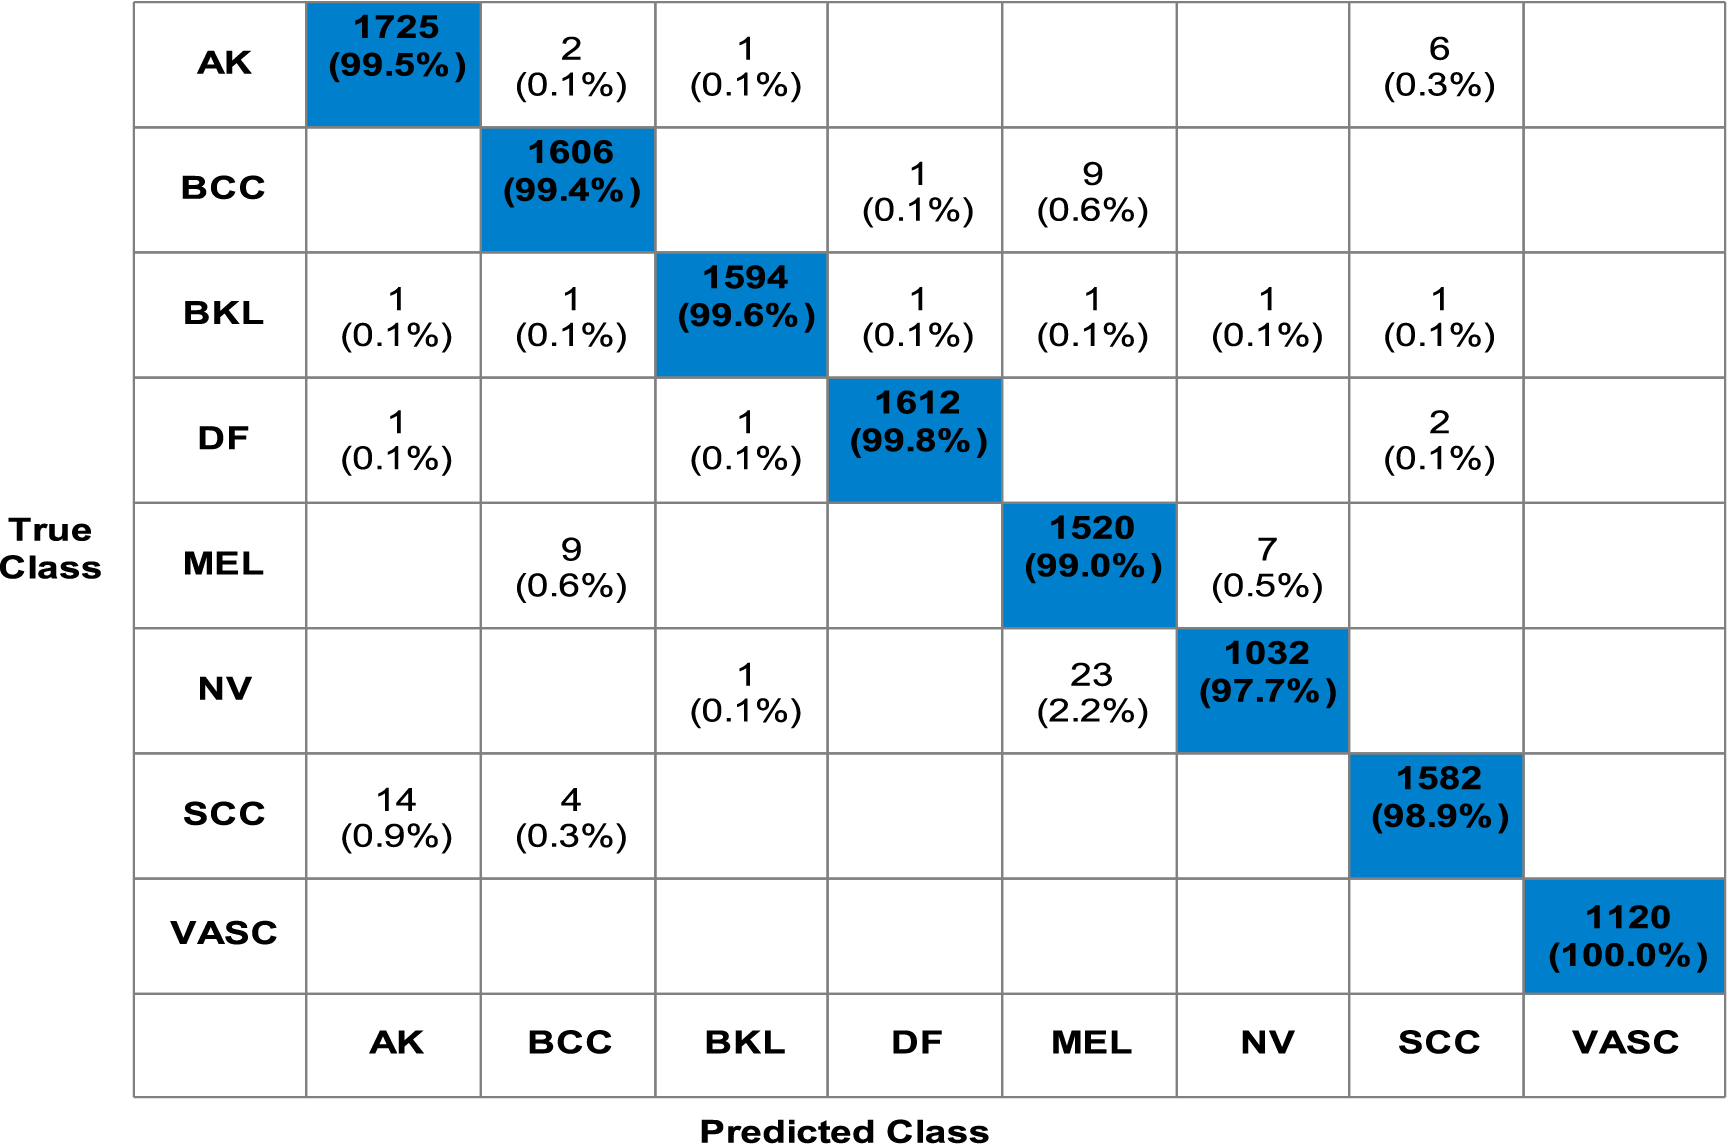
Figure 6: Confusion matrix for Fine KNN for proposed methodology using ISIC2019 dataset
A detailed discussion of the proposed framework is presented in this subsection. Fig. 1 shows the importance of deep learning techniques for skin lesion classification and diagnosis. The proposed deep learning fusion framework is illustrated in Fig. 1, which includes several middle steps, such as designing new models and feature fusion. The dataset imbalance issue is resolved in the initial step and is later utilized for training deep learning models. Two novel deep learning models, QuadRes-Net and PentRes-Net, are proposed in this work (models can be seen in Figs. 3 and 4). The total learnable parameters of the suggested models are comparable with the state-of-the-art models, as shown in Fig. 7 (upper part). This figure shows that the parameters of the proposed models are less than those of other pre-trained models except for four networks. The proposed PentRes-Net architecture contains fewer parameters than all the other networks.
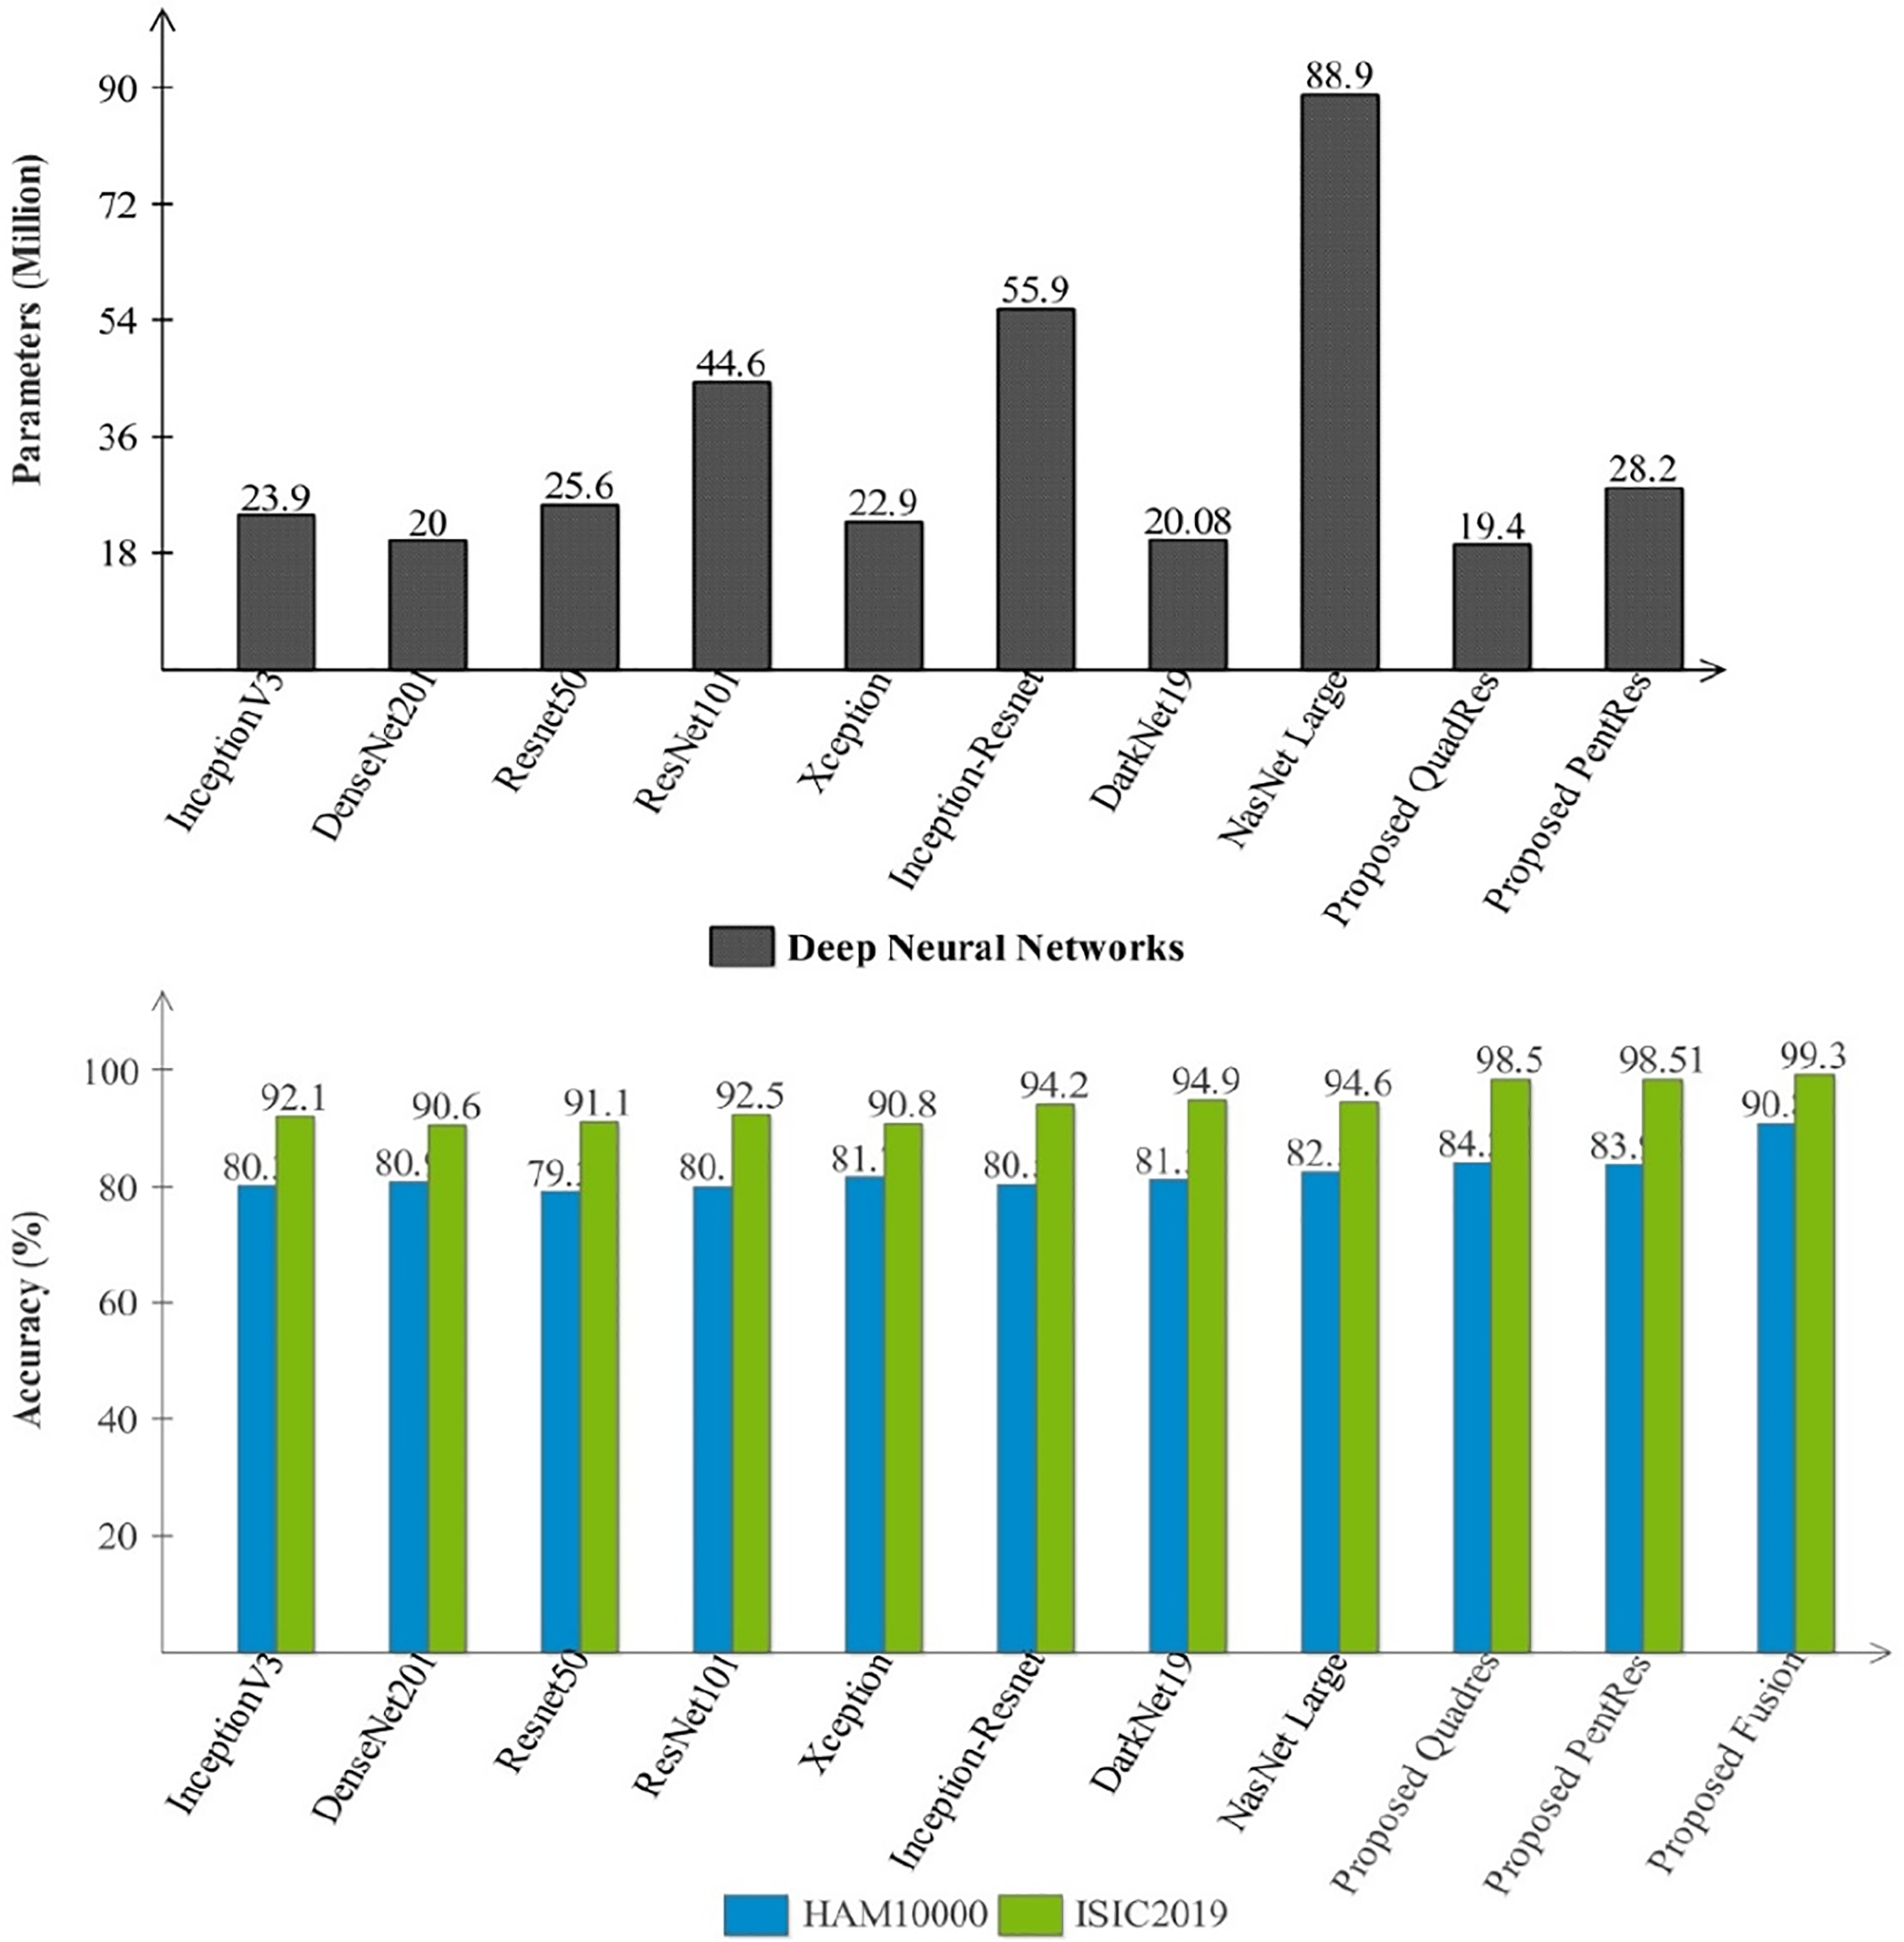
Figure 7: Comparison among several pre-trained and proposed deep architectures in the form of parameters and accuracy
Tables 2 and 3 present the results of the HAM10000 dataset, whereas Tables 4 and 5 present the classification results of the ISIC2019 dataset, respectively. In these tables, it is noted that the classification accuracy has been improved after employing the proposed fusion technique. The accuracy almost jumped up to 5% after the fusion technique. Confusion matrices are illustrated in Figs. 5 and 6, which can be used to verify the highest classifier’s computed performance measures.

Fig. 7 (second-half) presents a comparison among proposed models and pre-trained neural networks accuracy. In this figure, the accuracy performance of proposed QuadRes-Net, PentRes-Net, and fusion process has been significantly improved. The computational time of each classifier is also noted during the classification process and the fusion process reduced the overall testing time (see Tables 2–5).
Ablation Study: Initially, the publicly accessible datasets are used to train the proposed models, and feature vectors are extracted from them. The classification results of individual features and the computation time are calculated. The proposed framework has performed well for ISIC2019 regarding accuracy and computation time using individual features from models QuadRes-Net and PentRes-Net. However, the classification accuracy for HAM10000 had room for improvement. After that, the individual feature vectors are fused using simple serial-based fusion to evaluate the impact of merged features on the proposed framework.
Finally, the fused feature vector is used to evaluate the framework. The fusion step has remarkably enhanced the classification accuracy of HAM10000 and improved the classification results of the ISIC2019 dataset. It is also observed that generally, the fusion step impacts accuracy positively but adds to the computation time; however, in the proposed framework, it is evident from the results that the fusion step decreased the computation time for the experiment using HAM10000 and ISIC2019 datasets. The classification and segmentation performance can be further enhanced by adopting color constancy, as multiple research works have shown improvement in segmentation and classification accuracy by using color constancy. Further, a GradCAM visualization is performed on the proposed models, and the results are illustrated in Fig. 8.
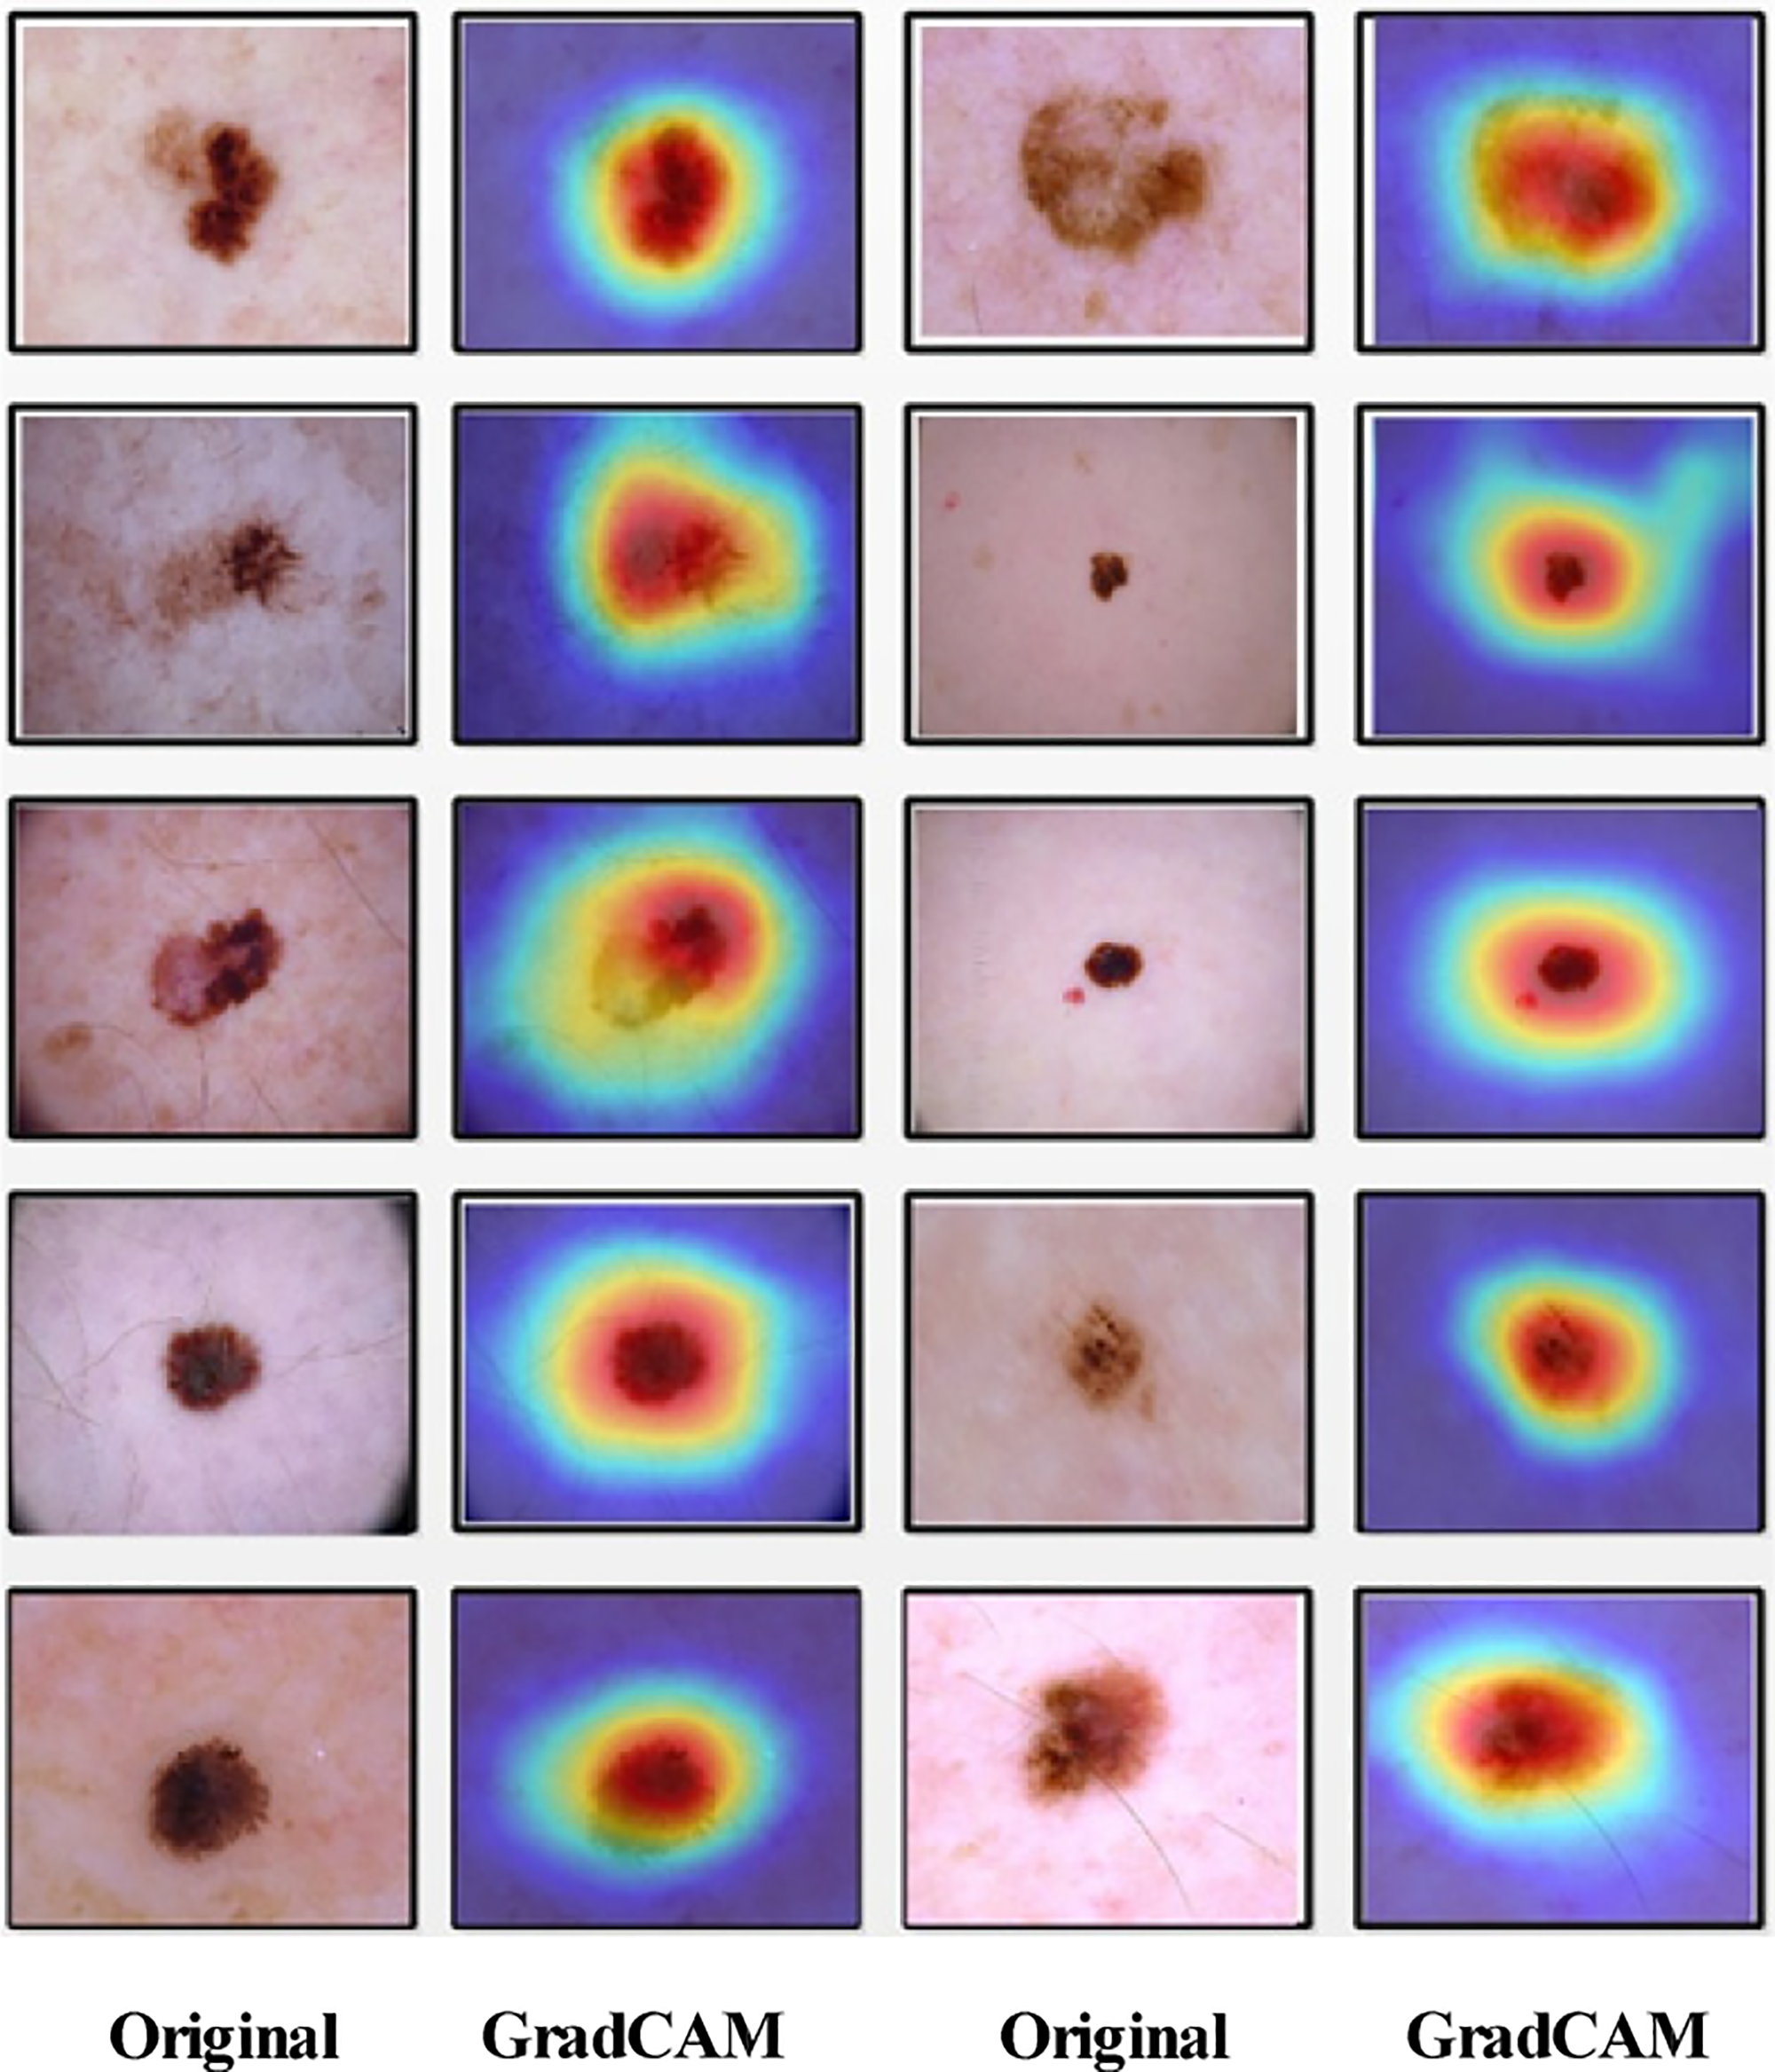
Figure 8: GradCAM-based visualization of the proposed PentRes-Net Model
Another ablation study is conducted based on the before-and-after data augmentation process, as shown in Table 6. From this table, it is observed that the proposed model significantly improved the accuracy by ~5% after the augmentation step and is more generalized after the augmentation step.
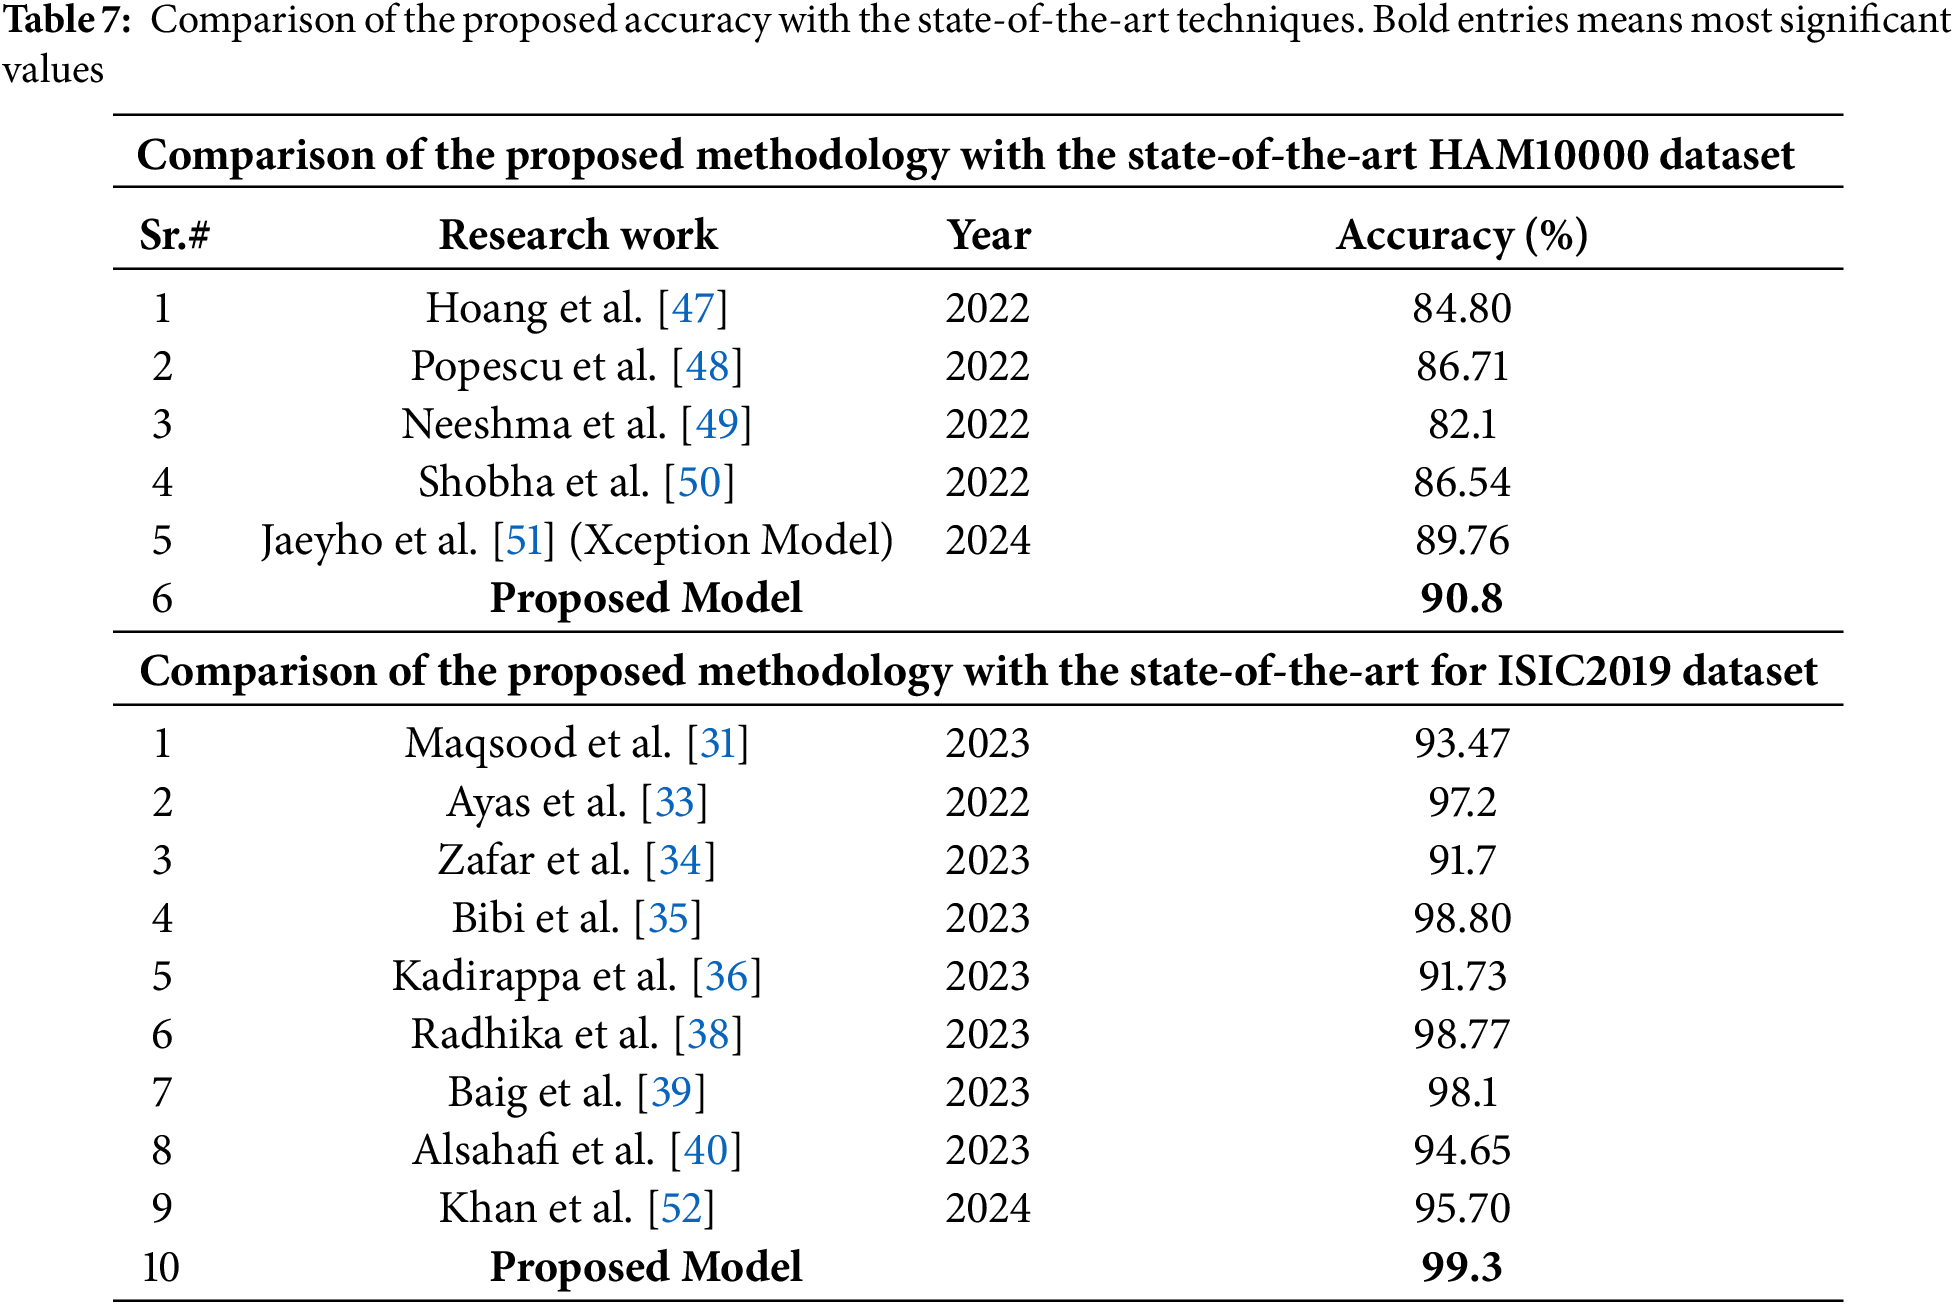
Lastly, the proposed framework’s performance is compared with that of state-of-the-art techniques. Table 7 gives a performance comparison of the proposed work using the HAM10000 dataset and the ISIC2019 dataset. It is evident that the proposed framework has outpaced the state-of-the-art in classification performance.
Lesion Localization: Based on the classification performance, the proposed PentRes-Net architecture is modified for the lesion segmentation task using the HAM10000 dataset. The testing was done on 500 dermoscopic images and obtained an accuracy of 91.6%, a sensitivity rate of 90.4%, and a precision rate of 91.0%. Furthermore, a few sample images are illustrated in Fig. 9. Fig. 9a shows the original testing images, (b) illustrates the segmented binary images after PentRes-Net and OTSU thresholding, (c) denotes the refined image, (d) denotes the fused image, (e) represents the mapped on the original image, (f) represent the ground truth image, and (g) shows the final localized image, respectively.
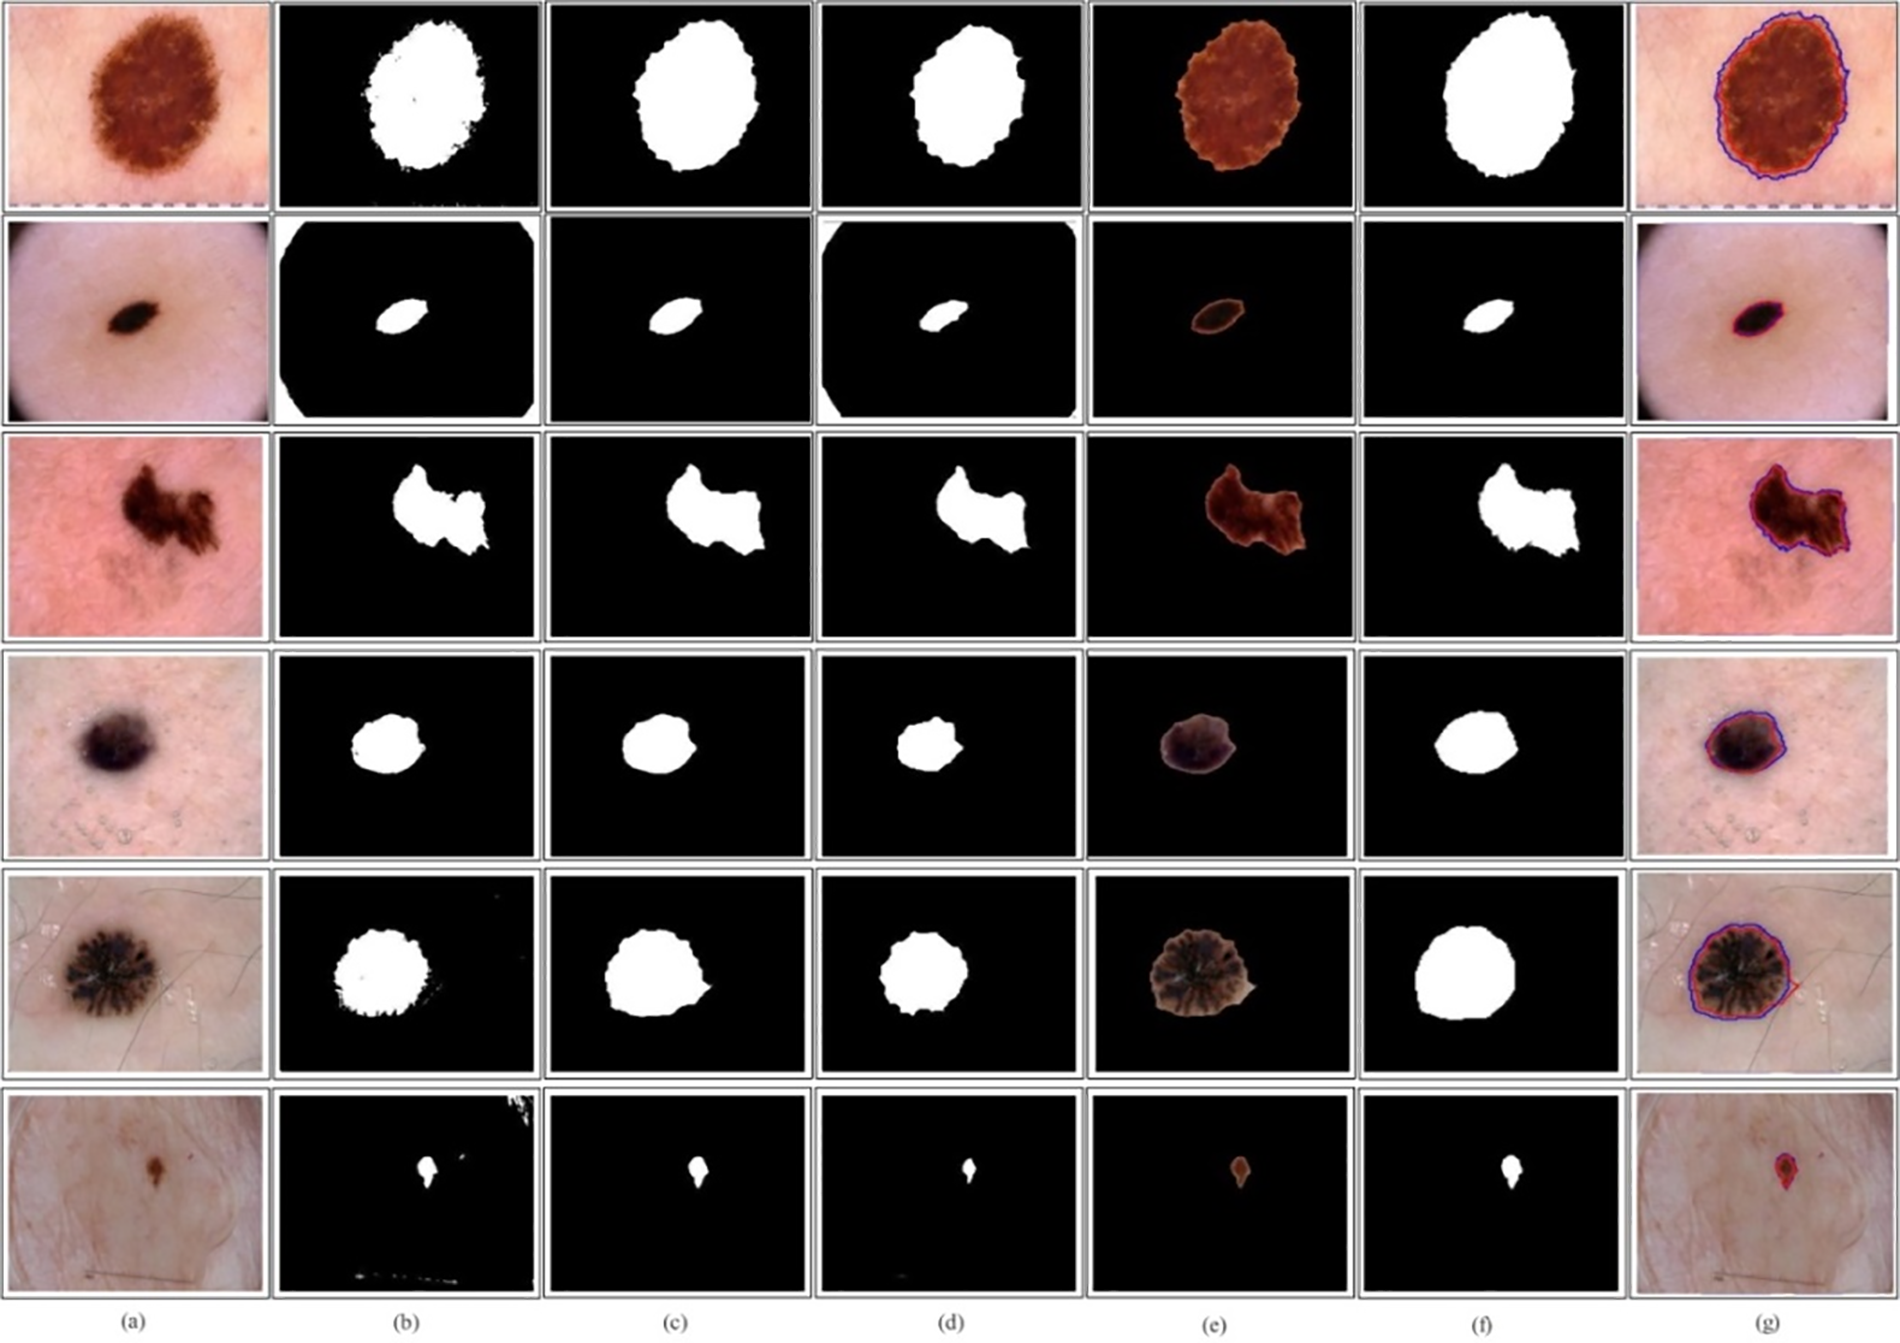
Figure 9: Lesion localization using QuadRes-Net with LIME interpretable technique on HAM10000 dataset. (a)–(g) Original images, proposed segmented without postprocessing, proposed with post-processing, proposed with final refinement, proposed mapped on the original image, ground truth image, and compare proposed segmented and ground truth
This work proposed a novel skin lesion classification and localization framework using dermoscopic images. The proposed framework begins with dataset augmentation and ends with lesion localization. In the augmentation process, the imbalanced issue was resolved, increasing the training accuracy. Before the augmentation process, the training accuracy of both proposed models was 84.1% and 88.2% for the HAM10000 dataset (QuadRes-Net and PentRes-Net) and 90.2% and 94.5% for the ISIC2019 dataset, respectively. After the augmentation process, the accuracy improved by up to 5% for both datasets. The models were trained using the Bayesian optimization approach instead of the selection of literature knowledge-based hyperparameters. The trained model’s features are extracted from the testing data and fused using a novel technique that improves the accuracy and reduces the computational time. The proposed framework obtained final classification accuracy of 90.8% and 99.3% for HAM10000 and ISIC2019 datasets, respectively. The localization accuracy is also computed for the HAM10000 dataset, and 91.6% accuracy was obtained. A comparison was also conducted with SOTA, showing that the proposed framework has improved accuracy and precision rates.
Despite the numerous advantages, the most notable limitation of these networks lies in their requirement for exceedingly deep architectures, leading to a substantial amount of computational load. This research’s strength lies in developing innovative models with fewer residual blocks and weight layers, resulting in reduced computational requirements while achieving improved accuracy in disease diagnosis compared to the ResNet, Densenet, and Inception architectures. In the future, addressing this limitation could involve the implementation of an optimization algorithm to choose the most influential features.
Acknowledgement: The National Research Foundation of Korea (NRF) grant funded by the Korea government (*MSIT) (No. 2018R1A5A7059549) and Princess Nourah bint Abdulrahman University Researchers Supporting Project number (PNURSP2025R508), Princess Nourah bint Abdulrahman University, Riyadh, Saudi Arabia provided invaluable assistance during the experimental work, for which the authors are quite grateful.
Funding Statement: This work was supported by the National Research Foundation of Korea (NRF) grant funded by the Korea government (*MSIT) (No. 2018R1A5A7059549). This work was supported through Princess Nourah bint Abdulrahman University Researchers Supporting Project number (PNURSP2025R508), Princess Nourah bint Abdulrahman University, Riyadh, Saudi Arabia.
Author Contributions: Conceptualization, Design, Software, Methodology, and Original Writeup: Veena Dillshad, Muhammad Attique Khan, Muhammad Nazir, Jawad Ahmad. Methodology, Funding, Validation, and Project Administration: Dina Abdulaziz AlHammadi, Taha Houda, Hee-Chan Cho. Supervision, Funding, and Review Draft: Byoungchol Chang. All authors reviewed the results and approved the final version of the manuscript.
Availability of Data and Materials: Datasets of this work are publically available for the research purposes: https://dataverse.harvard.edu/dataset.xhtml?persistentId=doi:10.7910/DVN/DBW86T (accessed on 27 February 2025), https://challenge.isic-archive.com/data/#2019 (accessed on 27 February 2025).
Ethics Approval: Not applicable.
Conflicts of Interest: The authors declare no conflicts of interest to report regarding the present study.
References
1. Dzieniszewska A, Garbat P, Piramidowicz R. Improving skin Lesion segmentation with self-training. Cancers. 2024;16(2):1120. [Google Scholar] [PubMed]
2. Sulthana R, Chamola V, Hussain Z, Albalwy F, Hussain A. A novel end-to-end deep convolutional neural network based skin lesion classification framework. Expert Syst Appl. 2024;246(5):123056. [Google Scholar]
3. Richard M, Paul C, Nijsten T, Gisondi P, Salavastru C. Prevalence of most common skin diseases in Europe: a population-based study. J Eur Acad Dermatol Venereol. 2022;36(11):1088–96. [Google Scholar] [PubMed]
4. Din S, Mourad O, Serpedin E. LSCS-Net: a lightweight skin cancer segmentation network with densely connected multi-rate atrous convolution. Comput Biol Med. 2024;11(3):108303. [Google Scholar]
5. Olsen CM, Thompson JF, Pandeya N, Whiteman DC. Evaluation of sex-specific incidence of melanoma. JAMA Dermatol. 2020;156(6):553–60. [Google Scholar] [PubMed]
6. Giuffrida R, Conforti C, Di Meo N, Deinlein T, Zalaudek I. Use of noninvasive imaging in the management of skin cancer. Curr Opin Oncol. 2020;32(4):98–105. [Google Scholar] [PubMed]
7. Kittler H, Pehamberger H, Wolff K, Binder M. Diagnostic accuracy of dermoscopy. Lancet Oncol. 2002;3(6):159–65. [Google Scholar] [PubMed]
8. Campos-do-Carmo G, Ramos-e-Silva M. Dermoscopy: basic concepts. Int J Dermatol. 2008;47(10):712–9. [Google Scholar] [PubMed]
9. Chatterjee S, Dey D, Munshi S, Gorai S. Dermatological expert system implementing the ABCD rule of dermoscopy for skin disease identification. Expert Syst Appl. 2021;167(2):114204. [Google Scholar]
10. Jütte L, González-Villà S, Quintana J, Steven M, Garcia R, Roth B. Integrating generative AI with ABCDE rule analysis for enhanced skin cancer diagnosis, dermatologist training and patient education. Front Med. 2024;11(3):1445318. [Google Scholar]
11. Hasan MK, Ahamad MA, Yap CH, Yang G. A survey, review, and future trends of skin lesion segmentation and classification. Comput Biol Med. 2023;155:106624. [Google Scholar] [PubMed]
12. Li Z, Zhang N, Gong H, Qiu R, Zhang W. SG-MIAN: self-guided multiple information aggregation network for image-level weakly supervised skin lesion segmentation. Comput Biol Med. 2024;170:107988. [Google Scholar] [PubMed]
13. Nguyen ATP, Jewel RM, Akter A. Comparative analysis of machine learning models for automated skin cancer detection: advancements in diagnostic accuracy and AI integration. Am J Medical Sci Pharm Res. 2025;7:15–26. [Google Scholar]
14. Ahmad I, Amin J, Lali MI, Abbas F, Sharif MI. A novel Deeplabv3+ and vision-based transformer model for segmentation and classification of skin lesions. Biomed Signal Process Control. 2024;92:106084. [Google Scholar]
15. Kalaivani A, Karpagavalli S. Bootstrapping of fine-tuned segmentation and classification network for epidermis disorder categorization. Multimed Tools Appl. 2024;83:18907–17. [Google Scholar]
16. Attallah O. Skin-CAD: explainable deep learning classification of skin cancer from dermoscopic images by feature selection of dual high-level CNNs features and transfer learning. Comput Biol Med. 2024;178:108798. [Google Scholar] [PubMed]
17. Yeasmin MN, Amin MAl, Joti TJ, Aung Z, Azim MA. Advances of AI in image-based computer-aided diagnosis: a review. Array. 2024;23:100357. [Google Scholar]
18. Amiri Z, Heidari A, Navimipour NJ, Esmaeilpour M, Yazdani Y. The deep learning applications in IoT-based bio-and medical informatics: a systematic literature review. Neural Comput Appl. 2024;36:5757–97. [Google Scholar]
19. Vakili A, Al-Khafaji HMR, Darbandi M, Heidari A, Jafari Navimipour N, Unal M. A new service composition method in the cloud-based internet of things environment using a grey wolf optimization algorithm and MapReduce framework. Concurr Comput. 2024;36:e8091. [Google Scholar]
20. Pacal I, Ozdemir B, Zeynalov J, Gasimov H, Pacal N. A novel CNN-ViT-based deep learning model for early skin cancer diagnosis. Biomed Signal Process Control. 2025;104:107627. [Google Scholar]
21. Dong C, Dai D, Zhang Y, Zhang C, Li Z, Xu S. Learning from dermoscopic images in association with clinical metadata for skin lesion segmentation and classification. Comput Biol Med. 2023;152(1):106321. doi:10.1016/j.compbiomed.2022.106321. [Google Scholar] [PubMed] [CrossRef]
22. Ozdemir B, Pacal I. A robust deep learning framework for multiclass skin cancer classification. Sci Rep. 2025;15(1):4938. doi:10.1038/s41598-025-89230-7. [Google Scholar] [PubMed] [CrossRef]
23. Zhang Q, Li C, Zuo S, Cai Y, Xu A, Huang H, et al. The impact of multiclass information decoupling in latent space on skin lesion segmentation. Neurocomputing. 2025;617:128962. [Google Scholar]
24. Khan MA, Sharif MI, Raza M, Anjum A, Saba T, Shad SA. Skin lesion segmentation and classification: a unified framework of deep neural network features fusion and selection. Expert Syst. 2022;39(7):e12497. doi:10.1111/exsy.12497. [Google Scholar] [CrossRef]
25. Kaur R, GholamHosseini H, Sinha R. Skin lesion segmentation using an improved framework of encoder-decoder based convolutional neural network. Int J Imaging Syst Technol. 2022;32(4):1143–58. doi:10.1002/ima.22699. [Google Scholar] [CrossRef]
26. Anand V, Gupta S, Koundal D, Singh K. Fusion of U-Net and CNN model for segmentation and classification of skin lesion from dermoscopy images. Expert Syst Appl. 2023;213(7):119230. doi:10.1016/j.eswa.2022.119230. [Google Scholar] [CrossRef]
27. Yadav AK, Mehta R, Kumar V, Medikondu NR. An optimized boosting framework for skin lesion segmentation and classification. Multimed Tools Appl. 2023;83(18):53875–96. doi:10.1007/s11042-023-17042-w. [Google Scholar] [CrossRef]
28. Wang Y, Su J, Xu Q, Zhong Y. A collaborative learning model for skin lesion segmentation and classification. Diagnostics. 2023;13(5):912. doi:10.3390/diagnostics13050912. [Google Scholar] [PubMed] [CrossRef]
29. Hosny KM, Said W, Elmezain M, Kassem MA. Explainable deep inherent learning for multi-classes skin lesion classification. Appl Soft Comput. 2024;159(3):111624. doi:10.1016/j.asoc.2024.111624. [Google Scholar] [CrossRef]
30. Su Q, Hamed HNA, Isa MA, Hao X, Dai X. A GAN-based data augmentation method for imbalanced multiclass skin lesion classification. IEEE Access. 2024;12(1):16498–513. doi:10.1109/ACCESS.2024.3360215. [Google Scholar] [CrossRef]
31. Maqsood S, Damaševičius R. Multiclass skin lesion localization and classification using deep learning based features fusion and selection framework for smart healthcare. Neural Netw. 2023;160(4):238–58. doi:10.1016/j.neunet.2023.01.022. [Google Scholar] [PubMed] [CrossRef]
32. Benyahia S, Meftah B, Lézoray O. Multi-features extraction based on deep learning for skin lesion classification. Tissue Cell. 2022;74(22):101701. doi:10.1016/j.tice.2021.101701. [Google Scholar] [PubMed] [CrossRef]
33. Ayas S. Multiclass skin lesion classification in dermoscopic images using swin transformer model. Neural Comput Appl. 2023;35(9):6713–22. doi:10.1007/s00521-022-08053-z. [Google Scholar] [CrossRef]
34. Zafar M, Amin J, Sharif M, Anjum MA, Mallah GA, Kadry S. DeepLabv3+-based segmentation and best features selection using slime mould algorithm for multiclass skin lesion classification. Mathematics. 2023;11(2):364. [Google Scholar]
35. Bibi S, Khan MA, Shah JH, Damaševičius R, Alasiry A, Marzougui M, et al. MSRNet: multiclass skin lesion recognition using additional residual block based fine-tuned deep models information fusion and best feature selection. Diagnostics. 2023;13(19):3063. doi:10.3390/diagnostics13193063. [Google Scholar] [PubMed] [CrossRef]
36. Kadirappa R, Deivalakshmi S, Pandeeswari R, Ko S-B. An automated multiclass skin lesion diagnosis by embedding local and global features of Dermoscopy images. Multimed Tools Appl. 2023;82(22):34885–912. doi:10.1007/s11042-023-14892-2. [Google Scholar] [CrossRef]
37. Dillshad V, Khan MA, Nazir M, Saidani O, Alturki N, Kadry S. D2LFS2Net: multiclass skin lesion diagnosis using deep learning and variance-controlled Marine Predator optimisation: an application for precision medicine. CAAI Trans Intell Technol. 2025;10(1):207–22. doi:10.1049/cit2.12267. [Google Scholar] [CrossRef]
38. Radhika V, Chandana BS. MSCDNet-based multiclass classification of skin cancer using dermoscopy images. PeerJ Comput Sci. 2023;9(3):e1520. doi:10.7717/peerj-cs.1520. [Google Scholar] [PubMed] [CrossRef]
39. Baig AR, Abbas Q, Almakki R, Ibrahim ME, AlSuwaidan L, Ahmed AE. Light-Dermo: a lightweight pretrained convolution neural network for the diagnosis of multiclass skin lesions. Diagnostics. 2023;13(3):385. doi:10.3390/diagnostics13030385. [Google Scholar] [PubMed] [CrossRef]
40. Alsahafi YS, Kassem MA, Hosny KM. Skin-Net: a novel deep residual network for skin lesions classification using multilevel feature extraction and cross-channel correlation with detection of outlier. J Big Data. 2023;10(1):105. doi:10.1186/s40537-023-00769-6. [Google Scholar] [CrossRef]
41. Abou Ali M, Dornaika F, Arganda-Carreras I, Ali H, Karaouni M. Naturalize revolution: unprecedented AI-Driven precision in skin cancer classification using deep learning. BioMedInformatics. 2024;4:638–60. [Google Scholar]
42. Tuncer T, Barua PD, Tuncer I, Dogan S, Acharya UR. A lightweight deep convolutional neural network model for skin cancer image classification. Appl Soft Comput. 2024;162:111794. [Google Scholar]
43. Musthafa MM, Mahesh TR, Vinoth Kumar V, Guluwadi S. Enhanced skin cancer diagnosis using optimized CNN architecture and checkpoints for automated dermatological lesion classification. BMC Med Imaging. 2024;24:201. [Google Scholar] [PubMed]
44. Tschandl P, Rosendahl C, Kittler H. The HAM10000 dataset, a large collection of multi-source dermatoscopic images of common pigmented skin lesions. Sci Data. 2018;5:180161. [Google Scholar] [PubMed]
45. Kassem MA, Hosny KM, Fouad MM. Skin lesions classification into eight classes for ISIC, 2019 using deep convolutional neural network and transfer learning. IEEE Access. 2020;8:114822–32. [Google Scholar]
46. Li D, Wang Z, Cao C, Liu Y. Information entropy based sample reduction for support vector data description. Appl Soft Comput. 2018;71:1153–60. [Google Scholar]
47. Hoang L, Lee S-H, Lee E-J, Kwon K-R. Multiclass skin lesion classification using a novel lightweight deep learning framework for smart healthcare. Appl Sci. 2022;12(5):2677. [Google Scholar]
48. Popescu D, El-Khatib M, Ichim L. Skin lesion classification using collective intelligence of multiple neural networks. Sensors. 2022;22(12):4399. [Google Scholar] [PubMed]
49. Neeshma A, Nair CS. Multiclass skin lesion classification using densenet. In: 2022 Third International Conference on Intelligent Computing Instrumentation and Control Technologies (ICICICT); 2022; Kannur, India. p. 506–10. [Google Scholar]
50. Shobha Y, Prasad K, Anuradha SG. Multiclass classification of skin cancer using convolutional neural network. In: IEEE 2nd Mysore Sub Section International Conference (MysuruCon); 2022; Mysuru, India. p. 1–5. [Google Scholar]
51. Jaehyo C, John P, Chibuike O. Performance comparison of deep learning models for skin disease classification using the HAM10000 dataset. In: Proceedings of KIIT Conference; 2024; Odisha, India. p. 1142–6. [Google Scholar]
52. Khan AR, Mujahid M, Alamri FS, Saba T, Ayesha N. Early-stage melanoma cancer diagnosis framework for imbalanced data from dermoscopic images. Microsc Res Tech. 2024;8(2):1–21. [Google Scholar]
Cite This Article
 Copyright © 2025 The Author(s). Published by Tech Science Press.
This work is licensed under a Creative Commons Attribution 4.0 International License , which permits unrestricted use, distribution, and reproduction in any medium, provided the original work is properly cited.
 Downloads
 Citation Tools