
 Submit a Paper
 Propose a Special lssue
 Open Access
ARTICLE
A Bayesian Optimized Stacked Long Short-Term Memory Framework for Real-Time Predictive Condition Monitoring of Heavy-Duty Industrial Motors
Department of Computer Engineering, University of Engineering & Technology, Lahore, 54890, Punjab, Pakistan
* Corresponding Author: Mudasir Dilawar. Email:
(This article belongs to the Special Issue: Advanced Algorithms for Feature Selection in Machine Learning)
Computers, Materials & Continua 2025, 83(3), 5091-5114. https://doi.org/10.32604/cmc.2025.064090
Received 05 February 2025; Accepted 21 April 2025; Issue published 19 May 2025
 View Full Text
 Download PDF
Abstract
In the era of Industry 4.0, condition monitoring has emerged as an effective solution for process industries to optimize their operational efficiency. Condition monitoring helps minimize unplanned downtime, extending equipment lifespan, reducing maintenance costs, and improving production quality and safety. This research focuses on utilizing Bayesian search-based machine learning and deep learning approaches for the condition monitoring of industrial equipment. The study aims to enhance predictive maintenance for industrial equipment by forecasting vibration values based on domain-specific feature engineering. Early prediction of vibration enables proactive interventions to minimize downtime and extend the lifespan of critical assets. A data set of load information and vibration values from a heavy-duty industrial slip ring induction motor (4600 kW) and gearbox equipped with vibration sensors is used as a case study. The study implements and compares six machine learning models with the proposed Bayesian-optimized stacked Long Short-Term Memory (LSTM) model. The hyperparameters used in the implementation of models are selected based on the Bayesian optimization technique. Comparative analysis reveals that the proposed Bayesian optimized stacked LSTM outperforms other models, showcasing its capability to learn temporal features as well as long-term dependencies in time series information. The implemented machine learning models: Linear Regression (LR), Random Forest (RF), Gradient Boosting Regressor (GBR), Extreme Gradient Boosting (XGBoost), Light Gradient Boosting Machine (LightGBM), and Support Vector Regressor (SVR) displayed a mean squared error of 0.9515, 0.4654, 0.1849, 0.0295, 0.2127 and 0.0273, respectively. The proposed model predicts the future vibration characteristics with a mean squared error of 0.0019 on the dataset containing motor load information and vibration characteristics. The results demonstrate that the proposed model outperforms other models in terms of other evaluation metrics with a mean absolute error of 0.0263 and 0.882 as a coefficient of determination. Current research not only contributes to the comparative performance of machine learning models in condition monitoring but also showcases the practical implications of employing these techniques. By transitioning from reactive to proactive maintenance strategies, industries can minimize downtime, reduce costs, and prolong the lifespan of crucial assets. This study demonstrates the practical advantages of transitioning from reactive to proactive maintenance strategies using ML-based condition monitoring.Keywords
We are currently in the era of Industry 4.0 where data is a useful asset for improving efficiency and performance rather than being a historical byproduct. Industry 4.0 includes the automation of industrial equipment by integrating it with digital equipment. In this industrial revolution, machines, sensors, devices, and workers are interconnected with each other through the Internet of Things (IoT) [1]. These sensors and smart devices, integrated with digital equipment, enable the recording of large volumes of historical data which can be helpful in many ways [2]. These machines and devices are also connected through the cloud for remote monitoring and control. Digitization of industrial operations has led to real-time monitoring and data-driven decision-making for maintaining equipment health and preventing unexpected failures. As industries generate vast amounts of operational data, advanced analytics, and intelligent maintenance strategies are required to extract meaningful insights and enhance asset reliability. Condition Monitoring (CM) has emerged as one of the effective solutions to this challenge with promising results. CM is a type of predictive maintenance that uses sensors and gauge data (such as vibration, temperature, and pressure) to analyze the condition of machines over time. Process industries, utilizing heavy machinery and continuous operations, need to keep a balance between maximum production, apparatus reliability, and minimizing downtime. It is not only cost-effective but also provides a proactive approach to maintenance rather than traditional reactive approaches.
Traditional maintenance strategies usually rely on fixed schedules or basic rule-based systems which can lead to ineffective resource utilization and unnecessary downtime. In contrast, CM is a proactive approach that uses sensor data to forecast potential failures or unexpected events before they occur. It primarily relies on advanced technologies like Machine Learning (ML) and time series analysis. ML algorithms identify hidden patterns and anomalies from historical data to anticipate potential issues [3]. These forecasts enable organizations to schedule maintenance activities only when needed. This proactive maintenance results in reduced downtime and maintenance costs while increasing the life span and reliability of critical parts of machinery [4].
The current study contributes to implementing and evaluating ML techniques capable of forecasting vibration values for a heavy-duty slip ring induction motor and gearbox. The current study intends to enhance the use of ML techniques for CM systems by addressing the need for forecasting vibration values based on historical data. The forecasted vibration values can be used to reduce downtime and avoid unplanned maintenance by proactively studying the cause of abnormal vibration. The predicted vibration values can help in the early detection of fault scenarios like bearing wear, imbalance of equipment, etc. Future vibration predictions can help maintenance personnel to plan the maintenance schedules accordingly. It also facilitates timely intervention to reduce downtime, improve safety, reduce maintenance costs, and prolong the equipment’s lifetime.
This paper explores CM in process industries, primarily focusing on a specific case study involving a heavy-duty industrial slip ring induction motor with multiple vibration sensors. Current research is focused on the implementation of an intelligent CM system by utilizing ML and time series analysis. Data collected includes motor load information and vibration sensor data, later used to train models capable of predicting future values of sensors at different points. The presented work aims to contribute to the practical implementation of state-of-the-art ML techniques in process industries. Current research encourages the adoption of these smart technologies by local as well as international industries by demonstrating the benefits of CM in enhancing operational efficiency and reducing costs.
This study implements six ML models including LR, RF GBR, XGBoost, LightGBM, and SVR. Bayesian Optimization algorithm is used to select the optimal hyperparameters for the training purpose. Finally, a Bayesian-optimized stacked LSTM (BOS-LSTM) is proposed which outperforms other conventional models. The BOS-LSTM architecture and its hyperparameters, including the number of layers and units, are optimized using the Bayesian algorithm. For performance evaluation of predicted values, Mean Squared Error (MSE) as well as other evaluation metrics Mean Absolute Error (MAE) and coefficient of determination (R2) Score are used for regression problems. MSE measures the average squared difference between actual and predicted values. MAE calculates the average absolute difference between actual and predicted values. R2 measures how well a model explains the variance in data by dividing the sum of variance in predicted values by the sum of variance in actual values. A lower MSE and MAE indicate better predictive performance while a R2 value closer to 1 shows better performance. The mathematical formulas of MSE, MAE, and R2 are provided in Eqs. (1)–(3). The present work implements seven different algorithms with their details mentioned in the material and methods sections.
where n is the total number of samples in the test set,
The related work section shows that in the field of CM, there is a need for large-scale industrial datasets for regression problems as well as hyperparameter optimization. This paper provides a framework for searching the domain-specific deep learning (DL) model’s architecture. The primary objective is to develop an efficient predictive model that can accurately estimate vibration patterns and vibration characteristics in industrial motors. The current study aims to contribute to applying regression algorithms for predicting future vibration values for industrial environments. A dataset comprised of approximately 1.5 years of load and vibrational data from a large-sized industrial motor is collected in the current study. This contribution will help industries utilize the historical data even if the fault logs (labels) are not maintained along with the sensor data. Predicting the vibration values will allow process industries to take proactive actions before the occurrence of faults.
A graphical abstract to show the overall flow and major steps of the current study is provided in Fig. 1. As shown in Fig. 1, the first step of the current study involves a collection of vibration and load valus dataset from an industrial sector. The dataset is collected from pre-installed sensors used in the CM of the industrial setup. The data collected is then preprocessed and further used for training seven different models on the dataset. Preprocessing of the dataset includes merging the dataset from different sheets into 1, datatypes conversion of a few columns, removing dead signals or missing values, etc. The next step of the current study is to design the ML and DL model architectures using a Bayesian optimization algorithm. Bayesian-optimized models are further used for training on the dataset in the next step. The last step of the current study is to evaluate models on the validation dataset using different performance metrics.
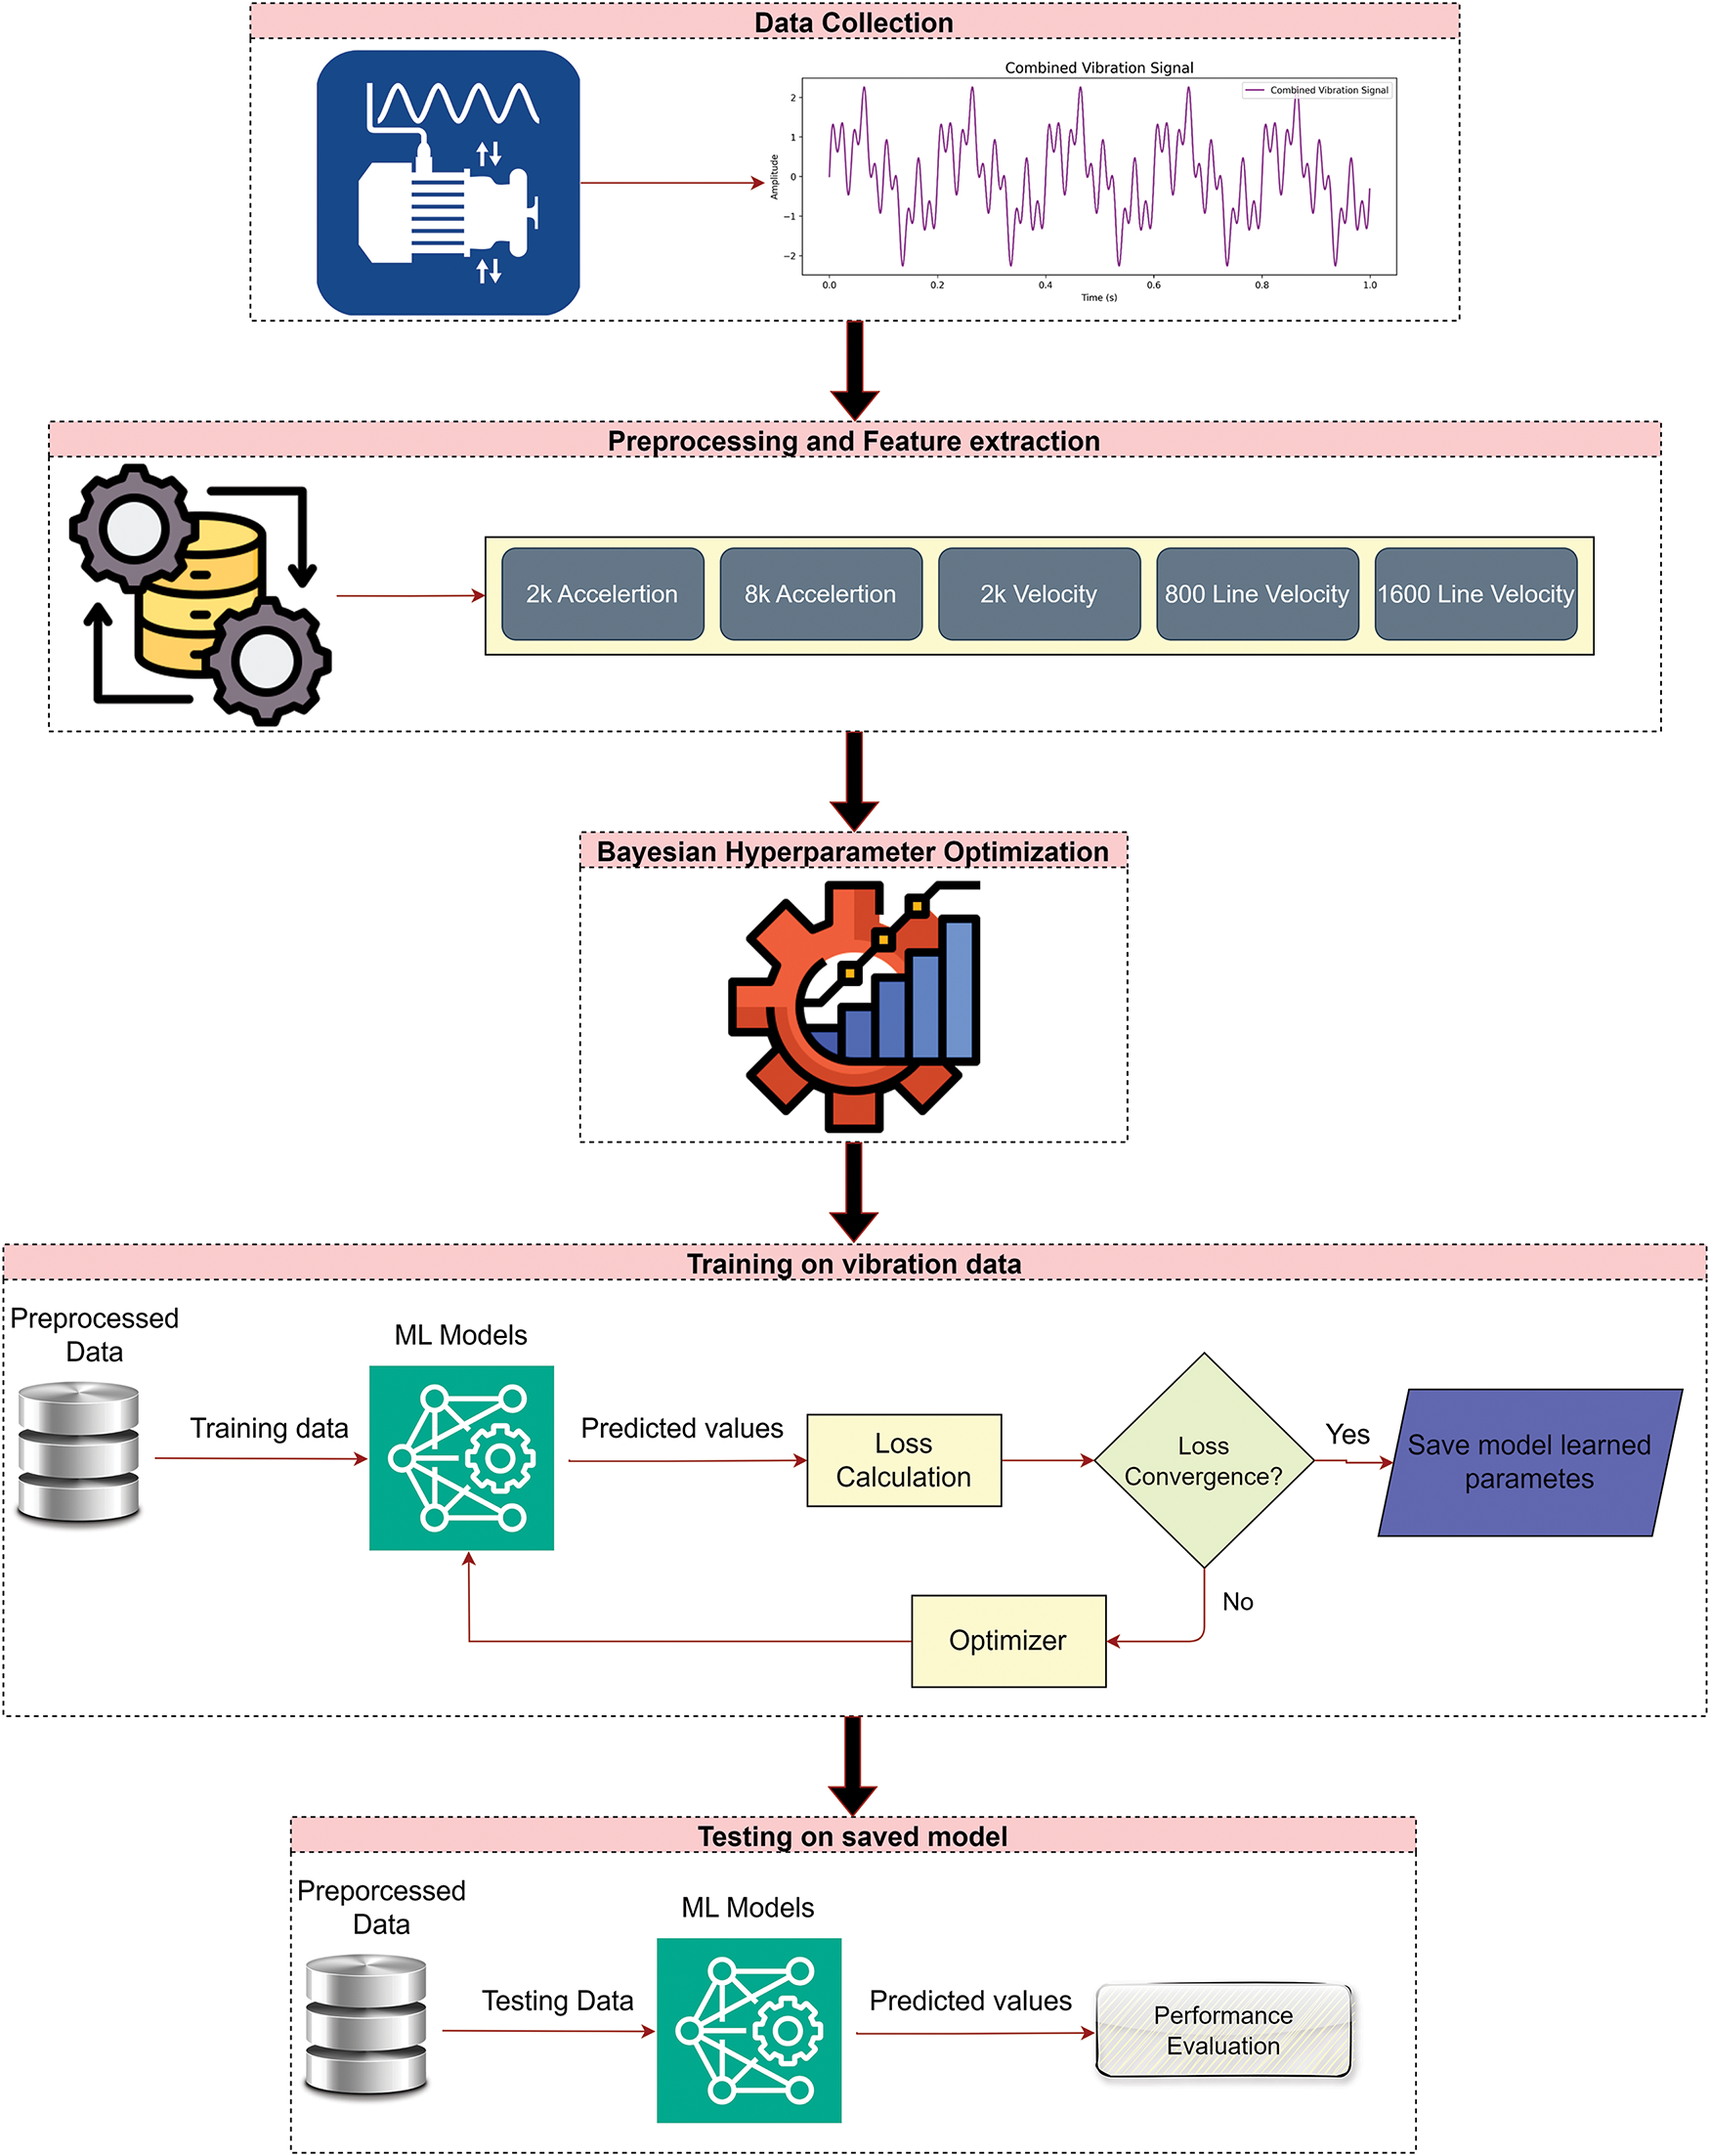
Figure 1: Flow chart of proposed modeling and evaluation framework
The remaining paper is organized as follows: The related work section provides a detailed view of the evolution of CM application in diverse industrial operations. The related work is followed by a materials and methods section explaining the data collection process, preprocessing techniques, and the details of the proposed methodology. The results section discusses the performance of the implemented model in terms of different performance evaluation metrics to observe the effectiveness of the proposed model. The paper concludes by discussing our findings as well as highlighting the significance of proactive maintenance strategies in industrial operations and lastly providing future research directions in the conclusion and future work section.
The integration of industrial equipment with digital devices in Industry 4.0, enables the collection of large volumes of data from different units and sectors of industry [5] along with the faster exchange of data and other benefits. The collected data contains information on the whole production unit including sensor data, load conditions, events, and fault scenarios along with the alarms and warnings generated. This data can yield valuable insights after thorough processing and analysis. Analysis and interpretation of the data can help in numerous ways like planned maintenance resulting in a reduction of maintenance costs. It can also help in increasing production hours by predicting and avoiding faults, improving safety for the industry workers, increasing the critical part’s life duration, and many more [6,7].
Above mentioned advantages of CM have encouraged researchers to work in this direction to avoid unexpected shutdowns and better equipment maintenance. Schneider et al. [8] used an automatic system for feature extraction, selection, and classification of time-series data. This study implements various feature extraction algorithms followed by feature selection techniques. A mixed classification algorithm is applied to the extracted features from the previous step for the sake of classification of different situations in the system. A fuzzy alarm system was proposed by Vafaei et al. in 2018 for the early prediction of failures in the car production industry by analyzing the degradation of equipment [9]. Data set is collected from a car manufacturing industry and four attributes are used as input variables to estimate the equipment degradation.
Dong et al. proposed a method to predict the Time-To-Failure (TTF) of industrial manufacturing systems by updating the TTF calculated from the historical data provided by the original equipment manufacturer and real-time CM of the system [10]. In this study, 200 sets of signals are collected to represent the degradation of each of the six machines used in experimentation. Out of these 200 sets, 100 are considered historical data, and the remaining 100 are utilized as real-time data for condition and TTF estimation. A condition-based monitoring technique for appropriate decision-making including no action required or type of correction measure required was proposed by Wei et al. in 2019 [11]. This research also examines the effects of external shocks on the deterioration of systems thus affecting the health condition of the systems.
A prescriptive maintenance model named PriMa was proposed by Ansari et al. [12] based on a knowledge-based maintenance system for production systems. The proposed model consists of operation data collection for process, machine, and product from the production line. This collected data is stored in a data warehouse and further processed by a predictive and analytical toolbox to extract error-based, similarity-based, information-based, and probability-based features. These extracted features are integrated with semantic-based features extracted by textual analysis (from the text passages documented for the failures) to provide a comprehensive recommender and decision support system.
Abbate et al. proposed a statistical distribution-based approach to investigate future values along with alarming situations based on current values. The approach involves a collection of data from an industrial sector electric motor. Historical sensor data of the motor is being used to estimate the statistical distribution of the signals. Estimated distribution of data as well as actual data are further used to simulate the vibration trends which eventually help in the detection of any signals in the future trends that may lead to equipment failures. This twin approach also helps in the estimation of the maintenance schedule before the occurrence of any failure based on future values [13].
Strakosch et al. focused on designing a CM system for gearbox applications operating on heavy loads. The study is primarily focused on investigating the performance of different sensors in different conditions, especially for rolling bearings. Along with the sensor’s performance evaluation, the authors proposed to use Fourier transforms (FT), wavelet Analysis and Envelope Curve Analysis (ECA), and targeted vibration analysis specific to the application in the industry. The authors described the usage of FT for the detection and cancellation of noise and other equipment frequencies, and ECA for pulse and error frequencies [14].
Ansari et al. proposed a special type of Bayesian Network (BN) called Dynamics Bayesian Network (DBN) for the early prediction of failures and calculated the effect of predictions on the production and planning system. The proposed framework of the Bayesian network consists of three basic components: (1). Nodes: each node represents a single feature. (2). Edges: Each edge is a directed connection between two nodes and (3). Conditional probabilities: A table containing the conditional probability of each node related to other nodes. This proposed DBN aids in the prediction of failures but also helps in understanding the cause-and-effect relationships and better maintenance strategies [15].
An ensemble technique for the prediction of the remaining life of the woodworking industry machines is proposed by the authors. The authors proposed that adequate results can be achieved by using a built-in log file system of the events occurring in machines for a cost-effective solution rather than the installation of new sensors and CM systems. The models used in the research are Random Forest, Gradient Boosting, and Extreme Gradient Boosting which are known as tree-based classification models. Experiments show that the gradient-boosting model outperformed the other two models by providing 98.9% accuracy [16].
A review paper [17] presented by Schwendemann and co-authors summarized the work done by researchers on bearing fault classification, fault location estimation, e.g., inner or outer side of the ring, and the intensity of fault condition. This review paper also provides an overview of the past works done for the calculation of the remaining lifetime of the bearing based on different input datasets. Literature surveys show that different ML techniques, e.g., Auto-encoder techniques [18], genetic and ML algorithms [19], and DL techniques [20–22] have been used for either classification of bearing faults or prediction of the remaining useful lifetime of the bearings.
A CM system based on potential failure curves and similarity checks using clustering algorithms is used by authors for the early prediction of failures of high-value assets of an industry. After determining the high-value assets of the industry, the system checks sensor values and applies FMECA (Failure Mode, Effects & Criticality Analysis) to determine the criticality level of the equipment failure. If the criticality level is medium or high, then some default actions, e.g., failure finding, and redesigning are implemented along with proactive actions which are decided by the clustering framework. Authors proposed to use three or four-stage group division to cluster equipment in one of the categories, e.g., Healthy, Good with no action required, Good with close monitoring, and Failure soon categories [23].
A dataset of vibration, sound, temperature, and motor current of the bearing as well as vibration is examined with two labels Healthy-bearing and damaged-bearing. The data collected is modeled for classification with popular ML algorithms such as support vector machine (SVM), linear discrimination analysis (LDA), random forest (RF), decision tree (DT), and k-nearest neighbor (kNN). The models are evaluated with accuracy, precision, F1 score, and a few other metrics. During the evaluation of all models, it was observed that with the increase in the number of features in the data set, the accuracy metrics improved. Authors claim that the SVM gave the best accuracy while DT is the best among others for giving adequate results with less computational complexity [24].
Recent work in the field of times series data, in general, and particularly in CM demonstrates the use of Autoregressive integrated moving average (ARIMA) [25–27], Recurrent Neural Network (RNN) [28], Long Short-Term Memory (LSTM) or combination of these models with other models [29–31]. A combination of LSTM-Autoencoders with Transformer encoders is proposed by the authors [32] on multivariate time-series data to model how various parameters evolve and influence each other over time. The proposed model is evaluated using a dataset from the metal processing industry for estimating the remaining useful life (RUL) of production equipment. There are three labels in the dataset as follows: 3–4 days RUL, 2–3 days RUL, and 1-day RUL. Multiple experiments are conducted and a maximum of 87% overall accuracy is achieved.
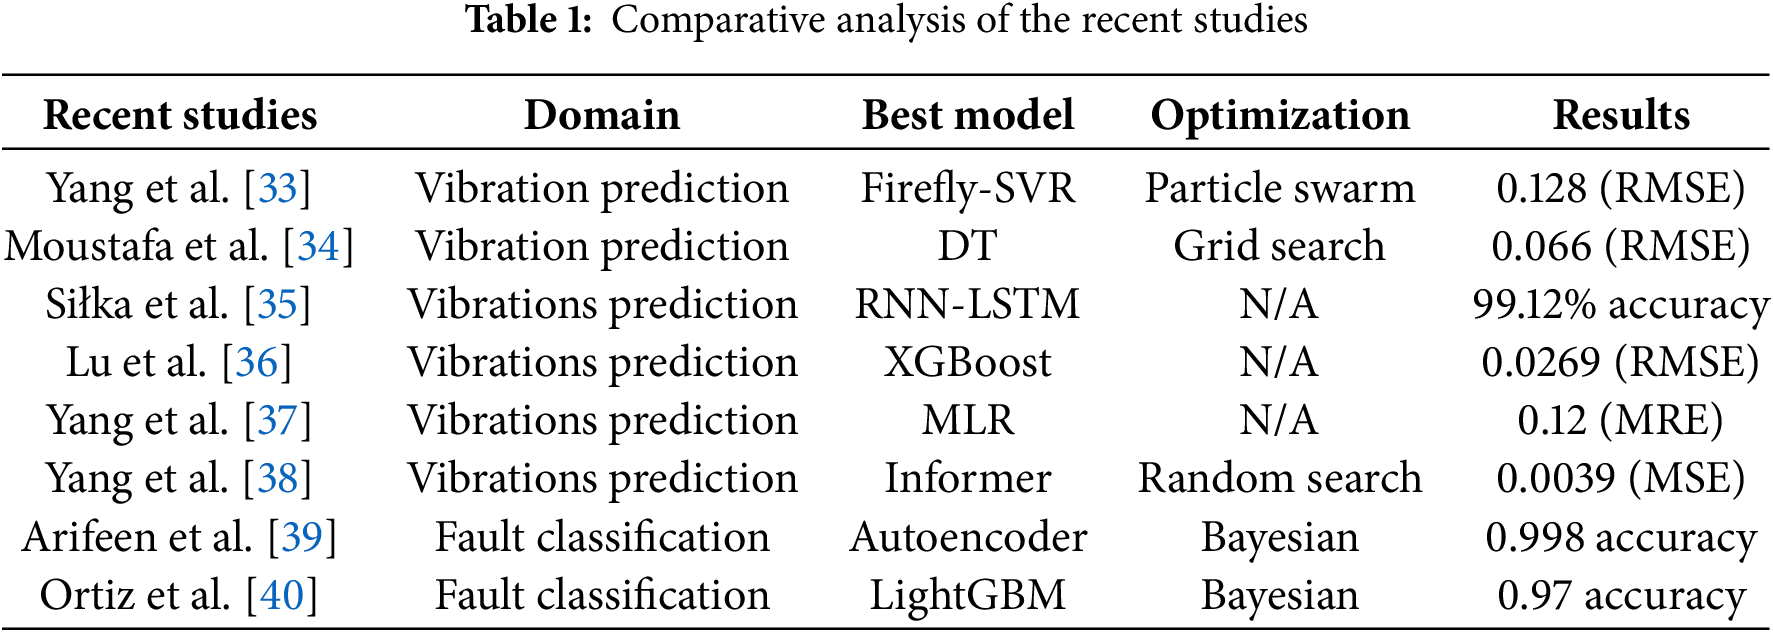
The authors proposed and compared several variants of Support Vector Regressor (SVR) for the prediction of vibrational velocity values of mine blasting [33]. Moustafa et al. [34] presented a comparative study of various ML models for the prediction of ground vibration values. It was observed through experimentation that the Decision Tree (DT) outperformed other algorithms in terms of lower Root mean Squared error (RMSE) and other evaluation metrics. In 2022, Siłka et al. [35] proposed to use RNN-LSTM for the prediction of vibration values from high-speed train time series data. Recent studies show the uses of XGBoost [36] and Multiple Linear Regression (MLR) [37] models for the prediction of vibration values of mill and tunnel boring machines, respectively. Yang et al. used CNN, Deep RNN, LSTM, and informer methods for the prediction of vibration values of a motor and achieved a low MSE of 0.0039 for the informer method on bearing-related dataset (IMS) [38].
Bayesian hyperparameter optimization is a powerful technique for enhancing CM in various industrial applications [39]. Ortiz et al. [40] developed a framework for bearing fault simulation by using Bayesian optimization for hyperparameters tunning. The authors showed the efficiency of Bayesian optimization over traditional techniques in predictive maintenance, achieving an accuracy of more than 0.97 in fault classification. Zhang et al. [41] explored the use of Bayesian optimization for selecting optimal acoustic features in machine fault diagnosis. The authors demonstrated that this method effectively enhances the performance of ML models by identifying the important features for specific tasks. Recent studies [42,43] proposed to use of Bayesian optimization with one-dimensional convolutional models and autoencoders for monitoring industrial equipment health. The findings of these studies indicate that this approach significantly improved both accuracy and training time compared to conventional methods. Table 1 provides a comprehensive summary of recent studies in vibration prediction and fault classification. Table 1 presents key details, including the domain, best-performing models, optimization techniques, and evaluation results used in the recent studies on CM.
Despite rapid advancements in CM techniques, the field remains open for further research due to the lack of generalized high-performance solutions for complex industrial environments. Predictive maintenance solutions are still underexplored in the context of challenges of complex industrial environments including large industrial datasets [44]. Literature work shows that the contribution of data-driven techniques in classification tasks is more than the regression tasks as well as the need for large size industrial related datasets [45]. There is a need to explore the hyperparameter search space suitable for CM problems in regression problems.
This section describes the data collection process, preprocessing steps, and implementation details of the study. CM-related vibration characteristics data is collected from a heavy-duty industrial motor and processed as per the requirements of the models. During the training phase, Bayesian hyperparameter optimization search-based hyperparameters and architectures are considered to get the optimum performance from each model. After achieving optimal performance, the models are saved for testing on unseen datasets. Six state-of-the-art regression models are being evaluated on the dataset collected. The proposed BOS-LSTM model is trained on the same dataset and evaluated with the same evaluation strategy for the sake of comparison. The current study presents a robust framework for vibration prediction in industrial motors using ML and DL. The proposed methodology follows a structured approach comprising data collection, preprocessing, hyperparameter optimization, model training, and evaluation. These steps are explained below.
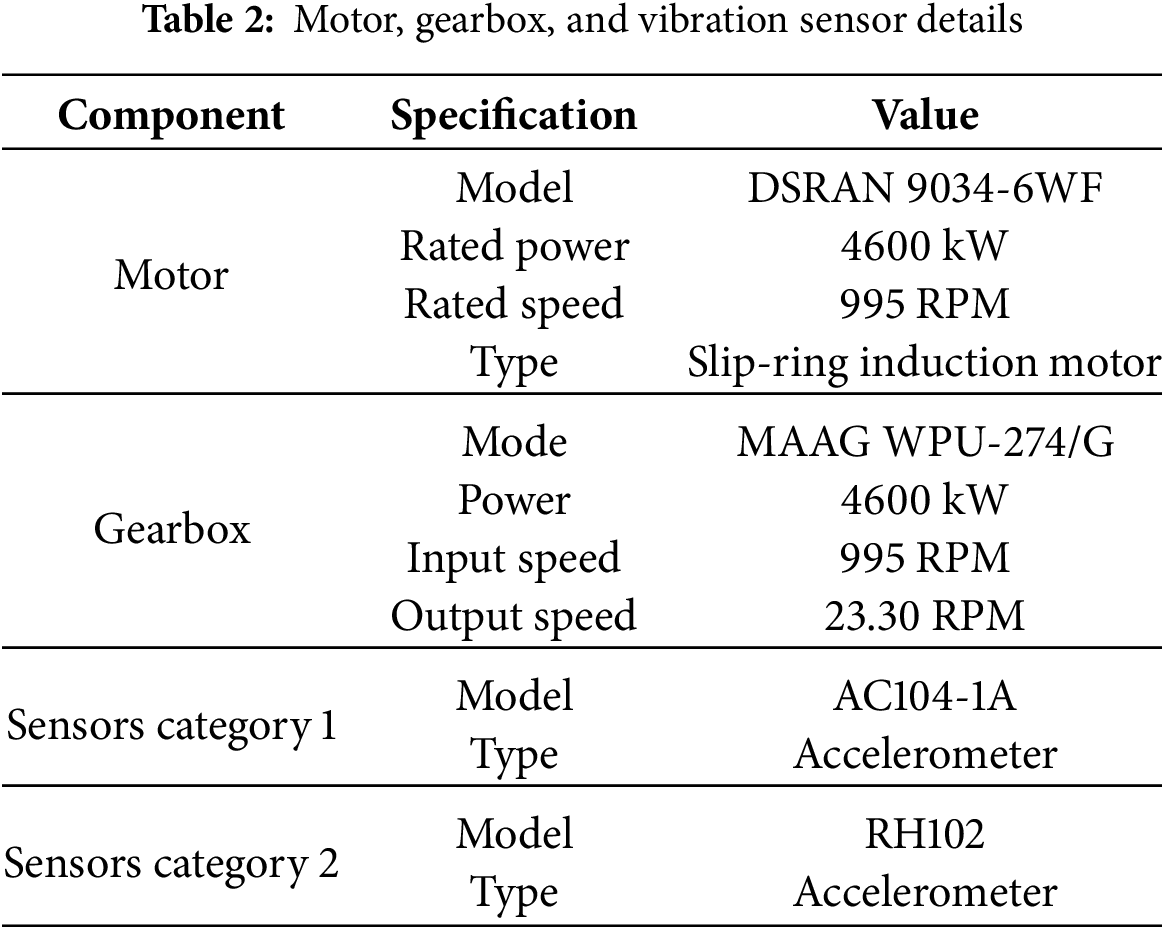
The dataset used in the study is collected from one of the biggest cement manufacturing industries in Asia. The slip-ring induction motor with an operating power of 4600 kW is used to drive a conveyor belt through a gearbox in the industry. The details of the motor, gearbox, and vibration sensor installed in the industry are mentioned in Table 2. The dataset includes motor load values and vibration readings from ten sensor points on the motor and gearbox of a cement industry’s raw material supply system. As shown in Table 2, there are ten (10) data collection points, and each collection point yields five (05) different vibration features resulting in a dataset of fifty (50) vibration features overall.
Vibration amplitude is the degree of movement or displacement of a machinery part from its central position usually represented in millimeters (mm). Vibration frequency is the number of cycles per time interval (minutes or seconds) measured in Hertz (Hz). Fig. 2 shows the vibration amplitude as well as frequency for a spring moving back and forth from its central position. Fig. 2 also shows the cycles of vibration signal numbered from 1–5 along with an indication of the start and end of each cycle. Vibration frequency represents the source of the vibration while amplitude shows the severity of the vibration.
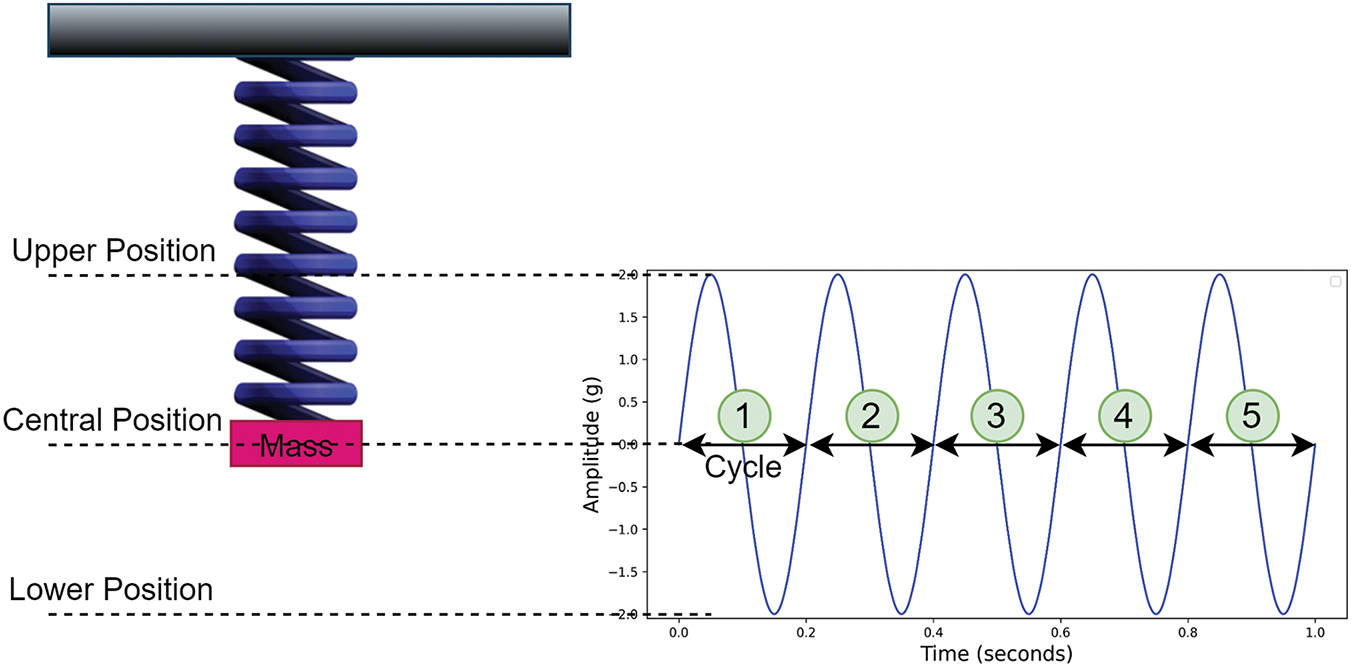
Figure 2: Sample of vibration amplitude and frequency
In the real environment, vibration values are a combination of different low and high frequency signals as shown in Fig. 3. Raw vibration values are sometimes not enough to identify the source of vibrations. In industrial CM, vibration characteristics are calculated to differentiate the signals and estimate the source or cause of vibrations. Vibration characteristics can be measured as velocity, acceleration as well as bandpass filtering on velocity and acceleration. Vibration velocity refers to the rate of change in displacement for time and acceleration is the rate of change in velocity for time. Calculation of velocity is simply taking the derivative of displacement and acceleration is the derivative of velocity denoted as a function of time. Vibration values are usually measured in mm (millimeter), velocity in mm/s (millimeter per second), and acceleration in mm/s2 (millimeter per second square) or g unit.
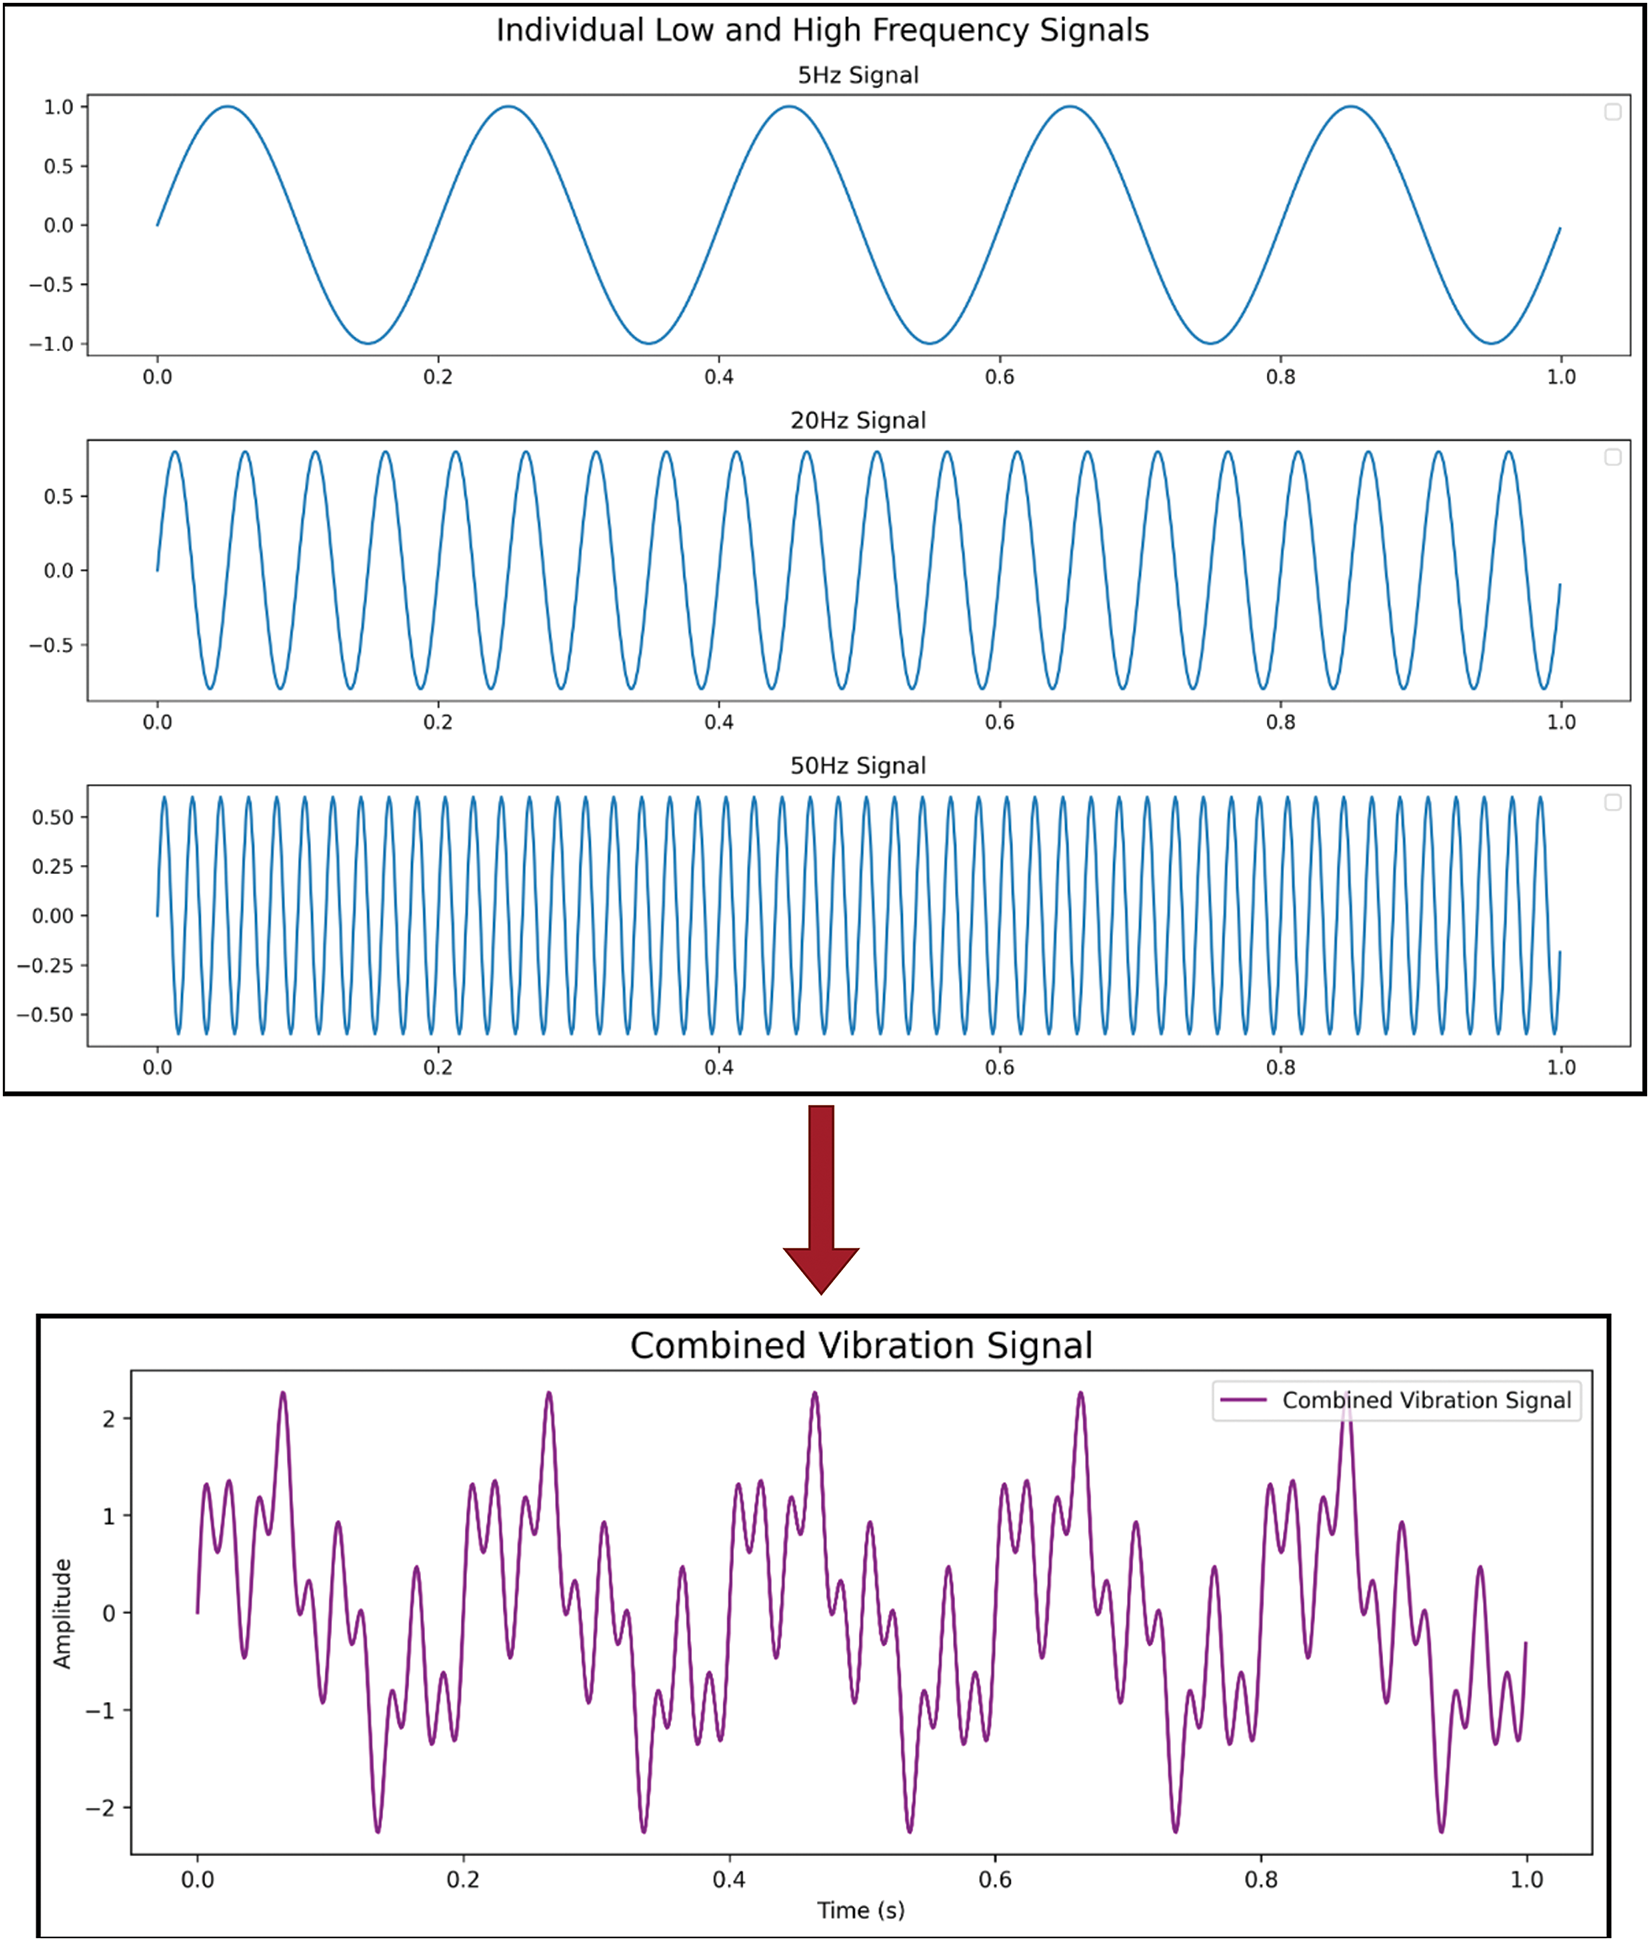
Figure 3: Combined vibration signal
Velocity is used to observe lower frequency signals concerning machine speed, usually caused by mechanical looseness, imbalance, and misalignment. While the acceleration is used to higher frequency signals compared to natural frequency usually representing bearing and gear faults. Vibration characteristics used in the current study along with mathematical formulas and descriptions are provided in Table 3.
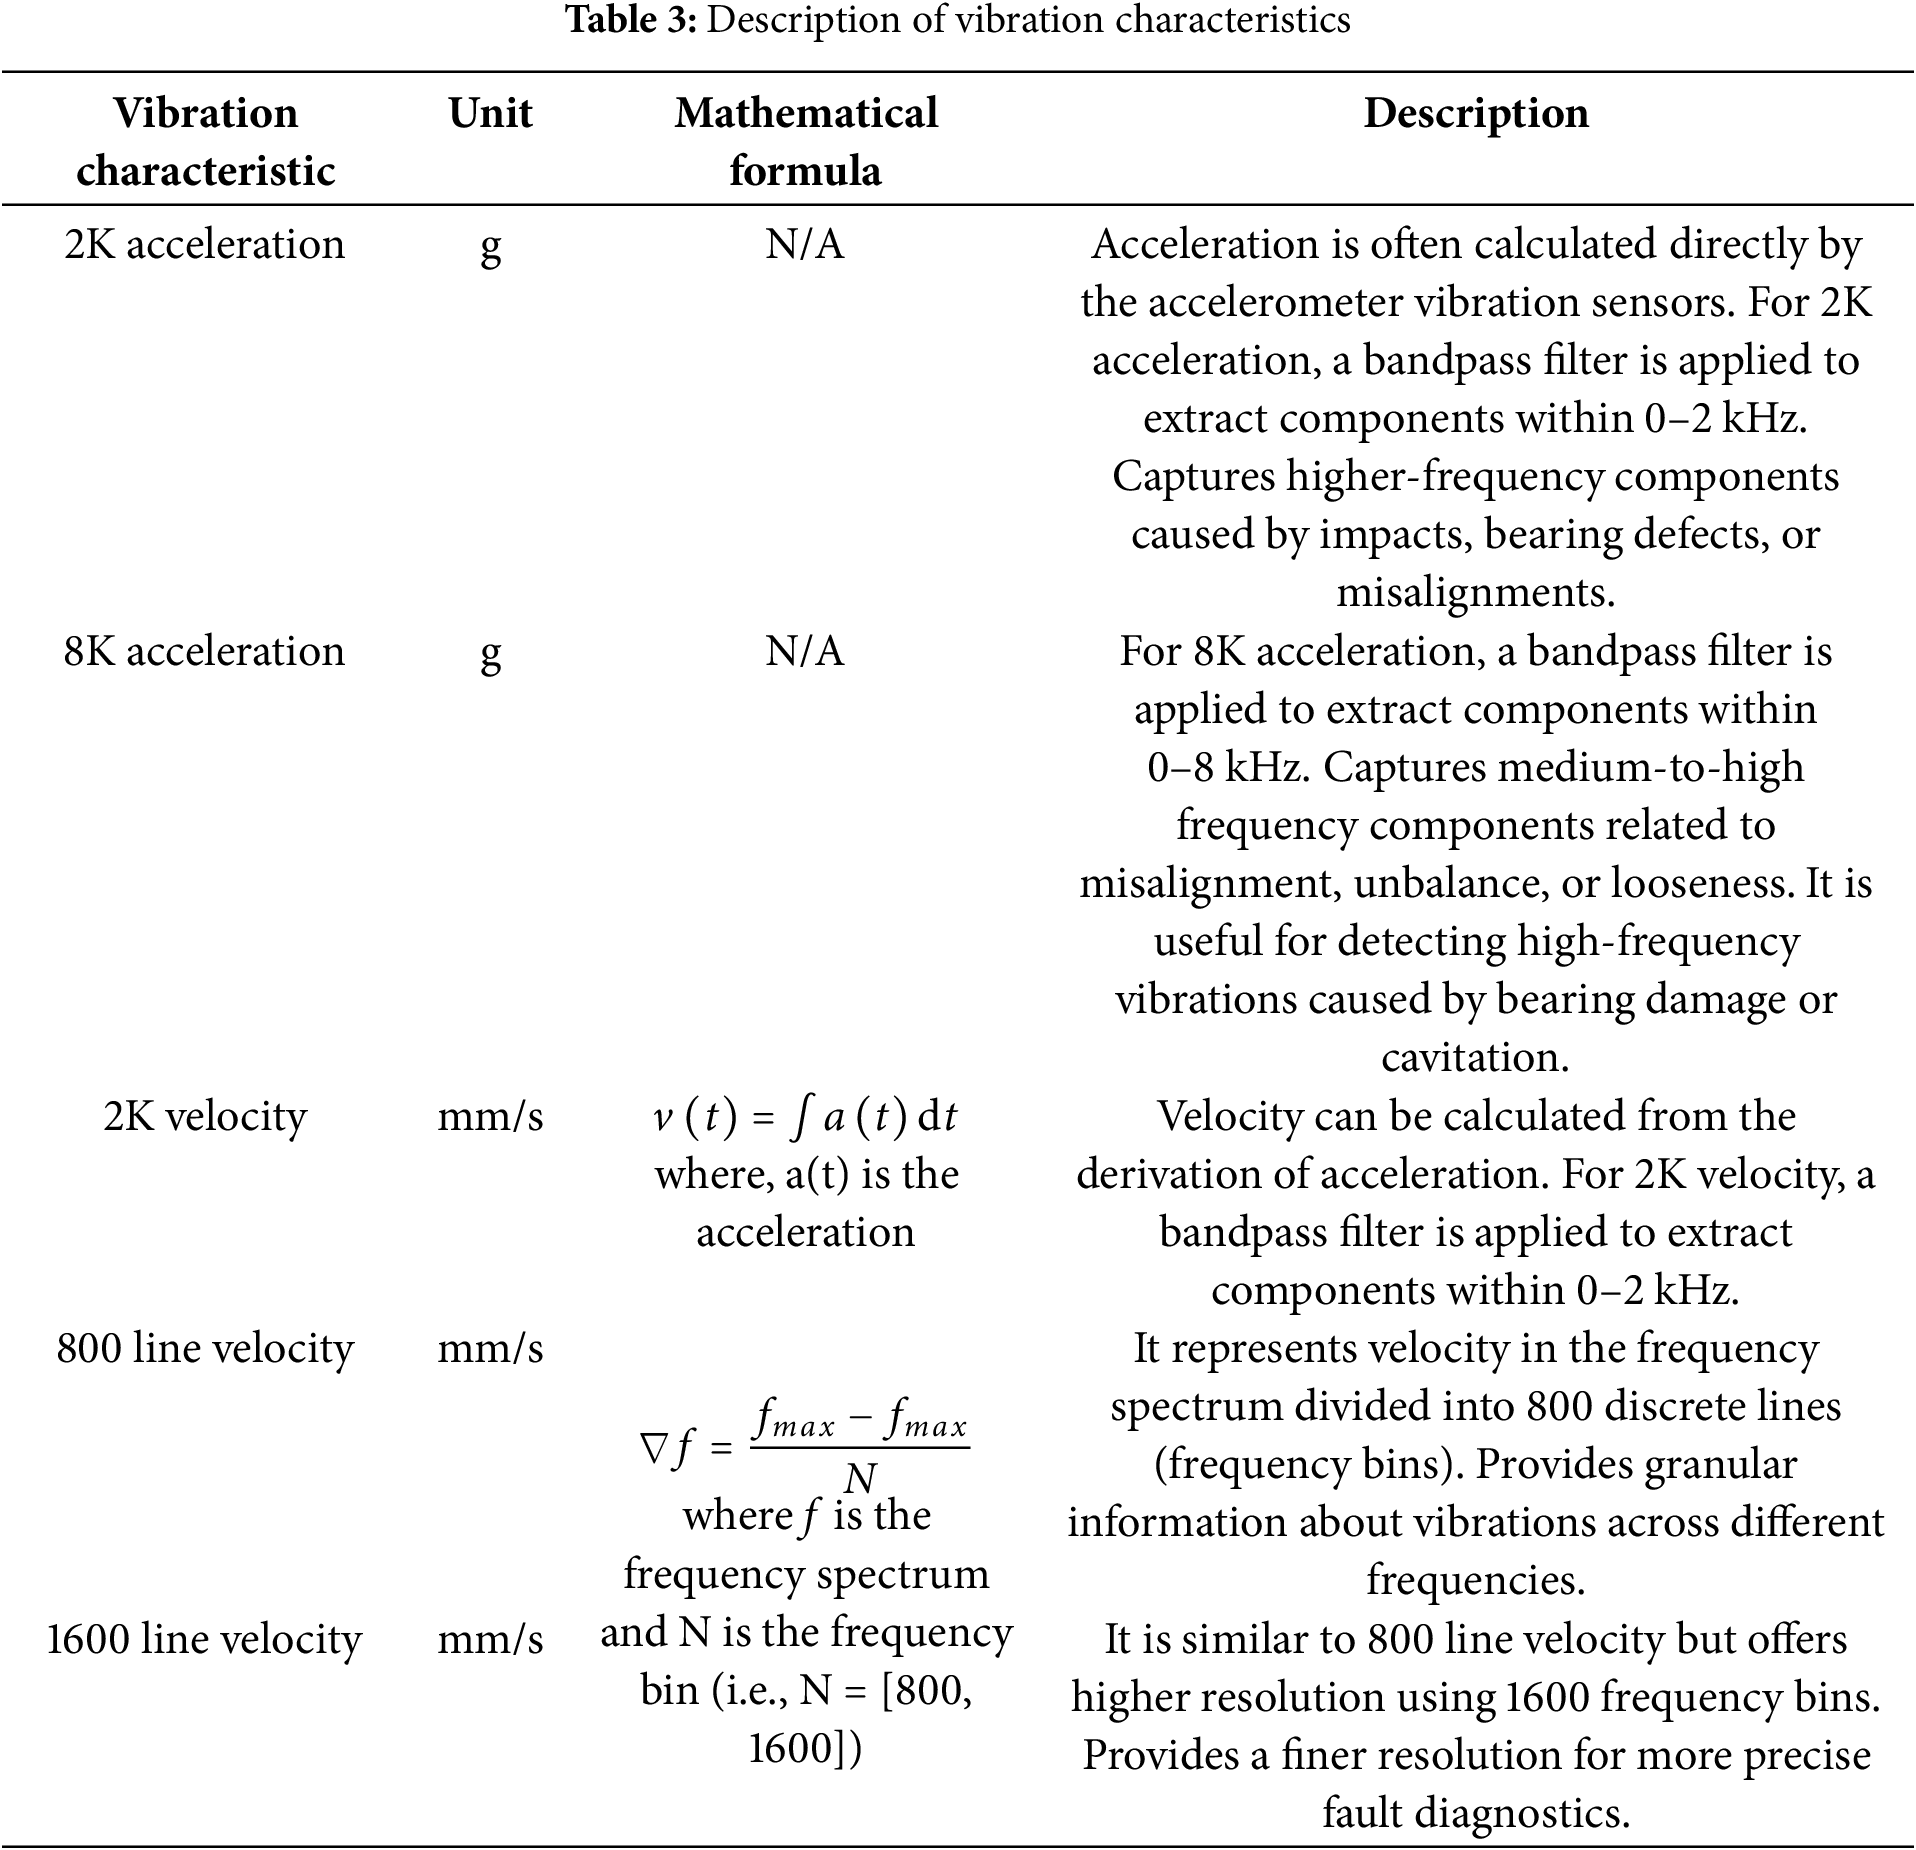
Vibration characteristics are measured using accelerometers and then processed to calculate more characteristics. Acceleration values are directly provided by the sensors, and only bandpass filtering is applied to get specific frequency components as shown in Table 3. Velocity values are calculated by integrating the acceleration values and the mathematical formula is provided in Table 3. The calculated velocity values are processed through bandpass filtering to get different spectrums.
To understand the data collection points, it is necessary to consider the vibration measurement plane and a few data collection points given in Fig. 4. The vibration values can be collected in three different directions, horizontal, vertical, and axial as shown in Fig. 4a.
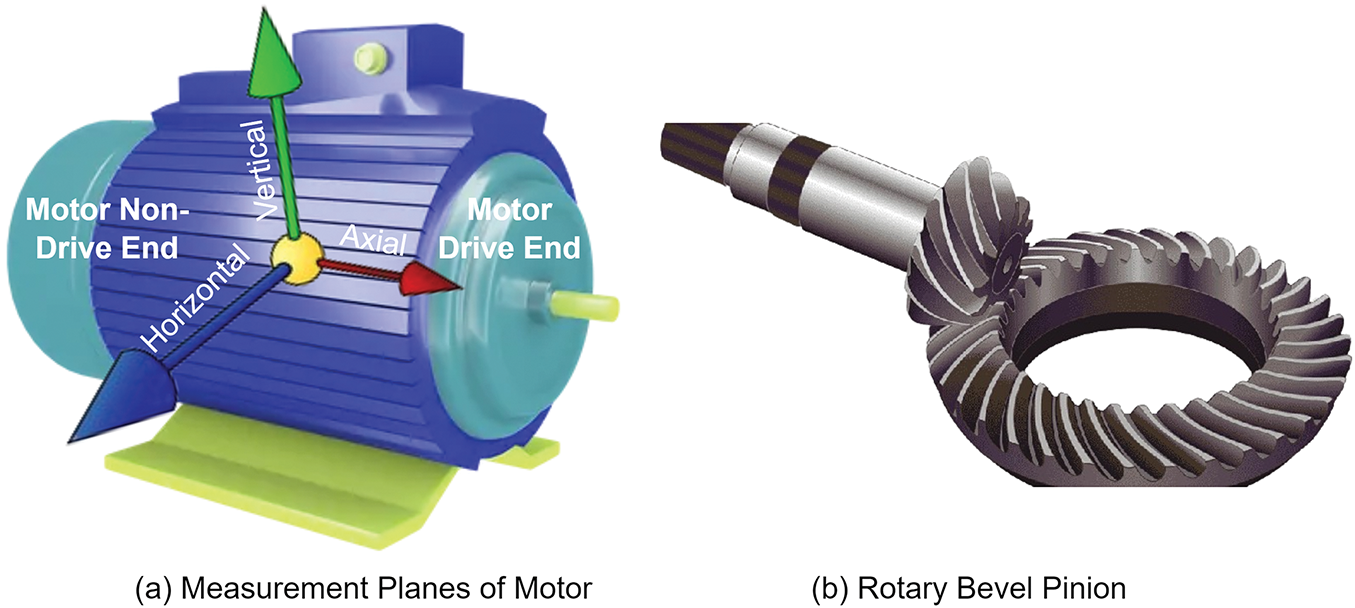
Figure 4: Measurement plane for vibrations and bevel pinion
The data collected in the conducted study contains the vibration values of all three directions. Secondly, the tooth-shaped rotating parts of the machines that are used to shift the direction of mechanical energy are called bevel pinions which are shown in Fig. 4b. The collected dataset contains vibration values of the bevel pinion part from both the motor side and gear side as well as the motor drive and non-drive end in horizontal, vertical, and axial directions. An internal view of the gearbox along with the data collection points located on the gearbox side are shown in Fig. 5.
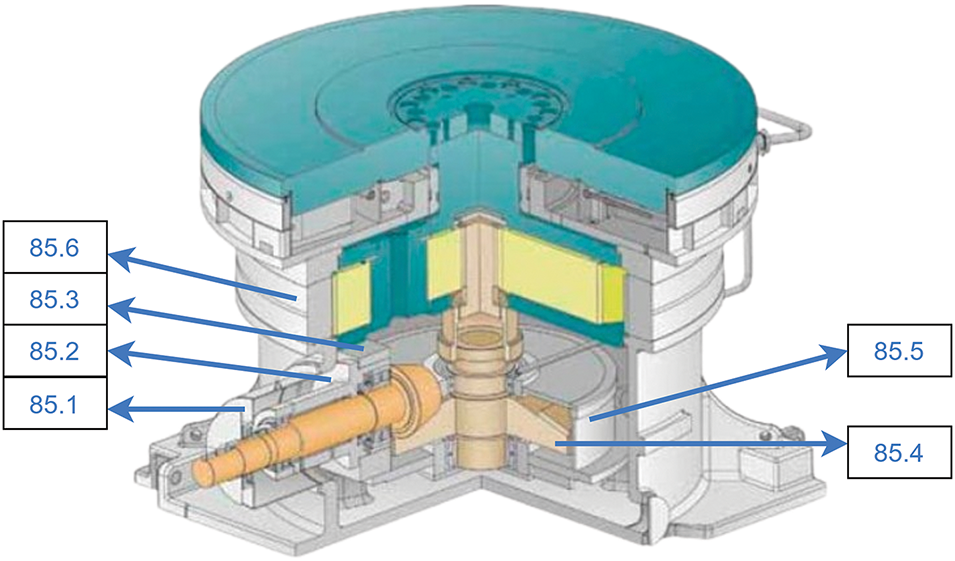
Figure 5: Sensor positions in the internal view of the gearbox. Note: The internal view of the gearbox is sourced from the industry documentation and later sensor points are nominated on it
Installed sensor point names along with different measurements taken from each sensor point are given below in Table 4. Every data collection point written in Table 4 is assigned a number and the location of those collection points is shown with the help of those numbers in Figs. 4a and 5. For example, Fig. 5 shows a data collection point numbered as “85.1” which is labeled as “bevel pinion motor side” in Table 4. For each specific data collection point, 2K Acceleration, 8K acceleration, 2K velocity, 800-line velocity, and 1600-line velocity vibration characteristics are recorded as shown in Table 4.
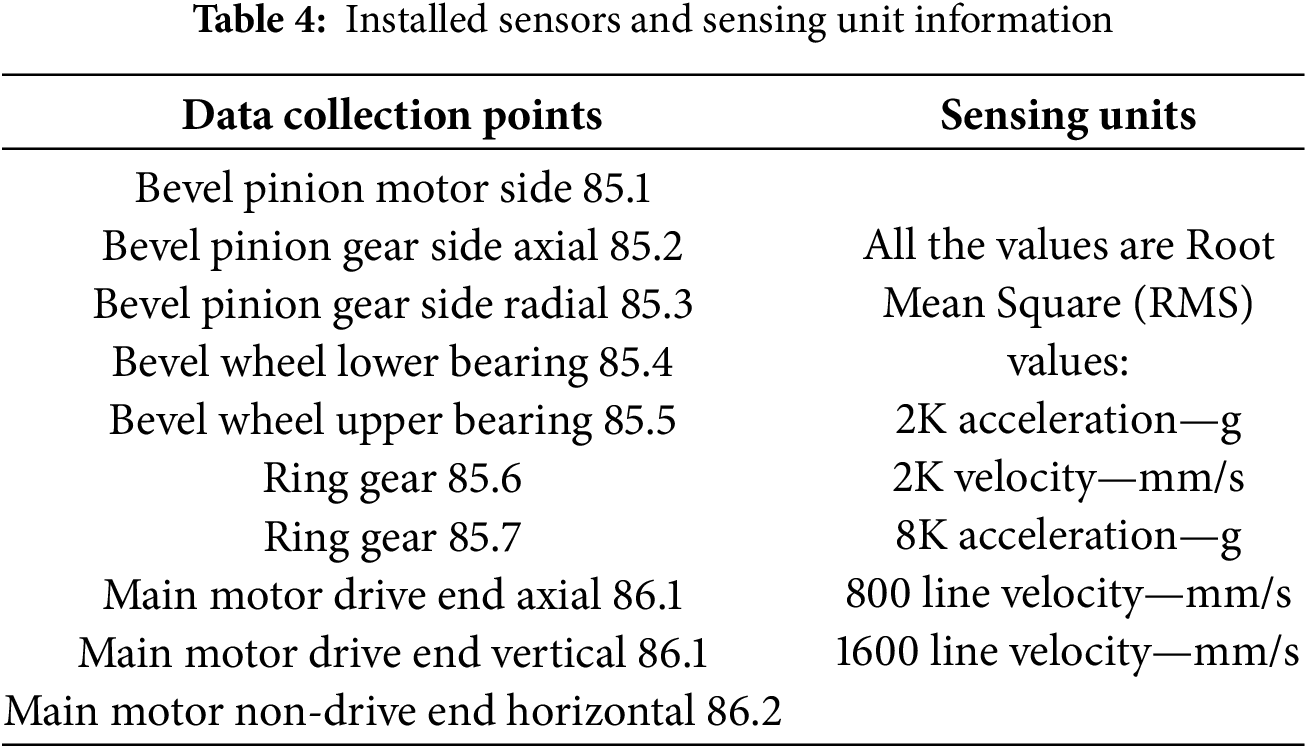
All acceleration-related vibration characteristics are recorded in g and all the velocity-related vibration characteristics are recorded in mm/s units. The data collection points, and vibration characteristics mentioned, are already in the practice of the industry. These sensors are installed by international CM organizations and are used by industry control unit teams to monitor the condition of the system. The vibration values are processed by the already installed software by extracting the features related to velocity and acceleration most suitable for the CM of the system. The extraction of these features by the software also includes a few advantages like noise exclusion, root mean square values, etc. According to the industry, the historical vibration data includes values for normal operations as well as faulty conditions but maintaining a fault log was not in practice.
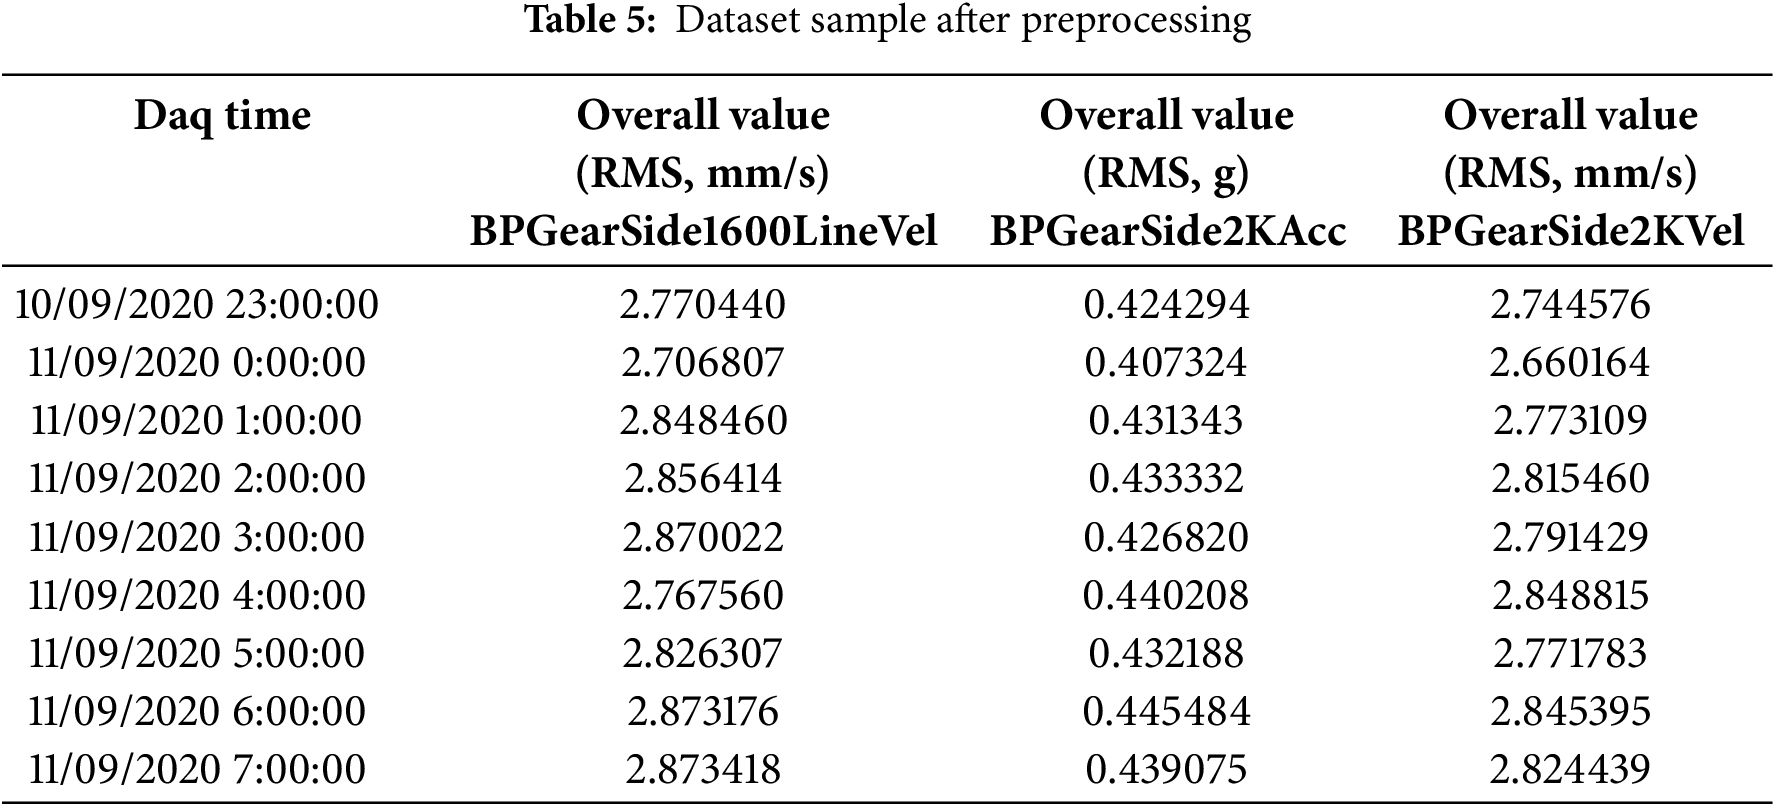
Data preprocessing includes converting the timestamp column into hourly timestamps as well as removing the dead signals. The data collected in the current study comprises vibration signals recording starting from 10 September 2020 at 11:00:00 p.m. and the latest record recorded on 10 February 2022 at 5:00:00 p.m. The data collection unit recorded values for the timestamps in which the motor as well as sensors were operational. The collected dataset was comprised of multiple data sheets for different months. These sheets were merged and then preprocessed using Python language and libraries. Dead signals are removed using the “pandas” library to first see the count of records having null values in each column and then drop the records containing null values. The dataset originally contained 12,428 rows which were reduced to 11,083 by removing the dead signals. These remaining 11,083 rows are further used for train and test split. The pre-processed sample dataset of sensing units of the bevel pinion gear side collection point is shown in Table 5. As shown in Table 2, there are a total of fifty (50) columns for the vibration features but only 3 of the columns related to the bevel pinion gear side are shown in Table 5 for keeping the table clarity intact.
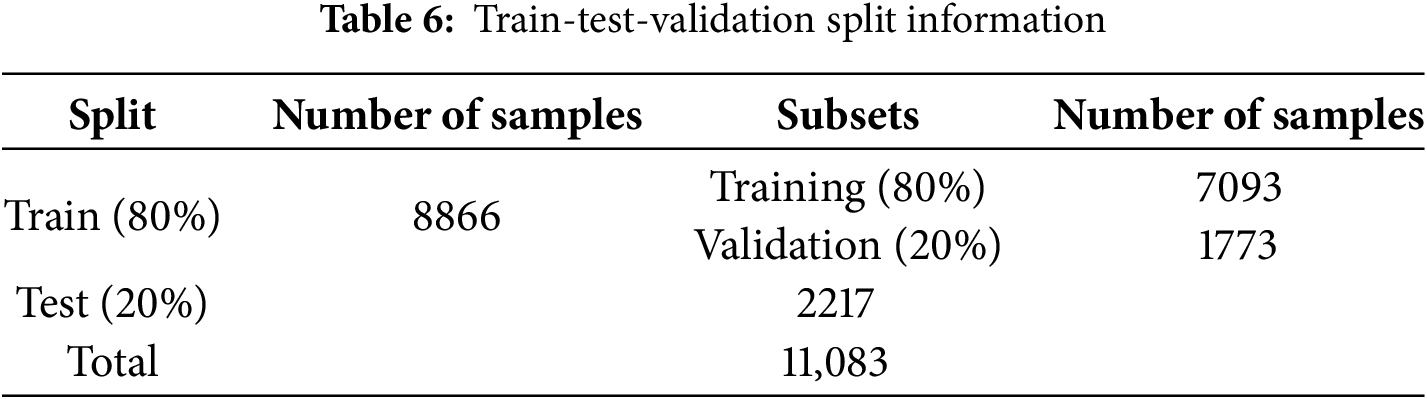
Each row of the collected dataset contains the timestamp, and vibration features at that specific timestamp. Cross-validation is a common practice to assess the generalization capability of a model as it randomly splits the dataset into train-test sets. However, in the time-series data, records are sequentially dependent and cross-validation can disrupt the temporal structure of the dataset. As the data collected in the current study is time-series in nature, cross-validation cannot be applied in model evaluation. The 80%–20% split of data is a common practice in the implementation of ML algorithms as it usually gives enough data for training and provides unseen samples for model testing. The preprocessed data is split into an 80%–20% ratio for training and testing. The 80% training data is further divided into 80%–20% subsets of training and validation used for the model training phase. The remaining 20% was reserved to test the model on unseen data to check the model’s robustness and generalization instead of overfitting. The details of the train, test, and validation split along with the number of samples for each subset are shown in Table 6.
3.3 Hyperparameter Search Strategy
Hyperparameter tuning is the process of selecting the most suitable set of hyperparameters for an ML [46] or DL [47] model. Hyperparameter tuning helps achieve better performance of the model by aligning the model with the data distribution. It also helps in avoiding underfitting and overfitting of the model as well as optimizes the resource utilization by reducing the computations due to the unnecessary complexity of the model. It helps models converge faster, saving time and computational resources by selecting the optimal hyperparameters along with the best possible performance of the model [48]. Generally, hyperparameter tunning strategies can be categorized into the following three categories:
• Grid Search: It is a systematic strategy that tests the model performance on all predefined combinations of hyperparameters. It is computationally very expensive, especially for large-sized search space.
• Random Search: Hyperparameters are selected randomly from a predefined range. It is computationally efficient compared to grid search but the selection of optimal hyperparameters is not guaranteed.
• Optimization-based Search: These strategies use mathematical optimization techniques by defining an objective function and finding the optimal hyperparameters set. Optimization-based search strategies include gradient-based, evolutionary, and Bayesian optimization.
The proposed methodology involves the implementation of the Bayesian optimization technique which iteratively uses a probabilistic model to assess the performance of hyperparameters and refine it. It provides a balance between trying new combinations and optimal solutions thus reducing the number of computations compared to grid and random search. The hyperparameter optimization can be represented mathematically as shown in Eq. (4).
where
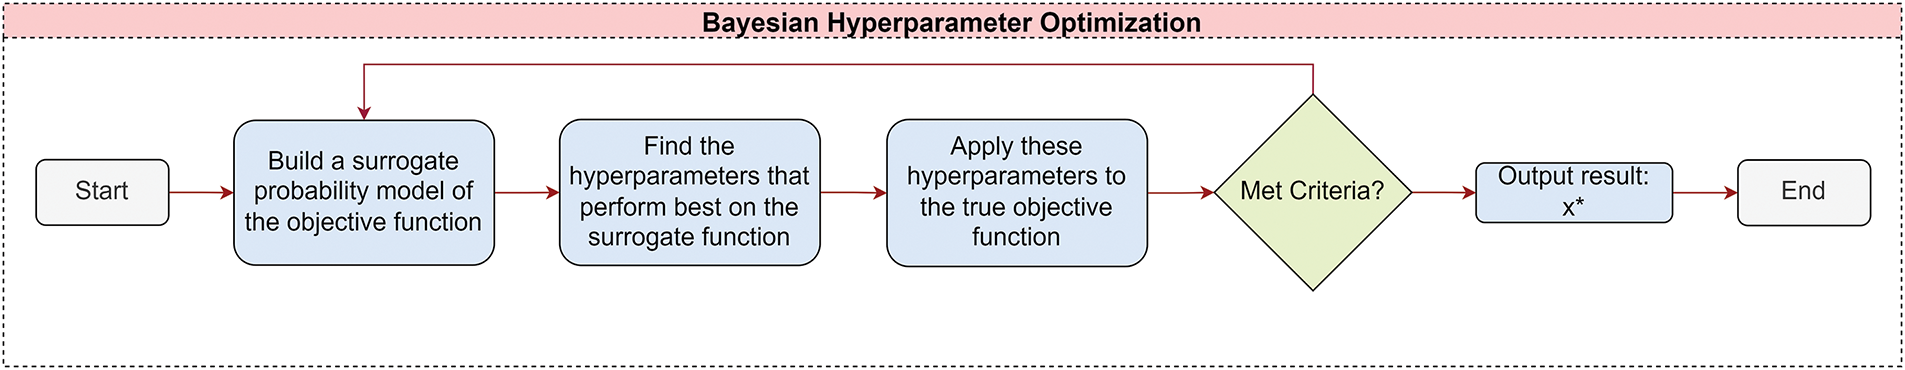
Figure 6: Bayesian hyperparameter optimization steps
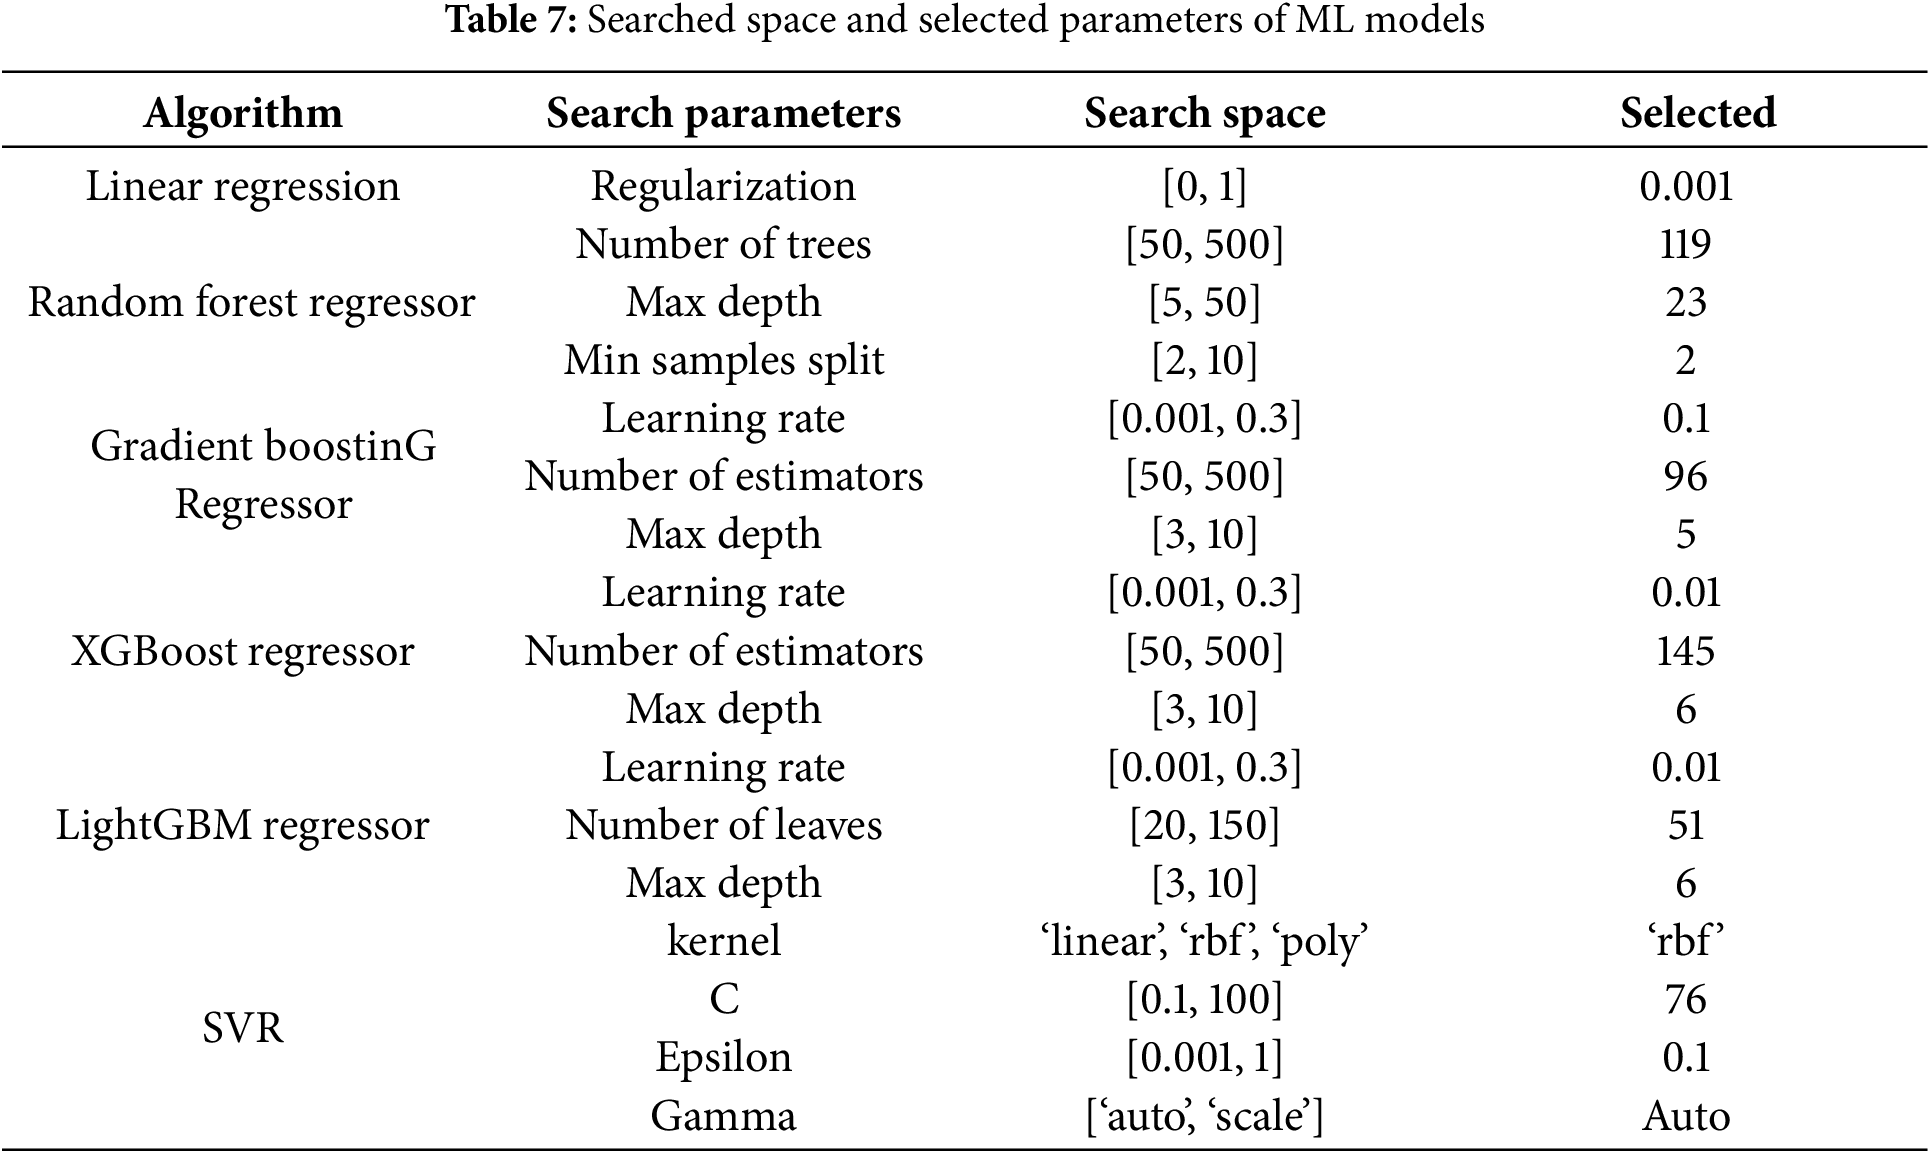
The Bayesian optimization algorithm, implemented using the Optuna library in Python, automatically finds the best hyperparameters. It tests different settings, evaluates model performance, and selects the combination that minimizes MSE. Table 7 provides details of the hyperparameters, searched space, and selected parameters for the ML models. Table 7 shows that the hyperparameter tuned for LR is regularization, which helps prevent overfitting by penalizing large coefficients. The optimized RF model hyperparameters include the number of trees, the maximum depth of the tree, and the number of samples for each split. Table 7 also represents the hyperparameters including the learning rate, number of estimators, and max depth of each tree optimized for GBR and XGBoost. The radial basis function (RBF) is selected along with other hyperparameters for SVR as shown in Table 7.
While utilizing DL, model architecture selection becomes more complex and challenging. The Bayesian optimization algorithm is implemented to use architectural parameters like the number of LSTM layers, number of units per LSTM layer, etc. as input along with other hyperparameters. Bayesian optimization is provided with architectural parameters as input including the number of LSTM layers, the number of units for each LSTM layer, the number of Dense layers, number of units in each dense layer. Other hyperparameters related to the proposed model provided as input to the optimization algorithm are dropout value in between the layers, learning rate, batch size, and activation function. Optimization stopping criteria were set to a maximum of 50 trials along with early stopping in case of convergence. The optimization stopping criterion was set to a maximum of 50 trials, as the optimization algorithm consistently converged between 39 and 45 trials during experimentation. This threshold was chosen to ensure sufficient exploration of the hyperparameter space while maintaining computational efficiency.
Details of Searched parameters, search spaced, and optimal parameters regarding LSTM are provided in Table 8. The BOS-LSTM model consists of two LSTM layers: one with 118 units and another with 96 units. These layers collaboratively identify complex patterns in the dataset. Only one dense layer with 47 units is proposed to be an optimal solution by the Bayesian optimization algorithm. The dense layer is followed by an output layer which provides the predicted value for the given batch of previous values. The architecture diagram of BOS-LSTM as per details mentioned in Table 8 is shown in Fig. 7. As shown in Fig. 7, two LSTM layers are connected sequentially to learn complex patterns in the dataset along with a dropout layer to generalize the model training rather than overfitting. A dense layer is used to concatenate all the learned parameters which are further used as input to the output layer for the value prediction.
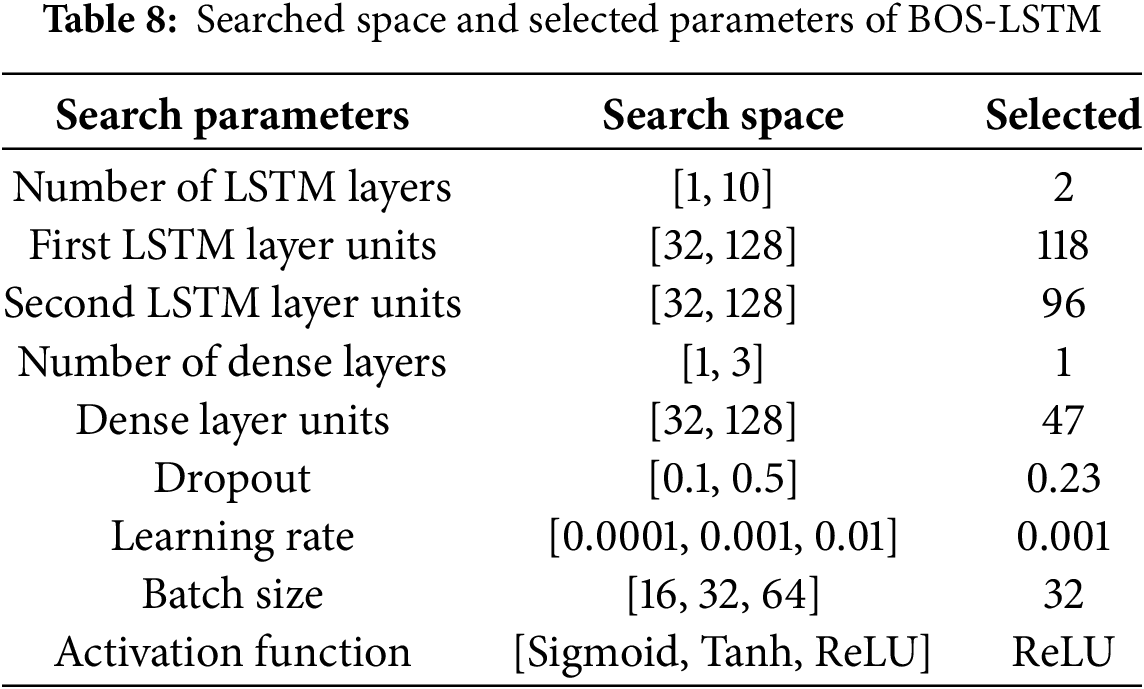
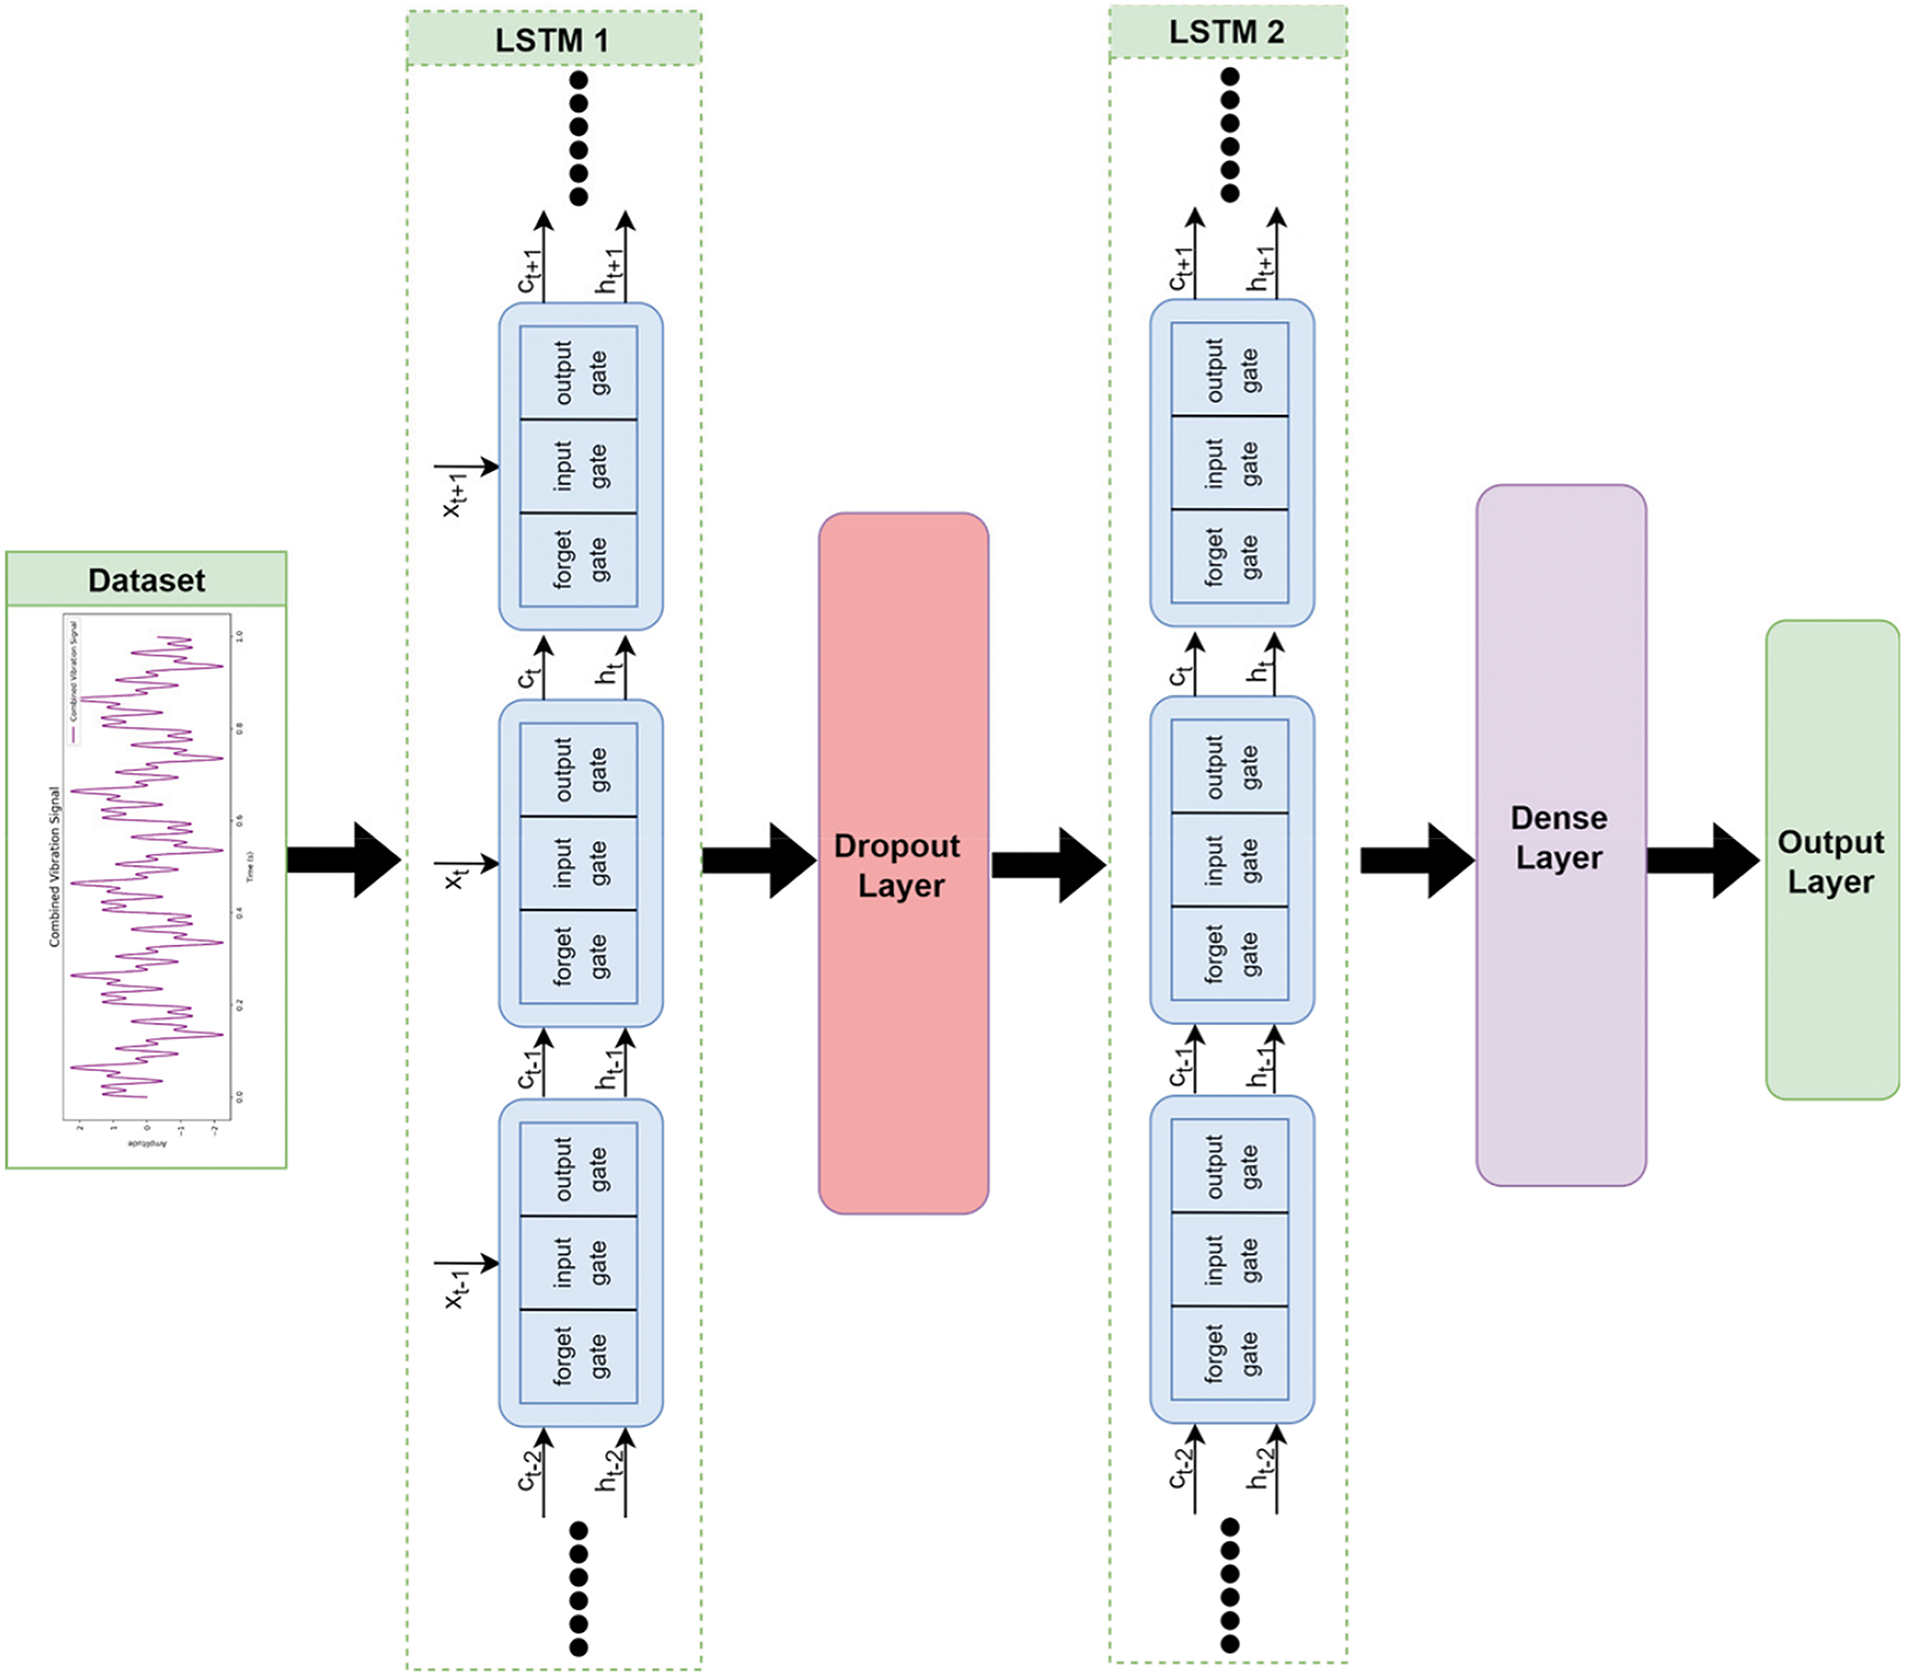
Figure 7: BOS-LSTM architecture diagram
The models are implemented using Python and supporting libraries like sklearn, pandas, and NumPy. Models are implemented on the dataset containing vibration characteristic values as well as motor load information on that specific timestamp. As the vibrations predicted in the current study are measured in g which is equivalent to 9.81 m/s2, the unit of measurement of MSE is g2 for all the implementations of the current study. The MAE coefficient always has the same units as the target variable, hence MAE is calculated in g. For BOS-LSTM models, a learning rate of 0.01, a batch size of 32, and a dropout rate of 0.2 are used to ensure the model’s convergence to an optimal solution. Additional implementation details include using two LSTM layers with a ReLU-Rectified linear Unit as an activation function and Adam-Adaptive Moment Estimation as an optimizer. The architecture of the BOS-LSTM model is shown in Fig. 7 showing the layers of the model as well as the other implementation details provided in Table 8. The model is trained for a total of 50 epochs and displays an MSE of 0.0019.
All the models are implemented with the implementation details mentioned earlier and provided in Tables 7 and 8 on the dataset containing the load and vibration information of the motor. Actual values of vibrations along with the predictions of the trained models are shown in Fig. 8. It shows the actual values in blue color and predicted ones in red color for 2K Acceleration of Ring Gear (85.7). Basic ML modes, LR and RF did not perform well on the dataset as there aren’t any obvious trends in it. The models yielded MSE of 0.95 and 0.465 for LR and RF, respectively. Gradient boosting models GBR, XGBoost, and LightGBM performed better than basic ML models and MSE of 0.184, 0.029, 0. 2127, respectively. SVR achieved a lower MSE of 0.027, indicating better performance. The BOS-LSTM outperformed all other models, achieving an MSE of 0.0019. Fig. 8 indicates the BOS-LSTM model’s ability to accurately predict both normal vibration patterns and higher vibration values.
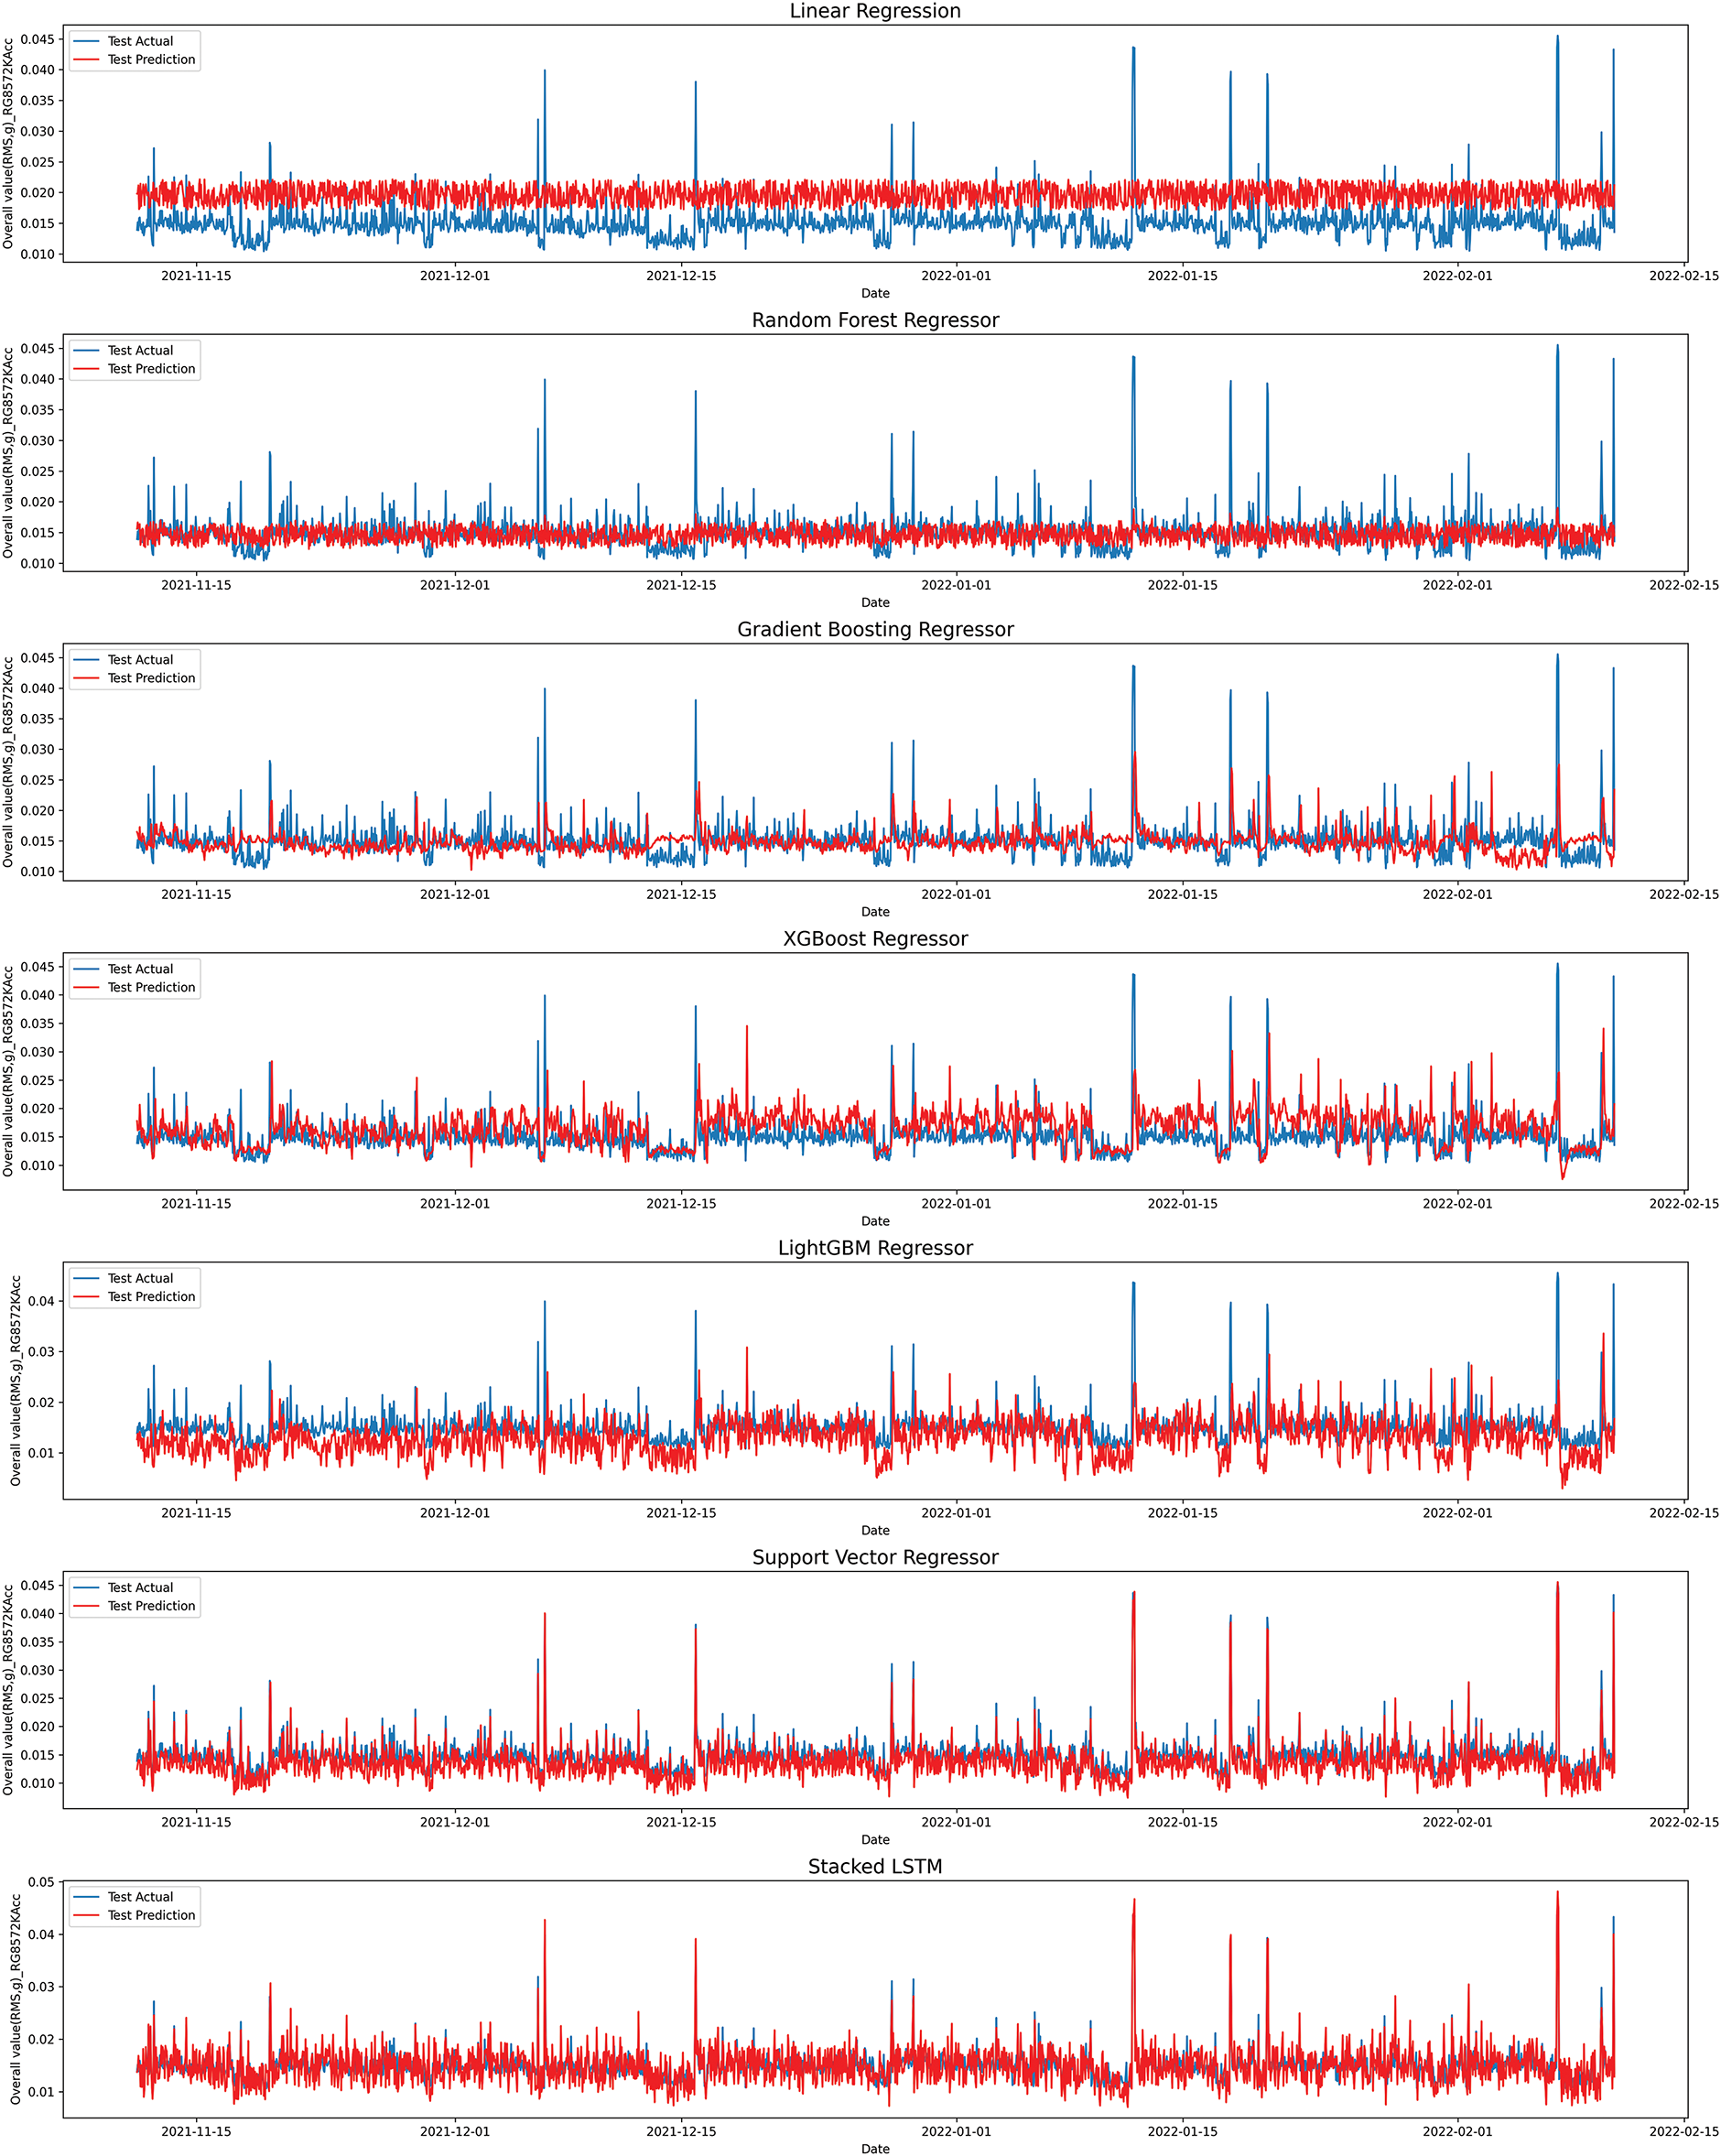
Figure 8: Actual vs. predicted values of all model
The results show that basic ML models failed to capture the dataset’s complexity and to correctly predict the peaks which resulted in lower performance. For SVR, some of the peak values are not captured accurately while BOS-LSTM’s overall performance shows better performance in normal and peak values. The BOS-LSTM predicted values graph shows the model generalization in predicting future values rather than overfitting. The comparison of models concerning MSE on testing data clearly states the better performance of BOS-LSTM as compared to other algorithms.
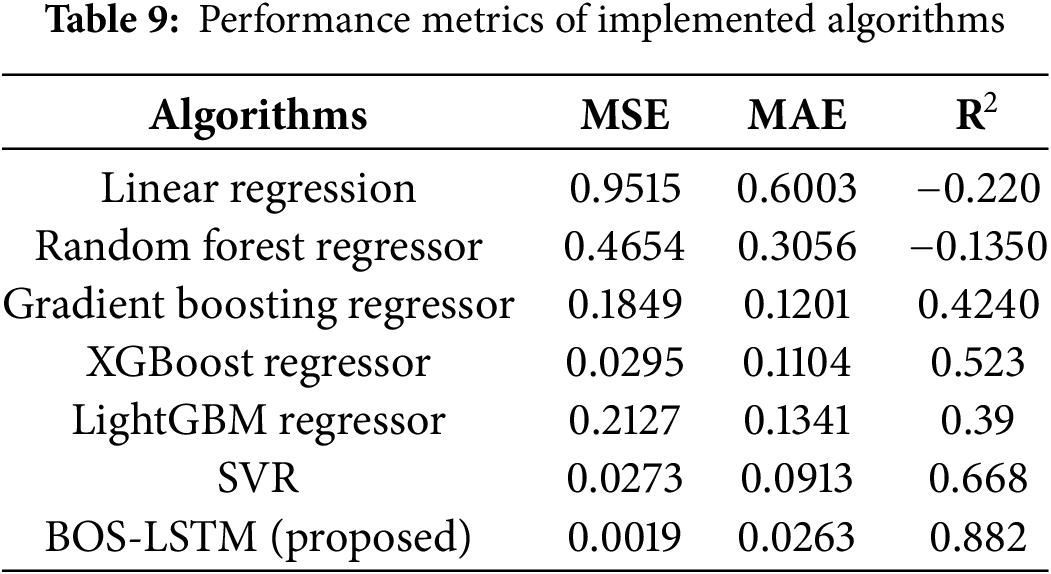
Along with MSE, other evaluation metrics, MAE, and R2 Score, are also calculated for each implemented model. Table 9 provides a comparison of evaluation metrics for all models implemented on the dataset. As shown in Table 9, the R2 scores −0.220 and −0.1350 for Linear Regression and Random Forest, respectively, indicate poor performance of these models for the given task. A negative R2 shows that the model performs worse than a simple mean-based prediction, due to failing in learning the complex time-dependent relationships in the data. Fig. 8 also shows that these models failed to capture the underlying patterns in the dataset. GBR and LightGBM showed improved performance but were still limited in terms of evaluation metrics as shown in Table 9. XGBoost and SVR provided better predictions, with SVR outperforming other basic models in capturing hidden patterns in the dataset. Table 9 further highlights that the proposed BOS-LSTM significantly outperformed all other models with an MSE of 0.0019 and R2 of 0.882. Results show that the traditional regression and tree-based models struggled with capturing long-term dependencies in time-series datasets. Whereas complex models, such as the proposed BOS-LSTM, effectively learn temporal patterns and provide significantly better performance.
The use of Bayesian optimization for hyperparameter selection, evaluation of the model on unseen data, and use of different performance metrics ensure the robustness of the proposed model. A sensitivity analysis is conducted to further validate the findings by changing the hyperparameters and observing the impact on model performance. To analyze the sensitivity of the proposed BOS-LSTM model, hyperparameters are changed by selecting both their minimum and maximum values within the search space and observing their impact on MSE. In the minimum values setting, the model performance dropped significantly with an MSE of 0.0850 while the maximum values setting resulted in an MSE of 0.0020. Despite selecting the maximum values of hyperparameters from search space, results show that the proposed BOS-LSTM provides a good balance between model complexity and generalization.
As the evaluation metrics show the performance of models on different scales and units, it is difficult to access models on different metrics at a time. Spider plot is a good option to visually compare multiple models across multiple metrics, clearly showing strengths and weaknesses. The Spider plot first inverts and normalizes the metrics on a 0 to 1 scale so that they are comparable and then plots in a radar format. Fig. 9 presents a spider plot for the MSE, MAE, and R2 values observed for models during evaluation.
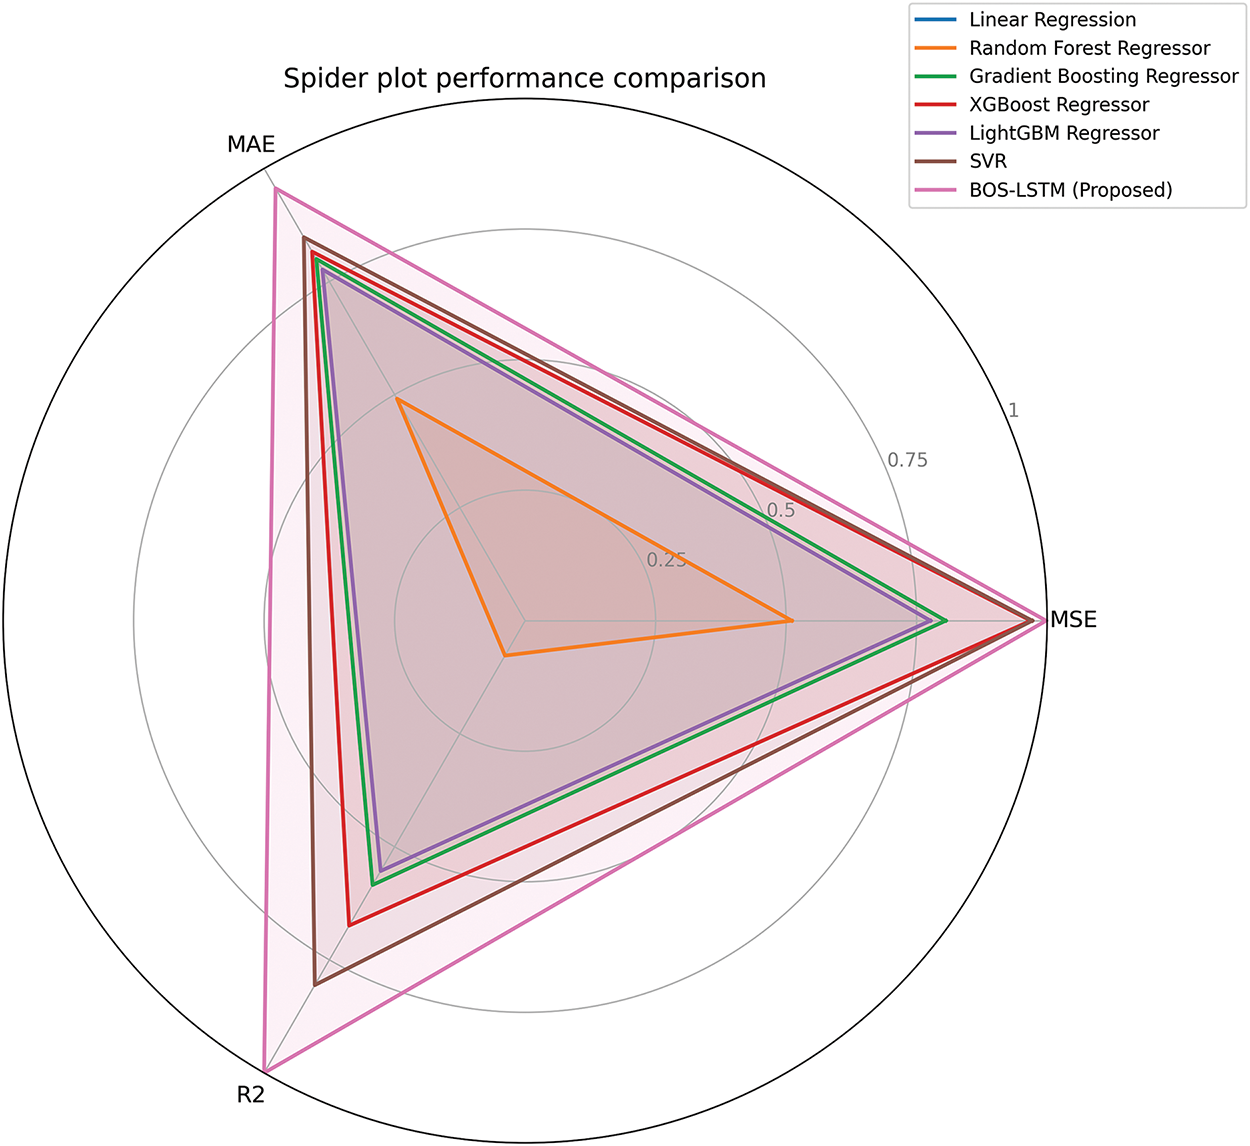
Figure 9: Spider plot for model performance evaluation
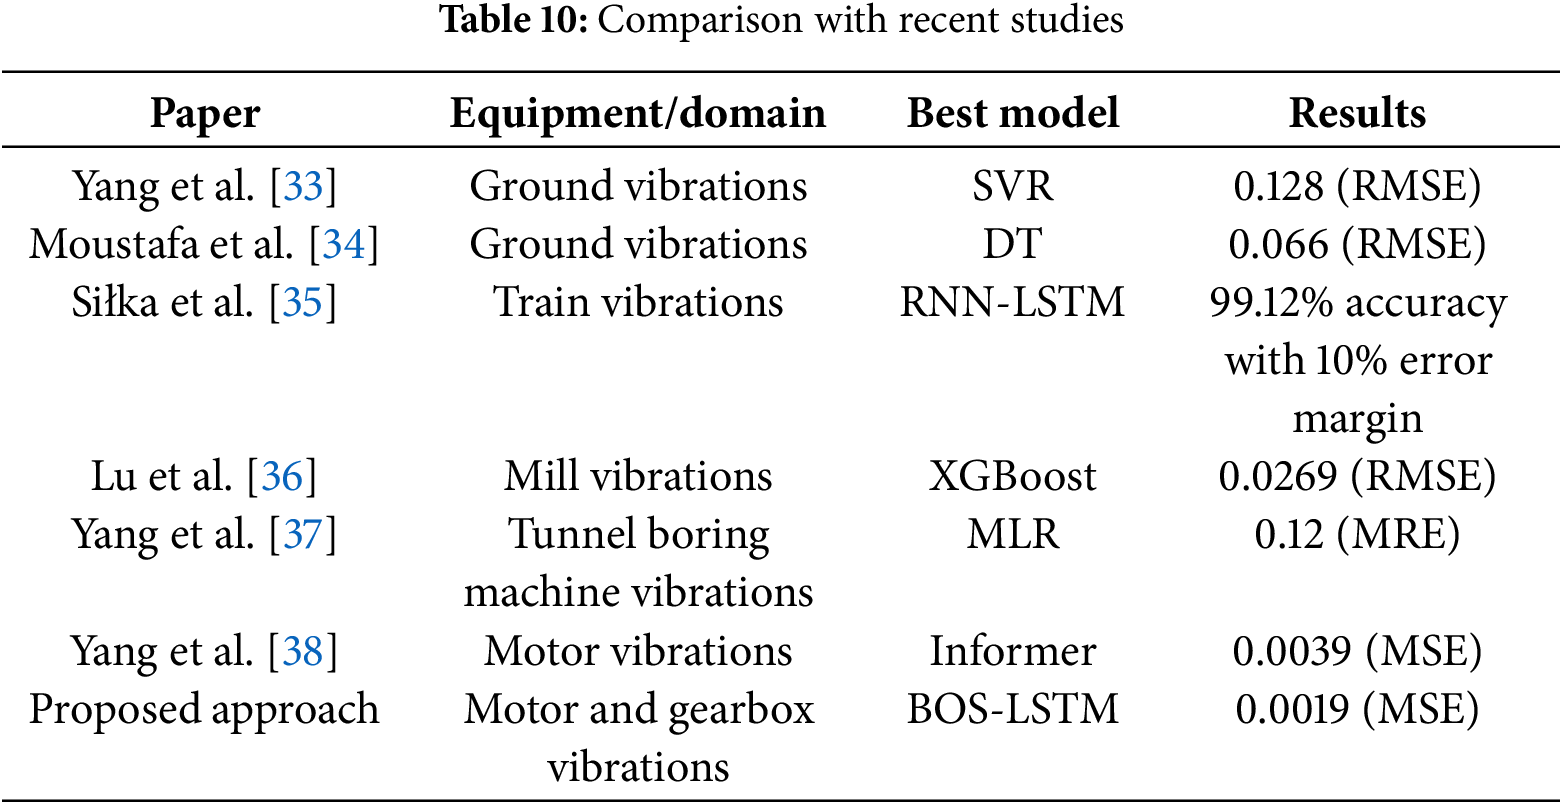
The current study involves the collection of a dataset from a heavy-duty industrial motor setup which was not used in any prior research. Comparison of the current study with recent studies on the same parameters is not possible due to the usage of different datasets in recent studies. A comparison with recent studies on vibration values prediction along with the domain and evaluation parameters used is provided in Table 10. It can be observed that the MSE 0.0019 achieved in the current study is comparatively a low error in vibration values prediction compared to recent studies.
The results of the current study have potential implications for PM of industrial sectors involving heavy machinery such as manufacturing, energy production, and transportation. Accurate prediction of vibration characteristics using the proposed model enables early detection of potential failures and reduction in chances of unplanned downtimes. This study facilitates proactive equipment maintenance by improving reliability, optimizing maintenance schedules, and minimizing costs leading to improved operational efficiency. The implemented methodology can be adapted for PM in other critical industrial settings including pumps, turbines, and compressors. The integration of ML models with CM of industrial systems can lead to improved productivity and safety in Industry 4.0.
In conclusion, this study presents a comprehensive exploration of CM in process industries, with a focus on a large Slip ring induction motor using vibration and load information. The proposed approach includes data preprocessing, modeling of CM using different ML and DL algorithms, and analysis of results. The preprocessing phase refined the raw vibration data by removing the dead signals and aligning the temporal sequence of the data. The models exhibited varying performance on the provided dataset with SVR displaying some capability in capturing the time series data relationships. The proposed BOS-LSTM demonstrated superior performance compared to other models. The BOS-LSTM model’s performance can be attributed to its architectural capability to capture long-term patterns in vibration data. This paper offers an analysis of various ML models and shows practical applications of advanced ML techniques for CM. By utilizing these techniques and vibration values predicted in advance, process industries can shift from reactive maintenance to proactive maintenance strategies if there are any abnormal values expected. The results indicate the potential of ML models, particularly BOS-LSTM, to revolutionize industrial processes.
While the current research work focuses on only one unit of a very large industrial setup, future work may explore enhancing predictive maintenance across diverse industrial setups. This can be achieved by training the models on datasets collected from different industrial setups for generalization. The study is limited to the use of vibration sensors. Future work can utilize the integration of additional sensor types, such as temperature, pressure, and acoustic sensors, to provide a more comprehensive study. This paper is limited to predicting vibration characteristics which can be helpful to take precautionary measures before breakdowns. These vibration characteristics along with label information of the normal condition or fault scenario can be used for fault classification of future predictions. The conducted study is limited to ML and DL model implementation on the industrial dataset which can further be used for the development of web and mobile-based applications for remote monitoring. Future directions should include integrating CM systems with IoT and cloud platforms to enable remote, real-time monitoring and anomaly detection.
Acknowledgement: Not applicable.
Funding Statement: The authors received no specific funding for this study.
Author Contributions: The authors confirm contribution to the paper as follows: Conceptualization, Muhammad Shahbaz; methodology, Mudasir Dilawar and Muhammad Shahbaz; validation, Mudasir Dilawar and Muhammad Shahbaz; formal analysis, Mudasir Dilawar; investigation, Muhammad Shahbaz; writing—original draft preparation, Mudasir Dilawar; writing—review and editing, Muhammad Shahbaz; visualization, Mudasir Dilawar; supervision, Muhammad Shahbaz. All authors reviewed the results and approved the final version of the manuscript.
Availability of Data and Materials: The dataset generated in the implementation of the current study is available from authors on request.
Ethics Approval: Not applicable.
Conflicts of Interest: The authors declare no conflicts of interest to report regarding the present study.
References
1. Rahman MS, Ghosh T, Aurna NF, Kaiser MS, Anannya M, Hosen AS. Machine learning and internet of things in Industry 4.0: a review. Meas: Sens. 2023;28(4):100822. doi:10.1016/j.measen.2023.100822. [Google Scholar] [CrossRef]
2. Grabowska S. Smart factories in the age of Industry 4.0. Manag Syst Prod Eng. 2020;28(2):90–6. doi:10.2478/mspe-2020-0014. [Google Scholar] [CrossRef]
3. Chryssolouris G, Alexopoulos K, Arkouli Z. A perspective on artificial intelligence in manufacturing. Cham, Switzerland: Springer; 2023. 135 p. doi:10.1007/978-3-031-21828-6. [Google Scholar] [CrossRef]
4. Chen C, Shi J, Lu N, Zhu ZH, Jiang B. Data-driven predictive maintenance strategy considering the uncertainty in remaining useful life prediction. Neurocomputing. 2022;494(2):79–88. doi:10.1016/j.neucom.2022.04.055. [Google Scholar] [CrossRef]
5. Borgi T, Hidri A, Neef B, Naceur MS. Data analytics for predictive maintenance of industrial robots. In: Proceedings of the 2017 International Conference on Advanced Systems and Electric Technologies (IC_ASET); 2017 Jan 14–17; Hammamet, Tunisia. p. 412–17. doi:10.1109/ASET.2017.7983729. [Google Scholar] [CrossRef]
6. Sezer E, Romero D, Guedea F, Macchi M, Emmanouilidis C. An Industry 4.0-enabled low cost predictive maintenance approach for smes. In: Proceedings of the 2018 IEEE International Conference on Engineering, Technology and Innovation (ICE/ITMC); 2018 Jun 17–20; Stuttgart, Germany. p. 1–8. doi:10.1109/ICE.2018.8436307. [Google Scholar] [CrossRef]
7. Peres RS, Rocha AD, Leitao P, Barata J. IDARTS—towards intelligent data analysis and real-time supervision for Industry 4.0. Comput Ind. 2018;101(1):138–46. doi:10.1016/j.compind.2018.07.004. [Google Scholar] [CrossRef]
8. Schneider T, Helwig N, Schütze A. Automatic feature extraction and selection for classification of cyclical time series data. TM-Tech Mess. 2017;84(3):198–206. doi:10.1515/teme-2016-0072. [Google Scholar] [CrossRef]
9. Vafaei N, Ribeiro RA, Camarinha-Matos LM. Fuzzy early warning systems for condition based maintenance. Comput Ind Eng. 2019;128(7):736–46. doi:10.1016/j.cie.2018.12.056. [Google Scholar] [CrossRef]
10. Dong Y, Xia T, Fang X, Zhang Z, Xi L. Prognostic and health management for adaptive manufacturing systems with online sensors and flexible structures. Comput Ind Eng. 2019;133(1):57–68. doi:10.1016/j.cie.2019.04.051. [Google Scholar] [CrossRef]
11. Wei G, Zhao X, He S, He Z. Reliability modeling with condition-based maintenance for binary-state deteriorating systems considering zoned shock effects. Comput Ind Eng. 2019;130(6):282–97. doi:10.1016/j.cie.2019.02.034. [Google Scholar] [CrossRef]
12. Ansari F, Glawar R, Nemeth T. PriMa: a prescriptive maintenance model for cyber-physical production systems. Int J Comput Integr Manuf. 2019;32(4–5):482–503. doi:10.1080/0951192X.2019.1571236. [Google Scholar] [CrossRef]
13. Abbate R, Caterino M, Fera M, Caputo F. Maintenance digital twin using vibration data. Procedia Comput Sci. 2022;200(21):546–55. doi:10.1016/j.procs.2022.01.252. [Google Scholar] [CrossRef]
14. Strakosch F, Nikoleizig H, Derbel F. Analysis and evaluation of vibration sensors for predictive maintenance of large gears with an appropriate test bench. In: Proceedings of the 2021 IEEE International Instrumentation and Measurement Technology Conference (I2MTC); 2021 May 17–20; Glasgow, UK. p. 1–6. doi:10.1109/I2MTC50364.2021.9460047. [Google Scholar] [CrossRef]
15. Ansari F, Glawar R, Sihn W. Prescriptive maintenance of CPPS by integrating multimodal data with dynamic Bayesian networks. In: Proceedings of the Machine Learning for Cyber Physical Systems: Selected Papers from the International Conference ML4CPS 2017; 2019 Apr 10; Berlin/Heidelberg, Germany. p. 1–8. doi:10.1007/978-3-662-59084-3_1. [Google Scholar] [CrossRef]
16. Calabrese M, Cimmino M, Fiume F, Manfrin M, Romeo L, Ceccacci S, et al. SOPHIA: an event-based IoT and machine learning architecture for predictive maintenance in Industry 4.0. Information. 2020;11(4):202. doi:10.3390/info11040202. [Google Scholar] [CrossRef]
17. Schwendemann S, Amjad Z, Sikora A. A survey of machine-learning techniques for condition monitoring and predictive maintenance of bearings in grinding machines. Comput Ind. 2021;125(1):103380. doi:10.1016/j.compind.2020.103380. [Google Scholar] [CrossRef]
18. Zhiyi H, Haidong S, Lin J, Junsheng C, Yu Y. Transfer fault diagnosis of bearing installed in different machines using enhanced deep auto-encoder. Measurement. 2020;152(3):107393. doi:10.1016/j.measurement.2019.107393. [Google Scholar] [CrossRef]
19. Toma RN, Prosvirin AE, Kim JM. Bearing fault diagnosis of induction motors using a genetic algorithm and machine learning classifiers. Senssors. 2020;20(7):1884. doi:10.3390/s20071884. [Google Scholar] [PubMed] [CrossRef]
20. Zhang S, Zhang S, Wang B, Habetler TG. Deep learning algorithms for bearing fault diagnostics—a review. In: Proceedings of the 2019 IEEE 12th International Symposium on Diagnostics for Electrical Machines, Power Electronics and Drives (SDEMPED); 2019 Aug 27–30; Toulouse, France. p. 257–63. doi:10.1109/DEMPED.2019.8864915. [Google Scholar] [CrossRef]
21. Zhang S, Zhang S, Wang B, Habetler TG. Deep learning algorithms for bearing fault diagnostics—a comprehensive review. IEEE Access. 2020;8:29857–81. doi:10.1109/ACCESS.2020.2972859. [Google Scholar] [CrossRef]
22. Han T, Liu C, Yang W, Jiang D. Deep transfer network with joint distribution adaptation: a new intelligent fault diagnosis framework for industry application. ISA Trans. 2020;97(6):269–81. doi:10.1016/j.isatra.2019.08.012. [Google Scholar] [PubMed] [CrossRef]
23. Ochella S, Shafiee M, Sansom C. Adopting machine learning and condition monitoring PF curves in determining and prioritizing high-value assets for life extension. Expert Syst Appl. 2021;176(10):114897. doi:10.1016/j.eswa.2021.114897. [Google Scholar] [CrossRef]
24. Cakir M, Guvenc MA, Mistikoglu S. The experimental application of popular machine learning algorithms on predictive maintenance and the design of IIoT based condition monitoring system. Comput Ind Eng. 2021;151(3):106948. doi:10.1016/j.cie.2020.106948. [Google Scholar] [CrossRef]
25. Albeladi K, Zafar B, Mueen A. Time series forecasting using LSTM and ARIMA. Int J Adv Comput Sci Appl. 2023;14(1):313–20. doi:10.14569/issn.2156-5570. [Google Scholar] [CrossRef]
26. Kontopoulou VI, Panagopoulos AD, Kakkos I, Matsopoulos GK. A review of ARIMA vs. machine learning approaches for time series forecasting in data driven networks. Future Internet. 2023;15(8):255. doi:10.3390/fi15080255. [Google Scholar] [CrossRef]
27. Li Y, Wu K, Liu J. Self-paced ARIMA for robust time series prediction. Knowl-Based Syst. 2023;269(7668):110489. doi:10.1016/j.knosys.2023.110489. [Google Scholar] [CrossRef]
28. Lee JH, Hong JK. Comparative performance analysis of RNN techniques for predicting concatenated normal and abnormal vibrations. Electronics. 2023;12(23):4778. doi:10.3390/electronics12234778. [Google Scholar] [CrossRef]
29. Afridi YS, Hasan L, Ullah R, Ahmad Z, Kim JM. LSTM-based condition monitoring and fault prognostics of rolling element bearings using raw vibrational data. Machines. 2023;11(5):531. doi:10.3390/machines11050531. [Google Scholar] [CrossRef]
30. He Y, Liu J, Wu S, Wang X. Condition monitoring and fault detection of wind turbine driveline with the implementation of deep residual long short-term memory network. IEEE Sens J. 2023;23(12):13360–76. doi:10.1109/JSEN.2023.3273279. [Google Scholar] [CrossRef]
31. Rama VSB, Hur SH, Yang JM. Short-term fault prediction of wind turbines based on integrated RNN-LSTM. IEEE Access. 2024;12:22465–78. doi:10.1109/ACCESS.2024.3364395. [Google Scholar] [CrossRef]
32. Bampoula X, Nikolakis N, Alexopoulos K. Condition monitoring and predictive maintenance of assets in manufacturing using LSTM-autoencoders and transformer encoders. Sensors. 2024;24(10):3215. doi:10.3390/s24103215. [Google Scholar] [PubMed] [CrossRef]
33. Yang H, Nikafshan Rad H, Hasanipanah M, Bakhshandeh Amnieh H, Nekouie A. prediction of vibration velocity generated in mine blasting using support vector regression improved by optimization algorithms. Nat Resour Res. 2020;29(2):807–30. doi:10.1007/s11053-019-09597-z. [Google Scholar] [CrossRef]
34. Moustafa SS, Abdalzaher MS, Yassien MH, Wang T, Elwekeil M, Hafiez HEA. Development of an optimized regression model to predict blast-driven ground vibrations. IEEE Access. 2021;9:31826–41. doi:10.1109/ACCESS.2021.3059018. [Google Scholar] [CrossRef]
35. Siłka J, Wieczorek M, Woźniak M. Recurrent neural network model for high-speed train vibration prediction from time series. Neural Comput Appl. 2022;34(16):13305–18. doi:10.1007/s00521-022-06949-4. [Google Scholar] [CrossRef]
36. Lu X, Sun J, Song Z, Li G, Wang Z, Hu Y, et al. Prediction and analysis of cold rolling mill vibration based on a data-driven method. Appl Soft Comput. 2020;96(1):106706. doi:10.1016/j.asoc.2020.106706. [Google Scholar] [CrossRef]
37. Yang Y, Du L, Li Q, Zhao X, Ni Z. Vibration prediction and analysis of the main beam of the TBM based on a multiple linear regression model. Sci Rep. 2024;14(1):3498. doi:10.1038/s41598-024-53868-6. [Google Scholar] [PubMed] [CrossRef]
38. Yang Z, Liu L, Li N, Tian J. Time series forecasting of motor bearing vibration based on informer. Sensors. 2022;22(15):5858. doi:10.3390/s22155858. [Google Scholar] [PubMed] [CrossRef]
39. Arifeen M, Petrovski A. Bayesian optimized autoencoder for predictive maintenance of smart packaging machines. In: Proceedings of the 2023 IEEE 6th International Conference on Industrial Cyber-Physical Systems (ICPS); 2023 May 8–11; Wuhan, China. p. 1–6. doi:10.1109/icps58381.2023.10128064. [Google Scholar] [CrossRef]
40. Ortiz R, Miranda-Chiquito P, Encalada-Davila A, Marquez LE, Tutiven C, Chatzi E, et al. An enhanced modeling framework for bearing fault simulation and machine learning-based identification with Bayesian-optimized hyperparameter tuning. J Comput Inf Sci Eng. 2024;24(9):091002. doi:10.1115/1.4065777. [Google Scholar] [CrossRef]
41. Zhang Y, García MM, Wan J. Optimal feature selection via bayesian optimisation for acoustic condition monitoring. In: Proceedings of the 2023 IEEE 14th International Symposium on Diagnostics for Electrical Machines, Power Electronics and Drives (SDEMPED); 2023 Aug 28–31; Chania, Greece. p. 542–6. doi:10.1109/sdemped54949.2023.10271429. [Google Scholar] [CrossRef]
42. Li X, Guo H, Xu L, Xing Z. Bayesian-based hyperparameter optimization of 1D-CNN for structural anomaly detection. Sensors. 2023;23(11):5058. doi:10.3390/s23115058. [Google Scholar] [PubMed] [CrossRef]
43. Chae S, Bae SJ. Bayesian hyper-parameter optimization in one-dimensional convolutional autoencoder for monitoring bearing health status. Int J Precis Eng Manuf-Smart Technol. 2024;2(1):15–22. doi:10.57062/ijpem-st.2023.0115. [Google Scholar] [CrossRef]
44. Kaur S, Sahota RS, Ying SY, Yin HT. Emerging trends in industry 4.0 and predictive maintenance. Abhigyan. 2025;43(1):54–67. doi:10.1177/09702385241280813. [Google Scholar] [CrossRef]
45. Pandit R, Astolfi D, Hong J, Infield D, Santos M. SCADA data for wind turbine data-driven condition/performance monitoring: a review on state-of-art, challenges and future trends. Wind Eng. 2023;47(2):422–41. doi:10.1177/0309524X221124031. [Google Scholar] [CrossRef]
46. Hutter F, Kotthoff L, Vanschoren J. Automated machine learning: methods, systems, challenges. Cham Switzerland: Springer Nature; 2019. 219 p. doi:10.1007/978-3-030-05318-5. [Google Scholar] [CrossRef]
47. Zoph B, Le QV. Neural architecture search with reinforcement learning. arXiv:1611.01578. 2016. [Google Scholar]
48. Elsken T, Metzen JH, Hutter F. Neural architecture search: a survey. J Mach Learn Res. 2019;20(55):1–21. [Google Scholar]
49. Wu J, Chen XY, Zhang H, Xiong LD, Lei H, Deng SH. Hyperparameter optimization for machine learning models based on Bayesian optimization. J Electron Sci Technol. 2019;17(1):26–40. doi:10.11989/JEST.1674-862X.80904120. [Google Scholar] [CrossRef]
50. Victoria AH, Maragatham G. Automatic tuning of hyperparameters using Bayesian optimization. Evol Syst. 2021;12(1):217–23. doi:10.1007/s12530-020-09345-2. [Google Scholar] [CrossRef]
Cite This Article
 Copyright © 2025 The Author(s). Published by Tech Science Press.
This work is licensed under a Creative Commons Attribution 4.0 International License , which permits unrestricted use, distribution, and reproduction in any medium, provided the original work is properly cited.
 Downloads
 Citation Tools