
 Submit a Paper
 Propose a Special lssue
 Open Access
ARTICLE
Pitcher Performance Prediction Major League Baseball (MLB) by Temporal Fusion Transformer
Department of Applied Artificial Intelligence, SungKyunKwan University, Seoul, 03063, Republic of Korea
* Corresponding Author: Jang Hyun Kim. Email:
Computers, Materials & Continua 2025, 83(3), 5393-5412. https://doi.org/10.32604/cmc.2025.065413
Received 12 March 2025; Accepted 09 April 2025; Issue published 19 May 2025
 View Full Text
 Download PDF
Abstract
Predicting player performance in sports is a critical challenge with significant implications for team success, fan engagement, and financial outcomes. Although, in Major League Baseball (MLB), statistical methodologies such as sabermetrics have been widely used, the dynamic nature of sports makes accurate performance prediction a difficult task. Enhanced forecasts can provide immense value to team managers by aiding strategic player contract and acquisition decisions. This study addresses this challenge by employing the temporal fusion transformer (TFT), an advanced and cutting-edge deep learning model for complex data, to predict pitchers’ earned run average (ERA), a key metric in baseball performance analysis. The performance of the TFT model is evaluated against recurrent neural network-based approaches and existing projection systems. In experimental results, the TFT based model consistently outperformed its counterparts, demonstrating superior accuracy in pitcher performance prediction. By leveraging the advanced capabilities of TFT, this study contributes to more precise player evaluations and improves strategic planning in baseball.Keywords
The ability to accurately predict player performance in professional sports holds immense value for teams and management. Player performance not only affects the outcome of individual games but also significantly influences the overall success of a team throughout the season, which thereby, directly impacts key management decisions, such as contract negotiations, roster management, and strategic planning. Performance prediction models are critical for enhancing the competitiveness and financial outcomes of a team in data-driven sports, such as baseball [1,2]. Historically, statistical methodologies, such as sabermetrics [3,4] have played a pivotal role in analyzing baseball player performances. Sabermetrics comprises various performance metrics that provide deeper insights into player contribution than do traditional statistics. However, these statistical approaches have limitations in fully capturing the inherent variability and complexity of sports. As a result, accurately forecasting future performance remains a critical challenge.
Recent developments in artificial intelligence techniques have unlocked new opportunities to enhance the precision of performance prediction. Conventional machine learning approaches, including linear regression and random forest models, are effective when the relationships within the data are relatively simple and straightforward. However, as data accumulate, more advanced models that are capable of learning from large datasets and complex patterns become necessary. Deep learning frameworks, especially those specialized for processing sequential data, such as recurrent neural networks (RNNs) [5–7], have demonstrated outstanding capability in processing time-series data. These models can overcome the limitations of traditional statistical approaches in analyzing future performances using historical data of players [8].
We propose the application of the temporal fusion transformer (TFT) [9], a transformer architecture tailored for multi-variable temporal data, to predict the player performance of Major League Baseball (MLB) pitchers. We focused on predicting the earned run average (ERA), a well-known indicator for evaluating pitchers. The ERA is a key metric that reflects a pitcher’s overall ability and is closely tied to team performance. The ability of the TFT model to handle both short and long-term dependencies in sequential data makes it especially effective in overcoming challenges. Furthermore, we assess the performance of the TFT model [9] through a cross-comparison with various RNN-based models [5–7]. We also compare their performance with the predictions of several projection systems, including Zymborski Projection System (ZiPS), a player projection system developed by Dan Simborsky of FanGraph.
This study demonstrates that the TFT model not only delivers high accuracy in predicting pitcher performance but also provides valuable insights to support better decision-making by teams. By improving the prediction key performance metrics, such as the ERA, this study contributes to the advancement of sports analytics and optimization of team strategies. The pipeline used in this study is illustrated in Fig. 1.

Figure 1: Overall pipeline of the proposed prediction system
2.1 Sports Performance Prediction
Sports research has not been actively conducted in the past. However, some studies have emerged recently to predict performance in sports activities [10–12]. With the increasing availability of sports data and advancements in machine learning, predictive modeling in sports has gained significant attention as a research area [13,14]. Prior to this study on baseball, various sports activities were occasionally the subject of research, including a study on cricket, which is a sport that was a major hit, dating back to southern England in the 17th century [15]. Cricket is a ball games with many similarities to baseball and is popular worldwide. This study proposes data mining and prediction approaches to analyze the data collected from cricket games to derive insights into game results and implement performance prediction method. Another study predicted marathon performance [16] and was distinguished by being the first to go beyond machine learning algorithms, and to use two artificial intelligence technologies: neural networks and k-nearest neighbors (KNN). By introducing these deep learning techniques, the regression problem was solved, and prediction performance was improved. Therefore, performance prediction research on sports exists, but further research is required in certain fields.
2.2 Advancements in Baseball Analytics
Multiple studies have explored predictive modeling in baseball, leveraging the vast amount of data generated during each game. Early research primarily focused on predicting game outcomes using machine learning models trained on fundamental baseball statistics, such as strikeouts, base on balls, and hits [17–19]. These studies typically employed traditional features to develop predictive models. Beyond game results, more specialized research has aimed to forecast specific performance metrics, such as the number of home runs hit by a player [20,21], batting average [22], or likelihood of injury [23]. Additionally, a study has investigated ERA prediction [2]. These studies primarily rely on widely used basic baseball metrics and often apply classical machine learning techniques, such as random forest (RF) and support vector machine (SVM) alongside feature selection and optimization methods. However, these approaches remain reliant on traditional baseball metrics, which do not fully capture the complexity of player performance.
To address these limitations, modern tracking technologies, such as Statcast1, have enabled the introduction of advanced metrics that provide more detailed assessments of player performance [24,25]. The introduction of Statcast, a tracking system that records player movements and ball trajectories, has allowed for the quantification of previously unmeasurable aspects of the game. Metrics such as exit velocity, launch angle, spin rate, and sprint speed provide granular insights into batting, pitching, and fielding performance to offer a more comprehensive evaluation framework. These advancements have not only refined player assessments but have also informed scouting decisions and in-game strategies, marking a significant shift in how baseball analytics are applied.
Domain-based data mining techniques are another significant research area [26,27]. Data mining not only extracts valuable insights from data but also provides practical assistance to domain experts. Traditionally, in the sports field, decision-making has been primarily based on the observations and experiences of domain experts, such as coaches and managers [28–30]. However, these decisions are often subject to inherent biases that can undermine objectivity. With the vast amounts of data accumulated in baseball over the decades, manually analyzing all available information has become increasingly impractical. In practice, judgments made by domain experts may vary depending on the situation and potentially affect game outcomes or player performance evaluations [1,2,15,16]. To overcome this issue, data mining approaches have been designed to complement the judgments of domain experts, thereby enabling them to make more objective and data-driven decisions [28,29]. By identifying patterns and tendencies within the data, data mining can capture subtle details that may be overlooked by experts, leading to more informed strategic decisions [27]. These methods have been particularly valuable in baseball, where high-dimensional data can provide insights beyond traditional scouting and coaching assessments.
In this study, we explored the significance of domain-based data mining methods in predicting the MLB pitcher performance [15]. Specifically, predicting the ERA of a pitcher using statistical approaches alone may not fully capture the performance of the pitcher. Combining data-mining techniques with deep learning models has the potential to address these limitations. Models such as the TFT [9], which are designed to handle complex multivariate time series data, are highly effective for predicting future performance based on historical data and allows managers and coaching staff to make more reliable, data-driven strategic decisions [28,29]. Domain-based data mining techniques can play crucial roles in not only predicting individual player performance but also improving overall team success [27], which thereby, makes teams more competitive and leads to more informed decision-making, as is demonstrated in this study through the application of advanced predictive models, such as TFT [9].
3.1 RNN-Based Models for Performance Forecasting
In this study, we use various RNN-based models to process time series data for player performance prediction [31,32]. Recurrent neural networks [5–7] are well-suited for modeling temporal dependencies, making them ideal for sequential data. Traditional RNNs encounter challenges such as vanishing and exploding gradients, which restrict their capacities to efficiently process long sequences. To overcome these limitations, more sophisticated RNN variants, such as long short-term memory (LSTM) [6,8,33,34], gated recurrent units (GRUs) [5,35,36], and bidirectional LSTM (BiLSTM) [7,37,38] have been developed. This study employed these models to predict player performances and compared their effectiveness.
LSTM [6,8,33,34] is an RNN architecture designed specifically to model long-term dependencies in time-series data. Unlike standard RNNs, LSTM incorporates gating mechanisms and memory cells to retain important information for extended periods and discards irrelevant data, making the LSTM highly effective for processing complex time series data without losing valuable information over long sequences. The LSTM plays a crucial role in player performance prediction by leveraging long-term historical data to forecast future outcomes.
A GRU [5,39,40] is another RNN variant that offers functionality similar to LSTM but features a more streamlined architecture. The GRU combines the input and forget gates into a unified update gate, thus improving its computational efficiency while maintaining its ability to handle long-term dependencies. Despite its streamlined structure, GRU performance is comparable to that of LSTM in many tasks involving time series prediction. In this study, a GRU was used to analyze the trade-off between efficiency and performance, offering insights into its simpler design compared with LSTM in terms of predictive accuracy.
BiLSTM [7,37,38] is an extension of LSTM that handles sequences both forward and backward. The traditional LSTM processes sequences in a unidirectional manner, whereas BiLSTM processes data in both past and future directions to enable a more holistic interpretation of the information. This makes BiLSTM particularly useful for tasks in which understanding the full context of a sequence is critical, such as player performance prediction, where both prior and subsequent game statistics can influence the predictions of the model. The bidirectional processing of data in BiLSTM can provide more accurate forecasts.
The LSTM, GRU, and BiLSTM are effective tools for handling and predicting time-series data. The LSTM and GRU are engineered to effectively manage extended patterns, whereas the BiLSTM processes data bidirectionally, thereby capturing a richer context. In this study, we used three RNN-based models to predict player performance and evaluated their effectiveness by comparing their results and analyzing their predictive capabilities.
3.2 Temporal Fusion Transformer (TFT)
The TFT model [9,41–44] was designed to address the challenges of time-series prediction by integrating several key deep learning components. A core feature of a TFT is a multi-head attention mechanism that learns the significance of various time steps and input variables to enable the model to prioritize the most pertinent information when making predictions. This mechanism helps to pinpoint the most critical data at each time point, leading to more accurate predictions. In addition, the TFT includes gating mechanisms that filter irrelevant information and selectively focus on important data, further enhancing predictive performance.
Among the key strengths of the TFT is its capability to address both short and long-term patterns in sequential datasets. Whereas traditional models such as RNNs and LSTMs [6,7] struggle to retain long-term dependencies across long sequences, the TFT overcomes this by combining recurrent layers with attention mechanisms, thereby allowing the model to effectively learn short-term trends while maintaining crucial long-term information. This capability is particularly useful in sports performance prediction [31,32], in which past performance affects future results and recent game outcomes may carry more weight.
In contrast to traditional RNN-based models, the TFT also leverages its multi-head attention mechanism and gating layers to dynamically identify and prioritize the most relevant temporal features, enabling it to effectively capture both short-term fluctuations and long-term dependencies in complex multivariate time-series data. By filtering out irrelevant information and emphasizing critical data points, the TFT provides a more nuanced understanding of player performance dynamics compared with conventional models.
Pitcher performance prediction is inherently a multivariate time-series problem that involves multiple input variables such as strikeouts, wins, and innings pitched. The TFT excels at handling such multivariate inputs by utilizing the attention mechanism to determine the significance of each variable and how they interact over time. This enables the model to account for the complex relationships among various performance metrics and thereby provide more precise and accurate predictions of future performance.
In this case, we trained a TFT model using historical MLB data, focusing on key pitcher performance metrics. The design of each TFT model is illustrated in Fig. 2, which highlights the key components, including the multi-head attention mechanism, gating layers, and static covariate encoders. In a multi-head attention TFT, the multi-head attention mechanism is formulated as:
where Q, K, and V indicate the query, key, and value matrices, respectively, and represents the dimensionality of the query or key. In addition, a gated relation network (GRN) layer was added to the full TFT. The gating mechanism is expressed as follows:
where
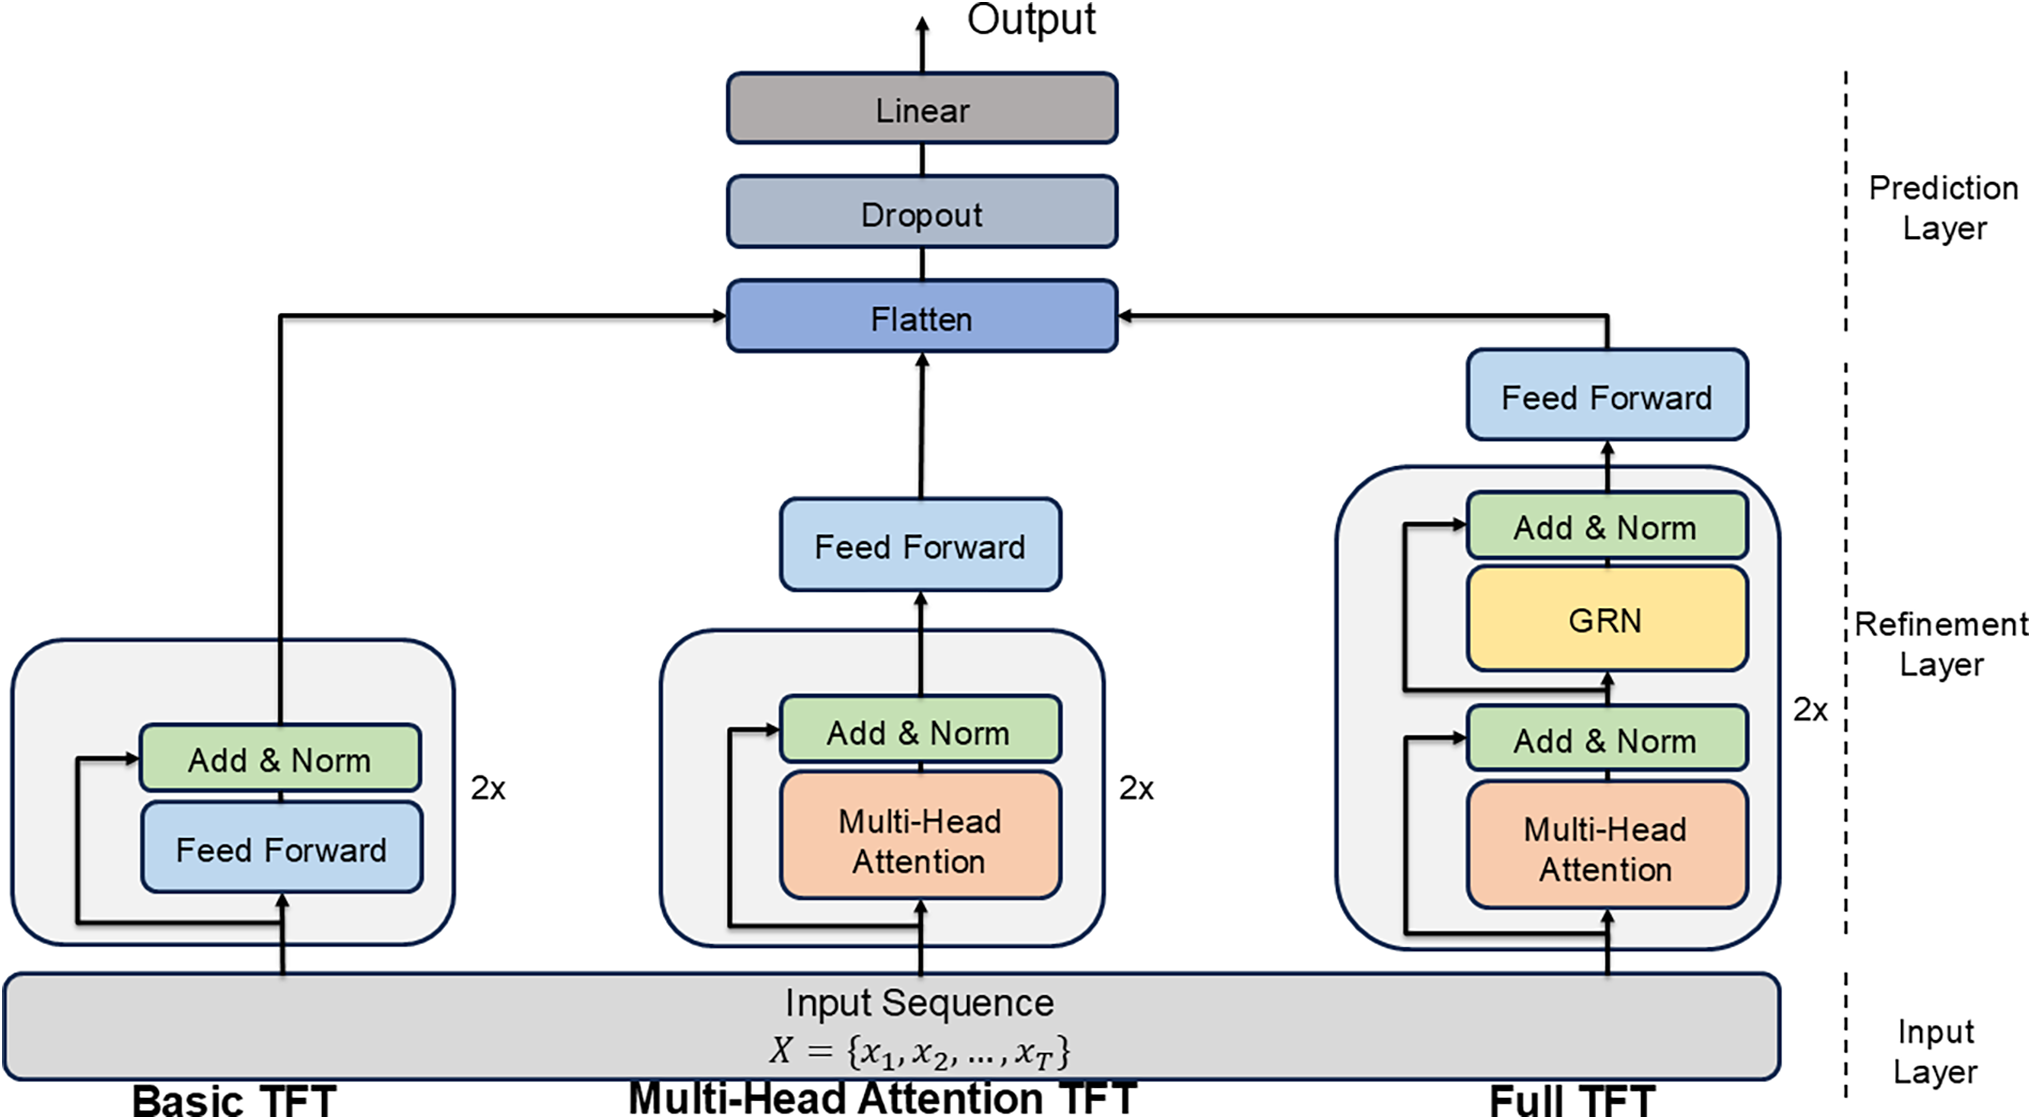
Figure 2: Simple architecture of basic, multi-head attention, and full TFT models
In this study, the performances of the predictive models were assessed using three commonly used evaluation metrics: root mean squared error (RMSE), mean absolute error (MAE), and mean absolute percentage error (MAPE). Each of these metrics offers valuable insights into the accuracy and dependability of the predictions of the model.
The RMSE is a widely utilized metric for evaluating the accuracy of continuous predictions, and it is calculated as the square root of the mean squared differences between predicted and actual values. The RMSE is particularly useful for penalizing larger errors more heavily, as it amplifies the impact of large prediction errors during squaring. The formula for RMSE is as follows:
where
The MAE measures the average absolute difference between the predicted and actual data points. In contrast to the RMSE, the MAE does not involve squaring the errors, such that all errors are treated equally, regardless of their magnitude. This metric is more robust to anomalies and delivers a more straightforward interpretation of the mean error, expressed in the same unit as the original data. The MAE formula is as follows:
3.3.3 Mean Absolute Percentage Error
The MAPE is a metric expressed as a percentage that quantifies the mean absolute percentage deviation between predicted and actual values. It is particularly helpful when the relative size of errors is important or when working with data on different scales. However, the MAPE has limitations when the actual values are near zero, as it may yield disproportionately large errors. The formula for the MAPE is as follows:
The RMSE, MAE, and MAPE offer unique perspectives for evaluating the predictive performance, with lower values across all three indicating more accurate predictions. In particular, the MAPE expresses errors as percentages, making it useful for interpreting relative errors. Together, these metrics offer a holistic evaluation of the performance of a model from various perspectives, leading to reliable and comprehensive results.
3.4 SHapley Additive exPlanations (SHAP)
To determine the specific contribution each feature makes to the predictions of the model, we employed SHapley Additive exPlanations (SHAP). SHAP interprets the prediction mechanism as a cooperative game, where each feature is considered a player, and the output of the model represents a payoff to be distributed among the players [45]. By systematically evaluating all possible feature subsets, SHAP assigns a Shapley value to each feature to quantify its individual and interactive effects on the prediction relative to a baseline [46]. In this study, we utilized KernelExplainer, a kernel-based approximation method, to compute per-feature contribution scores for each instance. These scores were then aggregated into a summary plot to illustrate the relative level of importance each feature as well as the directional impact of each feature on the predicted outcome [47]. This methodology not only provides a quantitative assessment of feature importance but also enhances the interpretability of the model by elucidating how specific feature values influence predictions in a theoretically sound and transparent manner.
MLB projection systems are sophisticated statistical tools designed to predict player and team performance by leveraging historical data, advanced metrics, and contextual adjustments. These systems have become integral to modern baseball analysis and are widely used in player evaluation, roster planning, and fantasy sports. Through this study, we analyzed and distinguished model performance using five well-established FanGraphs projection systems2: ZiPS, Average Total Cost (ATC), Depth Charts, Steamer, and THE BAT3. The evaluation focused on their accuracy and effectiveness in predicting player performance, particularly the ERA, and provides a comprehensive benchmark for assessing the capabilities of the proposed approach, relative to industry standards.
In this study, we analyzed data on MLB pitchers, using datasets derived from Statcast. Introduced in 2015, Statcast is an advanced tracking technology capable of capturing detailed information, such as pitch tracking, and bat tracking, in every MLB game. Currently, all 30 MLB ballparks are equipped with Statcast systems, and since the introduction of the Hawk-Eye technology in 2020, this system has achieved an impressive tracking rate of 99% for batted balls. Statcast data include precise tracking details, such as pitch trajectories, spin rates, and other metrics, that can be segmented by pitch type and location. Given that the experiment focused on predicting the ERA of a pitcher, we selected features specifically related to pitching performance. The dataset was constructed based on data from the official MLB Statcast site and encompassed regular seasonal records from 2015 to 2023. Postseason games were excluded from the analysis.
Two datasets, Basic and Statcast, were used for model training. Both datasets covered the 2015 to 2023 seasons and included pitchers who faced at least 150 batters in each season. The basic dataset consisted of 26 variables, excluding the target variable ‘ERA’, whereas the Statcast dataset included 45 variables. All variables included in each dataset are provided in Table 1. The dataset is organized into several key themes. Player info includes basic information about players and the number of games played. Game performance focuses on metrics related to game outcomes and player achievements. Pitching metrics captures the results of pitching events, including various rates and occurrences, such as the whiff percent, which represents the percentage of swings that miss, and meatballs, which refer to poorly executed pitches. Pitch zone metrics provides detailed insights into pitching zones and related statistics. Pitch characteristics highlights the specific attributes of different pitch types, such as speed, spin, and break. The Basic dataset emphasizes essential yet simpler variables, whereas the Statcast dataset offers more detailed and multidimensional pitching-related information. To guarantee the reliability of the predictive performance and interpretability of the model, all variables were selected considering multicollinearity (Pearson correlation coefficient

This experiment was conducted using 13 neural network models: LSTM-based, Bi-LSTM, convolutional neural network (CNN)-BiLSTM [37], encoder-decoder (ED)-BiLSTM [38], gated recurrent unit (GRU), Bidirectional-GRU (Bi-GRU) [36], Biattention-GRU [35] and TFT-based models. For the LSTM models, four variations were designed by altering layer sizes and configurations. After conducting an initial round of testing, the best-performing models from each category were selected for the final experiments. Specifically, one LSTM model with the highest performance, namely, the Biattention-GRU [35], and ED-BiLSTM [38] models were chosen as representative models for use in the final evaluation. The TFT models consist of the basic model, multi-head attention, and extended full models.
4.3 Relationship between Team ERA and Team Winning Rates
As a critical metric for evaluating pitcher performance, ERA is closely linked to team success. Fig. 3a illustrates the correlation between the team ERA and winning percentage for all 30 MLB teams from the 2000 to 2023 seasons. In general, the correlation coefficients varied from −0.5 to −0.9, indicating an inverse relationship between the team ERA and winning percentage. Therefore, lowering the ERA of a team is essential for improving the winning percentage, and this relationship has become more pronounced in recent years.

Figure 3: (a) ERA correlation with win rate in 2000 to 2023, (b) Heatmap of ERA and win rate rank. In the rank system, a higher win rate corresponds to a higher win rate rank, whereas a higher ERA rate corresponds to a lower ERA rank
When grouping teams by ERA and denoting the winning percentage in increments of five, a similar trend emerged. As shown in Fig. 3b, the top-left corner highlights the teams with the five lowest ERAs with an 80% probability of ranking in the top 10 in terms of winning percentage. Conversely, the bottom-right corner of Fig. 3b shows that teams with the five highest ERAs more than a 90% chance of finishing below the top 20 in terms of winning percentage.
This analysis underscores the significant impact of the ERA on baseball. Predicting the ERA is not only a key factor in evaluating individual pitchers but also a crucial element in shaping the performance of a team throughout a season.
4.4 Key Factors in Experimental Design
Diversity was compared based on three key factors: data, period, and sequence length.
First, variation experiments were conducted using two different datasets: Basic and Statcast. This allowed us to compare model performance by employing different metrics and thereby assess how choosing different data influences predictive performance.
Using the latest data is crucial for enhancing prediction accuracy. In dynamic environments such as professional baseball, the latest data reflect recent trends and evolving gameplay, making them critical for enhancing model performance [48,49]. Therefore, the testing periods were divided into 2019 and 2023, and training was conducted using data from 2015 to 2023. Although the 2020 MLB season was shortened owing to the COVID-19 pandemic, which potentially affected data completeness, the experimental setup was designed to minimize the impacts of such disruptions while ensuring robust model training and evaluation.
In studies focusing on predicting sequential data, the sequence length plays a crucial role [50,51]. Determining the appropriate sequence length depends on data continuity, which can significantly influence prediction performance [52]. Similarly, in sports, the effective time span for predicting player performance varies among individuals, making it essential to determine the number of relevant seasons required for accurate prediction. In this experiment, the input variables are represented as a three-dimensional tensor:
where B is the batch size, L is the sequence length, and F is the number of features. The sequence length L was varied to analyze its effect on the prediction performance. Specifically, three variations in sequence length were tested:
For example, a sequence length of four uses data from the previous four seasons to make predictions, and all four seasons must meet the requirement of PA
The models were trained five times to validate generalization, and the final results were averaged to ensure robustness. We utilized a grid search to evaluate all possible parameter combinations within a predefined range, optimize the model hyperparameters, and determine the optimal settings for achieving the best performance in the TFT models [41–43]. The models were trained using an NVIDIA GeForce RTX 4090 GPU. Including hyperparameter optimization, training each TFT-based model required 6 h, while training a single model instance took 10 min. The optimized parameters include a state size of 80, dropout rate of 0.2, minibatch size of 128, learning rate of 0.01, maximum gradient norm of 0.01, and single attention head. These hyperparameters were fine-tuned to achieve optimal performance during training for the Full-TFT model trained on the Basic dataset for the year 2023 with a sequence length of 4. Additionally, early stopping and cross-validation were employed across all models to prevent overfitting and improve generalizability.
We tested six baseline models to assess their effectiveness in ERA prediction. We divided the experiments according to the Basic and Statcast datasets, tested two target years, namely, 2019 and 2023, and varied the sequence length to examine how much historical data should be used. The experimental outcomes for both datasets are provided in Tables 2 and 3, respectively. The performance was evaluated using RMSE, MAE, and MAPE across different sequence lengths (SL = 2, 3, 4) for both the 2019 and 2023 periods.


In both datasets, the Full-TFT models consistently outperformed the other models across all metrics. For example, in the 2023 Basic dataset with SL = 4, Full-TFT achieved an RMSE of 0.4807, MAE of 0.3634, and MAPE of 0.0833, demonstrating the highest accuracy among all models. Similarly, in the Statcast dataset under the same conditions, Full-TFT recorded an RMSE of 0.5409, MAE of 0.4228, and MAPE of 0.1025. These results indicate the best performance of TFT-based models in predicting the ERA, particularly when using longer sequence lengths in the Basic dataset. The ED-BiLSTM model exhibited the second-best performance in most cases. For instance, in the 2023 Basic dataset with SL = 4, ED-BiLSTM achieved an RMSE of 0.5354, MAE of 0.4096, and MAPE of 0.0973, which were close to the performance of the TFT-based models. These results highlight its effectiveness in learning both long-range and sequential relationships in the dataset, thanks to its encoder-decoder structure. LSTM and Biattention-GRU also showed competitive performance, particularly with shorter sequence lengths. For example, in the 2023 Basic dataset with SL = 2, LSTM recorded an RMSE of 0.5663 and MAPE of 0.1338, outperforming several other models. However, their performance decreased slightly as sequence lengths increased, suggesting limitations in processing extended temporal dependencies.
Overall, the findings emphasize the importance of advanced architectures, such as attention mechanisms and encoder-decoder designs, in effectively handling multivariate time-series data. The superior performance of the TFT-based models highlights their ability to learn from long-term data and leverage extensive historical information to enhance predictive accuracy. These results underscore the strength and flexibility of the proposed models, which makes them highly effective for use in managing and analyzing extended time-series datasets, thereby demonstrating their applicability to complex predictive tasks.
To investigate the influence of data composition, we compared two datasets: Basic and Statcast. This comparison aims to assess the effectiveness of traditional statistics vs. detailed motion-based data in predicting pitcher performance. The Basic dataset includes commonly used metrics, whereas the Statcast dataset leverages 3D motion tracking technology to provide detailed information on pitch type, velocity, and spin.
The average performance of the Basic and Statcast datasets across all models, based on RMSE, was 0.709 for Basic and 0.807 for Statcast, indicating a lower error of approximately 0.1 for the Basic dataset. Overall, the Basic dataset consistently outperformed the Statcast dataset across all evaluation metrics. This suggests that the Basic dataset, which includes more intuitive and traditional variables, may have a stronger correlation with player performance. However, given that the difference is only about 0.1, detailed 3D motion-based data also hold significant potential as key indicators in sports performance analysis.
We next examined how the choice of the prediction target year affects accuracy. Data from 2015 to 2023 were divided into two intervals to conduct experiments predicting the ERA for 2019 and 2023. In 2019, only data from 2015 and 2018 were used, whereas data from 2019 to 2022 were used for 2023. This approach was chosen to assess whether the use of more recent data contributes to improved predictive accuracy [48], especially in rapidly evolving environments, such as professional baseball. As the actual ERA data for 2019 and 2023 were available, the model performance was evaluated by measuring the discrepancy between the predicted and real outcomes.
The results show that the models targeting 2023 ERA prediction achieved a lower RMSE (0.723 vs. 0.793) than those predicting the ERA for 2019. Similarly, for the other evaluation metrics, the predictions for 2023 are closer to the actual values. These results highlight how recent performance trends and player conditions reflected in the latest data can enhance the predictive power of models. Although this study compared only two target years, the observed trend suggests potential for further validation with additional time intervals.
5.2.3 Sequence Length Variation
Finally, we investigated how much historical data should be included by varying the sequence length from 2 to 4 years. This was tested by varying the sequence length in the time-series model using the most recent 2, 3, or 4 years of data to predict a given target year. For instance, when predicting the ERA for 2019, a sequence length of 2 utilized data from 2017 and 2018, whereas a sequence length of 3 incorporated data from 2016 to 2018.
The results indicate a significant variation in prediction performance as the sequence length increases. As presented in Fig. 4, the average RMSE across all models was lowest at 0.627 when the sequence length was 2. However, as the sequence length increased to 3, the RMSE rose to 0.656, and this was followed by a slight decrease to 0.635 at sequence length = 4. This trend suggests that recent data play a crucial role in capturing the current performance of a player [53], likely owing to dynamic factors, such as changes in form or playing conditions. Notably, when comparing TFT-based models such as Basic-TFT, MHA-TFT, and Full-TFT with Non-TFT models, such as LSTM, ED-BiLSTM, and BiAttenion-GRU, the TFT-based models consistently outperformed their counterparts across all sequence lengths, demonstrating their effectiveness in processing sequential data. However, within the TFT-based category, the RMSE of the Basic and MHA-TFT models increased slightly from 0.634 to 0.642 when the sequence length increased from 2 to 3. In contrast, Full-TFT exhibited the most robust performance, with its RMSE decreasing from 0.621 at a sequence length of 2 to 0.607 at a sequence length of 3. These results indicate that the proposed TFT-based models are particularly well-suited for learning from long-term dependencies, as they effectively leverage historical data to enhance predictive accuracy.
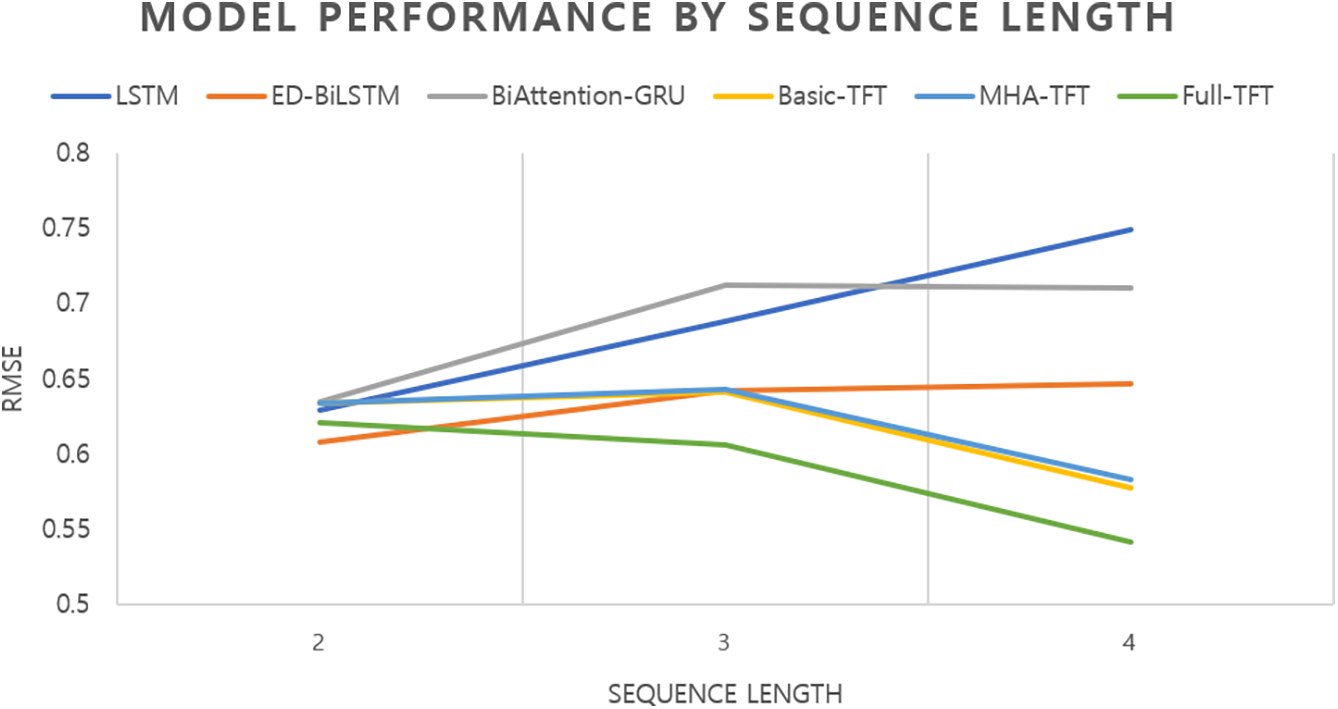
Figure 4: Performance (RMSE) average of all baseline models across different sequence lengths
Overall, the findings highlight the importance of selecting an appropriate training period that effectively incorporates recent data. Furthermore, the proposed TFT-based models, particularly Full-TFT, demonstrated consistent performance across different sequence lengths, thus confirming their suitability for dynamic time-series prediction tasks.
5.3 Feature Contribution Analysis Using SHAP
The SHAP summary plot in Fig. 5 shows that the slugging percentage, number of wins, and strikeout percentage have the greatest influence on ERA prediction. The horizontal axis shows the contribution of each feature: negative values mean that the feature lowers the predicted ERA, and positive values mean that raises the predicted ERA. The point colors distinguish lower feature values, which are displayed in blue, from higher feature values, which are displayed in red, illustrating how the different levels of each feature affect the predictions of the models. For instance, the SHAP values for slugging percentage mostly appear in the positive range, approximately between 0 and 0.02, and show a strong trend towards red, indicating that higher slugging percentages typically lead to an increase in the predicted ERA. In contrast, the number of wins and strikeout percentage predominantly display negative SHAP values with red points, signifying that lower values in these metrics are associated with an increase in predicted ERA. Additionally, features listed toward the bottom of the chart, such as the number of holds and average spin rate of off-speed pitches, have noticeably smaller impacts on the predictions. Overall, this chart demonstrates which features the model focuses on most when predicting ERA.
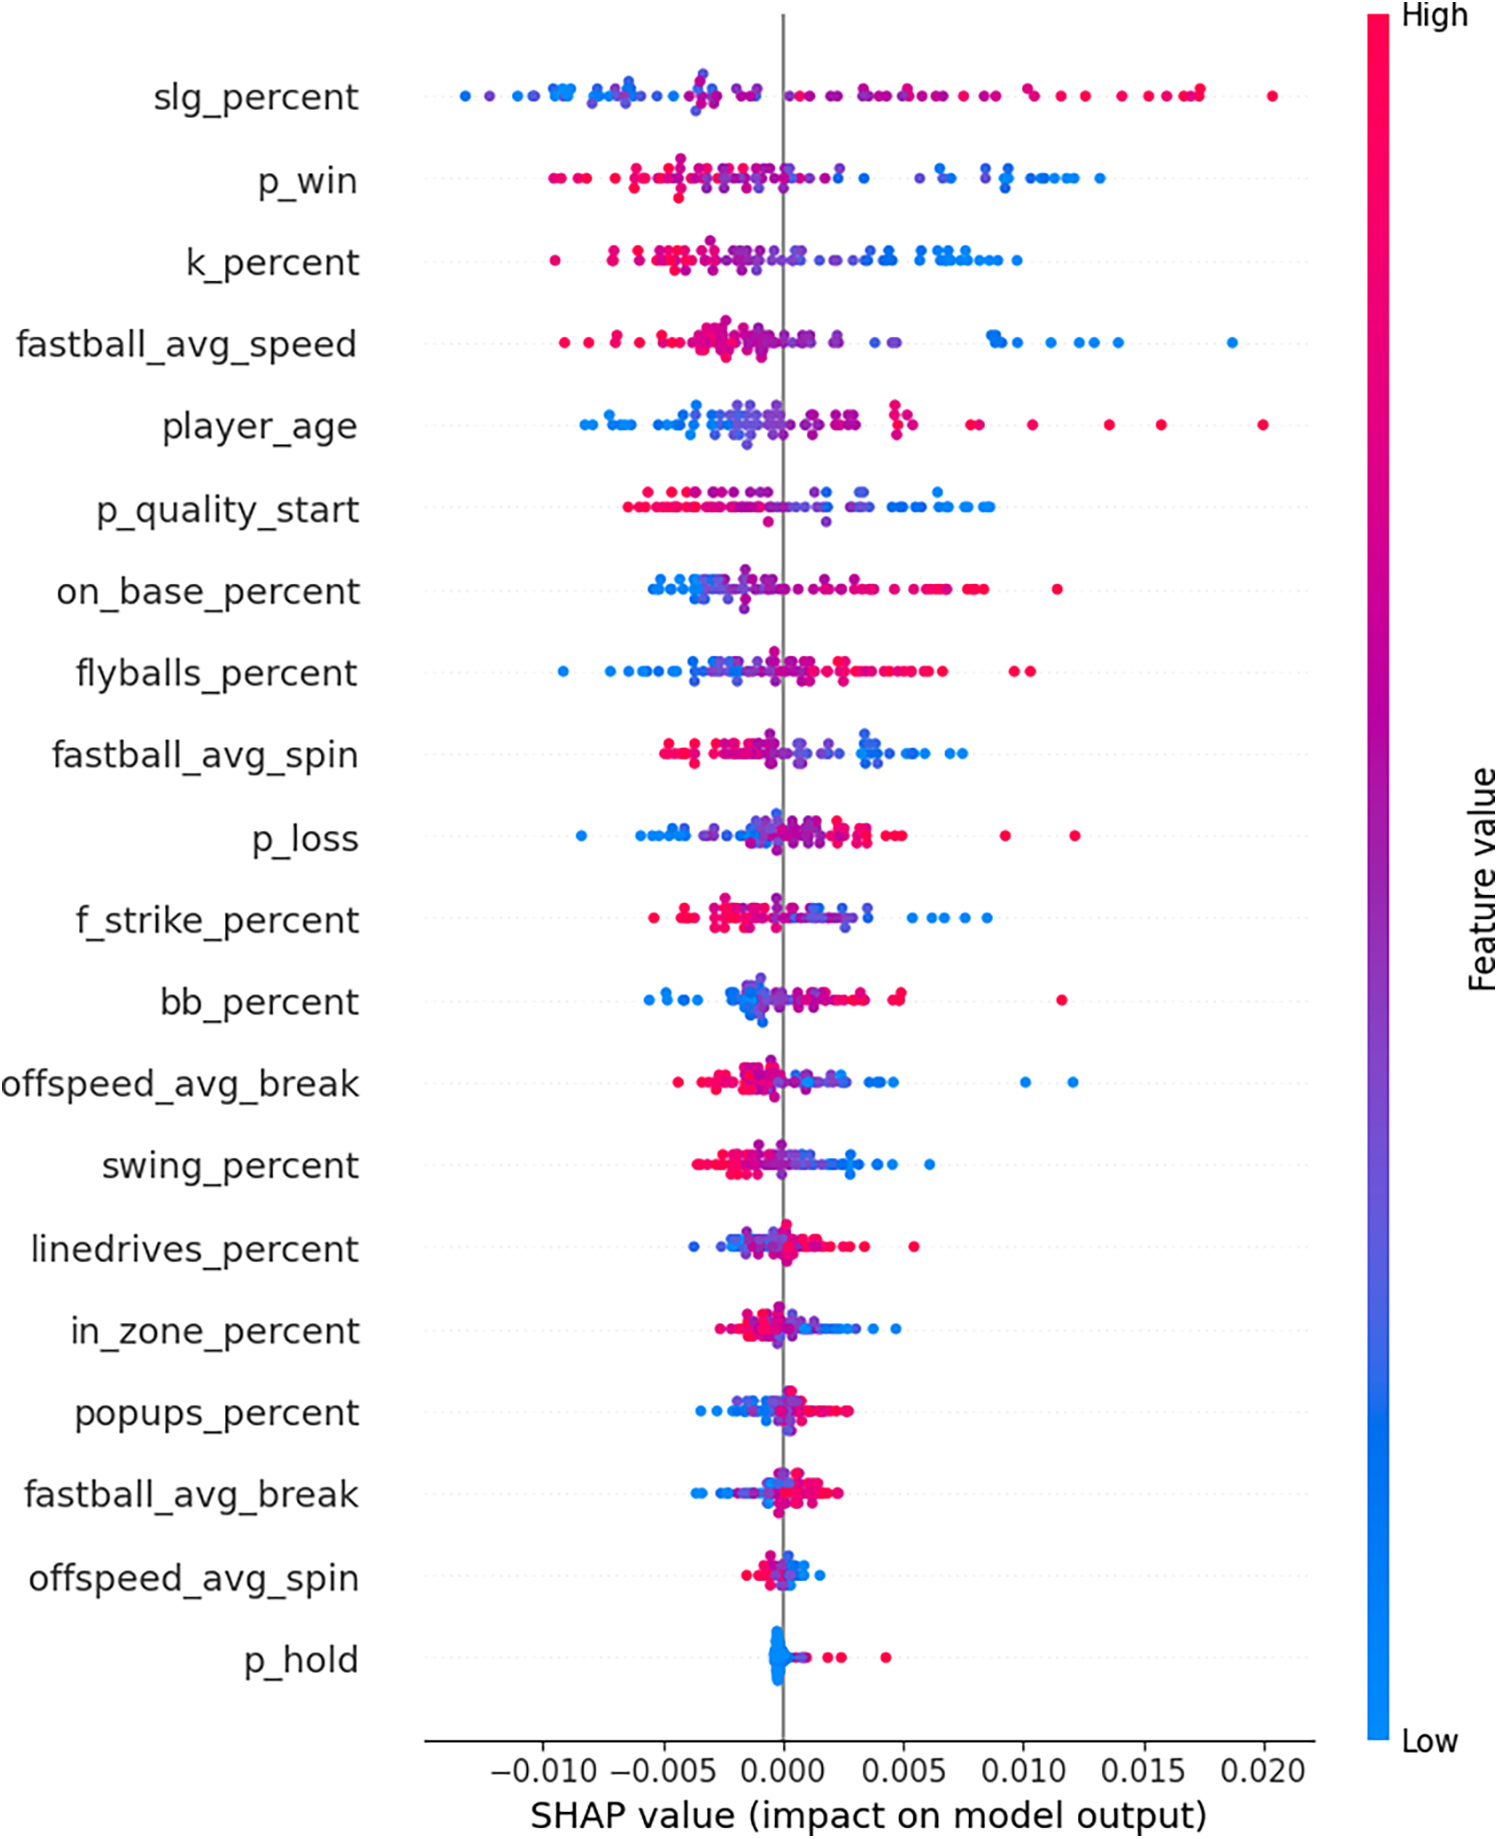
Figure 5: This plot corresponds to the SHAP analysis of the Full-TFT model trained on the basic dataset, which was identified as the best-performing proposed model. The coloring denotes the comparative level of each feature: blue signals lesser values, red signals greater values, and the horizontal axis reflects the impact of the feature on the predicted outcome (negative or positive)
5.4 Comparison with Existing Projection Systems
To assess the predictive accuracy of the proposed model, we compared the ERA predictions for 2024 with actual ERA values and projections from various existing systems. The top-performing models, specifically, the Full-TFT model with SL = 4, which achieved the best results for the 2023 target period, were selected based on their performance for the target period of 2024 using two datasets: Basic and Statcast. As shown in Table 4, the proposed models consistently demonstrate lower prediction errors than do the five projection systems, with the model based on the basic dataset outperforming in most cases. These findings highlight the potential of integrating advanced deep learning techniques, such as TFT [9], with diverse datasets, which significantly enhances the accuracy of player performance predictions in sports analytics [20,31,32].

This study predicted the ERAs of MLB pitchers using advanced neural network models, specifically, the temporal fusion transformer (TFT). The results demonstrate that TFT-based models outperform traditional projection systems, particularly when utilizing recent data, thus underscoring the importance of capturing current trends in player performance. Among the various models tested, the TFT achieved the highest predictive accuracy, effectively capturing temporal dependencies and complex interactions within baseball statistics. Unlike traditional projection systems [1,20], which often rely on fixed statistical assumptions and historically weighted variables, the TFT dynamically adapts to evolving player performance and thereby leads to more precise forecasts. By incorporating state-of-the-art deep learning models and benchmarking against established projection systems, this study highlights the significant benefits of leveraging modern machine learning techniques in sports analytics.
Additionally, this study incorporated Statcast data into the predictive framework, introducing recently available tracking-based metrics into the learning process. Contrary to our expectations, models utilizing basic baseball metrics continued to outperform those incorporating Statcast variables. One plausible explanation for this outcome is the inherent granularity of Statcast data, which captures pitch-by-pitch variations rather than broader, season-long trends. While these detailed measurements provide valuable insights into specific in-game events [24,25], they may not be optimally suited for forecasting long-term performance. Conversely, traditional baseball metrics that aggregate game-specific outcomes and performance indicators have been extensively validated over time and hence offer a more reliable representation of overall player effectiveness. Given that the primary objective of this study is to predict pitcher ERA for the subsequent season, the Basic data align naturally with this forecasting goal, as season-long performance is essentially a cumulative reflection of individual game results. These findings reaffirm previous research [20–22], and support the argument that traditional baseball metrics, characterized by their stability and established predictive value, remain highly effective for forecasting the long-term performances of players.
Beyond model performance, this study underscores the value of data-driven decision-making through the application of domain-based data mining techniques. By systematically extracting meaningful insights from large-scale baseball datasets, the proposed approach enhances prediction reliability while reducing the biases inherent in traditional scouting and evaluation methods. The improvements in predictive accuracy benefit multiple stakeholders within baseball organizations. Teams can utilize more precise ERA forecasts for player acquisition strategies and thus optimize trades and contract negotiations with greater confidence. Individual players can gain a more accurate reflections of their value, enabling them to negotiate fairer contracts and tailor their training regimens to address potential performance declines. From a broader perspective, franchises can incorporate these predictive tools into their long-term roster planning to enhance overall team competitiveness. The integration of domain-based data mining techniques with deep learning further reinforces the potential of AI-driven analytics in baseball, thus providing a foundation for more data-informed decision-making at every level of the sport.
To better realize the potential benefits of Statcast data, future research could employ specialized modeling approaches tailored explicitly for detailed tracking-based data. For example, considering the inherent spatial and temporal characteristics of tracking data, promising approach involves transforming numerical tracking information into visual formats, enabling multimodal learning methods, such as convolutional neural networks or vision transformers.
Furthermore, while the datasets used in this study provided valuable insights, their limited scope and potential biases, such as selection biases toward pitchers with sufficient playing time or the exclusion of minor injuries and performance variations, present challenges in capturing all relevant patterns of player performance over extended periods. Future studies could enhance prediction accuracy by incorporating additional features such as injury history, physical attributes, and biomechanical data. These supplementary factors could be integrated with existing variables within the model or utilized as multimodal input to potentially yield more comprehensive predictive insights.
Last, further variable analysis and selection could enable the extension of the proposed model to other player positions, such as number of hits for batters or number of errors for fielders, thus improving its overall generalizability, broadening applications within sports analytics, and facilitating greater understanding and practical utilization of prediction results.
Acknowledgement: None.
Funding Statement: This study is supported by SKKU Global Research Platform Research Fund, Sungkyunkwan University, 2024–2025.
Author Contributions: The authors confirm contribution to the paper as follows: study conception and design: Wonbyung Lee, Jang Hyun Kim; data collection: Wonbyung Lee; analysis and interpretation of results: Wonbyung Lee; manuscript draft preparation: Wonbyung Lee, Jang Hyun Kim. All authors reviewed the results and approved the final version of the manuscript.
Availability of Data and Materials: The datasets are openly available at Statcast: https://baseballsavant.mlb.com/statcast_search (accessed on 08 April 2025).
Ethics Approval: Not applicable.
Conflicts of Interest: The authors declare no conflicts of interest to report regarding the present study.
1https://baseballsavant.mlb.com/statcast_search (accessed on 08 April 2025).
2The source from: https://www.fangraphs.com/ (accessed on 08 April 2025).
3THE BAT projections courtesy of Derek Carty.
References
1. Silver J, Huffman T. Baseball predictions and strategies using explainable AI. In: The 15th Annual MIT Sloan Sports Analytics Conference; 2021 Apr 8–9; Online. p. 1–20. [Google Scholar]
2. Oh YH. High-school baseball pitcher’s ERA (Earned Run Average) prediction using multi-variable linear regression analysis method. J Knowl Inf Technol Syst. 2020;14(4):497–506. [Google Scholar]
3. Hendela K. Sabermetric analysis: wins-above-replacement. Locus: Seton Hall J Undergrad Res. 2020;3(1):7. doi:10.70531/2573-2749.1028. [Google Scholar] [CrossRef]
4. Moorefield J. The Oakland Athletics use of sabermetrics and the rise of big data analytics in business [master’s thesis]. Chattanooga, TN, USA: University of Tennessee at Chattanooga; 2021. [Google Scholar]
5. Dey R, Salem FM. Gate-variants of gated recurrent unit (GRU) neural networks. In: 2017 IEEE 60th International Midwest Symposium on Circuits and Systems (MWSCAS). Medford, MA, USA; 2017. p. 1597–600. [Google Scholar]
6. Graves A. Long short-term memory. Supervised sequence labelling with recurrent neural networks. 1st ed. Berlin/Heidelberg Germany: Springer; 2012. p. 37–45. [Google Scholar]
7. Jin R, Chen Z, Wu K, Wu M, Li X, Yan R. Bi-LSTM-based two-stream network for machine remaining useful life prediction. IEEE Trans Instrum Meas. 2022;71:1–10. doi:10.1109/TIM.2022.3167778. [Google Scholar] [CrossRef]
8. Fischer T, Krauss C. Deep learning with long short-term memory networks for financial market predictions. Eur J Oper Res. 2018;270(2):654–69. doi:10.1016/j.ejor.2017.11.054. [Google Scholar] [CrossRef]
9. Lim B, Arık SÖ, Loeff N, Pfister T. Temporal fusion transformers for interpretable multi-horizon time series forecasting. Int J Forecast. 2021;37(4):1748–64. doi:10.1016/j.ijforecast.2021.03.012. [Google Scholar] [CrossRef]
10. Zhao H, Li W, Gan L, Wang S. Designing a prediction model for athlete’s sports performance using neural network. Soft Computing. 2023;27(19):14379–95. doi:10.1007/s00500-023-09091-y. [Google Scholar] [CrossRef]
11. Den Hartigh RJ, Niessen ASM, Frencken WG, Meijer RR. Selection procedures in sports: improving predictions of athletes’ future performance. Eur J Sport Sci. 2018;18(9):1191–8. doi:10.1080/17461391.2018.1480662. [Google Scholar] [PubMed] [CrossRef]
12. Min B, Kim J, Choe C, Eom H, McKay R. A compound framework for sports prediction: the case study of football. Knowl Based Syst. 2008;21(7):551–62. doi:10.1016/j.knosys.2008.03.016. [Google Scholar] [CrossRef]
13. Sun W. Sports performance prediction based on chaos theory and machine learning. Wirel Commun Mob Comput. 2022;2022(1):3916383. doi:10.1155/2022/3916383. [Google Scholar] [CrossRef]
14. Lu G. Prediction model and data simulation of sports performance based on the artificial intelligence algorithm. Comput Intell Neurosci. 2022;2022(1):7238789. doi:10.1155/2022/7238789. [Google Scholar] [PubMed] [CrossRef]
15. Anuraj A, Boparai GS, Leung CK, Madill EW, Pandhi DA, Patel AD, et al. Sports data mining for cricket match prediction. In: International Conference on Advanced Information Networking and Applications. Cham; 2023. p. 668–80. [Google Scholar]
16. Lerebourg L, Saboul D, Clémençon M, Coquart JB. Prediction of marathon performance using artificial intelligence. Int J Sports Med. 2023;44(5):352–60. doi:10.1055/a-1993-2371. [Google Scholar] [PubMed] [CrossRef]
17. Huang ML, Li YZ. Use of machine learning and deep learning to predict the outcomes of major league baseball matches. Appl Sci. 2021;11(10):4499. doi:10.3390/app11104499. [Google Scholar] [CrossRef]
18. Cui AY. Forecasting outcomes of major league baseball games using machine learning [master’s thesis]. Philadelphia, PA, USA: University of Pennsylvania; 2020. [Google Scholar]
19. Li SF, Huang ML, Li YZ. Exploring and selecting features to predict the next outcomes of MLB games. Entropy. 2022;24(2):288. doi:10.3390/e24020288. [Google Scholar] [PubMed] [CrossRef]
20. Sun HC, Lin TY, Tsai YL. Performance prediction in major league baseball by long short-term memory networks. Int J Data Sci Anal. 2023;15(1):93–104. doi:10.1007/s41060-022-00313-4. [Google Scholar] [CrossRef]
21. Fellingham GW, Fisher JD. Predicting home run production in Major League Baseball using a Bayesian semiparametric model. Am Stat. 2018;72(3):253–64. doi:10.1080/00031305.2017.1401959. [Google Scholar] [CrossRef]
22. Bailey SR, Loeppky J, Swartz TB. The prediction of batting averages in major league baseball. Stats. 2020;3(2):84–93. doi:10.3390/stats3020008. [Google Scholar] [CrossRef]
23. Koseler K, Stephan M. Machine learning applications in baseball: a systematic literature review. Appl Artif Intell. 2017;31(9–10):745–63. doi:10.1080/08839514.2018.1442991. [Google Scholar] [CrossRef]
24. Lage M, Ono JP, Cervone D, Chiang J, Dietrich C, Silva CT. Statcast dashboard: exploration of spatiotemporal baseball data. IEEE Comput Graph Appl. 2016;36(5):28–37. doi:10.1109/MCG.2016.101. [Google Scholar] [PubMed] [CrossRef]
25. Kagan D, Nathan AM. Statcast and the baseball trajectory calculator. Phys Teach. 2017;55(3):134–6. [Google Scholar]
26. Schumaker RP, Solieman OK, Chen H. Sports knowledge management and data mining. Annu Rev Inf Sci Technol. 2010;44(1):115–57. doi:10.1002/aris.2010.1440440110. [Google Scholar] [CrossRef]
27. Rastegari H, Haghighat M, Nourafza N. A review of data mining techniques for result prediction in sports. Adv Comput Sci. 2013;2(5):7–12. [Google Scholar]
28. Baker J, Cote J, Abernethy B. Sport-specific practice and the development of expert decision-making in team ball sports. J Appl Sport Psychol. 2003;15(1):12–25. doi:10.1080/10413200305400. [Google Scholar] [CrossRef]
29. Lorains M, Ball K, MacMahon C. Performance analysis for decision making in team sports. Int J Perf Anal Sport. 2013;13(1):110–9. doi:10.1080/24748668.2013.11868635. [Google Scholar] [CrossRef]
30. Cotterill S, Discombe R. Enhancing decision-making during sports performance: current understanding and future directions. Sport Exerc Psychol Rev. 2016;12(1):54–68. doi:10.53841/bpssepr.2016.12.1.54. [Google Scholar] [CrossRef]
31. Mittal H, Rikhari D, Kumar J, Singh AK. A study on machine learning approaches for player performance and match results prediction. arXiv:210810125. 2021. [Google Scholar]
32. Iyer SR, Sharda R. Prediction of athletes performance using neural networks: an application in cricket team selection. Expert Syst Appl. 2009;36(3):5510–22. doi:10.1016/j.eswa.2008.06.088. [Google Scholar] [CrossRef]
33. Yu Y, Si X, Hu C, Zhang J. A review of recurrent neural networks: LSTM cells and network architectures. Neural Comput. 2019;31(7):1235–70. doi:10.1162/neco_a_01199. [Google Scholar] [PubMed] [CrossRef]
34. Gers FA, Schmidhuber J, Cummins F. Learning to forget: continual prediction with LSTM. Neural Comput. 2000;12(10):2451–71. doi:10.1162/089976600300015015. [Google Scholar] [PubMed] [CrossRef]
35. Cao Y, Hao Y, Li B, Xue J. Depression prediction based on BiAttention-GRU. J Ambient Intell Humaniz Comput. 2022;13(11):5269–77. doi:10.1007/s12652-021-03497-y. [Google Scholar] [CrossRef]
36. Tao Q, Liu F, Li Y, Sidorov D. Air pollution forecasting using a deep learning model based on 1D convnets and bidirectional GRU. IEEE Access. 2019;7:76690–8. doi:10.1109/ACCESS.2019.2921578. [Google Scholar] [CrossRef]
37. Song JW, Park YI, Hong JJ, Kim SG, Kang SJ. Attention-based bidirectional LSTM-CNN model for remaining useful life estimation. In: 2021 IEEE International Symposium on Circuits and Systems (ISCAS). Online; 2021. p. 1–5. [Google Scholar]
38. Yu W, Kim IY, Mechefske C. Remaining useful life estimation using a bidirectional recurrent neural network based autoencoder scheme. Mech Syst Signal Process. 2019;129:764–80. doi:10.1016/j.ymssp.2019.05.005. [Google Scholar] [CrossRef]
39. Buslim N, Rahmatullah IL, Setyawan BA, Alamsyah A. Comparing bitcoin’s prediction model using GRU, RNN, and LSTM by hyperparameter optimization grid search and random search. In: 2021 9th International Conference on Cyber and IT Service Management (CITSM). Bengkulu, Indonesia; 2021. p. 1–6. [Google Scholar]
40. Hussain B, Afzal MK, Ahmad S, Mostafa AM. Intelligent traffic flow prediction using optimized GRU model. IEEE Access. 2021;9:100736–46. doi:10.1109/ACCESS.2021.3097141. [Google Scholar] [CrossRef]
41. Wu B, Wang L, Zeng YR. Interpretable wind speed prediction with multivariate time series and temporal fusion transformers. Energy. 2022;252:123990. doi:10.1016/j.energy.2022.123990. [Google Scholar] [CrossRef]
42. Zhang H, Zou Y, Yang X, Yang H. A temporal fusion transformer for short-term freeway traffic speed multistep prediction. Neurocomputing. 2022;500(21):329–40. doi:10.1016/j.neucom.2022.05.083. [Google Scholar] [CrossRef]
43. Hu X. Stock price prediction based on temporal fusion transformer. In: 2021 3rd International Conference on Machine Learning, Big Data and Business Intelligence (MLBDBI). Taiyuan, China; 2021. p. 60–6. [Google Scholar]
44. Deforce B, Baesens B, Diels J, Asensio ES. MultiMix TFT: a multi-task mixed-frequency framework with temporal fusion transformers. In: Conference on Lifelong Learning Agents. Montreal, QC, Canada; 2023. p. 586–600. [Google Scholar]
45. Lundberg S. A unified approach to interpreting model predictions. arXiv:170507874. 2017. [Google Scholar]
46. Christoph M. Interpretable machine learning: a guide for making black box models explainable. Victoria, BC, Canada: Leanpub; 2020. [Google Scholar]
47. Lundberg SM, Erion GG, Lee SI. Consistent individualized feature attribution for tree ensembles. arXiv:180203888. 2018. [Google Scholar]
48. Sghir N, Adadi A, Lahmer M. Recent advances in predictive learning analytics: a decade systematic review (2012–2022). Educ Inf Technol. 2023;28(7):8299–333. doi:10.1007/s10639-022-11536-0. [Google Scholar] [PubMed] [CrossRef]
49. Kamarthi H, Rodríguez A, Prakash BA. Back2Future: leveraging backfill dynamics for improving real-time predictions in future. arXiv:210604420. 2021. [Google Scholar]
50. Botvinick MM, Plaut DC. Short-term memory for serial order: a recurrent neural network model. Psychol Rev. 2006;113(2):201–33. doi:10.1037/0033-295X.113.2.201. [Google Scholar] [PubMed] [CrossRef]
51. Variš D, Bojar O. Sequence length is a domain: length-based overfitting in transformer models. arXiv:210907276. 2021. [Google Scholar]
52. Zhou H, Zhang S, Peng J, Zhang S, Li J, Xiong H, et al. Informer: beyond efficient transformer for long sequence time-series forecasting. In: Proceedings of the AAAI Conference on Artificial Intelligence. Online; 2021. p. 11106–15. [Google Scholar]
53. Zhang X, Ghosh S. PaEBack: pareto-efficient backsubsampling for time series data. arXiv:221015780. 2022. [Google Scholar]
Cite This Article
 Copyright © 2025 The Author(s). Published by Tech Science Press.
This work is licensed under a Creative Commons Attribution 4.0 International License , which permits unrestricted use, distribution, and reproduction in any medium, provided the original work is properly cited.
 Downloads
 Citation Tools