
 Submit a Paper
 Propose a Special lssue
 Open Access
ARTICLE
Optimized Feature Selection for Leukemia Diagnosis Using Frog-Snake Optimization and Deep Learning Integration
1 Department of Electrical and Computer Engineering, Shahid Beheshti University, Tehran, 16589-53571, Iran
2 Department of Electrical and Computer Engineering, Shiraz University, Shiraz, 71946-84334, Iran
* Corresponding Author: Ali Jalali. Email:
(This article belongs to the Special Issue: Metaheuristic-Driven Optimization Algorithms: Methods and Applications)
Computers, Materials & Continua 2025, 84(1), 653-679. https://doi.org/10.32604/cmc.2025.062803
Received 28 December 2024; Accepted 16 April 2025; Issue published 09 June 2025
 View Full Text
 Download PDF
Abstract
Acute lymphoblastic leukemia (ALL) is characterized by overgrowth of immature lymphoid cells in the bone marrow at the expense of normal hematopoiesis. One of the most prioritized tasks is the early and correct diagnosis of this malignancy; however, manual observation of the blood smear is very time-consuming and requires labor and expertise. Transfer learning in deep neural networks is of growing importance to intricate medical tasks such as medical imaging. Our work proposes an application of a novel ensemble architecture that puts together Vision Transformer and EfficientNetV2. This approach fuses deep and spatial features to optimize discriminative power by selecting features accurately, reducing redundancy, and promoting sparsity. Besides the architecture of the ensemble, the advanced feature selection is performed by the Frog-Snake Prey-Predation Relationship Optimization (FSRO) algorithm. FSRO prioritizes the most relevant features while dynamically reducing redundant and noisy data, hence improving the efficiency and accuracy of the classification model. We have compared our method for feature selection against state-of-the-art techniques and recorded an accuracy of 94.88%, a recall of 94.38%, a precision of 96.18%, and an F1-score of 95.63%. These figures are therefore better than the classical methods for deep learning. Though our dataset, collected from four different hospitals, is non-standard and heterogeneous, making the analysis more challenging, although computationally expensive, our approach proves diagnostically superior in cancer detection. Source codes and datasets are available on GitHub.Keywords
Leukemia is a significant worldwide health problem characterized by abnormal leukocyte proliferation. The varied etiology of the disease can be best managed by accurate and timely diagnostic techniques. Although manual microscopic analysis is cost-effective, it’s prone to human error, highlighting the importance of reliable, automated diagnostic systems [1]. The use of deep learning, particularly through convolutional neural networks (CNNs), has greatly enhanced diagnostic precision of acute lymphoblastic leukemia (ALL) over traditional techniques by autonomously recognizing intricate patterns in medical images and delivering greater accuracy. Nonetheless, recent advances in transformer models, symbolized by the Vision Transformer (ViT), have been more successful in modeling global relationships and context, thereby overcoming a number of weaknesses inherent in Convolutional Neural Networks (CNNs), such as dealing with heterogeneous and complex data sets. Depending only on a ViT, however, may be insufficient due to the high heterogeneity that is usually characteristic of medical data. Therefore, a combination of ViT with another deep learning architecture, like EfficientNetV2, which is known for its computational efficiency and strong local feature extraction ability, may leverage their complementary strengths, allowing both global and local features to contribute substantially to diagnostic accuracy.
Our method showcases a new integration of traditional spatial features and deep features from the latest neural networks. This aids in improving understanding and robustness for the classification of leukemia subtypes. Spatial features, which represent shape and structure information, are utilized to complement deep-learned features. This improves the feature space and helps tackle the variability and complexity in medical imaging.
We innovatively combine, for the first time, spatial and deep features for ALL classification, which fills a critical gap within existing studies. Unlike traditional approaches, we leverage both classic and deep features simultaneously to enhance the robustness of our classification process.
Our research focuses on two main challenges: first, the accurate extraction and segmentation of nuclei are important and require a better approach to segment blood cell nuclei with a state-of-the-art method; second, we expand the reach of classification by classifying ALL cells into subtypes rather than just categorizing them as cancerous.
Most notably, we employ a multi-center database sourced from four different hospitals in real-world settings, each differing in equipment and characteristics in their respective images, hence varying from the usual employment of standardized datasets.
This study introduces a new feature selection approach to optimize the synergy between the classic and deep features for improving the ALL subtypes classification. The systematic methodology of this work, including parallel transfer learning, feature selection, and machine learning models, outperforms the individual models with higher accuracy.
Our study is organized into four stages: I) nucleus segmentation, II) feature extraction and stacked feature matrix creation, III) novel feature selection, and IV) classification, aiming to develop a transfer learning-based model for ALL predictions.
2 Literature Review and Related Works
So far, a significant amount of research has been conducted in diagnosing and classifying ALL. Some of these studies have been performed using standard datasets, while others have been implemented on personally collected datasets. In this regard, we will proceed to examine some of these methods further.
2.1 Traditional Methods and Preprocessing Techniques
Several traditional approaches have been proposed for leukocyte segmentation and ALL classification using preprocessing techniques such as histogram equalization, Otsu thresholding, and shape-based features. These studies [2–4] typically achieve high accuracy using classical methods, but fail to capture subtle data variations present in complex, real-world datasets.
2.2 Recent Advances in Feature Selection for ALL Diagnosis
Feature selection plays a critical role in improving classification accuracy, reducing computational overhead, and enhancing the interpretability of diagnostic models. Some recent studies have integrated feature selection with deep learning approaches. For instance, reference [5] combined a pre-trained VGG-Net model with the Salp Swarm Algorithm to remove noisy features, while reference [6] used MRMR for feature selection in conjunction with a fused deep transfer learning network. However, these methods often lack the ability to handle heterogeneous datasets effectively or to integrate spatial and deep features cohesively.
In contrast, this study employs the Frog-Snake Prey-Predation Relationship Optimization (FSRO) algorithm [7], which dynamically balances the trade-off between feature relevance and redundancy. FSRO leverages its adaptive prey-predator dynamics to achieve optimal feature selection, resulting in superior classification performance and robustness in real-world scenarios.
2.3 Deep Learning-Based Techniques
With the emergence of deep neural networks in medical image processing, researchers began turning to deep learning models for the classification of ALL. Several studies like [8] and [9] used CNN-based architectures such as DenseNet121, AlexNet, GoogLeNet, or custom CNNs. These models were often fine-tuned using transfer learning and showed notable accuracy on standard datasets. However, they were mostly limited to binary classification and lacked integration with classical feature engineering, making them less effective on heterogeneous real-world data.
Some studies attempted more advanced combinations. For example, references [6] and [10] employed hybrid or fused deep learning networks for ALL detection. While these models improved accuracy using feature selection techniques like MRMR, they still did not use spatial features or address data heterogeneity. Similarly, reference [11] used a parallel model with DenseNet variants and a quantum-inspired optimization method, yet omitted spatial features. Reference [12] proposed the Knowledge Nevestro Classification (KNC) and DenseNet (50) Attention Network (DAN) architectures for ALL detection, extending deep learning by knowledge distillation and attention mechanisms.
In terms of explainability, reference [13] integrated LIME with DenseNet121 to improve model interpretation, which enhanced user trust but did not address robustness or feature redundancy. Other works like [10,12], and [14] explored subtype classification using novel deep architectures, such as models with Orthogonal SoftMax Layers or knowledge distillation, but lacked dynamic feature selection or spatial integration.
In contrast, our method integrates both deep and spatial features and classifies ALL subtypes using a parallel architecture of ViT and EfficientNetV2. Combined with a novel FSRO-based feature selection strategy, our system addresses both the limitations of interpretability and the complexity of real-world heterogeneous data.
Fig. 1 provides an overall view of our approach, showing how features are extracted, stacked, and refined through advanced selection before classification.
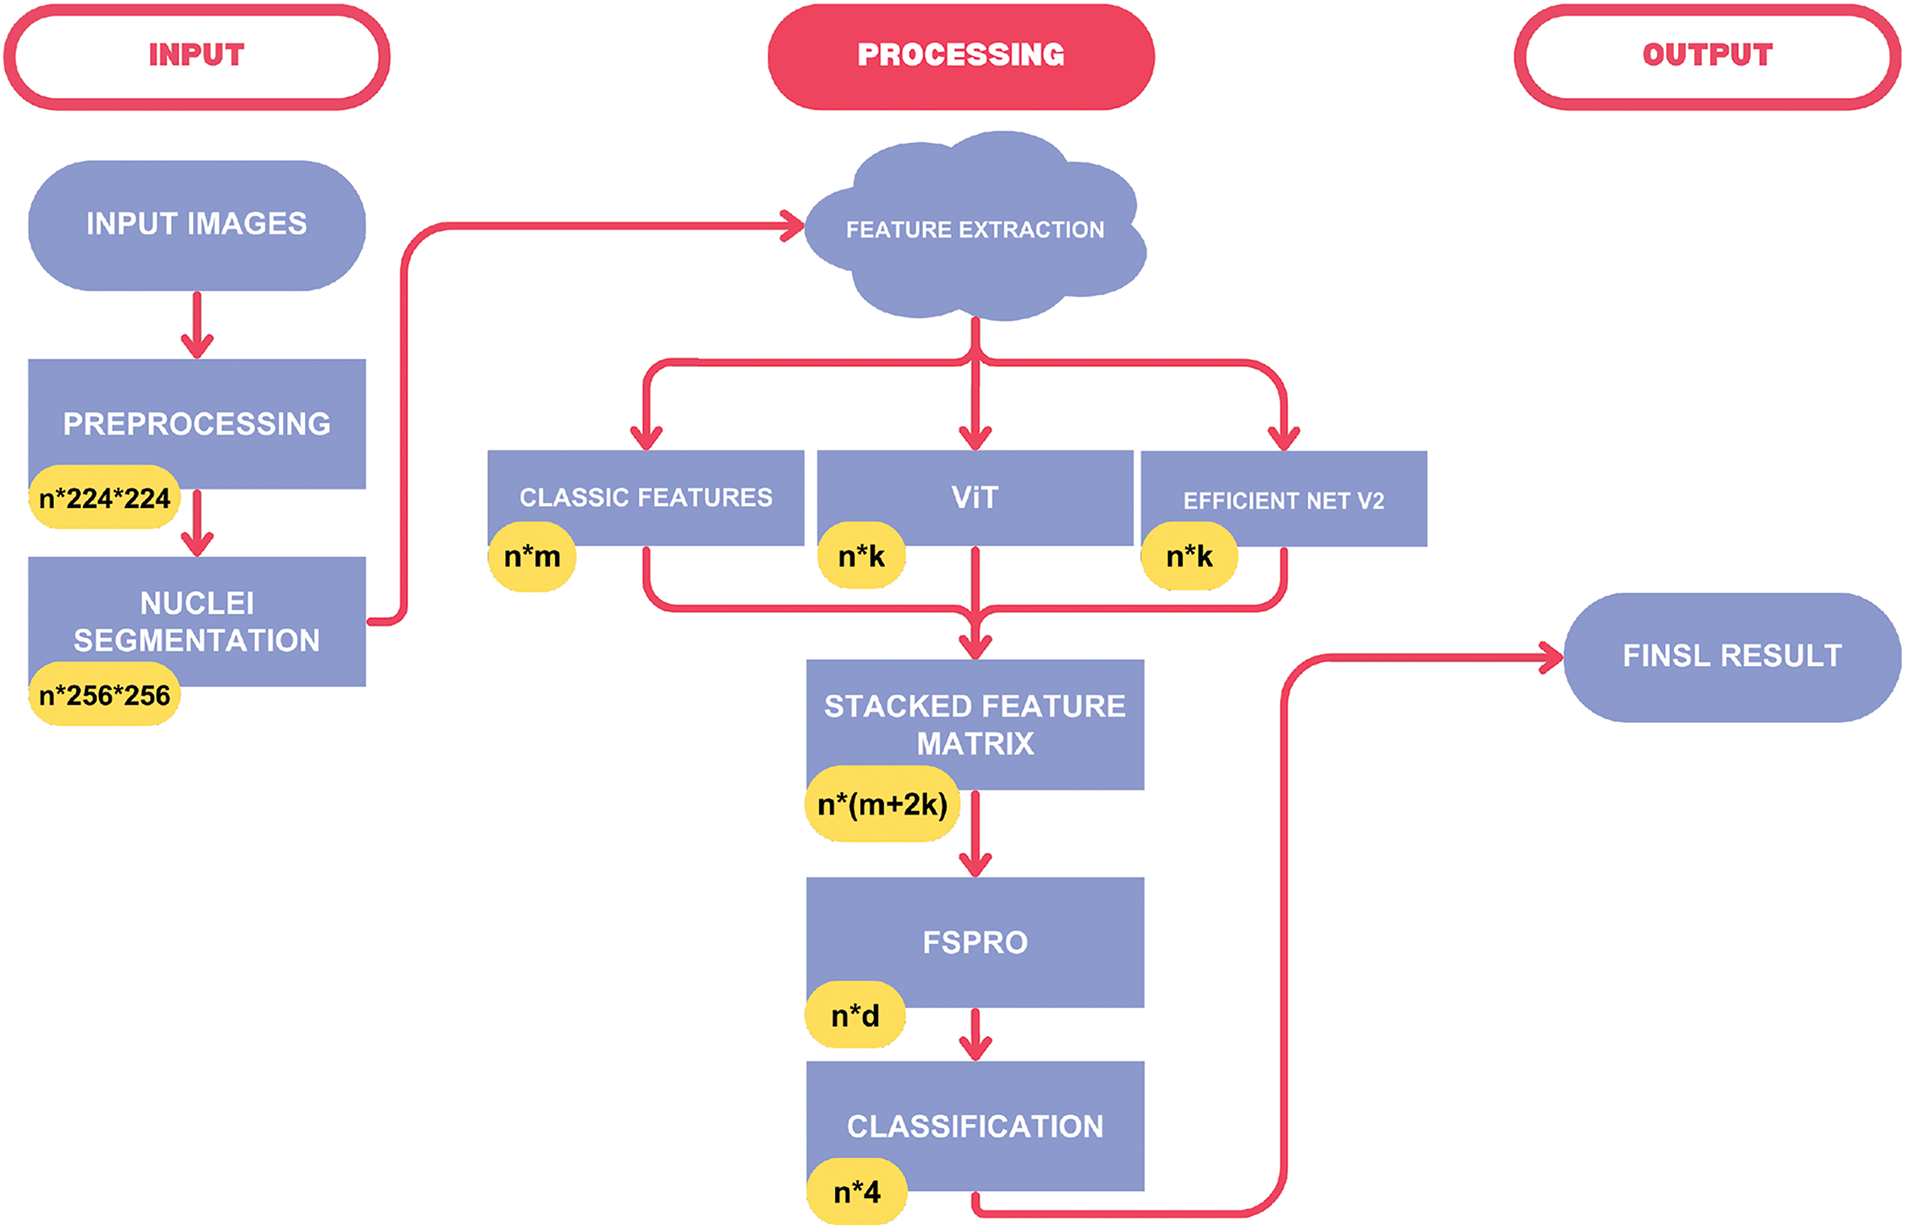
Figure 1: The diagram of the proposed method
Most of the research done in obtaining the images of bone marrow and blood smears resulted in almost similar data, which are validated using high-quality samples in better medical centers. The non-availability of identical data and the availability of an infinite number of blood samples can help us towards our goal in our diagnostic algorithm. The first step of the framework will be to prepare microscopic images of blood smear images afflicted by leukemia and blood without leukemia, with varying qualities from different reputed medical centers.
This is because these images need to be photographed with different cameras and labeling has to be carried out by hematologists. Primary knowledge about the type of image, specifications, and its preparation may help in better processing the image and extracting accurate information.
Images for this study were captured using Zeiss, Nikon, and Olympus microscopes with digital cameras under ordinary microscope lighting conditions, immersed in oil with a 100× lens magnification and all images resized to 224
In all, 1020 images of patients with acute lymphoblastic leukemia cancer type with 10 different blood types, including lymphocytes and lymphoblasts, were made ready for test and validation purposes. These were due to the unique smear preparation methods from Taleghani Hospital, Center for Stem Cell Specialized Laboratory Tests, Tajrish Hospital, Shariati Hospital Pathology Center, and Imam Khomeini Hospital. The distribution of each category in the dataset is as follows: L1: 37.30%, L2: 19.4%, L3: 24.0% and Healthy: 19.3%. In addition, we conducted an analysis to assess the quality and complexity of the images in our dataset. This analysis involved the comparison of our dataset to the well-established ALL-IDB dataset, a recognized benchmark. The two critical metrics we examined were Signal-to-Noise Ratio (SNR) and image entropy. Detailed insights and results of these analyses are available in Appendix A. The visuals and discussions in the appendix underscore the diverse and complex nature of our dataset when contrasted with ALL-IDB, signifying its suitability for addressing real-world challenges. The dataset’s high variability and intricacy make it an excellent resource for robust solutions across a wide spectrum of image processing and computer vision tasks.
If fewer training samples are used, there is a greater likelihood of overfitting. Given the limited number of training data in our dataset, we utilized image rotations of 45 degrees clockwise, 90 degrees counterclockwise, vertical flipping, and horizontal flipping to increase the training data. After applying data augmentation, the number of images increased to 5100, with 4325 images being cancerous and the remaining images being natural. In total, the data for each category differed by less than 20 percent in terms of quantity, thus, the imbalance phenomenon does not occur in this case. The sample images after data augmentation are shown in Fig. 2.
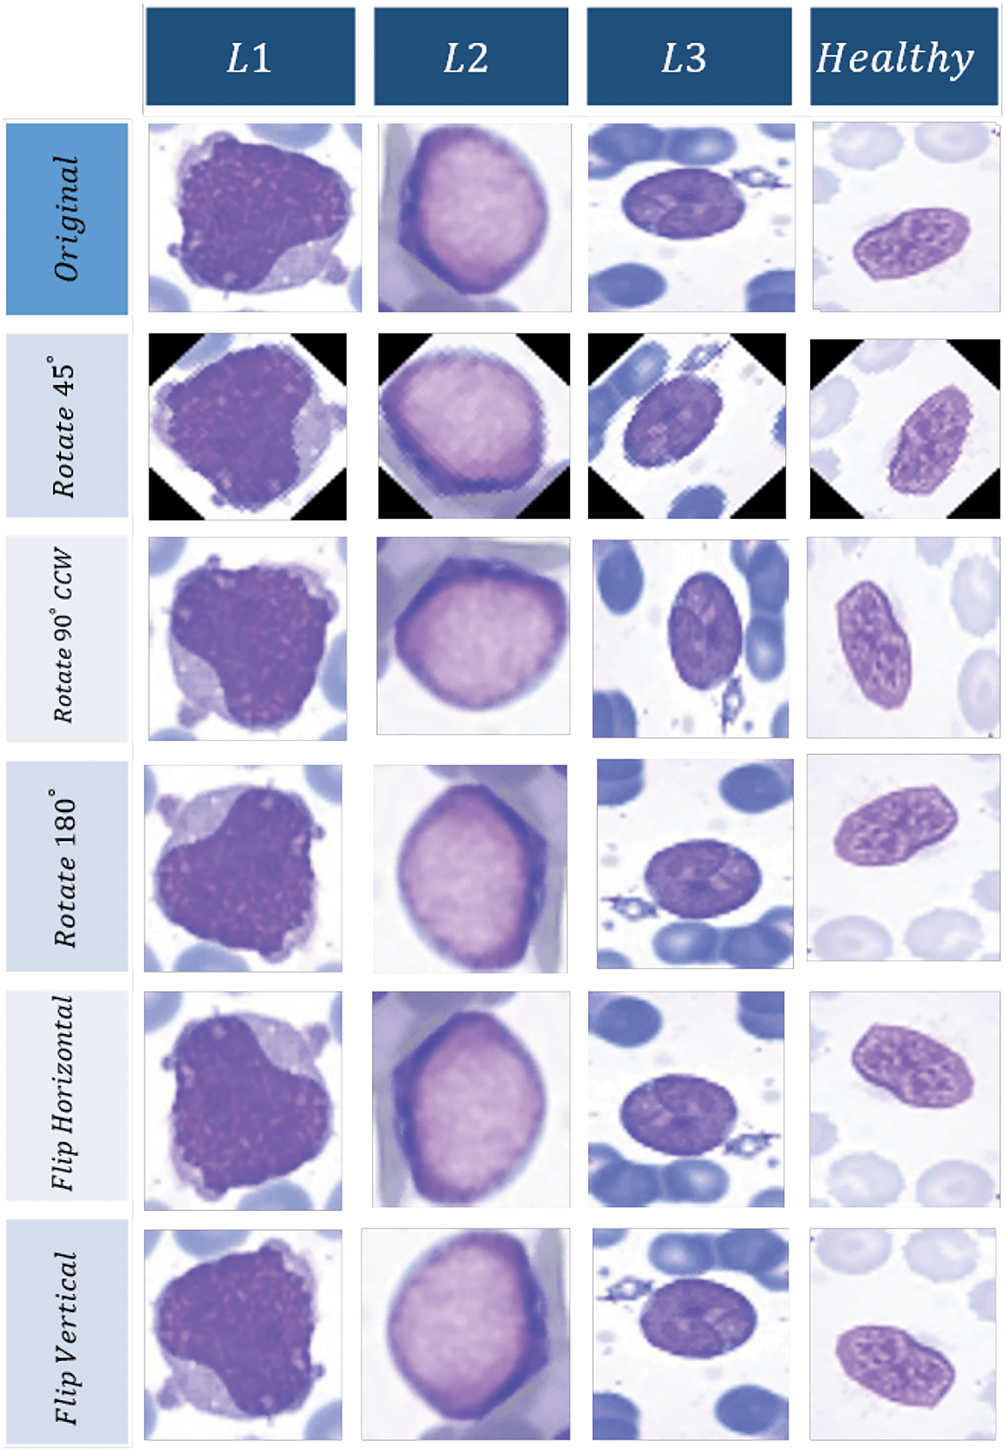
Figure 2: Augmentation results for different categories of WBCs
Numerous methods have been introduced for image segmentation of blood cells based on their morphological properties, distribution of color, and intensity in the images. In this study, our main focus is not on image segmentation. Therefore, we attempt to utilize one of the newest and most powerful methods introduced for blood cell nucleus segmentation.
The method presented in [15] operates based on a three-step approach for nucleus segmentation: Firstly, a color balancing algorithm is applied to the RGB input image. Then, the color spaces of CMYK and HLS are computed and combined to generate a soft map. Finally, the Otsu thresholding algorithm is applied to the soft map to segment the nucleus.
According to these authors, this methodology was developed after a long period of hit-and-trial work and was found to perform very well on various datasets. We do not intend to delve deeper into the details of this methodology in this paper, and hence we would recommend that the readers refer to the referenced article for further information. Fig. 3 shows examples of our segmented images in each cell category.
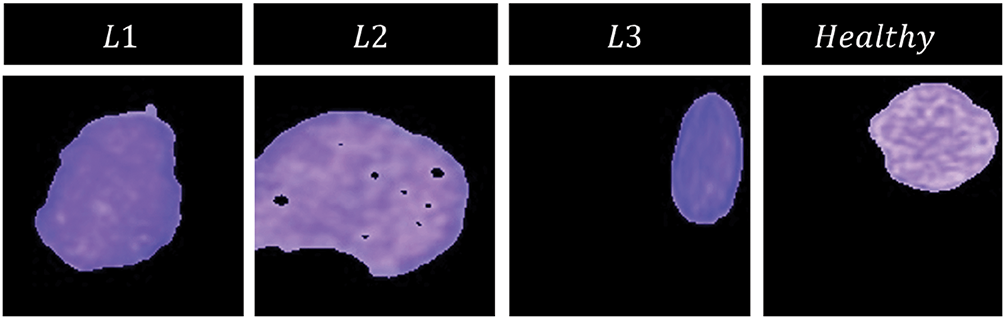
Figure 3: Segmentation results for different categories of WBCs
After separating the white blood cell nucleus, we must extract optimal features from these nuclei to train our machine learning algorithm.
To do this, we use a hybrid network along with a classic feature extraction method to construct a feature vector stack. The combination of classic features with deep features can be very useful for us.
In this method, we can be sure that in addition to features based on the appearance of the nuclei themselves (classic features), features based on pixels and their neighborhoods (deep features), which usually have useful information in edges, are also included in the calculations.
Classic features commonly used in this field are primarily based on two pillars:
1) shape-based features, which include convexity, solidity, and circularity, and 2) color-based features, which include nuclear and cytoplasmic color features. These classic features are extracted based on standard formulas, which are presented in [15]. According to this method, color features are extracted from the components of RGB, HSV, LAB, and YCrCb color spaces, and as a result, 48 color features and 3 shape features are extracted, totaling 51 classic features.
However, these features cannot necessarily provide us with all the features relevant to differentiating between different classes of images. Therefore, it is necessary to strengthen these features as much as possible.
One of the innovative solutions proposed in this paper is to form a stacked matrix by combining matrices of classic and deep features. These deep features, which are discussed in the next section, can increase the level and depth of our information from images and improve the training of our machine learning model.
3.4.2 Deep Features with the Transfer Learning Approach
Transfer learning is widely applied in deep learning, especially in computer vision and natural language processing. Pre-trained models usually serve as effective starting points, transferring knowledge from a well-established source domain to a related target domain. In medical imaging tasks, where annotated data is limited, transfer learning significantly boosts model robustness and performance.
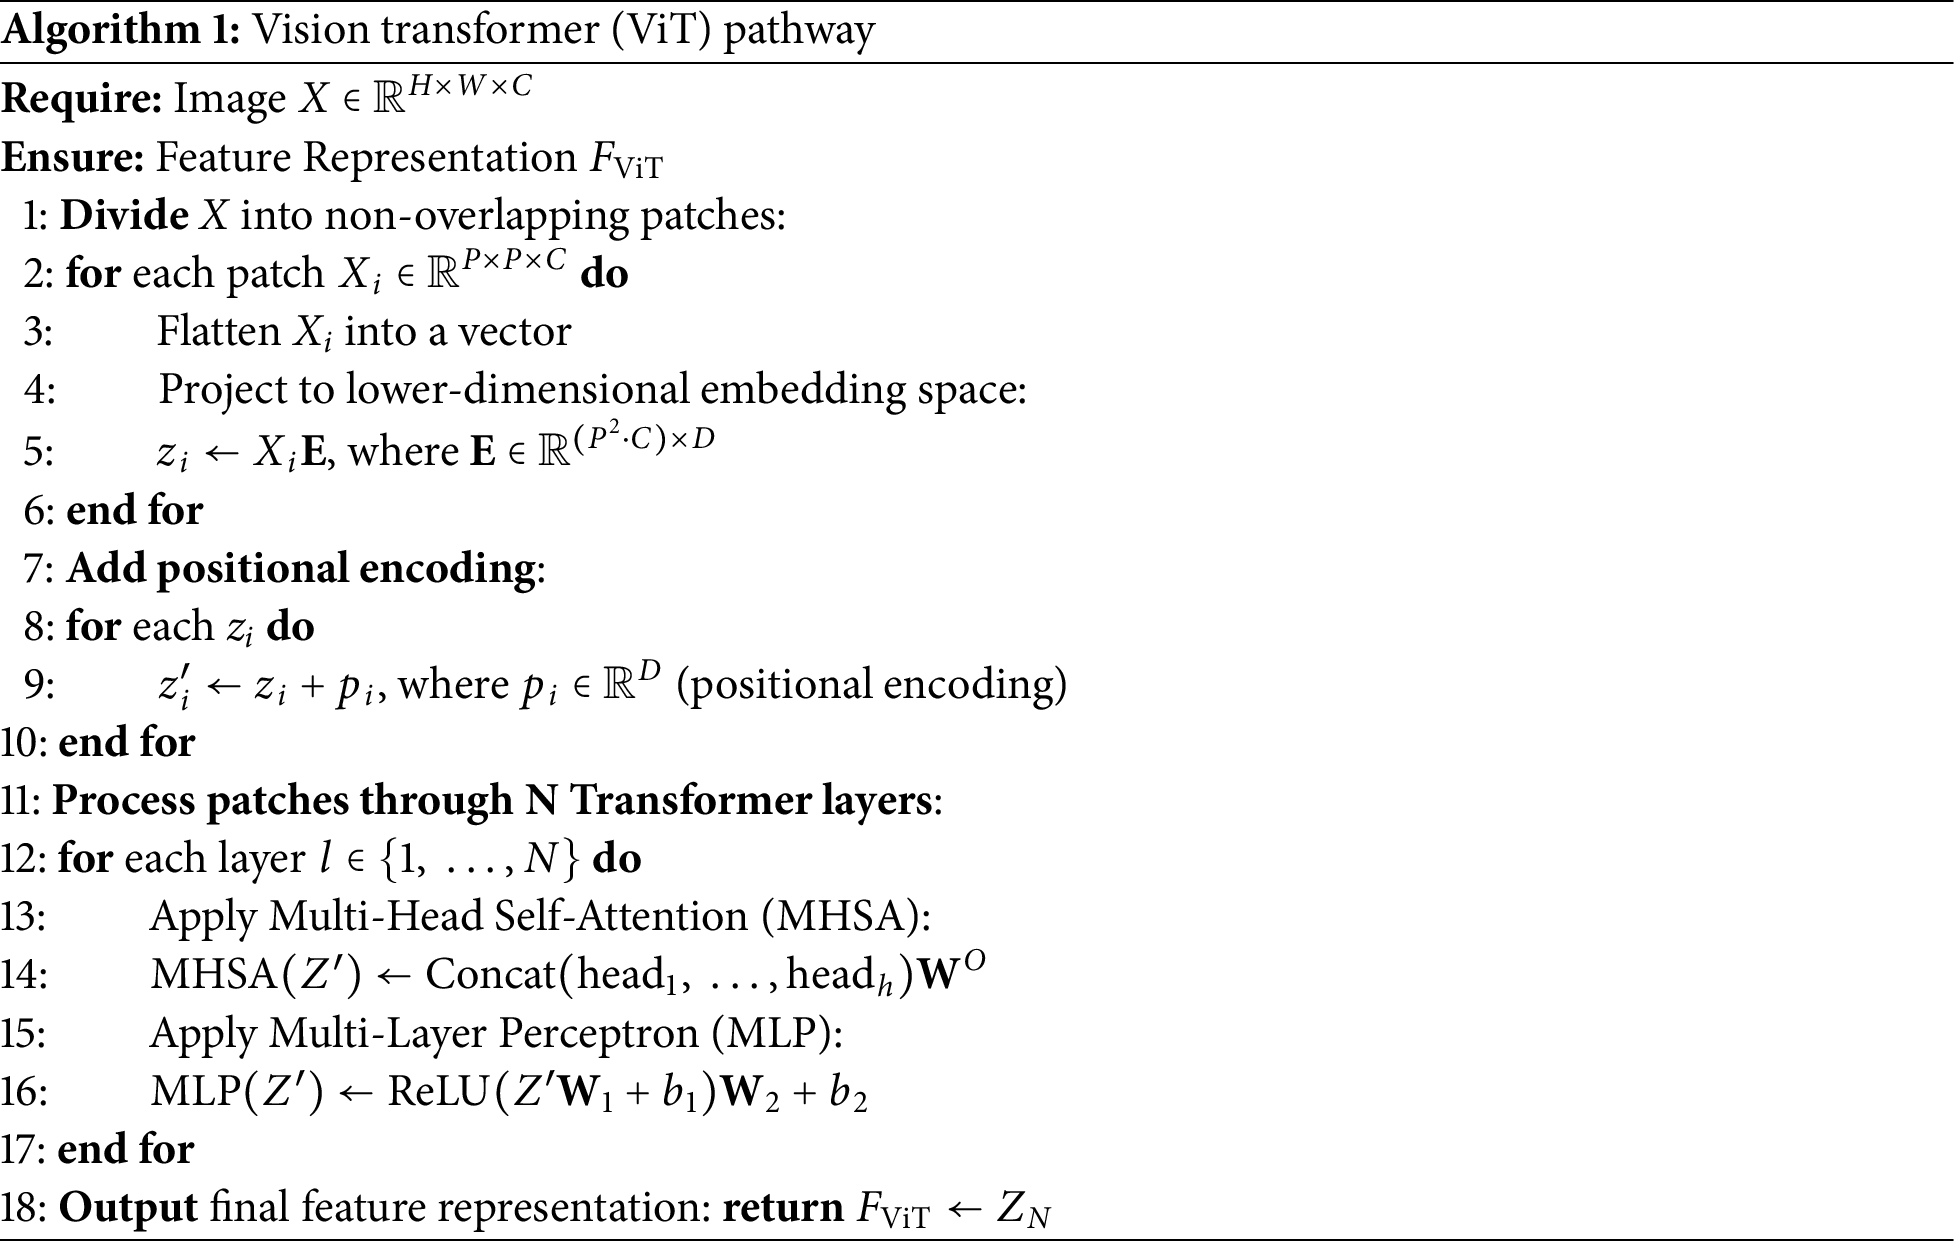
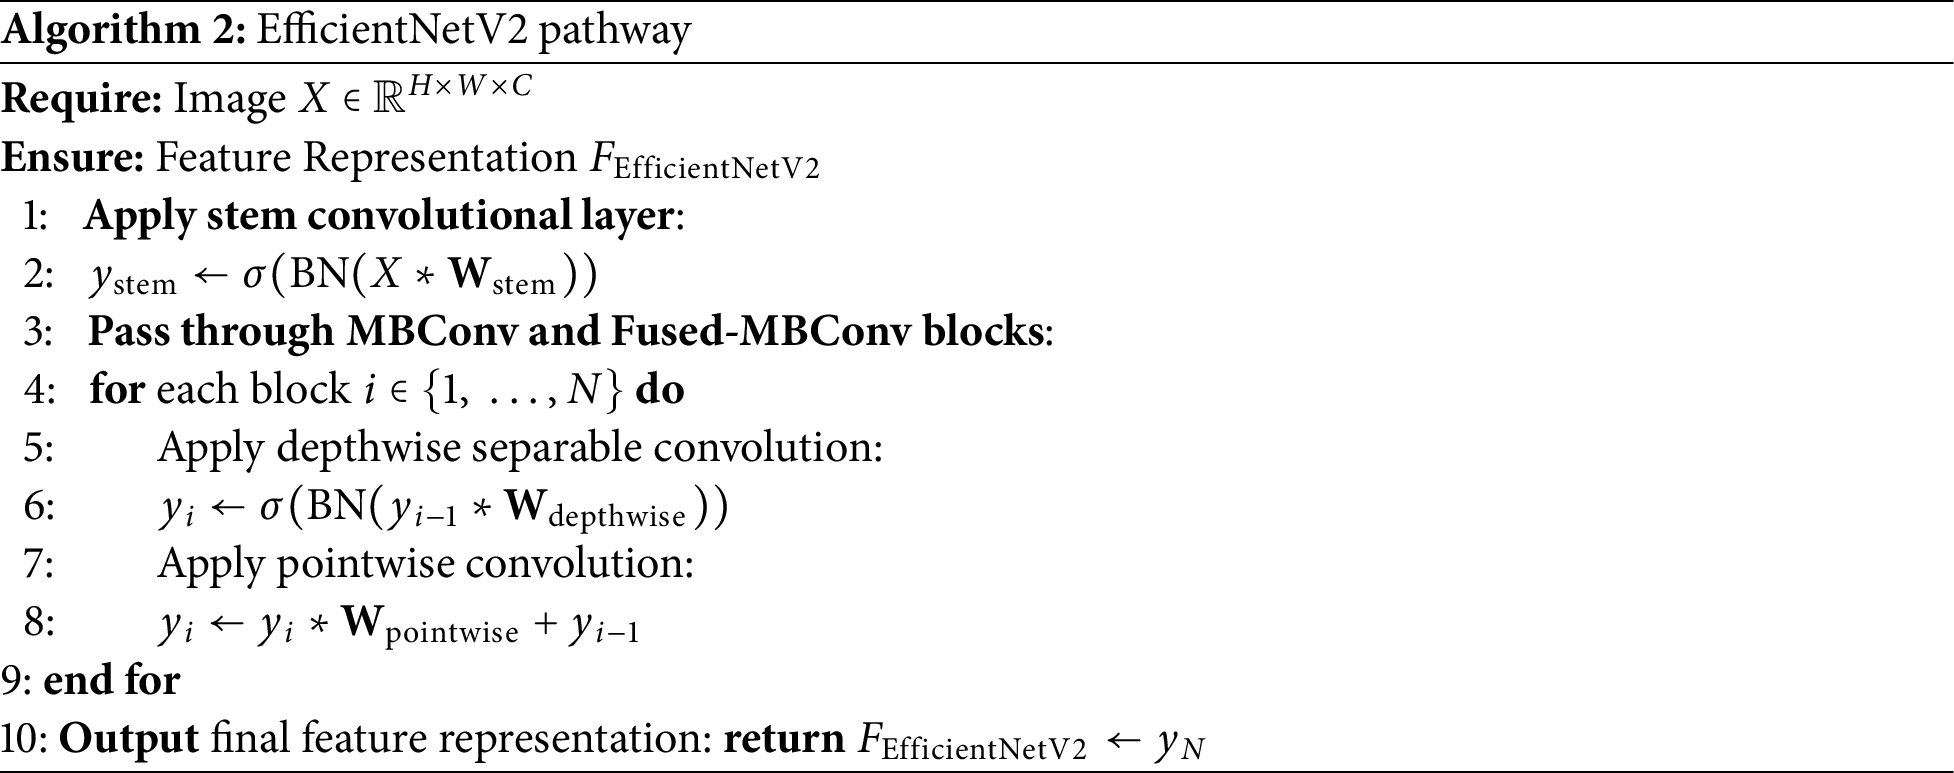
In this study, we use a hybrid deep learning framework that combines the strengths of two advanced architectures: Vision Transformer (ViT) and EfficientNetV2. ViT captures global contextual relations by breaking down an image into patches and applying self-attention mechanisms, while EfficientNetV2 extracts localized spatial features through optimized convolutional blocks. These complementary features improve the classification of complex and heterogeneous WBC images.
Rather than feeding the data sequentially through both models, we design a parallel deep network, where each model independently processes the same input image. The resulting features from both ViT and EfficientNetV2 are stacked into a single feature stack matrix (F-stack) that combines both global and local representations. This enriched feature representation is then used in downstream classification tasks to distinguish between leukemia subtypes. Fig. 4 shows how the EfficientNetV2 and ViT branches work in parallel, separately extracting features and then combining them into the F-stack to classify. These networks are introduced and elaborated upon in the following.
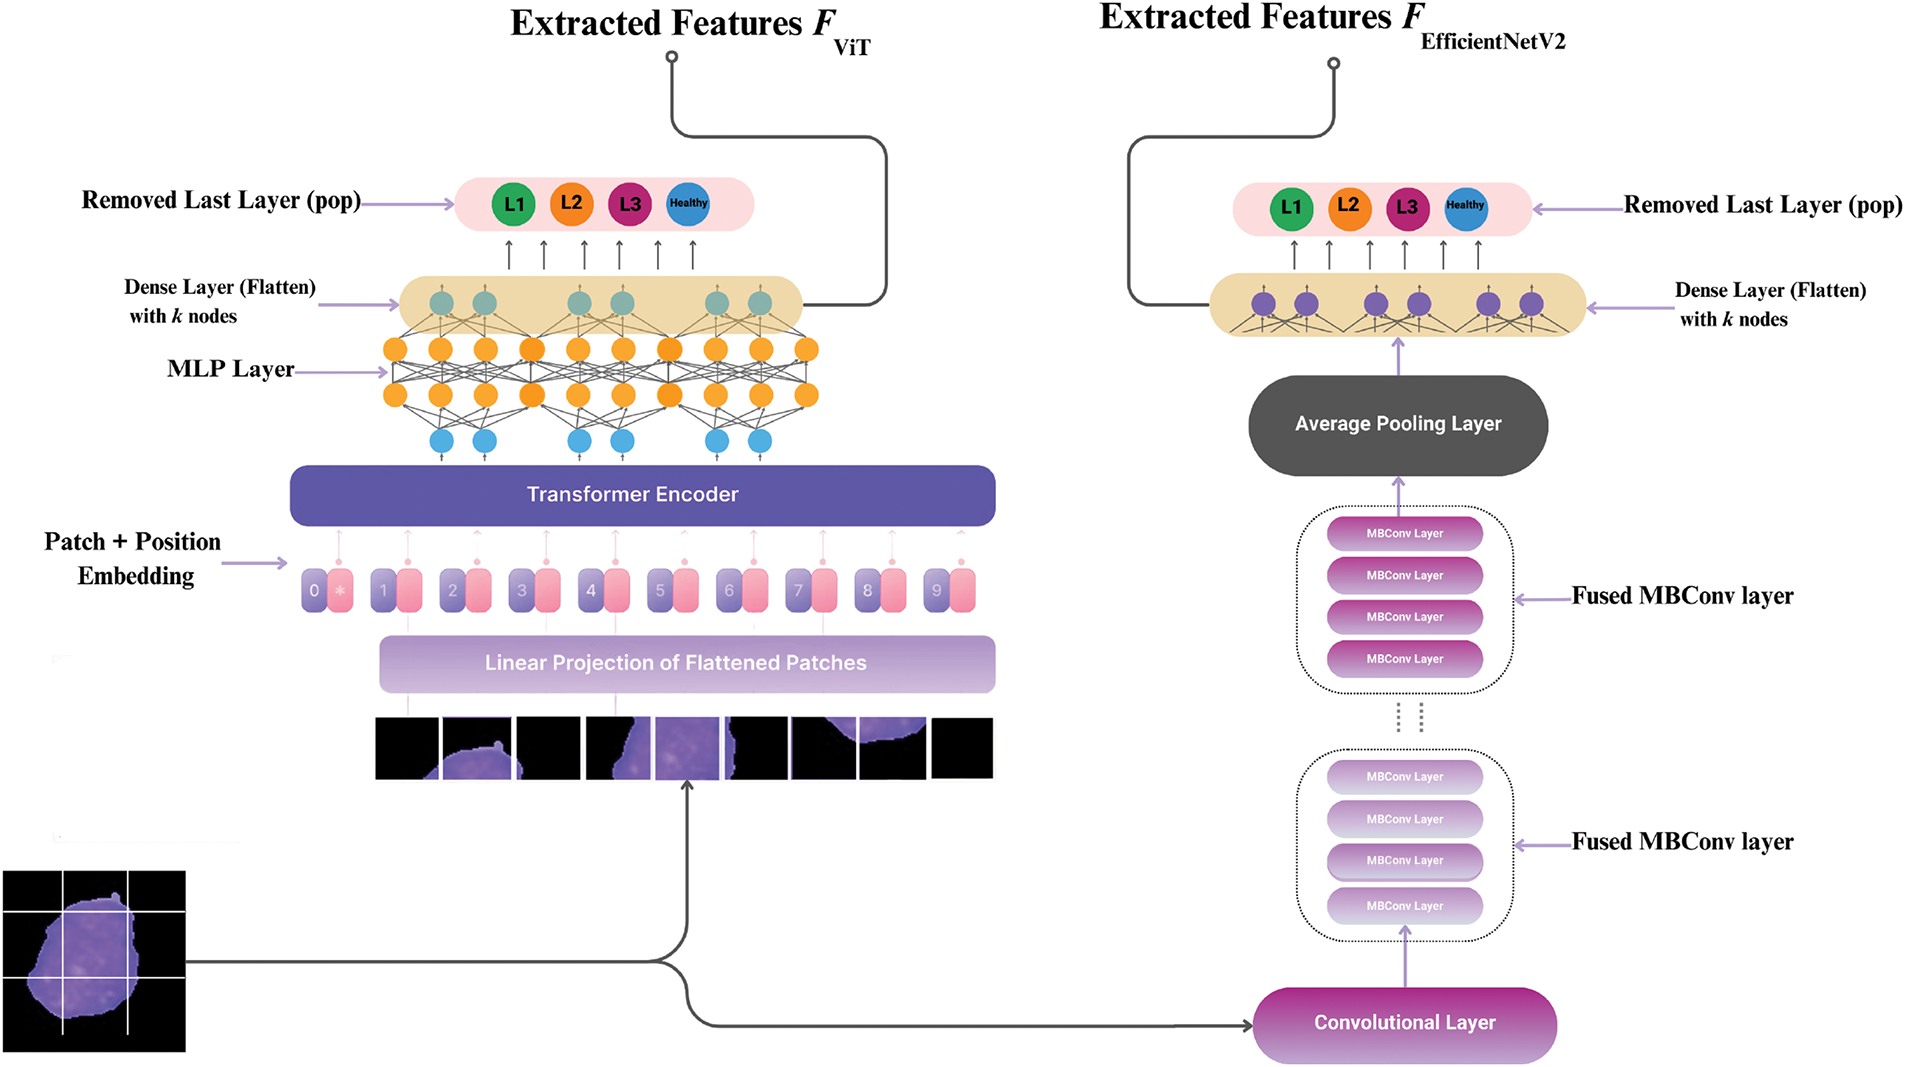
Figure 4: The Deep Parallel Model processes images simultaneously through ViT (global features) and EfficientNetV2 (local features)
The step-by-step process of extracting features is shown in Algorithms 1 and 2, where we break down how the Vision Transformer (ViT) and EfficientNetV2 handle image data-from embedding patches and applying attention mechanisms to refining features through convolutional layers.
3.5 Training of Deep Feature Extractor Models
Using domain adaptation learning, we trained ViT and EfficientNetV2 models on a collected dataset of blood smear images by fine-tuning their pre-trained weights and modifying only the final classification layer. The training-to-test data ratio was set to 80% and 20%, respectively, with labels assigned to each image accordingly.
For the ViT model, we first adjusted the input layer to accommodate the blood smear images. The ViT model was pre-trained on the ImageNet-21k dataset, and we fine-tuned it for our specific task by modifying the last layer to output probabilities for the 4 leukemia subtypes.
The model was then trained using our dataset, focusing on capturing both global and local features effectively. The resulting feature matrix for n images had a length of
For the EfficientNetV2 model, we similarly adapted the input layer for blood smear images. We selected EfficientNetV2, pre-trained on ImageNet, due to its balance between computational efficiency and accuracy. The final fully connected layer was replaced to output the 4 necessary classes.
During training, the model utilized advanced training techniques and fused MBConv layers to enhance feature extraction. The length of the feature matrix for n images became
In both models, the last few layers specific to the original ImageNet classification task were removed, including the softmax layer. This adjustment ensured that the models were tailored to our specific task of leukemia subtype classification. The trainable weight matrices and feature vectors were adapted accordingly to ensure optimal performance in our data set.
By integrating these advanced models and using domain adaptation learning, we were able to effectively extract deep features from blood smear images, significantly improving the accuracy and robustness of our classification system.
3.6 Generating Stacked Feature Matrix
Thus far, we have been able to extract three sets of feature data from the classical features and hybrid deep network features derived from leukemia images. Now, we need to store these features in a F-stack matrix. This feature matrix is constructed as follows:
where
However, this matrix contains a large number of features, which may lead to several issues:
- Curse of Dimensionality: High-dimensional input data may cause over-fitting of the model and reduce its generalization capability.
- Computational Complexity: Treatment and processing of large dimensions of features are time-consuming; hence, in general, this slows down the training and inference processes.
- Redundancy: This degradation in classifier performance may be due to the existence of redundant or irrelevant features, and hence it becomes very important to identify and eliminate such features.
In the next section, we will introduce our novel feature selection method designed to address these challenges, reducing the dimensionality of
3.7 Advanced Feature Selection Method
Feature selection is important because it ensures that most datasets have several features, some of which are irrelevant or redundant. Failure to select features can result in the inefficiency of the model, interpretation issues, and probably over-fitting risks. Essentially, the main aim is to realize a trade-off between the retention of relevant features and the removal of superfluous ones.
Our method puts feature selection in a framework of an optimization problem, aiming at maximizing the utility of features to be selected with respect to a trade-off between relevance and redundancy. The proposed strategy takes advantage of both statistical measures and a novel meta-heuristic optimization algorithm, making feature selection more robust and effective.
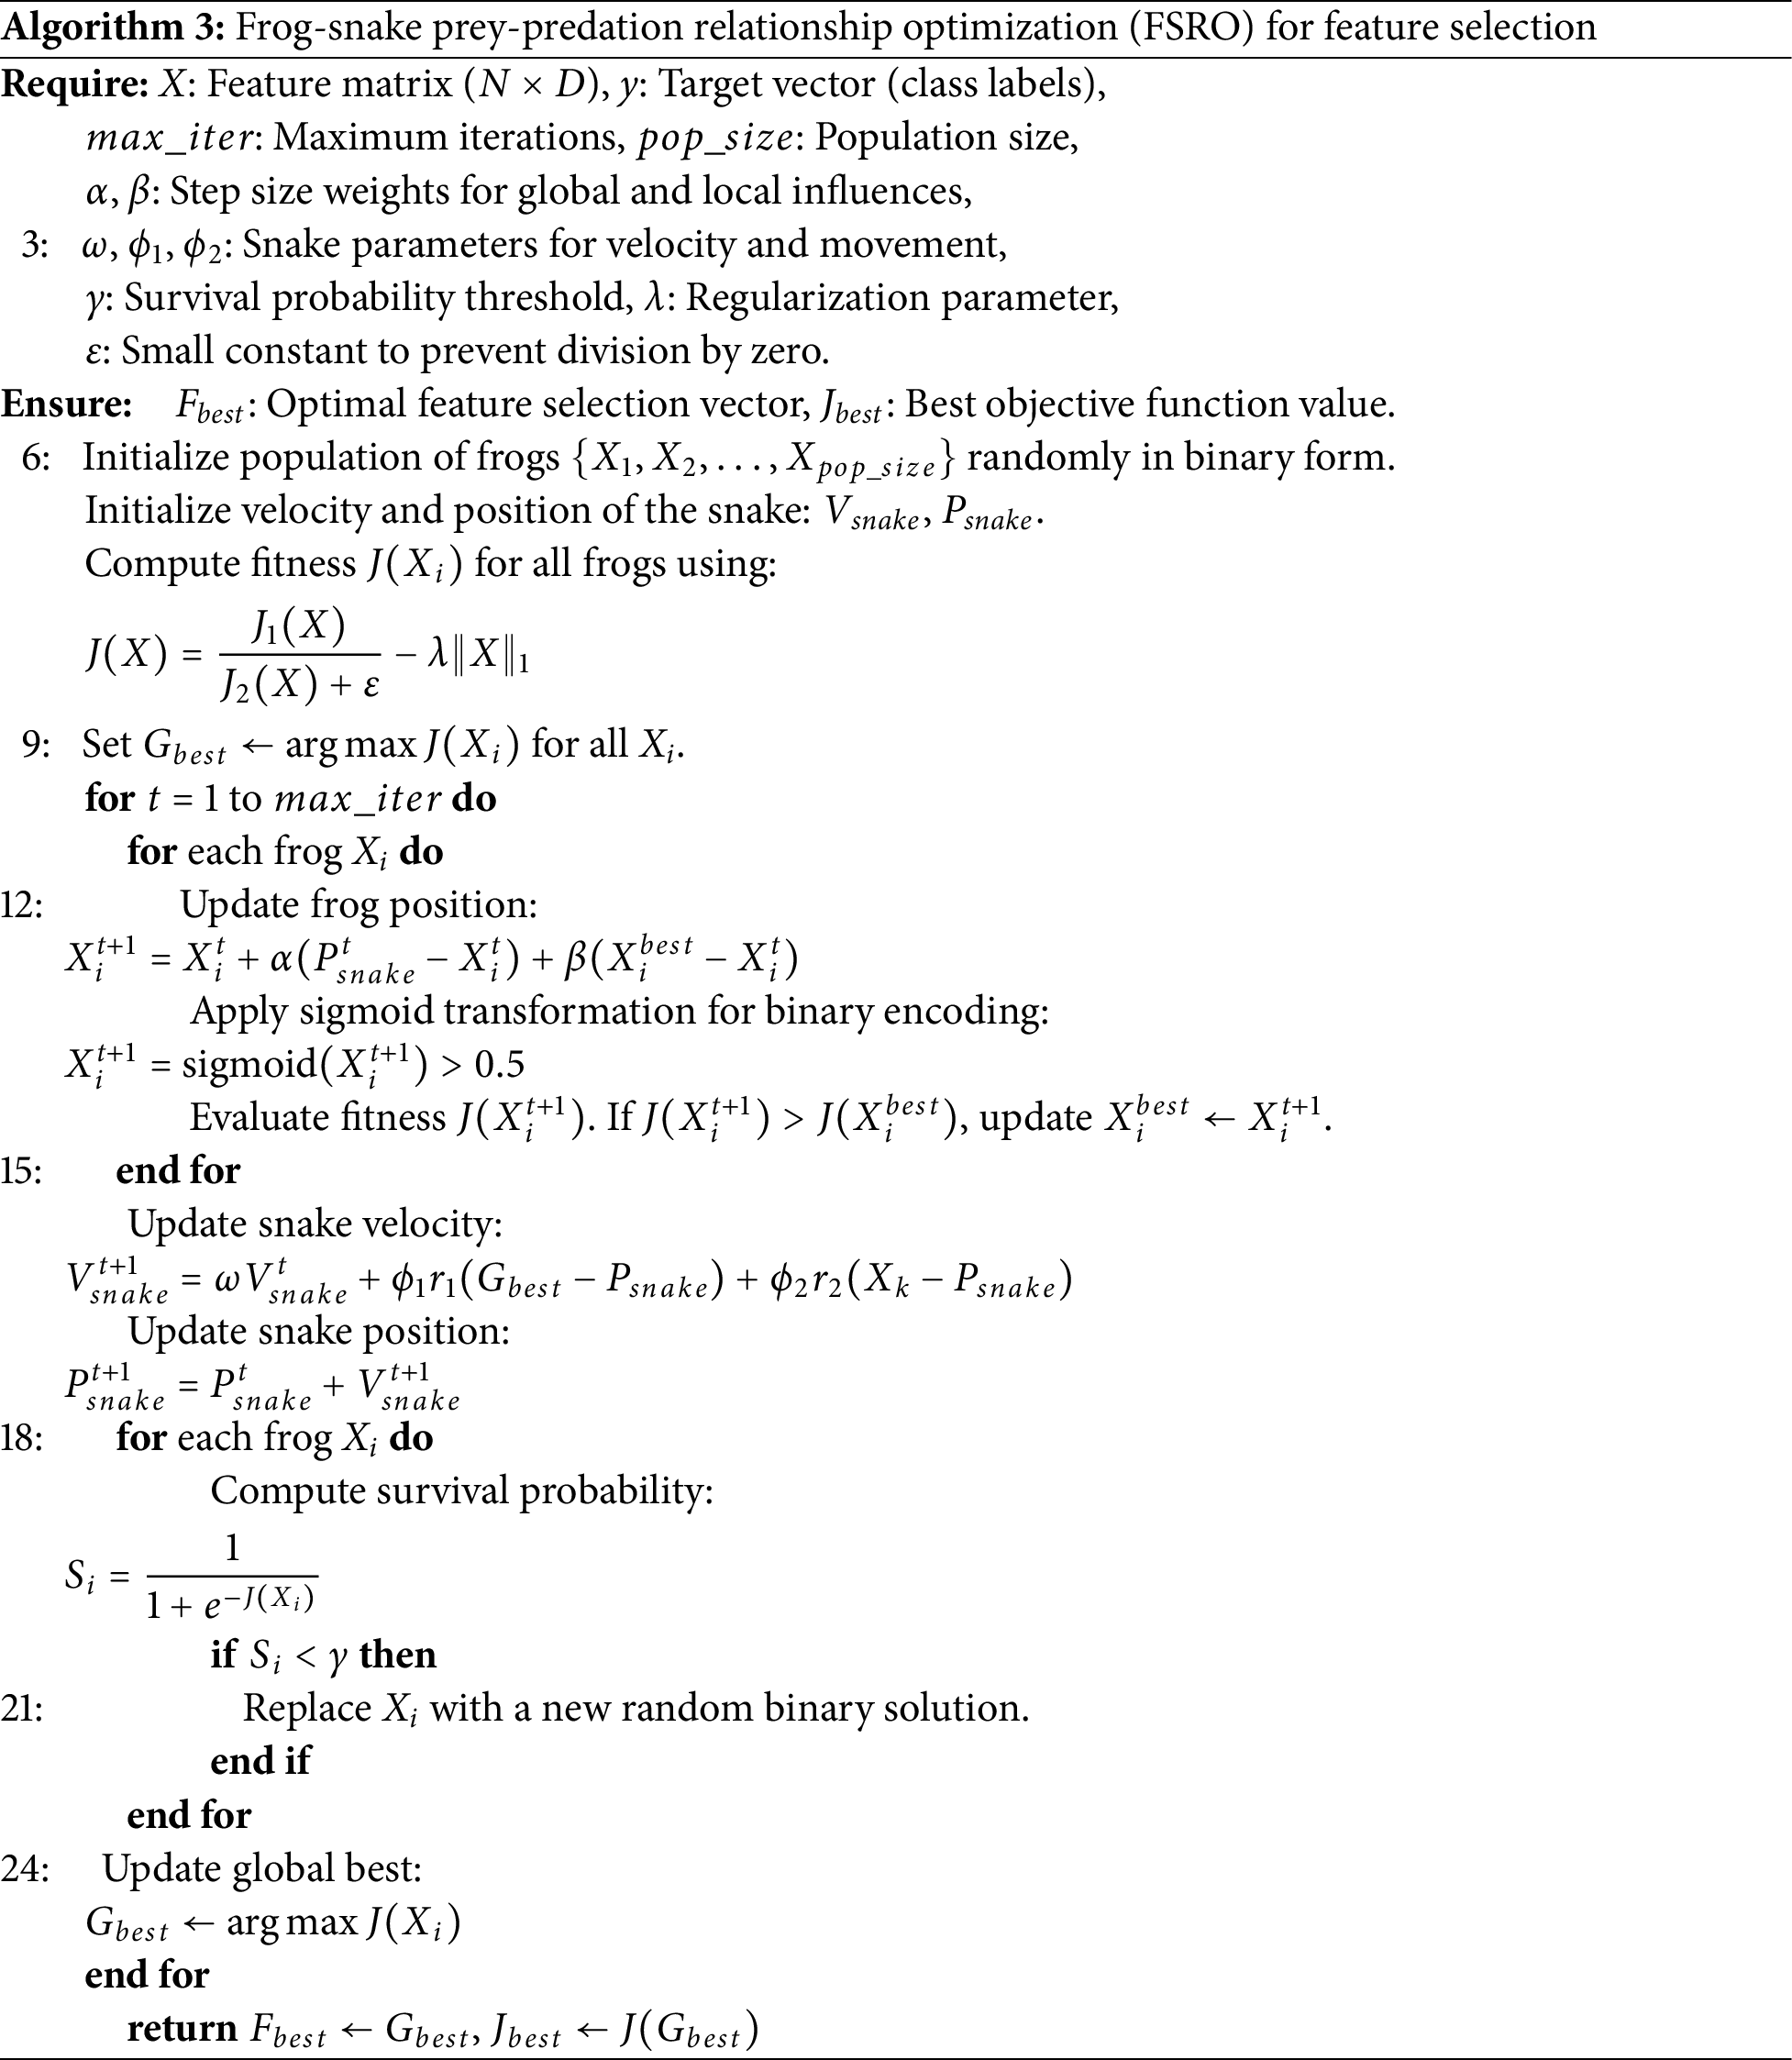
We employ the recently introduced FSRO algorithm, inspired by the prey-predator dynamics between frogs and snakes, to optimize the selection of features. The FSRO framework combines global exploration, driven by predator behavior, with local exploitation, modeled through the adaptive movements of frogs. This hybrid approach enhances the trade-off between discriminative power, redundancy minimization, and sparsity.
Let:
• X be the stacked feature matrix with dimensions
•
• F is a binary vector of feature selection indicators, where
•
Our objective is to maximize the discriminative power of the selected features while considering the trade-off between relevance and redundancy. We achieve this by solving the following optimization problem:
where:
•
•
•
•
3.7.2 Frog-Snake Prey-Predation Relationship Optimization
The FSRO algorithm dynamically adjusts the positions of solutions in the feature space to maximize the objective function. The framework involves two interacting components: the prey (frogs) and the predator (snake). Frogs attempt to optimize their positions based on local and global influences, while the snake guides global exploration.
Each frog updates its position based on the influence of the snake and its local best position:
where:
•
•
•
The snake adjusts its position based on the global best solution and randomly selected frogs:
where:
•
•
•
•
•
3.7.5 Prey-Predator Interaction
The survival probability
where a low survival probability results in the frog being replaced with a new random solution.
The optimization problem is solved iteratively using FSRO until convergence or a maximum number of iterations is reached. The binary constraints are enforced using a sigmoid transformation:
This approach ensures that the selected features maximize discriminative power while minimizing redundancy and promoting sparsity.
To avoid over-fitting, we employ cross-validation to assess the performance of the selected features on a validation set. The pseudo-code of the FSRO-based feature selection method is presented in Algorithm 3.
3.8 Comparative Analysis of Feature Selection Methods
An immediate advantage of our proposed approach lies in the fact that feature selection is cast as an optimization problem. In this kind of formulation, it provides an automatic and principled means to select features that contribute the most to the classification problem. This method combines a statistical measure for discriminative power and redundancy with regularization into a comprehensive feature selection process. This is also what distinguishes this particular method from other approaches.
Compared to traditional feature selection methods, such as filter, wrapper, or embedded methods [16], this method offers a more principled and data-driven way to select features. The use of optimization, in particular quadratic programming in this case, ensures that the selected features are not only relevant but also contribute significantly to the separability of classes. This might be particularly useful when dealing with complex datasets where feature interactions and correlations are non-trivial, as it explicitly deals with the redundancy issue.
Embedded methods, such as LASSO, incorporate feature selection in the model-building process. While effective, embedded methods are less transparent than the method presented here. The latter explicitly handles the trade-off between relevance and redundancy via the objective function, leading to a more understandable and interpretable feature selection framework.
Recursive Feature Elimination (RFE) successively removes the least important features, but the number of features to retain is often chosen arbitrarily. In contrast, the presented method employs an objective function that seeks to balance relevance and redundancy while encouraging sparsity. The regularization term in the presented method is less arbitrary and can be fine-tuned for the desired level of sparsity.
This measure goes one step further compared to the mRMR criterion, which searches for a subset of features such that relevance concerning the target response is as high as possible and redundancy between selected features is as low as possible. It not only assures optimization of feature relevancy but also includes a regularization term for sparsity control. In this, the selected features regularization effect selects that, in turn, the features are really important to carry out the task. Also, it does not contribute to the risk of over-fitting. In work with high-dimensional data, this is important for the risk of serious over-fitting.
Principal Component Analysis (PCA) is excellent for dimensionality reduction but may not always select features that are most informative for a specific classification task. The presented method explicitly focuses on the discriminative power of selected features for classification, ensuring that the retained features are optimized for the intended task.
The presented feature selection method is outstanding because it merges the power of statistical measures, regularization, and optimization to balance relevance and redundancy in feature selection. This constitutes a general approach to build a very useful tool with respect to performance enhancement and interpretability of machine learning models, especially in those cases where treating high-dimensional data becomes challenging, such as an F-stack matrix.
Now, since we moved toward the selection of optimal features, traditional machine learning algorithms have to be used for classification from the optimal feature matrix in the last stage.
The machine learning models used in this study include KNN, SVM, Random Forest [17], MLP, AdaBoost, Naive Bayes, and QDA.
Each of these methods is explained in detail in the referenced works. Therefore, here we only mention their names and have used them for our data classification. For obtaining additional information regarding the mathematical relationships associated with each of these methods, we refer readers to the references.
Now, we can integrate the whole proposed method into one. In this proposed architecture, we have leveraged the advantages of transfer learning. This transfer learning has helped us provide a novel model that ultimately achieves good superiority in classifying ALL sub-types.
4 Experimental Results and Discussion
To implement the proposed method, it is necessary to first generate the initial dataset for training machine learning networks. In the following section, the method of collecting WBC data is presented. We have used the Python programming language to construct the proposed network architecture, which provides an efficient environment for deep learning and neural network implementation.
All implementations were carried out in Google Colab with 16 GB RAM, and 16 GB GPU, using the Keras API of the TensorFlow library. Now that our data has been collected, the first step in the algorithmic process is to extract the cell nuclei.
In the next step, classical features should be first extracted from these images. That means the extraction of classical features from these images. These features are related to the appearance and color properties of the cell nuclei, which were discussed earlier.
Here, some of the extracted classical features are shown. Due to the large number of extracted features, we randomly selected only three cells from each of the L1, L2, and L3 categories, and demonstrated the extracted features from these 3 nuclei in the cumulative plot of Fig. 5. This plot represents a cumulative distribution of each of the extracted classical features. Each color represents a WBC image, of which we have a total of 3 different colors.
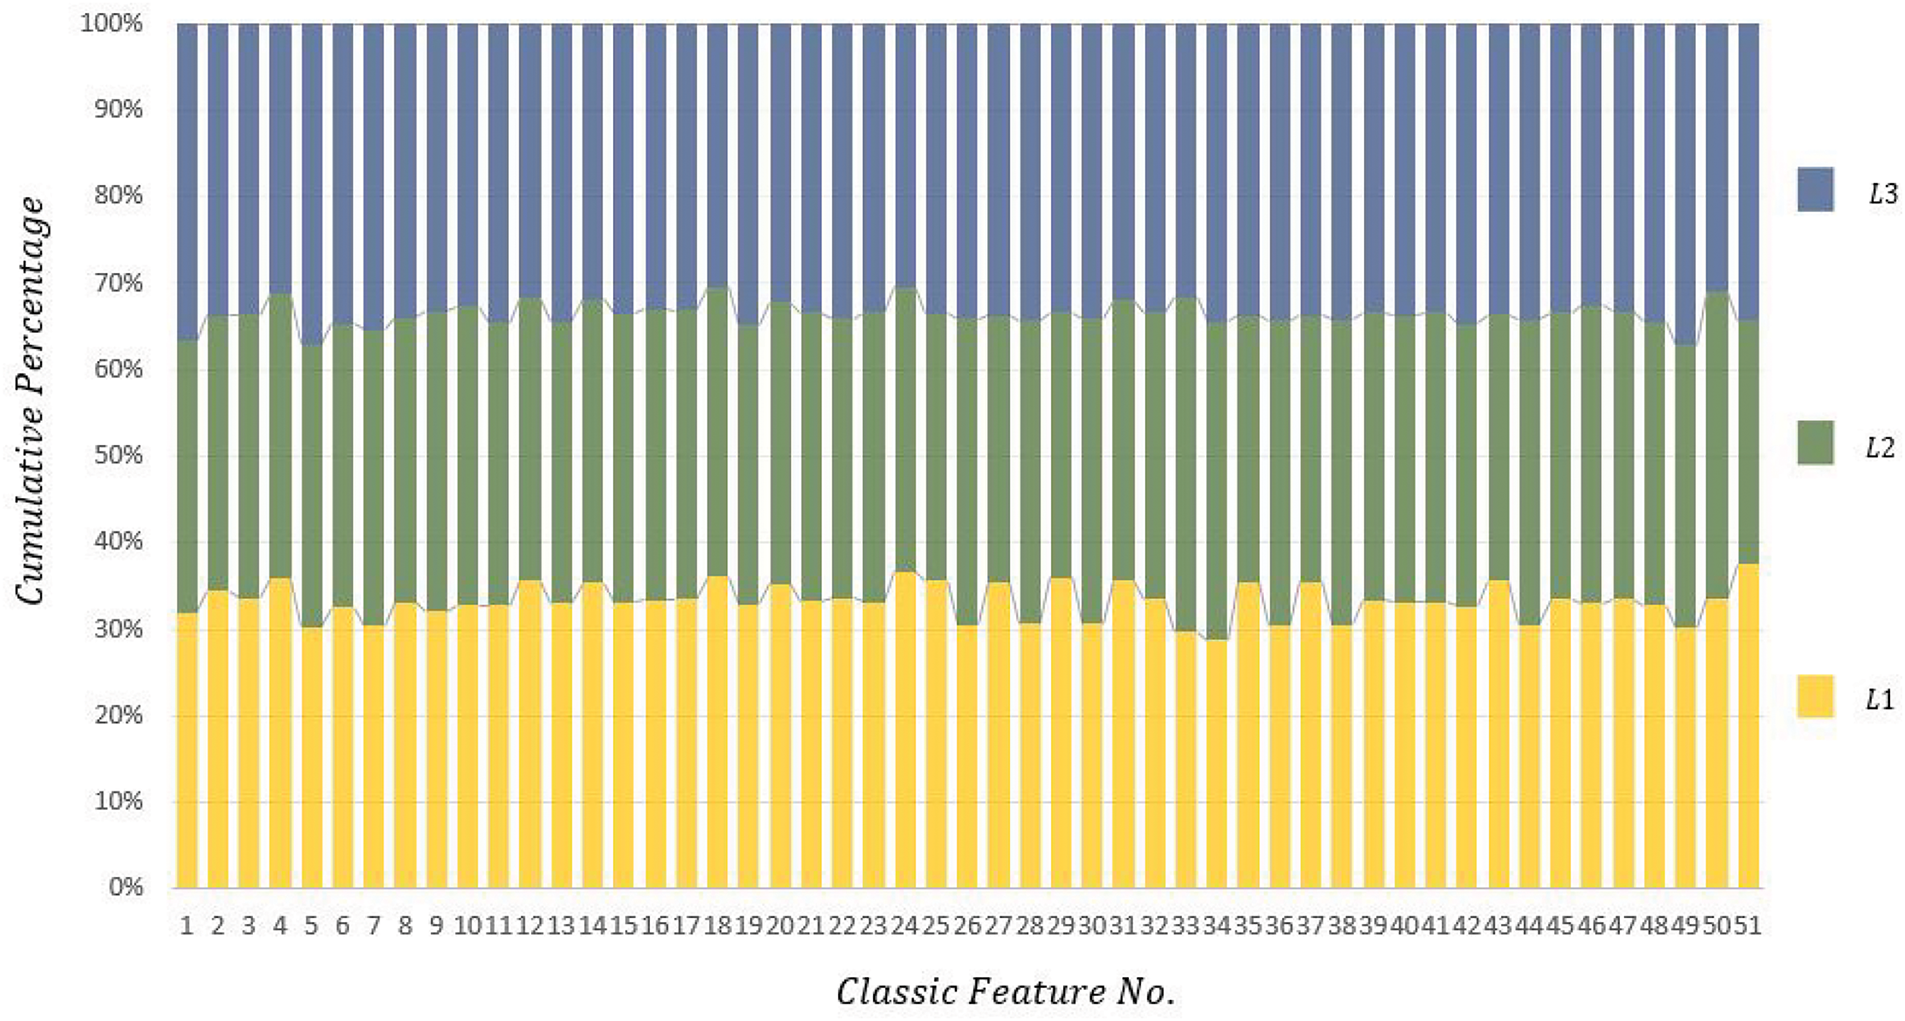
Figure 5: The cumulative graph of classic features extracted from 3 randomly selected images-each belonging to a different color of the WBC images in categories L1, L2, and L3
This image (Fig. 5) demonstrates that each classical feature in each of the L1, L2, and L3 categories contributes a certain percentage of the total share. As shown in this figure, almost every classical feature has an equal share in each category and does not create any significant distinction overall.
Furthermore, to better understand the degree of distinction among these features, the bar chart for each of the features has been shown for five images in Fig. 6.
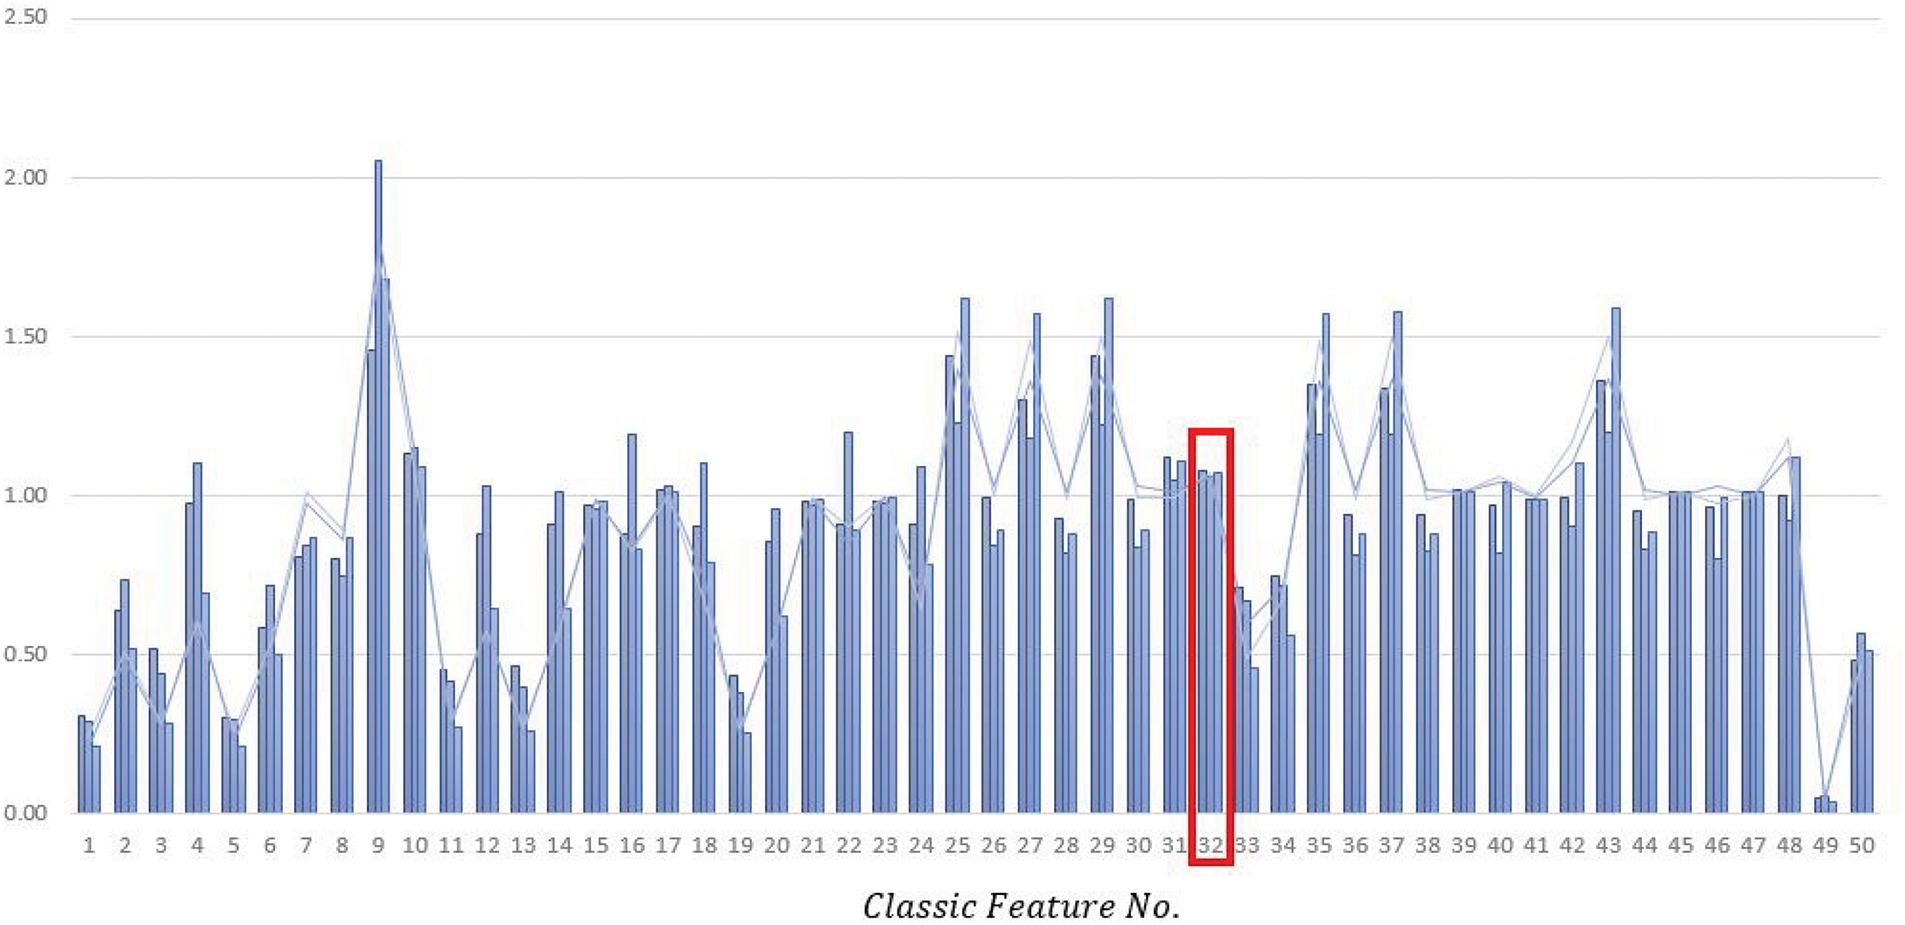
Figure 6: The bar chart for each of the classic features for 3 randomly selected images in categories L1, L2, and L3
For better clarity, we have removed feature 51 from the chart as this feature has a significantly higher mean than other features.
As evident in Fig. 5, although classical features have some distinction between different cells, these distinguishing features alone cannot solve our problem in non-standard and real-world images. Another point that can be derived from Fig. 5 is that some of the extracted classical features not only do not contribute to the classification process but also increase computational complexity.
For instance, if we look at feature No. 32 in Fig. 5, it can be observed that the extracted feature value for all three cells is almost equal, which adds extra data to the computation and may disrupt machine learning. This is also evident in features 45, 47, 17, and 10. This comparison aims to demonstrate that classical features for three random images from different categories are almost equal or have slight differences, which do not create suitable distinctions between category members.
Therefore, we proposed two approaches to overcome this problem in our proposed method. First, we use a combination of classical and deep features, and second, we use a method to reduce feature dimensions so that the extracted features are optimally incorporated into the machine learning process.
Now, we intend to implement the hybrid model described in the previous section. This hybrid model operates by building two advanced neural networks using transfer learning. The first deep network we constructed is based on the ViT architecture. In this network, we utilize multi-head self-attention mechanisms and feed-forward neural networks within transformer blocks to capture both global and local dependencies in the input images. The input layer is adapted to accommodate blood smear images, and the final classification layer is modified to output four categories corresponding to leukemia subtypes.
After the initial transformer blocks, the ViT network includes a series of normalization and multi-head self-attention layers, followed by a fully connected (dense) layer for classification. Specifically, the ViT model incorporates several transformer encoder layers that process the image patches, a global average pooling layer that normalizes the data, and a dense layer with 1000 nodes using the ReLU activation function. The final dense layer has 4 nodes with a softmax activation function to perform the classification task.
The next deep neural network we constructed is based on the EfficientNetV2 architecture. This model starts with convolutional layers using Fused-MBConv blocks, which are designed to enhance feature extraction while maintaining computational efficiency. The EfficientNetV2 network employs several stages of convolution and max-pooling operations to progressively extract features at different levels of abstraction.
Following the initial convolutional layers, the network includes multiple EfficientNetV2 blocks that apply depthwise separable convolutions, batch normalization, and activation functions to refine the extracted features. After these blocks, the network features a global average pooling layer to aggregate the features, followed by two dense layers. The first dense layer has 1280 nodes with a ReLU activation function, and the final dense layer has 4 nodes with a softmax activation function for classification.
The parameters of the constructed networks are presented in Table 1, which details the architecture and configuration of both the Vision Transformer and EfficientNetV2 models. This hybrid approach leverages the strengths of both models, combining the powerful feature extraction capabilities of ViT and the efficient processing of EfficientNetV2 to achieve high accuracy in leukemia subtype classification.
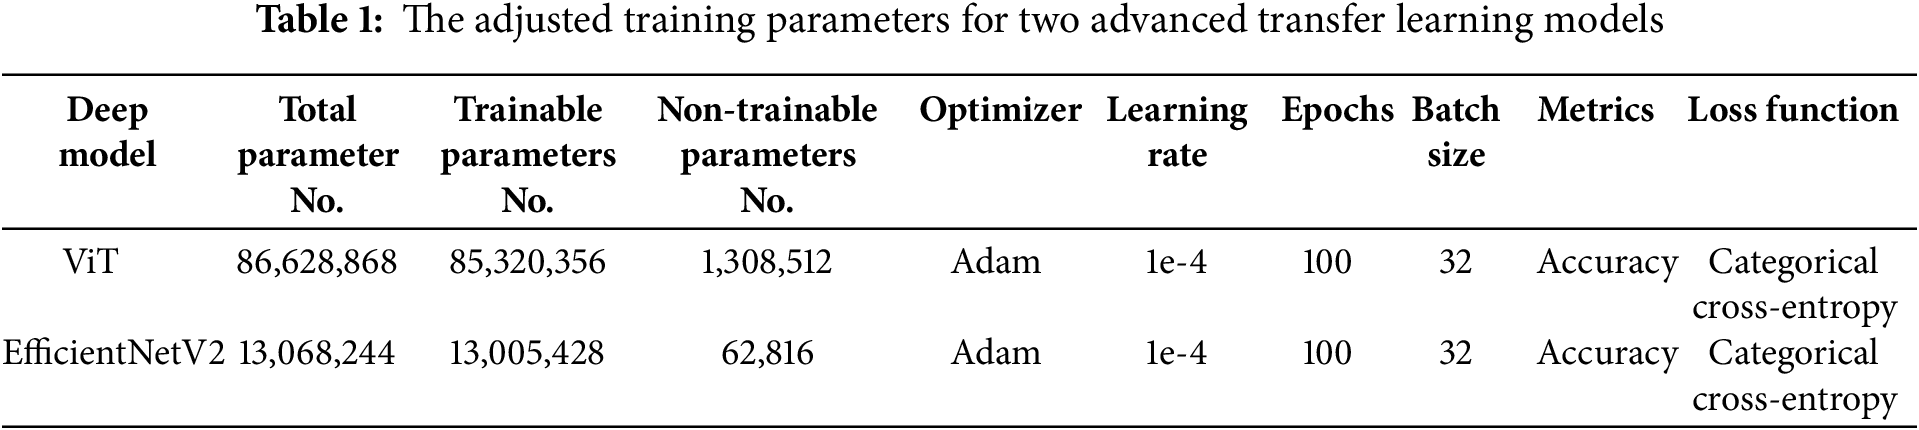
It should be noted that these parameters have been obtained after multiple trial-and-error attempts, and ultimately, the best parameters have been used for training. Now we move on to the training of these constructed networks. For training the networks, 80% of the data has been allocated for training and 20% for testing the networks.
The constructed deep networks achieved a test accuracy of 79% for the ViT network and 76% for the EfficientNetV2 network. However, while these accuracies are promising, our goal is to further enhance the accuracy and robustness of the model through the proposed hybrid method that synergizes classical spatial features with modern deep learning techniques.
To demonstrate the impact of the deep networks used in the ALL images and how these deep features are generated through advanced models, we intend to show the effect of these deep filters in several deep layers. Fig. 7 shows the output of the layers in the ViT network. As seen in Fig. 7, general information such as texture is extracted in the early layers. However, as the number of deep layers increases and the complexity of the model grows, more detailed and intricate information is captured compared to previous layers. These deep features become the basis for our subsequent processing.
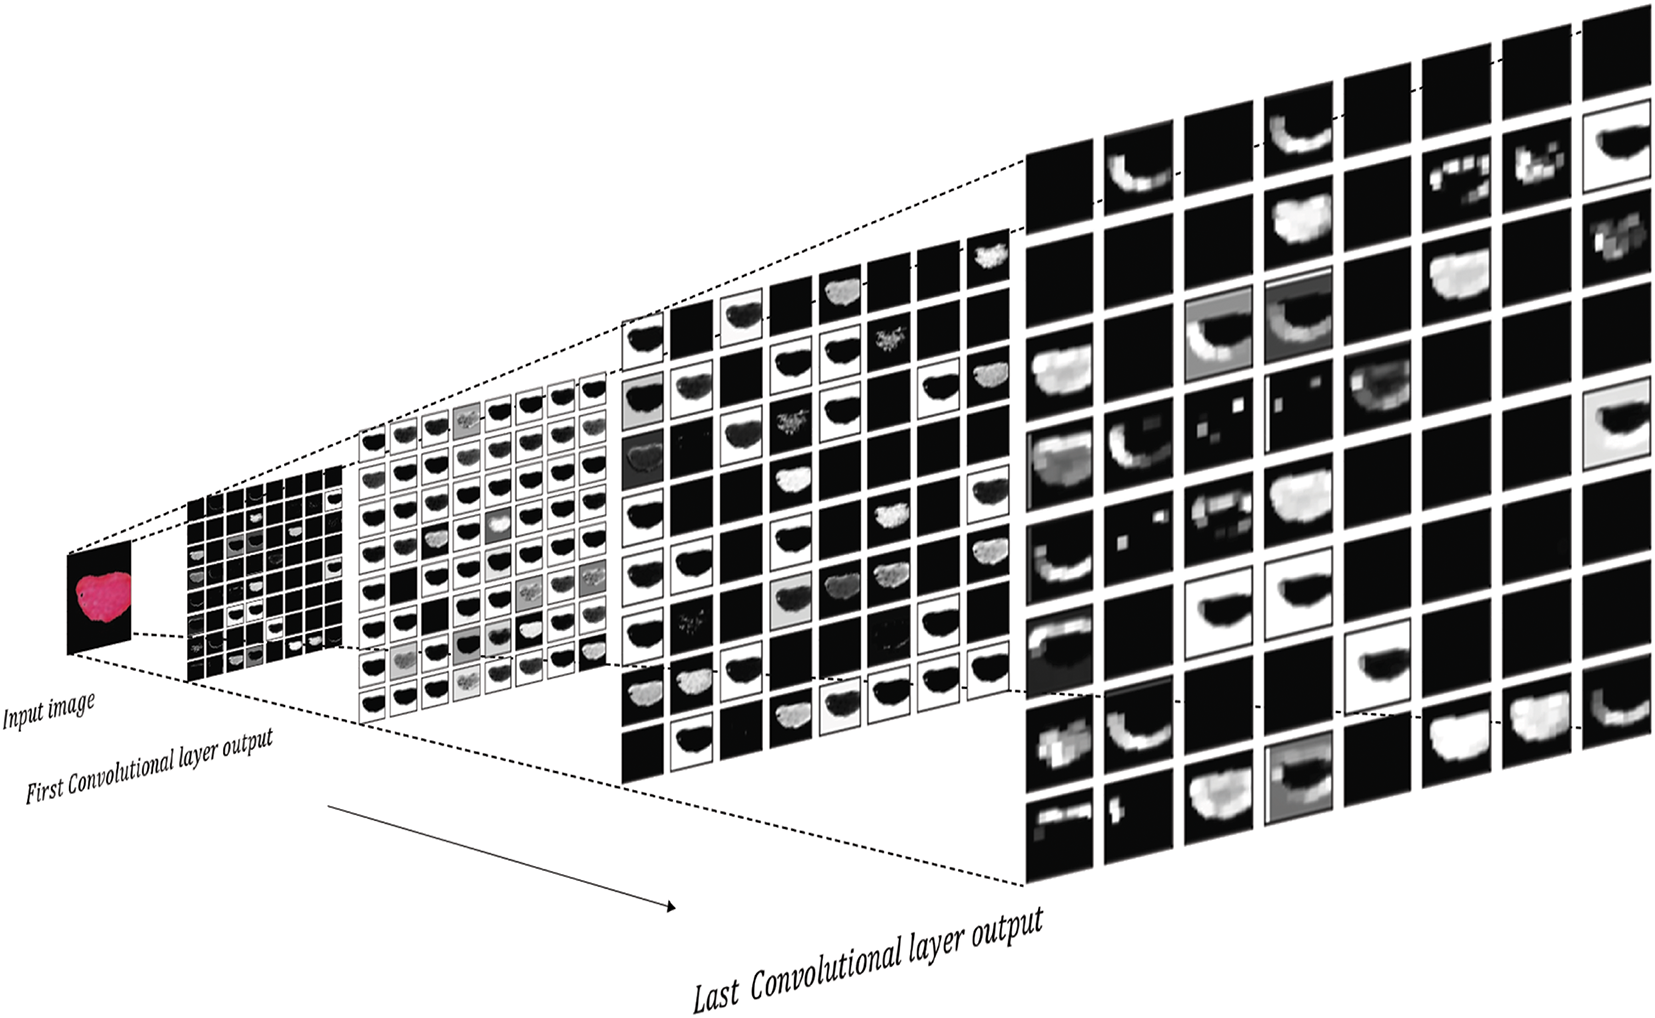
Figure 7: The output of each convolutional layer in ViT network
During training, the parallel network was designed with a final Dense layer containing four nodes, corresponding to the four output categories for our classification model. However, once training is complete, this final classification layer is removed (“popped”), leaving the previous layer, a fully connected (flatten) layer with k nodes, as the last active layer. This modification transforms the model into a feature extractor, allowing us to extract k deep features from the output of the network. These extracted deep features, combined with classic features, form the final feature matrix, which is then used for further analysis and classification (see Fig. 4).
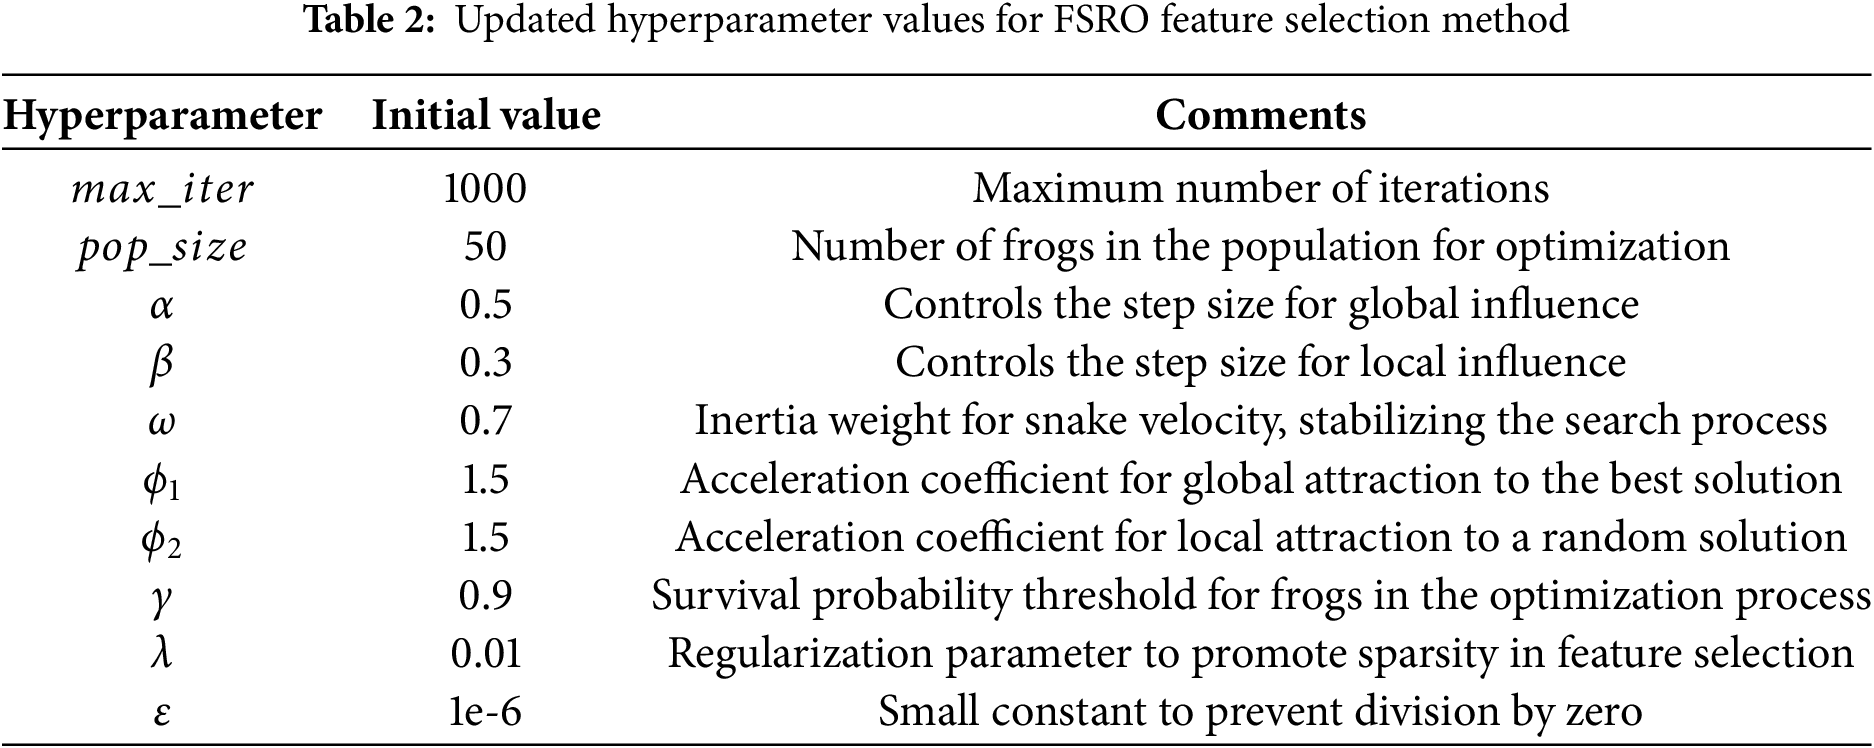
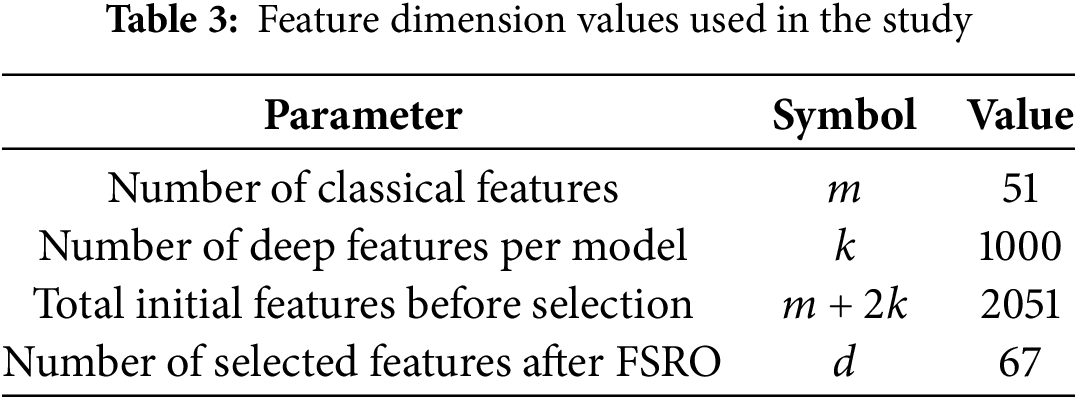
After the feature matrix is generated, its dimensions must be reduced. Therefore, the feature selection method has been employed in this stage. In order to initialize our feature selection method, we need to initialize several key hyperparameters to guide the process. Table 2 shows the initial values for these hyperparameters.
We have conducted several simulations to compare our proposed feature selection method with different well-known meta-heuristic optimization algorithms. The Fitness Function Convergence plot (Fig. 8) illustrates the performance of six optimization algorithms FSRO, Particle Swarm Optimization (PSO), Genetic Algorithm (GA), Differential Evolution (DE), Simulated Annealing (SA), and Grey Wolves Optimization (GWO), over 20 experimental runs. The mean convergence curve for each algorithm is presented in Fig. 8 with shaded regions to represent variability (scaled standard deviation) across multiple runs.
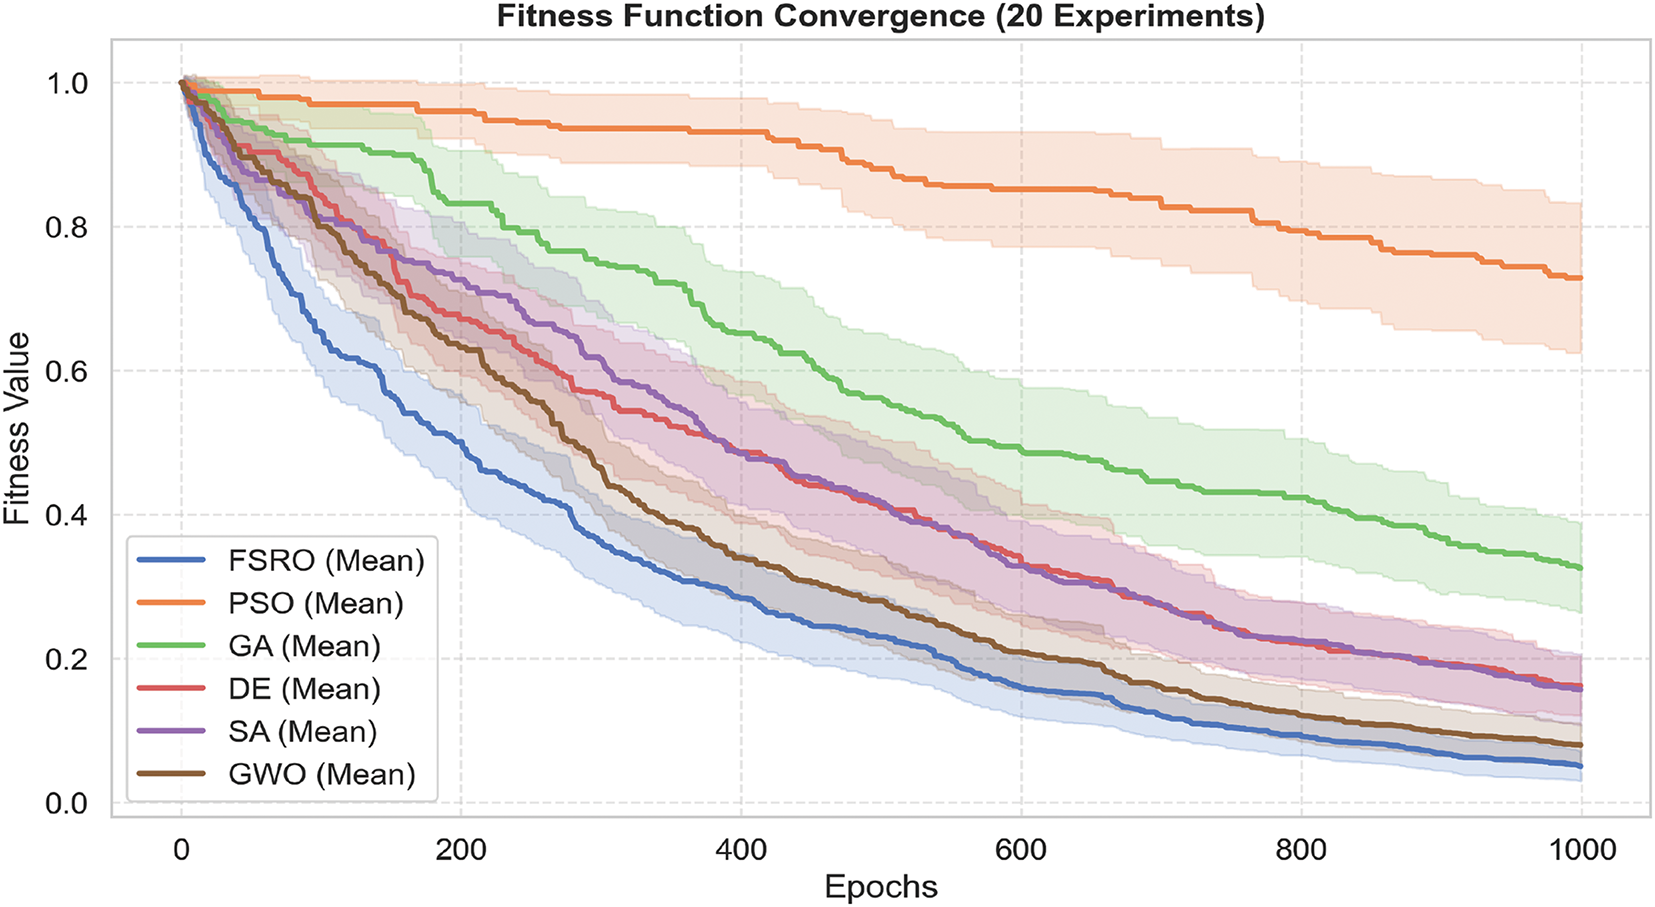
Figure 8: Comparison of convergence curves for different optimization algorithms
Notably, FSRO shows a superior convergence trend with the lowest fitness value achieved over epochs. The narrow shaded area around FSRO’s curve shows a high stability, with less standard deviation through runs. On the other hand, PSO has faster convergence, but it retains the higher fitness values and manifests large variability, as noticed from the wider shaded region. GA and SA show convergence in an intermediate way, but both plateau earlier, possibly indicating little room for further fitness value improvement. The value for each parameter regarding vector lengths is expressed in the Table 3.
Quantitative comparison is given in the Convergence Speed, Final Fitness Values, and Stability of Fitness (Fig. 9). With regard to the convergence speed, PSO converges much faster (665 epochs) than the rest of the algorithms, while it has the worst final fitness value (0.69), which implies a trade-off between speed and quality. FSRO requires more epochs (903) to converge, but outperforms all other algorithms regarding Final Fitness Value (0.057), as it is capable of exploring as well as exploiting the solution space. GWO shows similarly competitive performance in obtaining a comparatively low Final Fitness Value (0.097) with moderate convergence time.
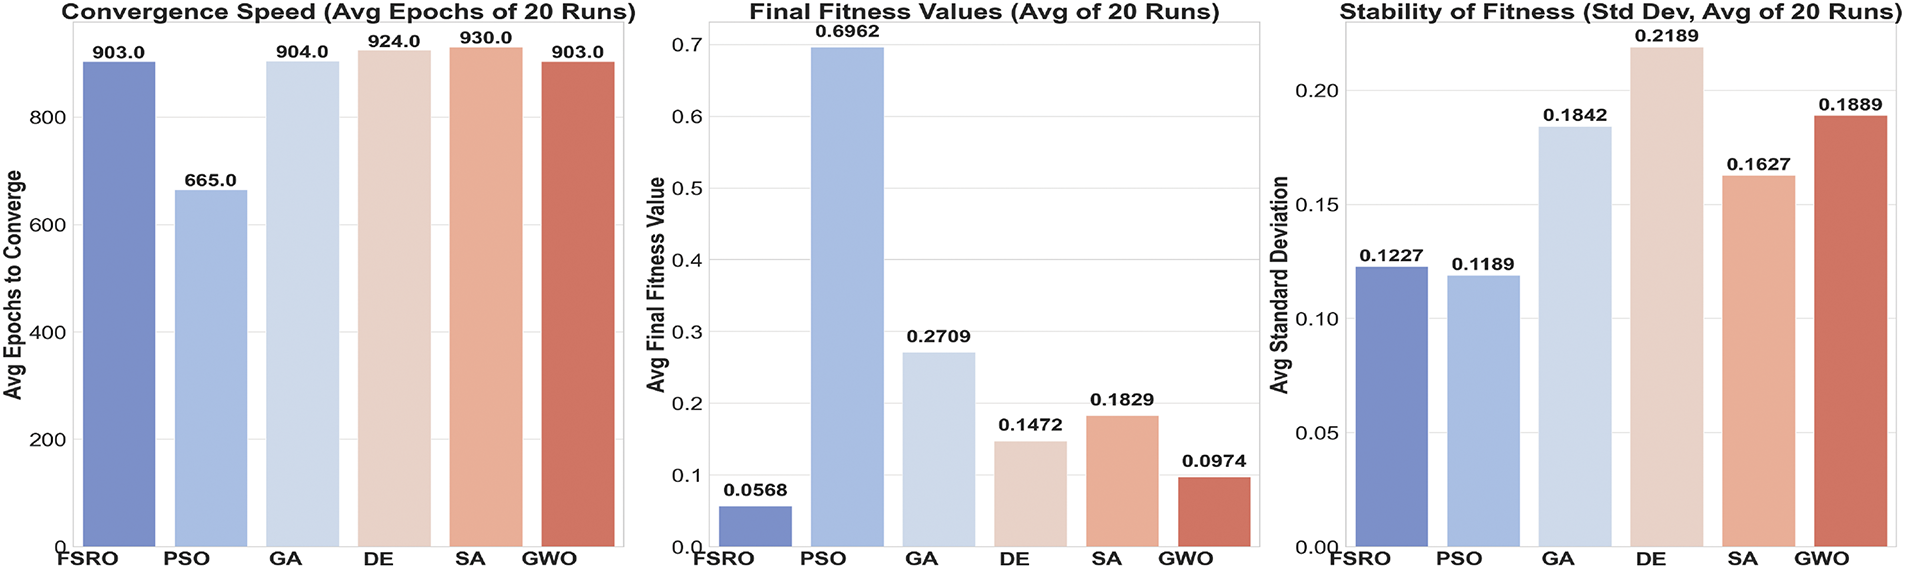
Figure 9: Comparis on of Convergence Speed, Final Fitness Values, and Stability of Fitness metrics for different optimization algorithms
The Stability of Fitness plot further validates the performance of FSRO since it achieves a low standard deviation equal to 0.1227, which confirms its stability over 20 runs. DE, SA, and GWO are intermediate in stability, with standard deviations clustered between 0.16 and 0.21. The analysis points to FSRO as the most efficient algorithm; it realizes a good trade-off between convergence speed, solution quality, and stability.
Using the feature selection method, we have selected 87 features out of 2048 features. Now that the selected features have been identified, it is necessary to use machine learning algorithms for data classification. These classification algorithms are widely used in the world of data science and data mining today.
In the evaluation of our proposed method, we employ the widely recognized Area Under the Receiver Operating Characteristic Curve (AUC-ROC) metric. The AUC-ROC provides a comprehensive measure of a model’s ability to distinguish between positive and negative classes across various threshold settings, making it particularly suitable for classification tasks. By utilizing the AUC-ROC, we assess the power and effectiveness of our proposed approach in enhancing classification performance. This metric offers a robust evaluation criterion that allows us to quantify the improvements achieved by our method, ensuring a rigorous and meaningful assessment of its impact on classification accuracy and model generalization. Fig. 10 illustrates the AUC-ROC. As evident in Fig. 10, among these methods, the Random Forest algorithm has achieved an AUC of 97% for us. This demonstrates that our proposed method has been able to improve the performance of classification. The other evaluation metrics are listed as follows:
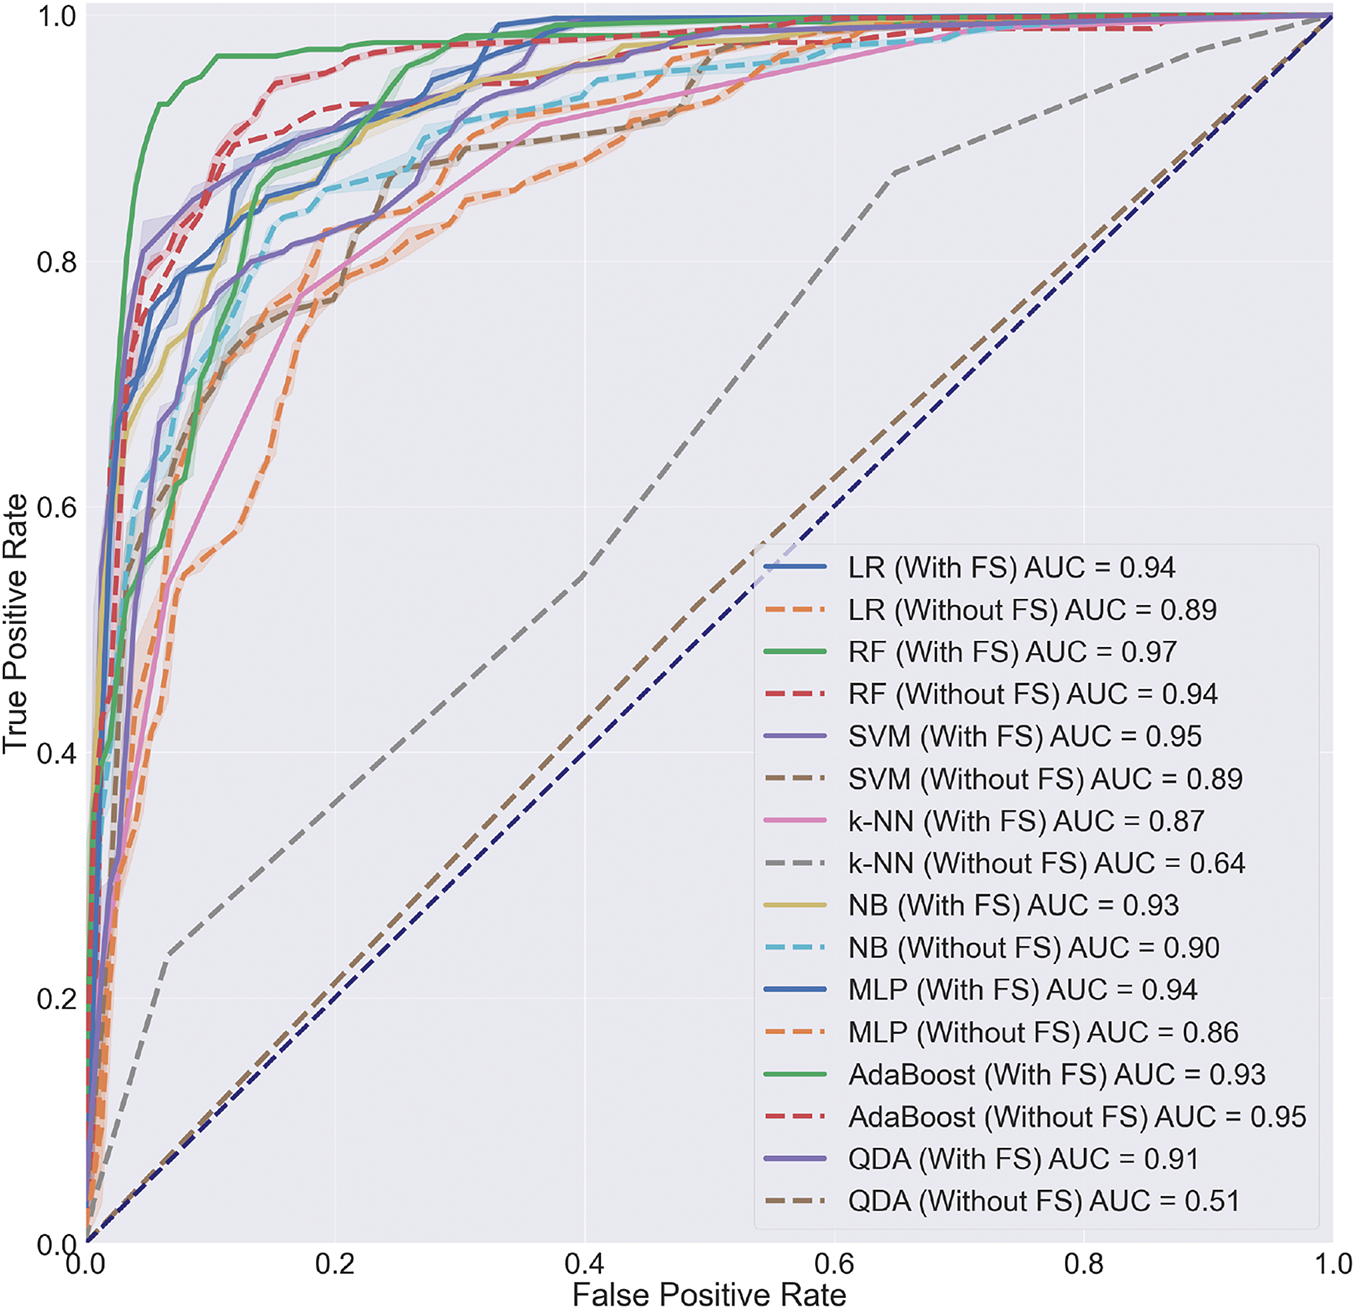
Figure 10: The obtained AUC-ROC of classification with and without feature selection (FS) for different classification methods
In summary, accuracy measures the overall correctness of a model’s predictions, precision measures how many of the positive predictions are actually true positives, sensitivity measures how many of the true positives are correctly identified, and the F1 score is a combination of precision and sensitivity that provides a balanced measure of a model’s performance.
We measured metrics in Eqs. (8) to (11) for two different scenarios by enabling feature selection and without using feature selection. The results are illustrated in Fig. 11. These plots show that our feature selection method has effectively enhanced the performance of the classification models. However, this observation does not hold true for the AdaBoost method, where the difference between the two scenarios is marginal. Nevertheless, it has still managed to improve the performance of the best classification model, which is Random Forest, to an acceptable extent.
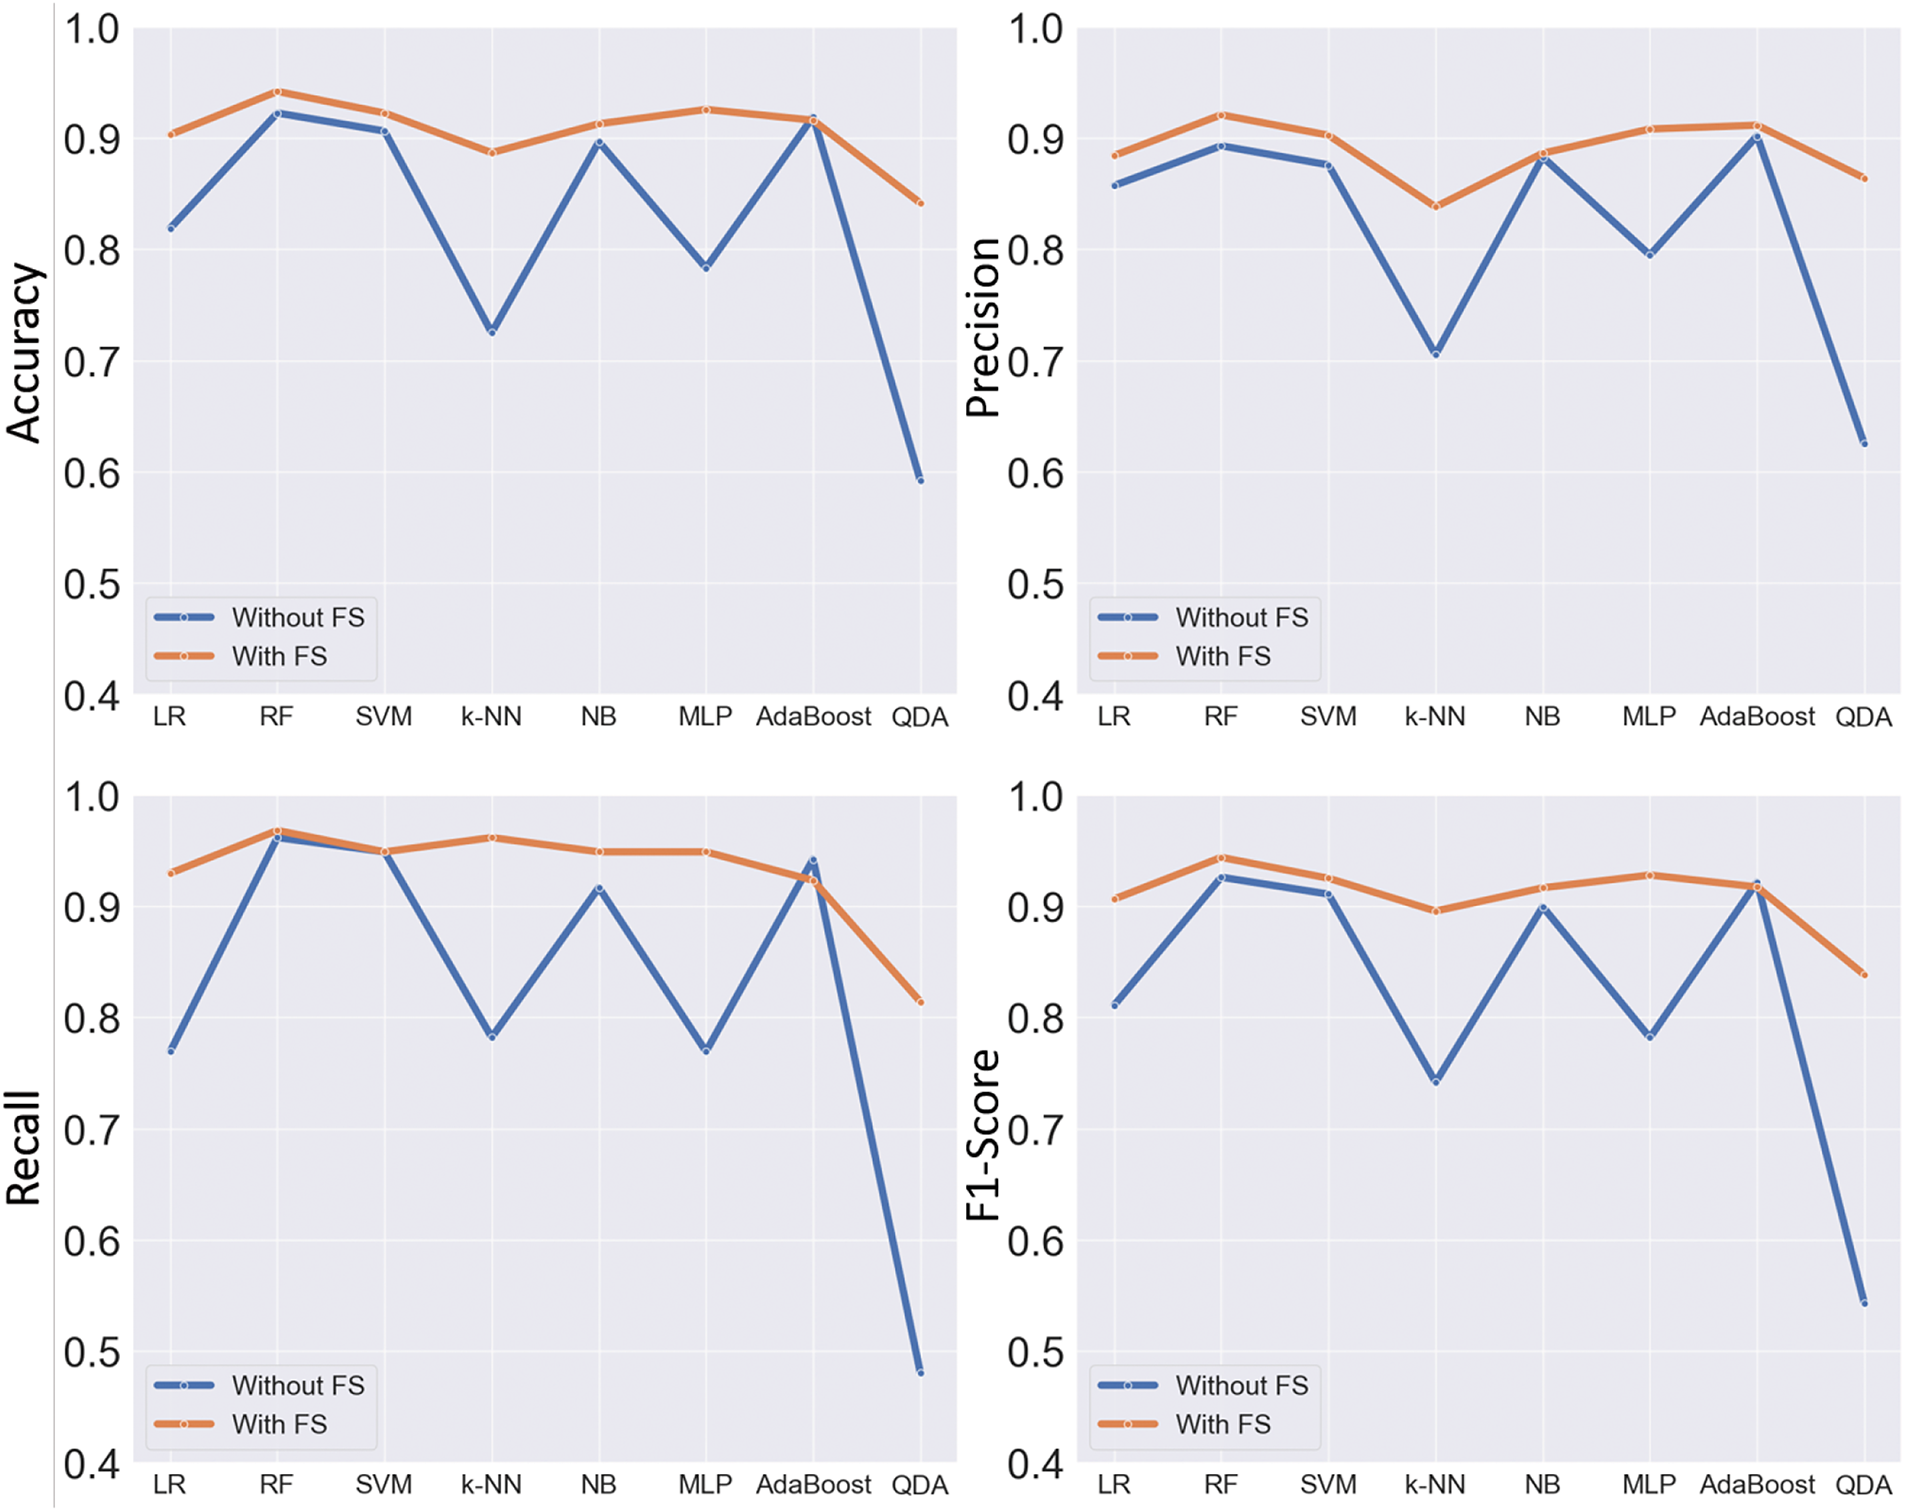
Figure 11: The measured metrics in different classification methods for two scenarios: without feature selection (the blue line) and with the application of the proposed feature selection method (the orange line)
In addition, to compare our proposed feature selection method with other conventional feature selection methods, we have measured the output metric results of our method with those of other methods. These results are presented in Table 4.
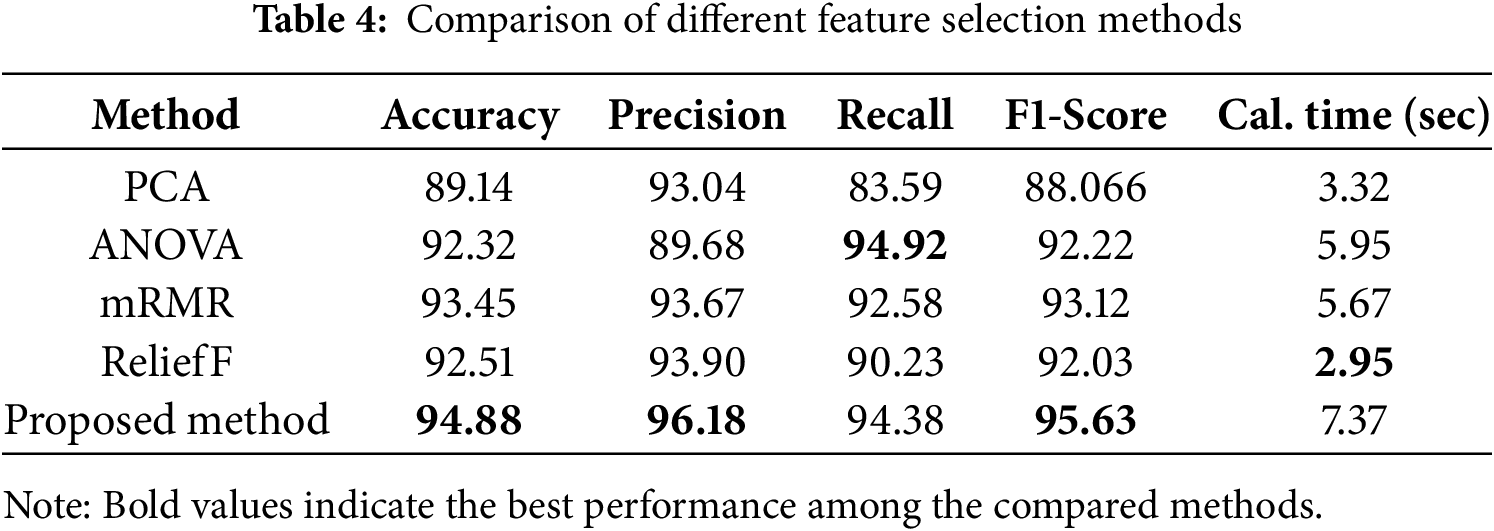
Table 5 illustrates the results of various methods compared to our proposed method. For each method, we have calculated train and test evaluation metrics separately. We used only classic features and the best machine learning classifier output for the classic methods. For a better understanding of the extent of performance improvement, we also implemented the ViT and EfficientNetV2 methods in a standalone manner to demonstrate the individual performance of each of these methods. We have also compared our work with three of the most recent and similar methods proposed in this field.
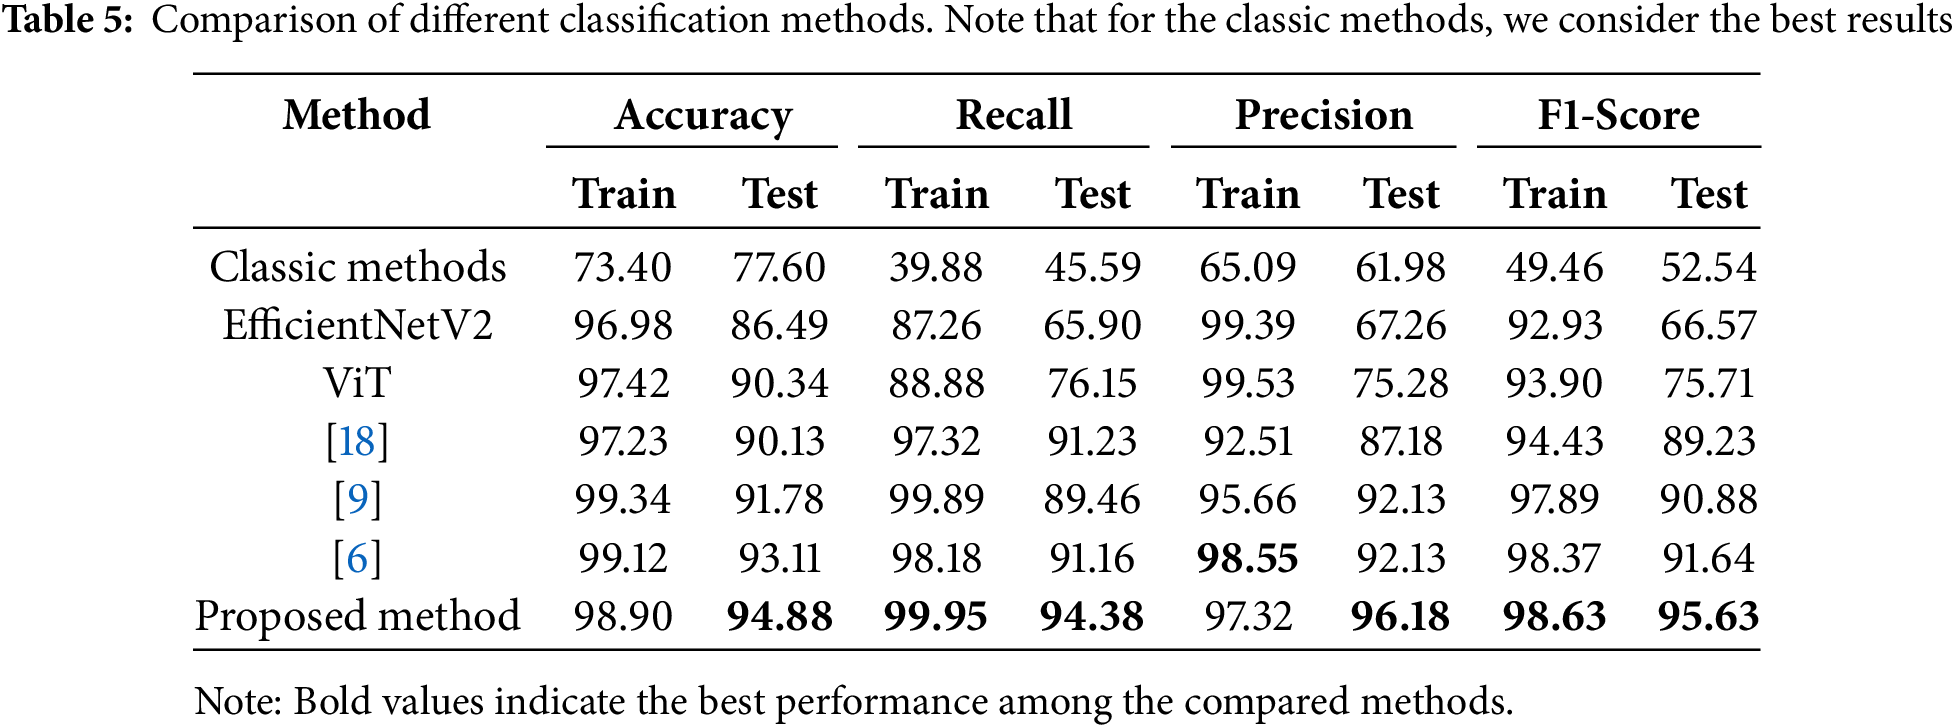
The obtained results underscore the notable advancements brought about by the proposed method in the realm of white blood cell (WBC) subtype classification. The Random Forest algorithm, serving as the cornerstone of the classification pipeline, exhibited an outstanding Area Under the Curve (AUC) of 97%, signifying the substantial enhancement achieved by the introduced methodology. This improvement is particularly crucial in the context of medical diagnostics, where accurate classification of WBCs plays a pivotal role in identifying hematological disorders.
The efficacy of the feature selection method is evident in the comparison of metrics obtained with and without its application. The visualization of metrics, including accuracy, precision, recall, and F1 score in Fig. 11, demonstrates that the proposed feature selection approach effectively enhances the overall performance of the classification models. Notably, the Random Forest classifier experienced significant improvement, while even the marginal gains observed in the AdaBoost method underscore the adaptability and efficacy of the introduced feature selection technique across various classifiers. This nuanced understanding of feature importance contributes to the interpretability and reliability of the classification outcomes, a critical aspect in the medical field where the consequences of misclassification can be severe.
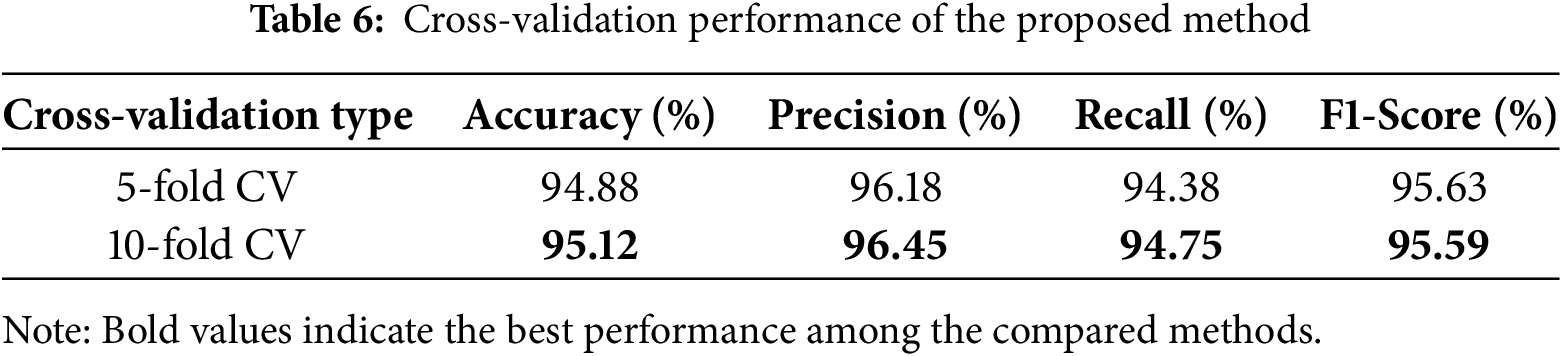
To ensure the stability of our method across various conditions, we employed 5-fold and 10-fold cross-validation techniques. These techniques allow us to evaluate the capacity of our model to generalize by splitting the dataset into various training and test datasets. The results are shown in the Table 6. Notably, the use of 10-fold cross-validation yielded a marginal increase in accuracy (95.12%) over that obtained using 5-fold cross-validation (94.88%). This is reasonable, as dividing the data into more folds allows the model to learn from more diverse samples, so it gets more flexible. Yet the variation is not huge. It means that our method is stable, consistent, and always high-scoring no matter how we split the data.
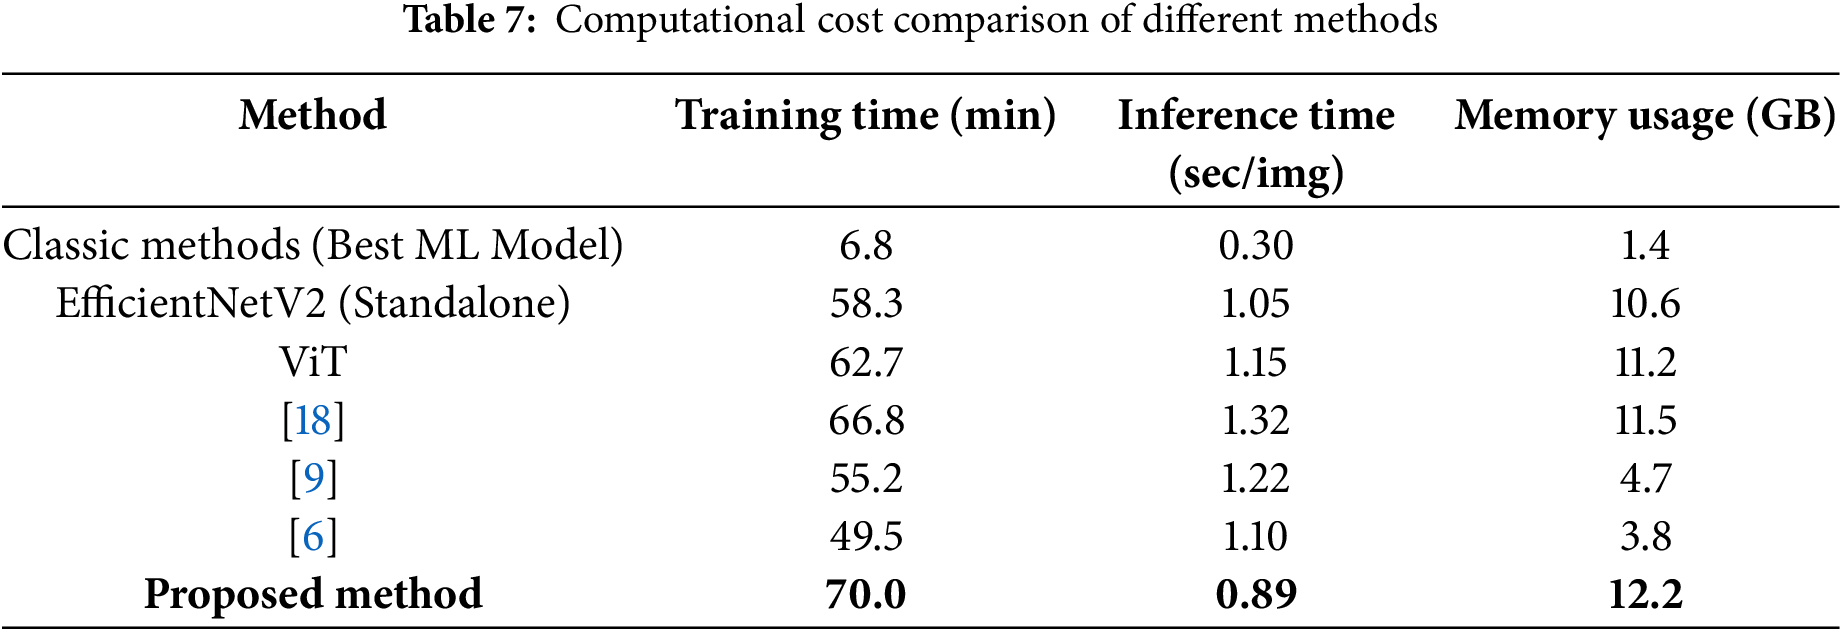
In terms of complexity and computation time, the results are shown in Table 7. Our proposed method requires slightly more training time than standalone ViT or EfficientNetV2 models but optimizes feature selection, leading to better classification accuracy. Despite the additional computation, the inference time (0.89s per image) is faster than other transformer-based and hybrid CNN models, making it feasible for real-time clinical applications.
The comparative analysis against conventional feature selection methods, as depicted in Table 4, accentuates the superiority of the proposed methodology. Outperforming techniques such as PCA, ANOVA, mRMR, and ReliefF in accuracy, precision, recall, and F1-Score, the proposed method showcases its ability to strategically optimize the feature space for improved classification outcomes. Despite a marginally extended computational time, the notable performance gains substantiate the method’s efficacy in handling the complexities associated with real-world data sourced from diverse hospitals.
This is particularly crucial as the proposed method outshines its counterparts designed for standard datasets, presenting a robust solution tailored to the intricacies of ALL diagnosis in authentic clinical scenarios.
The current work proposes a significant advancement in leukemia subtype classification by suggesting a novel ensemble model as the first step that synergistically fuses the strengths of Vision Transformer and EfficientNetV2 with classic spatial feature extraction techniques. It can be well portrayed as a strong method in the sense that the classifier gains advantages from both deep learning models and classical feature engineering, enhancing discriminative power. By combining high-function primitives that capture detailed patterns and global dependencies with classical spatial features encapsulating domain-specific knowledge, it builds an effective solution to the heterogeneity and complexity of real medical images.
A key contribution of this work lies in the proposed feature selection strategy. Formulated as an optimization problem, it meticulously balances the relevance, redundancy, and sparsity of the feature space. This not only reduces the curse of dimensionality but also imparts model interpretability by selecting only the most influential features, thereby reducing computational overhead while improving classification accuracy. Traditional feature selection techniques are easily outperformed, as this proposed framework is more principled and data-driven, specifically oriented toward the challenges presented in leukemia subtype classification.
Moreover, the proposed method is validated on a heavily diverse and complex dataset collected from various hospitals, emulating observations in real-life clinical practice. The ensemble model’s generalization abilities over such a heterogeneous dataset are highly relevant for clinical diagnostic setups, where variability in image acquisition conditions and patient demographics presents a significant challenge. These exceptional performance metrics, such as 94.88% accuracy and an AUC of 97%, further prove the superiority of this method over currently used state-of-the-art techniques.
As cited here, this paper presents, among others, a strong, effective, and highly accurate way to classify leukemia subtypes using medical images. It realizes such an integration not only between deep learning models and classical feature extraction but also through a novel feature selection technique, which provides a model that is both diagnostically powerful and computationally efficient, and scalable for real-world applications. This hybrid approach sets a new benchmark in classification tasks and awaits application across a broader range of diseases, promising substantial implications for improving diagnostic accuracy and patient outcomes for this and potentially other dreadful diseases.
Acknowledgement: The authors appreciate the cooperation of Taleghani, Tajrish, Shariati, and Imam Khomeini Hospitals for providing data and resources in this study.
Funding Statement: The authors did not receive support from any organization for the submitted work.
Author Contributions: Reza Goodarzi: Conceptualization, provided contributions toward experimental design, and supervisor of research. Ali Jalali: Supervised the entire work, contributed to experimental design, and coordinated manuscript preparation and revisions. Omid Hashemi Pour Tafreshi: Contributed to data analysis, experimental setup, and drafting the manuscript. Jalil Mazloum: Contributed to dataset preparation, feature selection strategy, and model evaluation. Peyman Beygi: Developed, implemented the codebase of simulations and contributed to optimization and analysis of the models. All authors reviewed the results and approved the final version of the manuscript.
Availability of Data and Materials: The data that support the findings of this study are available from the corresponding author upon reasonable request.
Ethics Approval: This research project was conducted with the cooperation of Taleghani Hospital, the Center for Stem Cell Specialized Laboratory Tests, Tajrish Hospital, Shariati Hospital Pathology Center, and Imam Khomeini Hospital in Iran. The study was carried out in accordance with the Declaration of Helsinki. The informed consent of the participants was obtained, and institutional permission was granted by each center for the anonymized use of clinical data. Although no formal ethics approval number was issued, all ethical standards and guidelines were strictly followed throughout the research process.
Conflicts of Interest: The authors declare no conflicts of interest to report regarding the present study.
In this advanced analysis section, we attempt to move beyond the qualitative measures of the images in our dataset. We now bring in two such key metrics, SNR and image entropy. We randomly chose 100 images from the dataset and an equivalent subset from the ALL-IDB dataset to ensure robust comparison. Signal-to-Noise Ratio (SNR) is an important measure in image quality assessment, and really affects image processing. It directly indicates the clarity and quality of images; the higher the SNR value, the better the quality of the image. In this section, we consider an in-depth comparison of the SNR values between our dataset and the ALL-IDB dataset. The SNR values were carefully calculated for the randomly selected images from both datasets.
Fig. A1 provides a more advanced comparison of SNR values, where our dataset is represented in blue while the ALL-IDB dataset is represented in red. In this plot, it is unequivocally proved that the view expressed about our dataset with lower SNR measures corresponds to poorer quality images with a greater occurrence of noise, as compared to the ALL-IDB dataset.
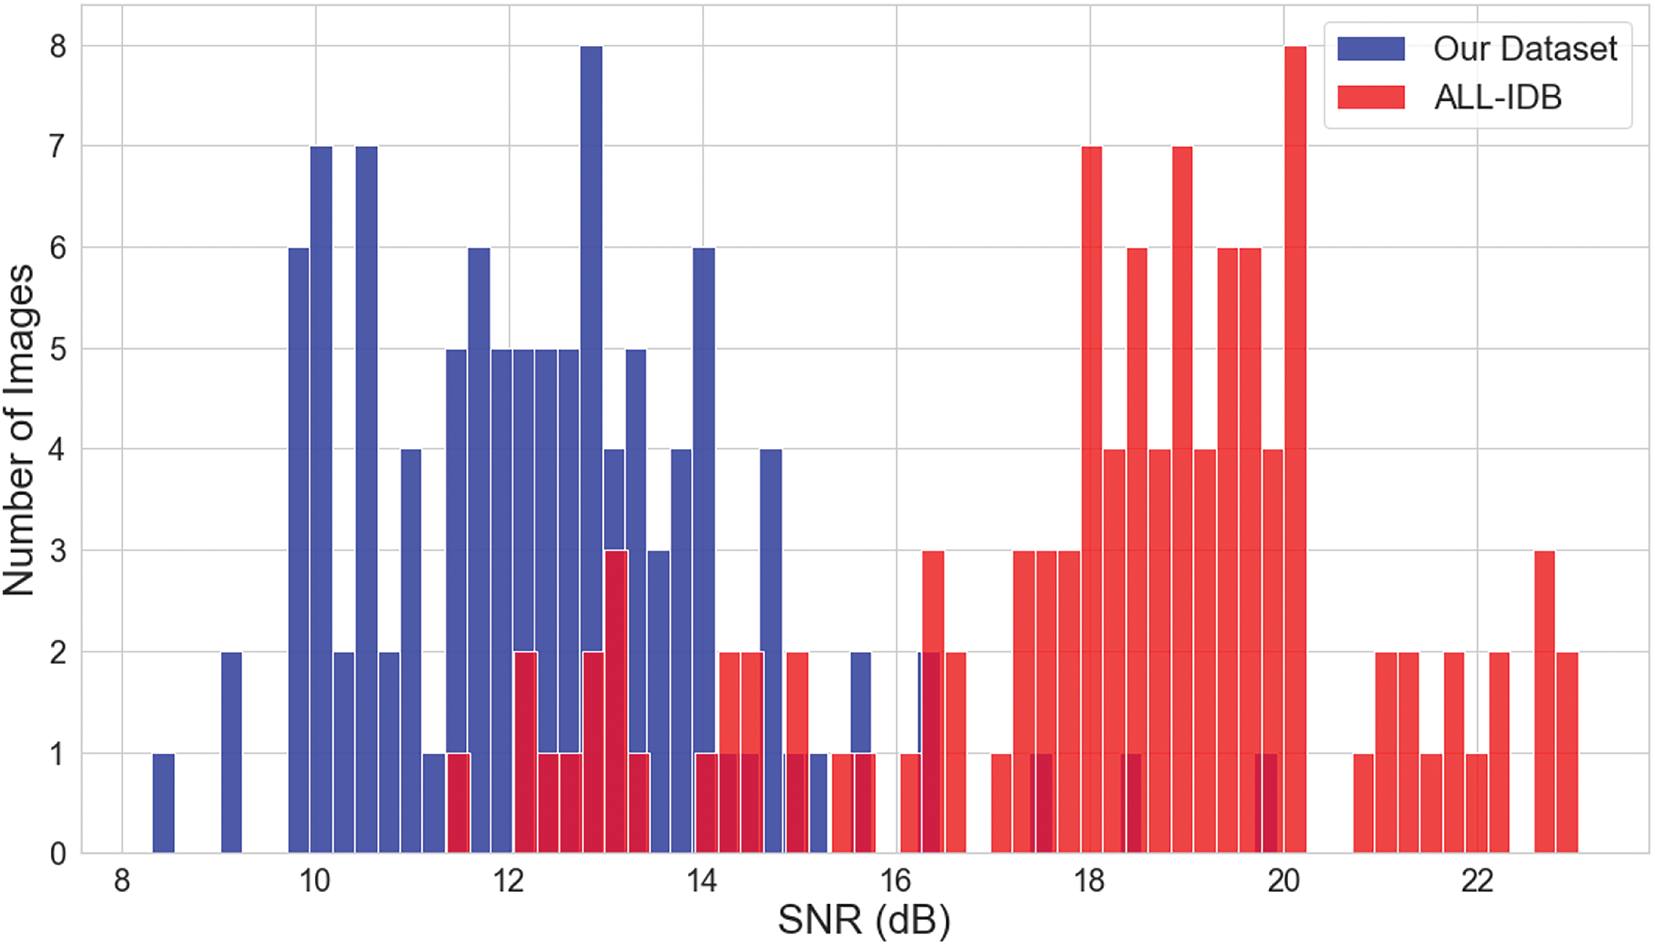
Figure A1: SNR comparison: our dataset vs. ALL-IDB
Appendix B Image Entropy
Image entropy is therefore a deep measure of the complexity and randomness of the image. The larger the entropy, the more diversified the patterns and details in an image. In this section, we will compare the images of our dataset with the ALL-IDB dataset to get an extended analysis regarding entropy. Fig. A2 shows a more detailed example of the comparison of image entropy. Our dataset is in blue, while red is the ALL-IDB dataset. It clearly comes out from the plot that our dataset contains images with much higher entropy, hence a much more complicated and wider variety of image collection. The highly advanced analyses of SNR and image entropy clearly show that our dataset is not only characterized by lower image quality regarding SNR but also offers a more heterogeneous, complex, and challenging collection of images. This is what clearly makes our dataset exceptionally well-suited for demanding image processing and computer vision tasks, making it a more valid ground for classification tasks and pattern recognition due to its much higher variety and complexity.
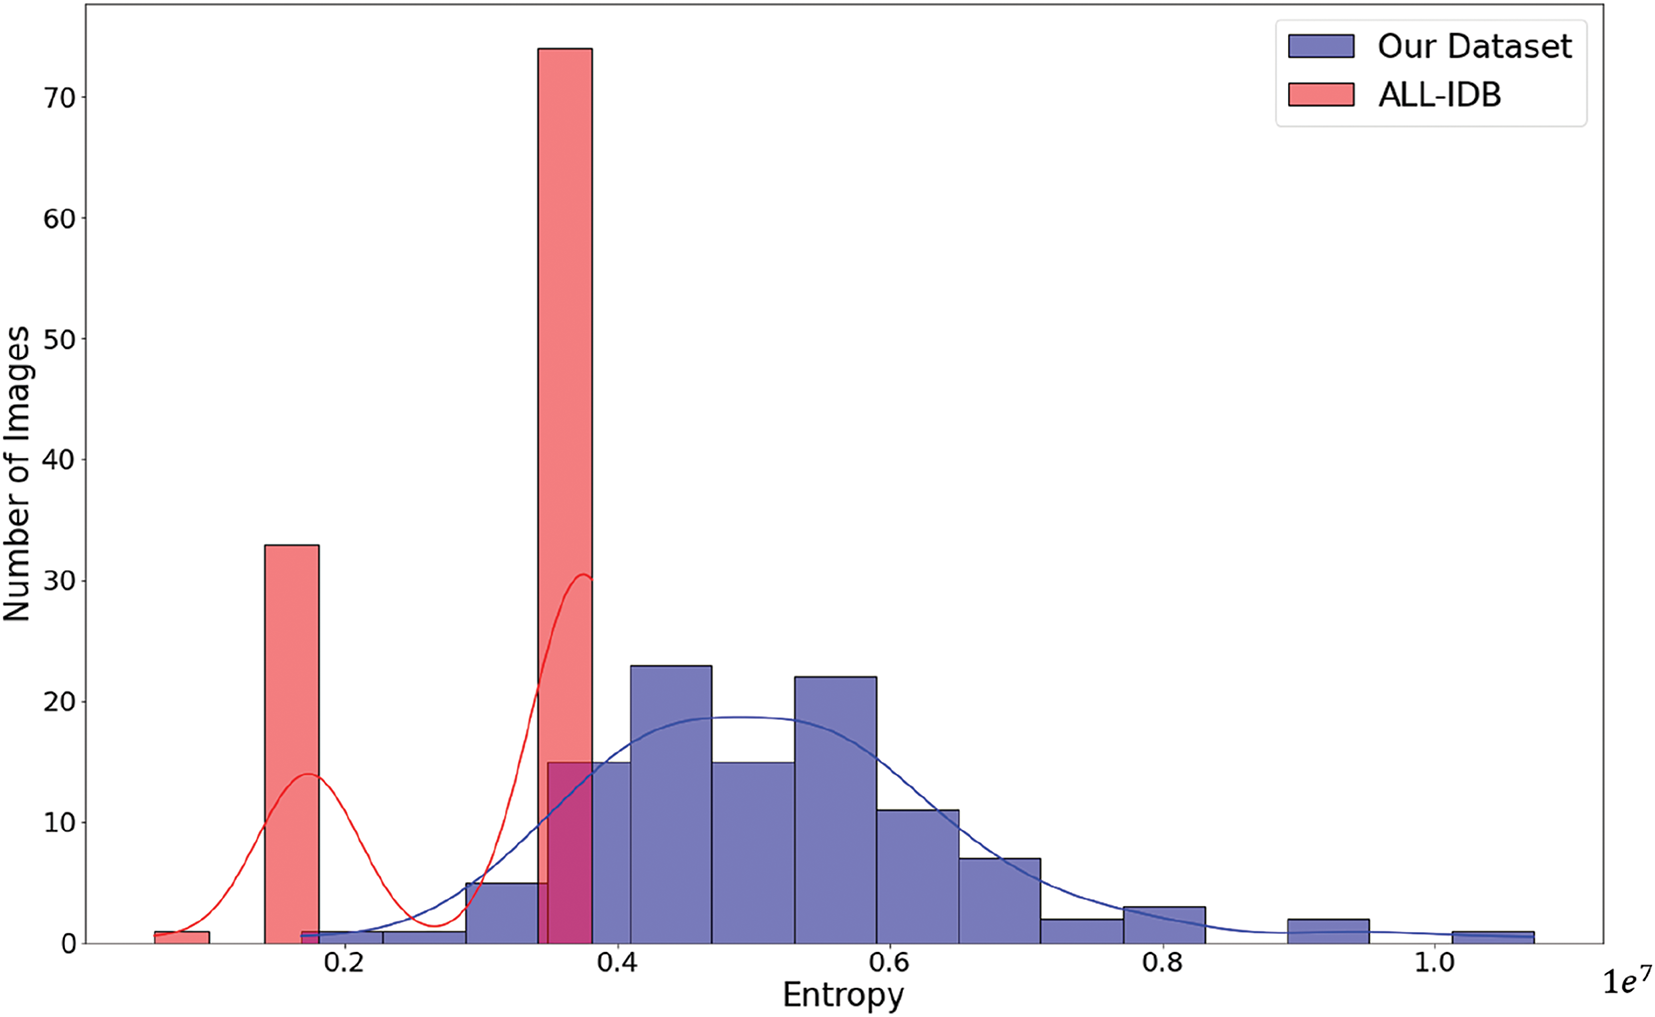
Figure A2: Image entropy comparison: our dataset vs. ALL-IDB
References
1. Rajpurohit S, Patil S, Choudhary N, Gavasane S, Kosamkar P. Identification of acute lymphoblastic leukemia in microscopic blood image using image processing and machine learning algorithms. In: 2018 International Conference on Advances in Computing, Communications and Informatics (ICACCI). Bangalore, India: IEEE; 2018. p. 2359–63. [Google Scholar]
2. Joshi MD, Karode AH, Suralkar S. White blood cells segmentation and classification to detect acute leukemia. Int J Emerg Trends Technol Comput Sci (IJETTCS). 2013;2(3):147–51. [Google Scholar]
3. Vaghela H, Modi H, Pandya M, Potdar M. A novel approach to detect chronic leukemia using shape based feature extraction and identification with digital image processing. Int J Appl Inform Syst (IJAIS). 2016;11(5):9–16. doi:10.5120/ijais2016451607. [Google Scholar] [CrossRef]
4. Li Y, Zhu R, Mi L, Cao Y, Yao D. Segmentation of white blood cell from acute lymphoblastic leukemia images using dual-threshold method. Comput Math Methods Med. 2016;2016(1):1–12. doi:10.1155/2016/9514707. [Google Scholar] [PubMed] [CrossRef]
5. Sahlol AT, Kollmannsberger P, Ewees AA. Efficient classification of white blood cell leukemia with improved swarm optimization of deep features. Sci Rep. 2020;10(1):2536. doi:10.1038/s41598-020-59215-9. [Google Scholar] [PubMed] [CrossRef]
6. Özyurt F. A fused CNN model for WBC detection with MRMR feature selection and extreme learning machine. Soft Comput. 2020;24(11):8163–72. doi:10.1007/s00500-019-04383-8. [Google Scholar] [CrossRef]
7. Saitou H, Haraguchi H. Frog-Snake prey-predation Relationship Optimization (FSROa novel nature-inspired metaheuristic algorithm for feature selection. arXiv:2403.18835. 2024. [Google Scholar]
8. Sampathila N, Chadaga K, Goswami N, Chadaga RP, Pandya M, Prabhu S, et al. Customized deep learning classifier for detection of acute lymphoblastic leukemia using blood smear images. Healthcare. 2022;10(10):1812. doi:10.3390/healthcare10101812. [Google Scholar] [PubMed] [CrossRef]
9. Çınar A, Tuncer SA. Classification of lymphocytes, monocytes, eosinophils, and neutrophils on white blood cells using hybrid Alexnet-GoogleNet-SVM. SN Appl Sci. 2021;3(4):1–11. doi:10.1007/s42452-021-04485-9. [Google Scholar] [CrossRef]
10. Chand S, Vishwakarma VP. A novel deep learning framework (DLF) for classification of acute lymphoblastic leukemia. Multimedia Tools Appl. 2022;81(26):37243–62. doi:10.1007/s11042-022-13543-2. [Google Scholar] [CrossRef]
11. Ahmad R, Awais M, Kausar N, Tariq U, Cha JH, Balili J. Leukocytes classification for leukemia detection using quantum inspired deep feature selection. Cancers. 2023;15(9):2507. doi:10.3390/cancers15092507. [Google Scholar] [PubMed] [CrossRef]
12. Hassan E, Saber A, Elbedwehy S. Knowledge distillation model for Acute Lymphoblastic Leukemia Detection: exploring the impact of nesterov-accelerated adaptive moment estimation optimizer. Biomed Sig Process Control. 2024;94(6):106246. doi:10.1016/j.bspc.2024.106246. [Google Scholar] [CrossRef]
13. Bhatia K, Dhalla S, Mittal A, Gupta S, Gupta A, Jindal A. Integrating explainability into deep learning-based models for white blood cells classification. Comput Elect Eng. 2023;110(1):108913. doi:10.1016/j.compeleceng.2023.108913. [Google Scholar] [CrossRef]
14. Das PK, Sahoo B, Meher S. An efficient detection and classification of acute leukemia using transfer learning and orthogonal softmax layer-based model. IEEE/ACM Trans Comput Biol Bioinform. 2022;20(3):1817. doi:10.1109/tcbb.2022.3218590. [Google Scholar] [PubMed] [CrossRef]
15. Tavakoli S, Ghaffari A, Kouzehkanan ZM, Hosseini R. New segmentation and feature extraction algorithm for classification of white blood cells in peripheral smear images. Sci Rep. 2021;11(1):19428. doi:10.1101/2021.04.29.441751. [Google Scholar] [CrossRef]
16. Jović A, Brkić K, Bogunović N. A review of feature selection methods with applications. In: 2015 38th International Convention on Information and Communication Technology, Electronics and Microelectronics (MIPRO); 2015; Opatija, Croatia. p. 1200–5. [Google Scholar]
17. Breiman L. Random forests. Mach Learn. 2001;45:5–32. doi:10.1023/A:1010933404324. [Google Scholar] [CrossRef]
18. Shafique S, Tehsin S. Acute lymphoblastic leukemia detection and classification of its subtypes using pretrained deep convolutional neural networks. Technol Cancer Res Treat. 2018;17:1533033818802789. doi:10.1177/1533033818802789. [Google Scholar] [PubMed] [CrossRef]
Cite This Article
 Copyright © 2025 The Author(s). Published by Tech Science Press.
This work is licensed under a Creative Commons Attribution 4.0 International License , which permits unrestricted use, distribution, and reproduction in any medium, provided the original work is properly cited.
 Downloads
 Citation Tools