
 Submit a Paper
 Propose a Special lssue
 Open Access
ARTICLE
Multi-Label Machine Learning Classification of Cardiovascular Diseases
1 Graduate Institute of Automation and Control, National Taiwan University of Science and Technology, Taipei, 10607, Taiwan
2 Department of Electrical Engineering, National Taiwan Ocean University, Keelung City, 202301, Taiwan
* Corresponding Author: Chih-Ta Yen. Email:
(This article belongs to the Special Issue: Selected Papers from the International Multi-Conference on Engineering and Technology Innovation 2024 (IMETI2024))
Computers, Materials & Continua 2025, 84(1), 347-363. https://doi.org/10.32604/cmc.2025.063389
Received 13 January 2025; Accepted 24 April 2025; Issue published 09 June 2025
 View Full Text
 Download PDF
Abstract
In its 2023 global health statistics, the World Health Organization noted that noncommunicable diseases (NCDs) remain the leading cause of disease burden worldwide, with cardiovascular diseases (CVDs) resulting in more deaths than the three other major NCDs combined. In this study, we developed a method that can comprehensively detect which CVDs are present in a patient. Specifically, we propose a multi-label classification method that utilizes photoplethysmography (PPG) signals and physiological characteristics from public datasets to classify four types of CVDs and related conditions: hypertension, diabetes, cerebral infarction, and cerebrovascular disease. Our approach to multi-disease classification of cardiovascular diseases (CVDs) using PPG signals achieves the highest classification performance when encompassing the broadest range of disease categories, thereby offering a more comprehensive assessment of human health. We employ a multi-label classification strategy to simultaneously predict the presence or absence of multiple diseases. Specifically, we first apply the Savitzky-Golay (S-G) filter to the PPG signals to reduce noise and then transform into statistical features. We integrate processed PPG signals with individual physiological features as a multimodal input, thereby expanding the learned feature space. Notably, even with a simple machine learning method, this approach can achieve relatively high accuracy. The proposed method achieved a maximum F1-score of 0.91, minimum Hamming loss of 0.04, and an accuracy of 0.95. Thus, our method represents an effective and rapid solution for detecting multiple diseases simultaneously, which is beneficial for comprehensively managing CVDs.Keywords
In 2019, 33 million deaths worldwide were attributed to the four major noncommunicable diseases (NCDs) (with a confidence interval of 24.5 to 43.3 million). Among these, cardiovascular diseases (CVDs) accounted for the greatest number of deaths, reaching 17.9 million. Undoubtedly, CVDs have become a global health concern requiring urgent attention and solutions [1]. Although CVDs typically refer to heart-and blood-vessel-related diseases, the category also encompasses some brain-related diseases–such as cerebrovascular diseases–caused by issues with vascular transport [2]. Today, CVDs are linked to both traditional risk factors, such as diabetes and hypertension, as well as the impacts of urbanization, as evidenced by studies investigating non-traditional contributors to CVDs [3]. The most concerning CVDs are type 2 diabetes and hypertension, which are relatively easy to detect. Whether through miniature tools or wearable devices, detection technologies have rapidly evolved to become commonplace within households.
As reported by the World Health Organization (WHO), hypertension can be monitored and managed in order to reduce the risk of stroke and other cardiovascular diseases. This approach is considered both effective and affordable in preventing symptoms of stroke, such as disabilities and cognitive impairment [2]. Strokes can be classified into several types, the most common of which–ischemic stroke, also known as cerebral infarction–is caused by the temporary or permanent obstruction of cerebral blood vessels. The harm caused by cerebral infarction does not end after treatment, as unfavorable discharge outcomes remain a concern. A study utilizing 20 clinical features as inputs achieved an AUC of 0.91 [4]. Cerebrovascular disease is also associated with vascular supply issues, which encompass a number of neurological disorders due to blockage or leakage within brain vessels. Because most cardiovascular diseases stem from vascular problems, blood pressure plays an important role, with hypertension being the most obvious and visible symptom. Systolic blood pressure greater than 140 mmHg and diastolic blood pressure less than 90 mmHg qualify as hypertension. The hypertension is classified into several stages based on systolic and diastolic blood pressure ranges. A machine learning classification study for each stage utilized physiological information, such as age and weight, achieving an accuracy rate of 99% [5]. Overall, hypertension is a risk factor for a variety of diseases, including stroke and heart failure, and is closely associated with most cardiovascular conditions.
In addition to hypertension, diabetes is another important factor associated with CVDs. There is a direct relationship between hypertension and diabetes, both of which are considered noncommunicable diseases often caused by unhealthy lifestyle choices. Research shows that nearly half of diabetic patients also suffer from hypertension. Furthermore, studies have demonstrated that individuals with hypertension and diabetes are more likely to develop CVDs than those without either condition. Moreover, in machine learning research, diabetes ranks as the third most important feature in predicting the length of hospitalization [6]. Additional research conducted through questionnaires and physical examinations indicates that patients with type 2 diabetes face an even higher risk of cardiovascular disease [7]. Fortunately, a study utilizing gender, age, and other hospitalization-related features successfully classified patient outcomes [8], demonstrating the potential of machine learning in diabetes prediction. In contrast, our approach incorporates physiological features and statistical characteristics of PPG signals.
Photoplethysmography (PPG) is a physiological signal that records changes based on vascular conditions. It is commonly employed to predict measurements such as heart rate or blood pressure, offering advantages in terms of compactness, portability, and easy setup [9]. Several studies have been conducted on measuring CVDs and related indicators based on PPG signals. The research applied machine learning technologies to predict CVDs and demonstrated the feasibility of diagnosis via such methods [10]. Although many CVDs share common pathogenic factors, they may require different predictive methods due to their different focuses. In particular, the detection of hypertension may have greater research value, as the condition is associated with a wide range of diseases. In some studies, hypertension has been classified into four types: normal, prehypertension, stage 1 hypertension, and stage 2 hypertension. One study has also demonstrated that fine-tuned decision trees yield better results than ensemble learning [11]. Additionally, it was noted in [12], that the extraction of 20 PPG signal features yielded higher performance than that of 8400 features, with a final accuracy of 93% when using random forests. The use of deep learning has also been widely adopted to complement traditional machine learning [13]. Some prior studies adopted binary classification approaches to predict hypertension. For instance, a support vector machine (SVM) was able to distinguish between normal blood pressure and prehypertension with an accuracy rate of 71.42%. This suggests that a combination of PPG signals with physiological features prior to model training (early fusion) may yield better results than combining the outputs of separate models at a later stage (late fusion) [14]. In other studies, stage 1 and 2 hypertension were combined to distinguish between hypertension and prehypertension [15]. Diabetes has also been studied as a CVD-related condition. Type 2 diabetes has especially received significant attention, with one study proposing a pathology-based index that achieved an accuracy of 98.52% [16]. Multimodal prediction approaches that integrate PPG signals with other sources of information generally achieve better performance. One study focused on personal identification using both electrocardiogram (ECG) and PPG signals. The results demonstrated that, with 10 training data points, the proposed algorithm achieved 92.77% accuracy, 7.23% false rejection rate (FRR), 6.29% false acceptance rate (FAR), 92.77% sensitivity, and 93.21% specificity [17]. Relatively few studies [18] have focused on predicting multiple diseases simultaneously. However, one study proposed a classification task for various disease combinations—including diabetes and hypertension, as well as cerebral embolism and hypertension—achieving an accuracy of 79.83% after data selection.
In this study, we employed a multi-label classification method to predict multiple diseases simultaneously, including all possible combinations of the diseases under consideration. The advantages of this approach include convenience in comparison with the prediction of individual diseases, as well as a more comprehensive assessment of the patient’s condition.
Due to the scarcity of publicly available PPG signal datasets specifically compiled for CVD prediction, the PPG-BP dataset was an ideal choice for our study. This dataset was approved for collection by Guilin People’s Hospital and Guilin University of Electronic Technology. Initially, 219 volunteers provided basic physiological data. Subsequently, CVD-related information was extracted from medical records, and 657 segments of PPG signals were collected on-site, with each volunteer contributing three segments of PPG data. Additionally, this dataset is publicly available online [19,20].
Table 1 lists the characteristics of the physiological and cardiovascular disease data in the PPG-BP set. An ethics committee at the hospital has reviewed all data to address any privacy concerns. Furthermore, the age distribution of the participants was relatively broad, ensuring a sufficiently representative sample. To avoid fluctuations caused by movement, PPG signals were collected after the subjects had sat quietly for ten minutes. Subsequently, three segments of 2.1 s each were intermittently recorded, and a signal quality index was used to determine whether retesting was necessary. Ultimately, 657 segments of PPG signals were obtained. The CVD data are highly valuable, encompassing four major categories: hypertension, diabetes, cerebral infarction, and cerebrovascular diseases. Using measured blood pressure, hypertension data can be further classified into four categories, as illustrated in Fig. 1: normal, prehypertension, stage 1 hypertension, and stage 2 hypertension. The other four conditions can be classified into two categories: normal and unhealthy.
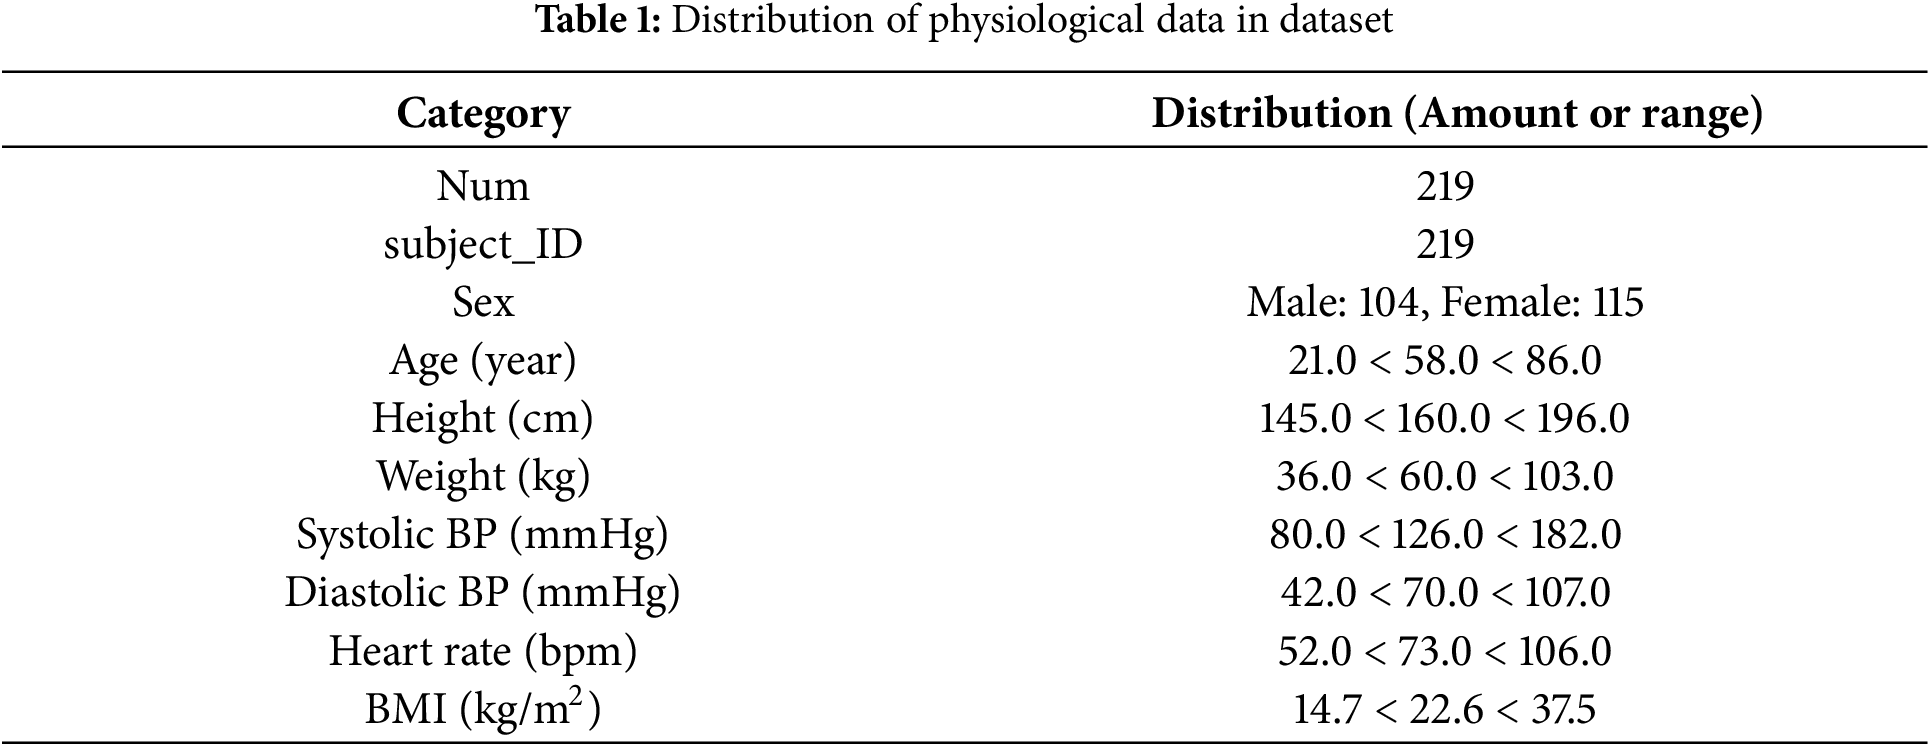
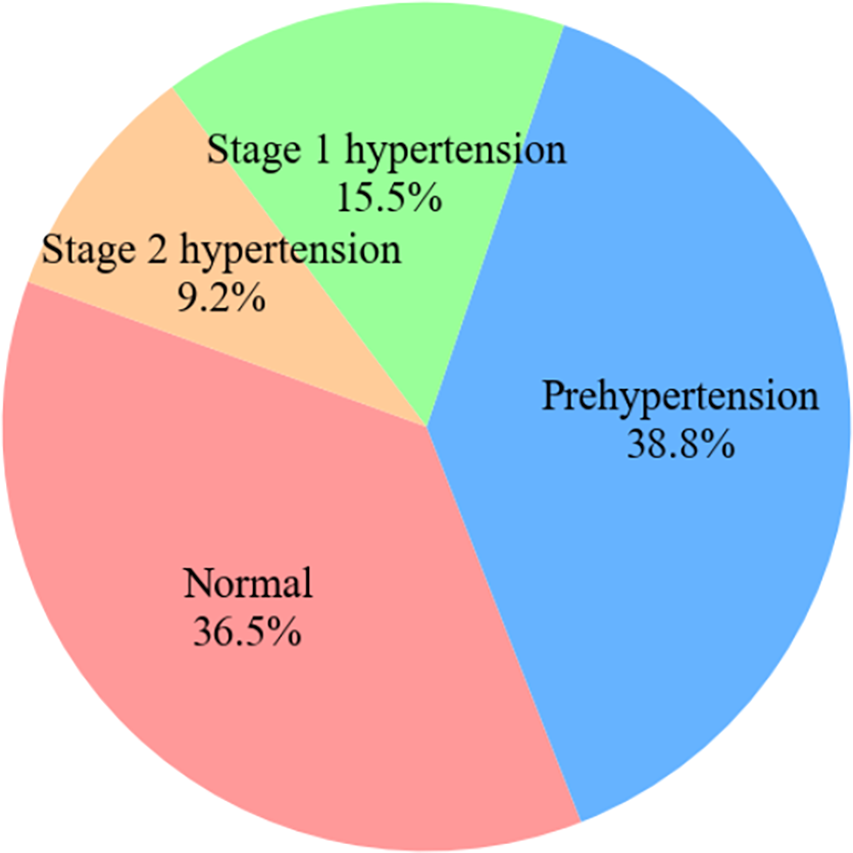
Figure 1: Pie chart of hypertension categories in dataset
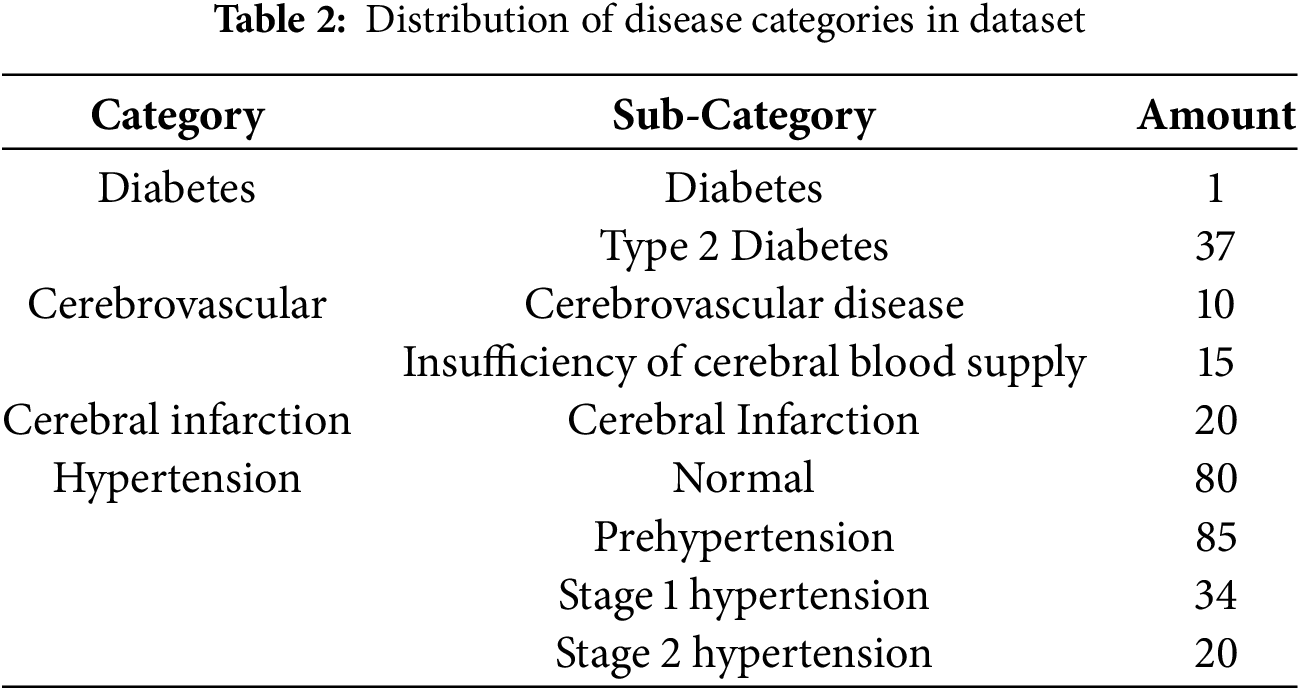
Each of the four disease labels in the dataset was associated with its own subcategories, with samples not exhibiting a particular disease designated as NaN. Table 2 lists the number of subcategories for each of the four diseases. When processing the data, we generally regarded NaN samples as disease-free, as the presence of a disease was indicated otherwise. A further discussion of the processing stage is provided in Section 3.3.
2.2 Multi-Label Classification
It is common for a single sample to be associated with a set of labels, indicating that the sample belongs to multiple categories. For example, in the PPG-BP dataset, one sample may be classified into four cardiovascular disease categories simultaneously. For instance, if a sample is characterized by hypertension and diabetes, but not cerebrovascular disease or cerebral infarction, it is represented as the four-dimensional binary array [1, 1, 0, 0]. The predictions generated by the machine learning model are also output in four-dimensional binary array form. We applied this rule to all samples.
For a label space Y with
The goal of multi-label classification is to find a function
For the test set, each sample will have a predicted label
2.3 Machine Learning Algorithm
Several machine learning methods will be used below to determine the performance of multi-label machine learning classification of cardiovascular diseases.
The decision tree is a machine learning algorithm structured in the form of a tree, consisting of a root node and leaf nodes connected by branches. Decisions are based on the input data, with each decision rule forming a branch that divides the data features into subsets. Each subset is further divided based on prior decisions until the final leaf nodes represent the ultimate prediction outcomes. As the algorithm continually divides the data into subsets, there is a risk of overfitting [23,24].
The random forest can be regarded as an ensemble of multiple decision trees, representing an integrated algorithm that can be applied to both regression and classification problems. A random forest uses the bagging (bootstrap aggregation) model, wherein each decision tree is given different classification options and independently trained to produce an outcome. The final prediction is then determined by majority voting or other methods based on the classification results of each decision tree, selecting the most-voted classification result or identifying the optimal solution to maximize prediction accuracy. Because the random forest generates predictions based on votes across the entire set of decision trees, it mitigates the bias that may occur if any single decision tree is subject to overfitting [23,25].
The extra trees algorithm is an enhanced version of the random forest that operates directly on the original dataset as an alternative to bagging. Furthermore, whereas a random forest follow specific rules when splitting data, the extra trees algorithm uses random splitting. With these improvements, Extra Trees introduces more randomness, leading to improved generalization of the data [23,24].
A Ridge classifier is a machine learning model developed from a Ridge regression model for classification tasks. Ridge regression is used to address regression problems, whereas the Ridge classifier is used to address classification problems. Specifically, this method utilizes the L2 regularization term from Ridge regression to address the problem of multicollinearity among features. The addition of the hyperparameter
where
The k-nearest neighbors (KNN) algorithm is a supervised learning algorithm commonly used to solve classification problems. Essentially, it predicts the class label of a new data point based on the proximity of nearby data points. Thus, a sample is classified as belonging to a particular class in the feature space if the majority of its K nearest neighbors belong to that class as well. For example, given a dataset X and data point
2.4 Evaluation Metrics for Multi-Label Classification
In traditional classification tasks, common evaluation metrics include accuracy, F1-score, receiver operating characteristic (ROC) curve, and area under the curve (AUC). However, because the output of multi-label classification differs from that of multi-class classification by representing a set of multiple items, evaluation metrics for multi-label tasks include conventional metrics as well as those specifically designed for multi-label tasks. According to prior studies, evaluation metrics designed for multi-label classification can be classified into two main categories: sample-based and label-based [21]. Sample-based metrics evaluate the performance of the entire system in a distributed manner, averaging the results based on the number of samples. In contrast, label-based metrics evaluate each label individually and then average the results based on the number of labels. We employed both types of evaluation metrics to assess the classification results in our experiments. Subset accuracy and Hamming loss represent the sample-based metrics, whereas accuracy and F1-score represent the label-based metrics. These evaluation metrics were selected to provide a comprehensive assessment of model performance. In the following subsections, we describe the adopted metrics in terms of a dataset with m samples, where each sample has an independent variable
In single-label classification, accuracy refers to the percentage of predictions that match the true labels. In multi-label classification, subset accuracy is defined as 1 if the predicted labels for a sample exactly match the true labels, and 0 otherwise. The subset accuracy for the entire test set is then calculated by summing all the scores and dividing the result by the total number of samples. This process can be represented as follows:
In multi-label classification, a sample may have more than 10 labels simultaneously, making it difficult for all predicted labels to match the true values. The Hamming loss was introduced to address this challenge by calculating the proportion of incorrect labels for each sample:
In binary classification tasks, it is often necessary to calculate a confusion matrix. Based on the confusion matrix, prediction results can be categorized into four types: True Positive (TP), where the actual value is true, and the prediction is also true; False Positive (FP), where the actual value is false, but the prediction is true; True Negative (TN), where the actual value is true, but the prediction is false; and False Negative (FN), where the actual value is false, and the prediction is also false.
Accuracy represents the proportion of TPs among all predicted results. In contrast, the F1 score
Based on the definition of the F1-score, can then be expressed as follows:
The F1-score approaches 1 only when both precision and recall are high. Because precision and recall better represent a model’s performance in the context of imbalanced data than accuracy, the F1-score is highly regarded. The ROC evaluation metric is a curve representing the ratio between the FR rate (FPR) and the TP rate (TPR), with the corresponding AUC also being an important indicator.
3 Experimental Process and Result Analysis
Our experimental process is illustrated in Fig. 2. First, the dataset was divided into two subsets for processing. The first subset of 657 PPG signals underwent preprocessing, where the data were transformed into multiple statistical features, while the remaining subset of 219 physiological features was filtered. PPG signals were then concatenated with the corresponding physiological features, resulting in 657 combined data entries for early fusion. Subsequently, six machine learning algorithms were applied in sequence to evaluate multi-label classification performance.
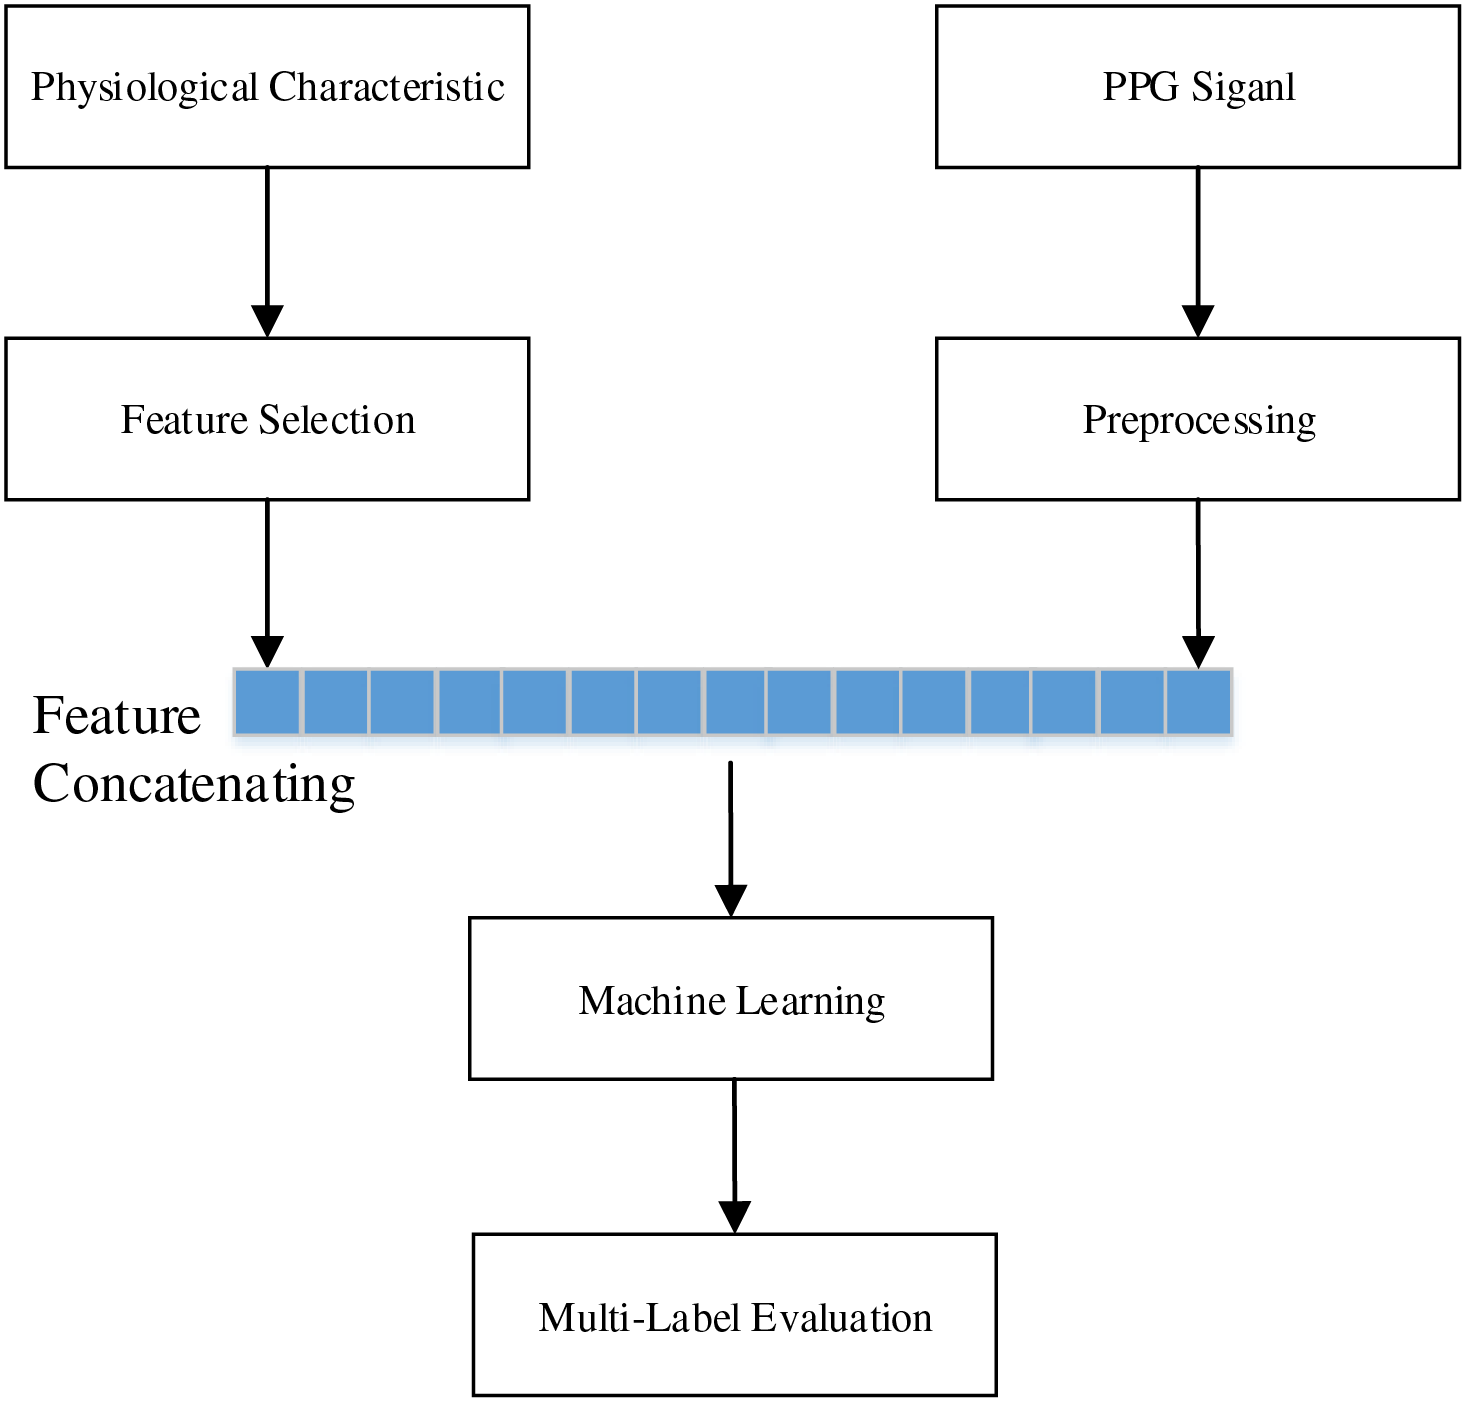
Figure 2: Experimental process flowchart
PPG is an imaging method based on the detection of subtle light variations caused by blood vessels. The measurement process is highly vulnerable to noise, with factors such as ambient light and motion artifacts frequently affecting the waveform. Motion artifacts occur due to movement during recording or subject movement, resulting in severe and irregular amplitude fluctuations in the waveform [27]. This creates significant challenges when converting the data into statistical features, necessitating techniques to suppress motion artifacts. As previous studies have shown that the Savitzky-Golay (S-G) filter effectively addresses motion artifact issues [28], we adopted the same approach in this study. The S-G filter, proposed by Savitzky and Golay in 1964, is a filtering tool that can simultaneously denoise and smooth signals [29]. The filter’s core function is to find a polynomial solution based on the signal’s sampling points
By minimizing the mean squared approximation error
Because this method can correct the offset caused by motion artifacts in PPG signals and thereby enhance classification accuracy, we applied this processing to each PPG signal segment.
Many algorithms are highly sensitive to the range of data, making the process of standardization crucial to suitably adjust features for algorithms. Z-score standardization ensures that the data follow a standard normal distribution with a mean of 0 and standard deviation of 1. This can be understood simply as using the standard deviation as a unit to measure the distance of a value from the group mean. Z-score standardization can be expressed as follows:
where
We first processed the PPG signals using the S-G filter to eliminate noise and subsequently converted the signals into seven statistical features, including standard deviation, variance, and skewness. For physiological characteristics, we selected features based on their practical relevance. Our objective is to facilitate disease classification using only the patient’s PPG data, along with physiological features such as height, weight, and age, which can be obtained through telemedicine or wearable PPG devices. Therefore, we excluded diastolic blood pressure (DBP), systolic blood pressure (SBP), and heart rate. The final selected features were gender, age, height, weight, and body mass index (BMI). To ensure representativeness of the performance metrics, all six machine learning algorithms were evaluated using five-fold cross-validation. Predictions were handled separately for four- and six-label classification, and we compared the results with those of prior studies using the same dataset.
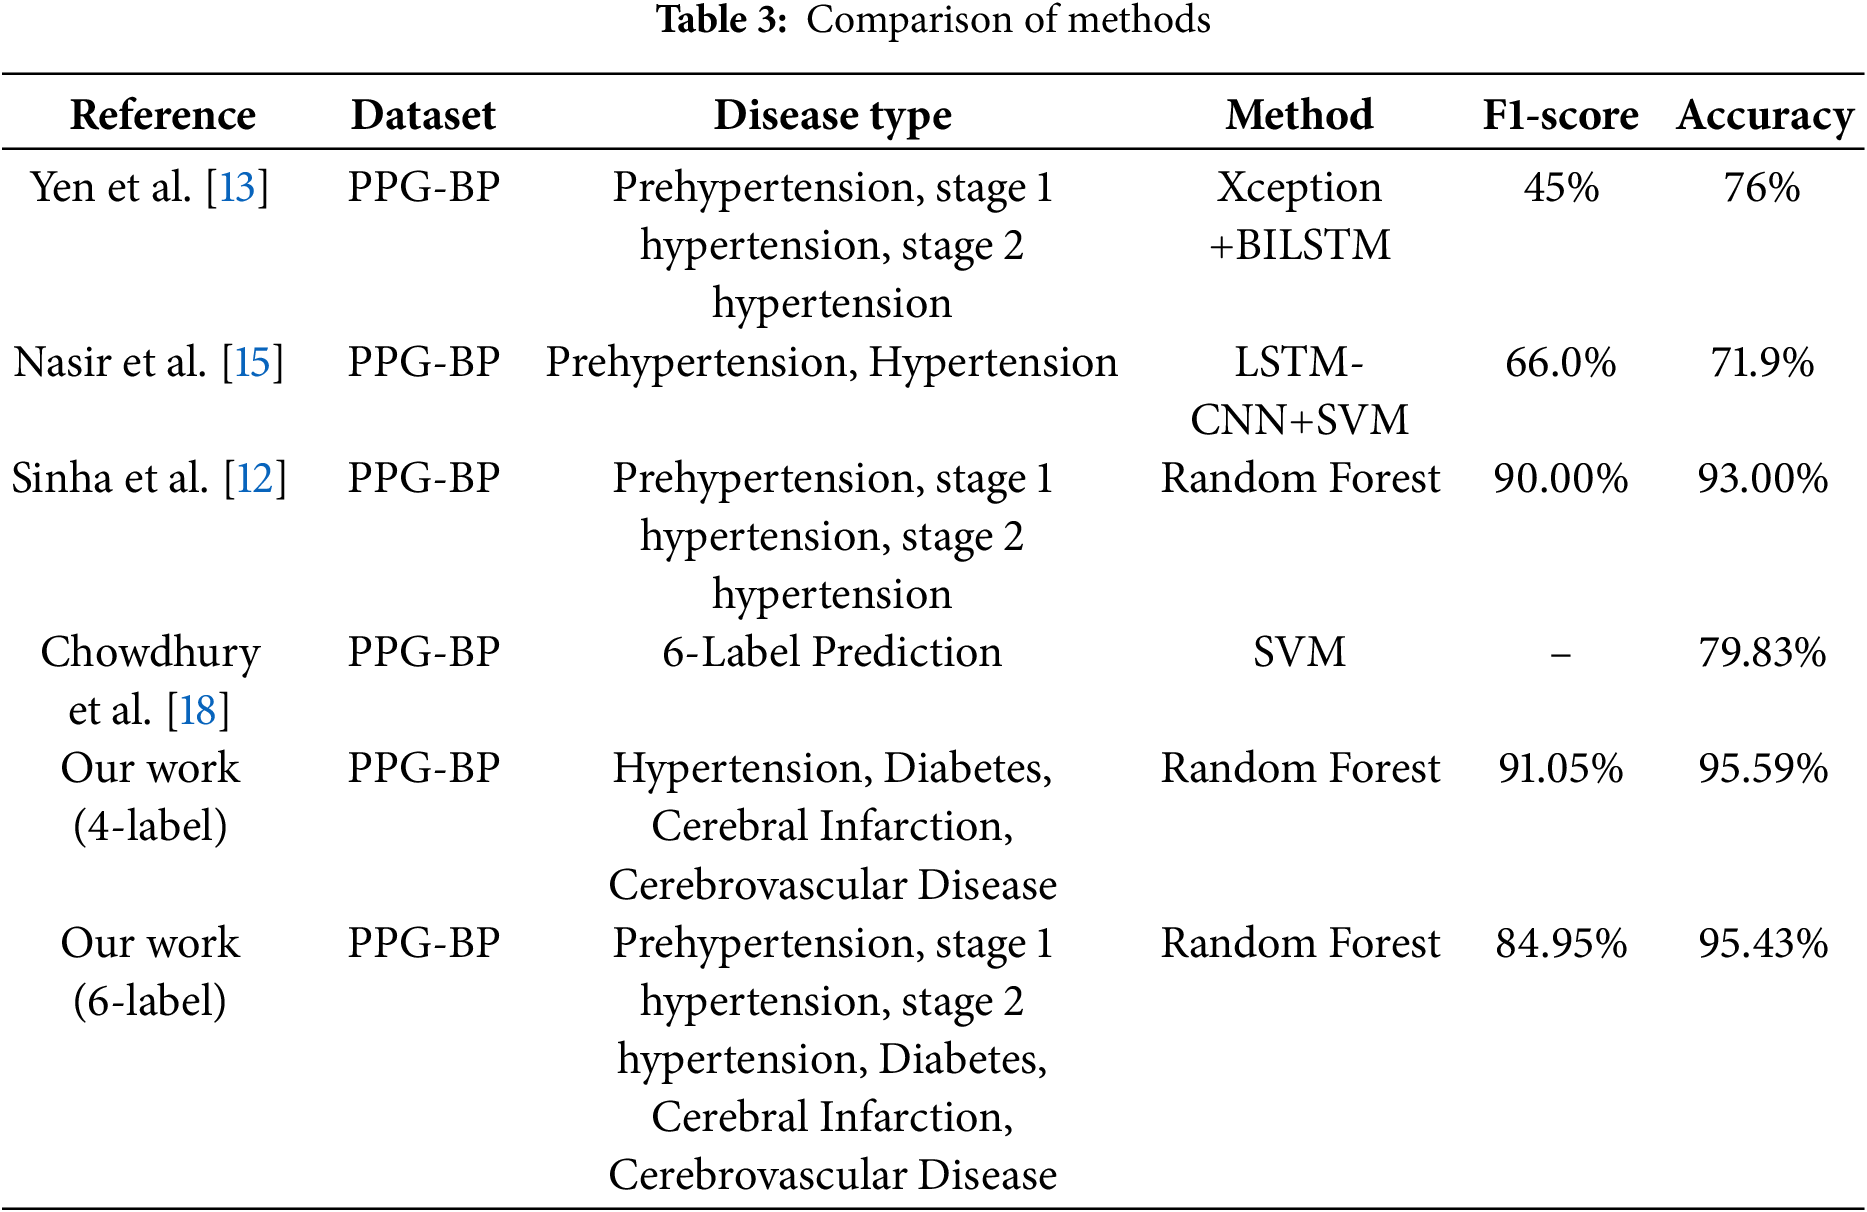
Because the experimental dataset does not contain related research on multi-label classification, we focused primarily on prior studies that compare multi-class classification to multi-label classification as shown in Table 3. Both multi-class and multi-label classification are based on binary classification. In multi-class classification, only one class is predicted among multiple categories, whereas in multi-label classification, each category is treated as a binary classification task, resulting in predictions that can include zero or multiple labels. Both multi-label and multi-class classification aim to broaden the scope of classification and thereby enhance research value. However, as the number of predicted labels increases, the difficulty of both tasks also increases.
Given the same number of predicted categories, multi-label classification is more challenging and practical than multi-class classification. For example, the probability of correctly guessing one out of six categories is 1/6, whereas the probability of correctly predicting all six labels is 1/26, or 1/64. Therefore, in addition to using the conventional evaluation metrics of accuracy and F1-score, we adopted the Hamming loss and subset accuracy as metrics specifically designed for multi-label tasks, allowing us to assess predictive performance from different perspectives. The ROC and AUC measures were also used to evaluate classification performance at different thresholds, as well as overall classification quality. Because our task involved classifying different labels, multiple ROCs and corresponding AUC scores were generated.
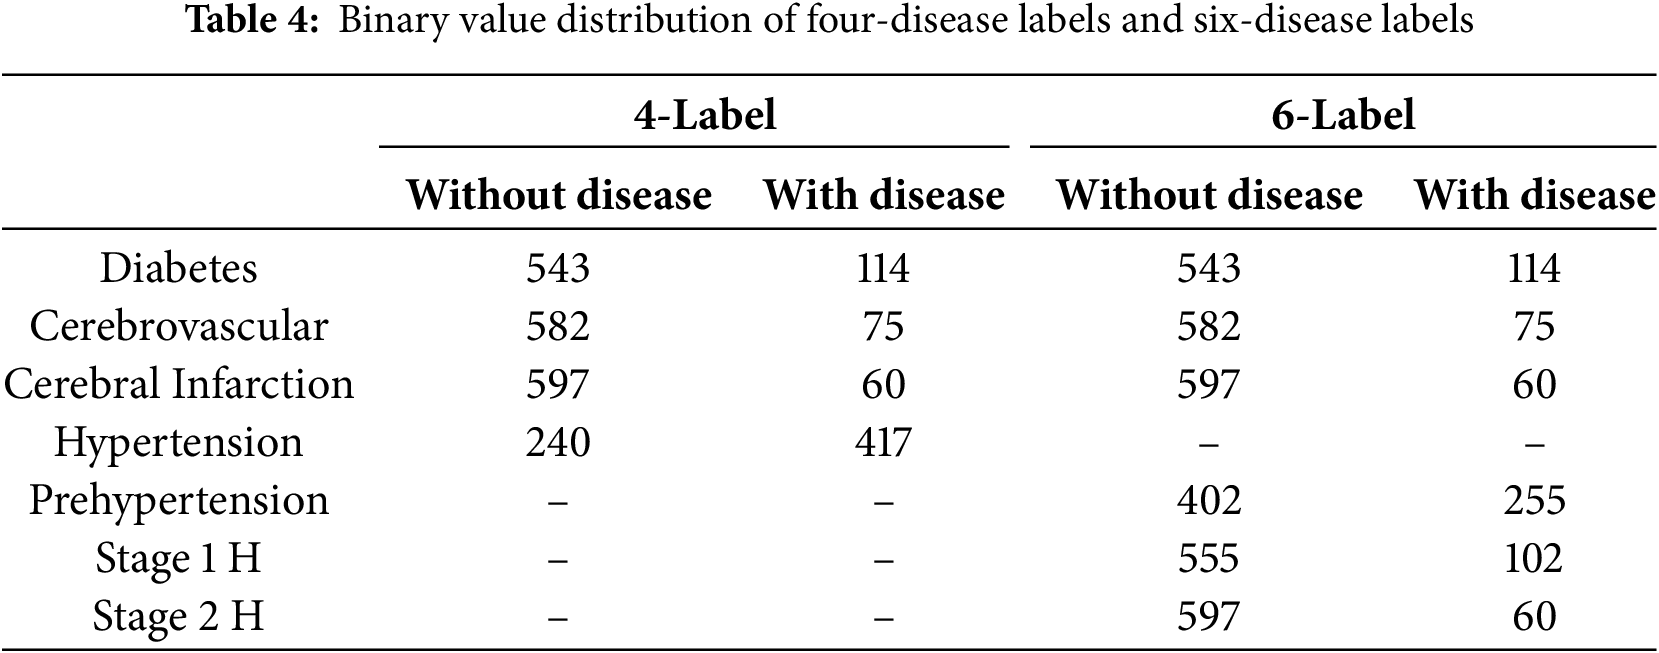
Four- and Six-Labels Prediction
In the dataset, hypertension was further divided into four categories: normal blood pressure, prehypertension, stage 1 hypertension, and stage 2 hypertension. In the four-label prediction task, we classified samples with “prehypertension,” “stage 1 hypertension,” and “stage 2 hypertension” as exhibiting hypertension, whereas those labeled as “normal blood pressure” were classified as not having hypertension. This approach allows the four-label prediction task to focus on predicting the presence of hypertension, diabetes, cerebral infarction, and cerebrovascular disease. The number of labels for each disease is listed in Table 4. As previously mentioned, the four-label prediction somewhat simplifies the study objective. The six-label prediction further divides the hypertension label into three disease labels: prehypertension, stage 1 hypertension, and stage 2 hypertension. The number of each of these labels is listed in Table 4, where “Pre-H” represents prehypertension while “Stage 1 H” and “Stage 2 H” correspond to stages 1 and 2 hypertension, respectively.
3.4 Experimental Results and Analysis
In our comparative experiment, we primarily focused on multi-class classification research that closely resembles our multi-label classification approach, using accuracy and F1-score as the main metrics. Some studies utilized deep learning techniques [13,15] whereas others specifically predicted certain combinations of diseases [18]. Compared to other machine learning studies of the same type, some have converted PPG signals into time and frequency domain values with multiple physiological information to categorize different periods of hypertension and achieved 95% accuracy using random forests [12], while others have converted PPG into nine statistics with two physiological information to categorize different combinations of disease occurrences and achieved 79% accuracy using support vector machines. The accuracy of 79% was achieved using support vector machine [18]. Meanwhile, we used six statistical values with four physiological information to categorize the occurrence of each disease using a multi-label classification method, achieving 95% accuracy using random forests. As shown in Table 3, when compared with popular existing multi-class classification methods using the same dataset, our method achieved the highest results using the random forest algorithm in the four-label prediction task, with an accuracy of 95.59% and F1-score of 91.05%. In the six-label prediction task, our random forest algorithm also outperformed the baselines, achieving an accuracy of 95.43% and F1-score of 84.95%.
Regarding evaluation metrics tailored for multi-label classification tasks, the random forest algorithm exhibited the lowest Hamming loss in the four-label classification experiment, achieving values of 0.0441 and 0.0449 with and without data standardization, respectively, as presented in Tables 5 and 6. These findings suggest that data standardization does not inherently guarantee superior model performance. In the six-label classification task, as shown in Table 7, the random forest algorithm also achieved the lowest Hamming loss of 0.0457 along with a subset accuracy of 80.37%. Our six-label classification task involved the prediction of six different diseases, the most among all the studies selected for comparison [18]. However, multi-label classification is inherently more challenging than multi-class classification because it requires binary decisions for each label.
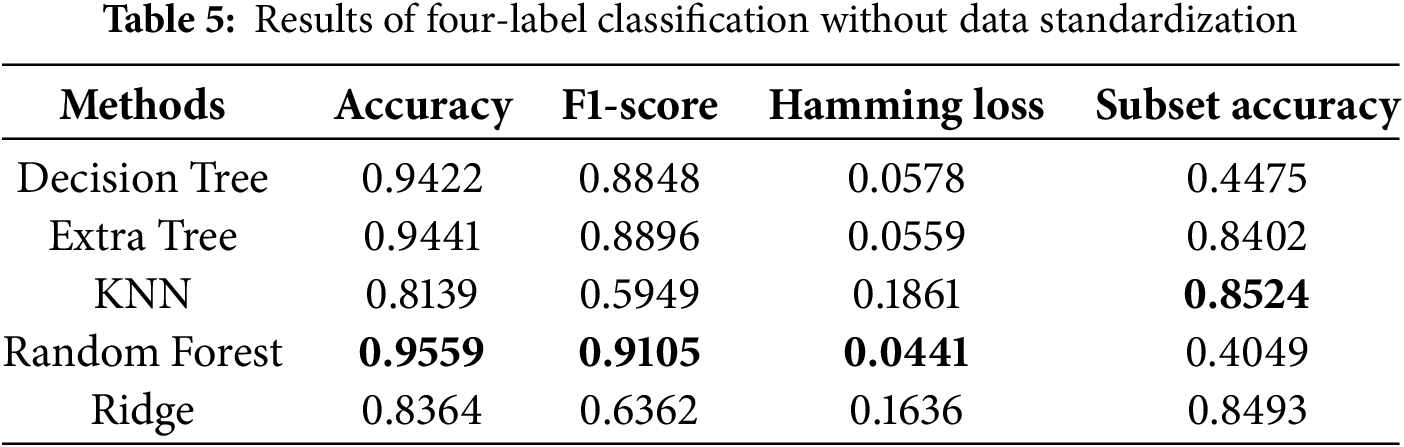
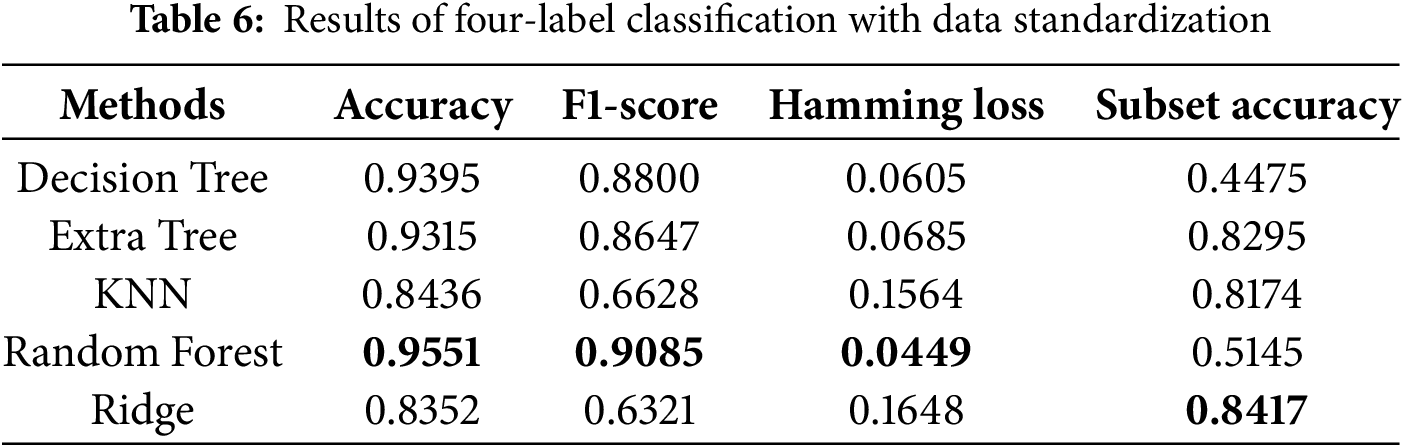
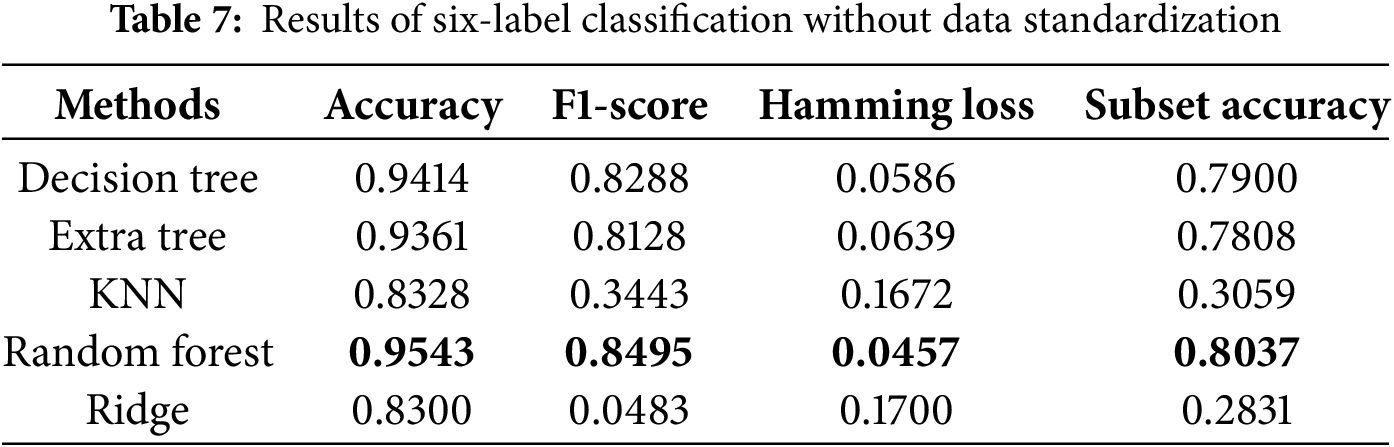
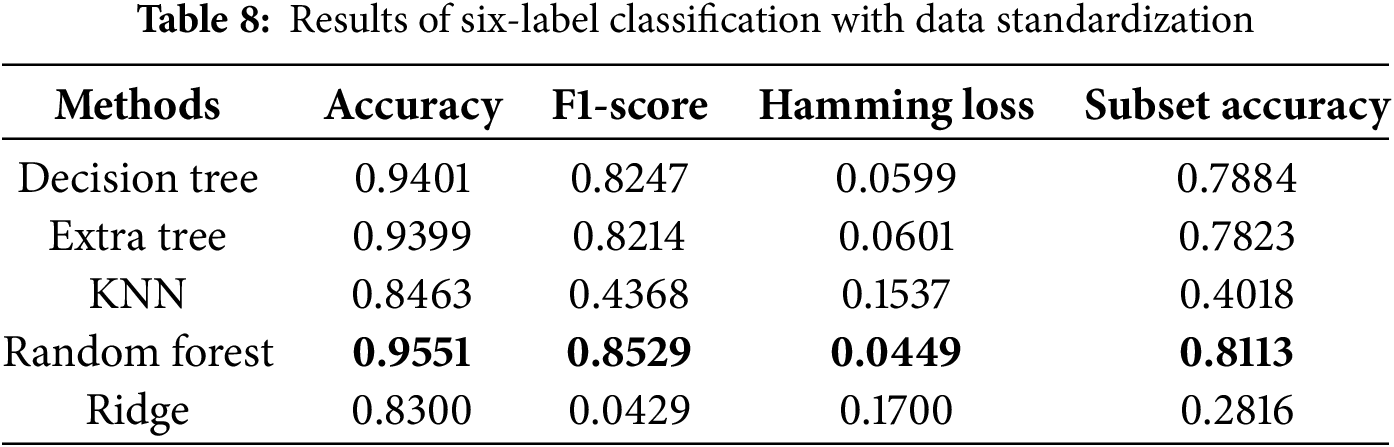
We also conducted ablation studies to determine the impact of preliminary data standardization on predictive performance. As shown in Tables 6 and 8, we found that standardization only improved performance in the KNN algorithm. The lack of improvement for the other algorithms may be attributed to the fact that standardization narrows the data range, which has little effect on tree-based algorithms. Specifically, tree-based methods are not sensitive to data distribution, whereas KNN relies on calculating Euclidean distances between data points, making standardization more effective. These reasons led us to use the results obtained without standardization as the final scores. The bolded entries in Tables 5–8 indicate the best-performing algorithm. In this study, the random forest algorithm demonstrated superior robustness across multi-label classification tasks.
This study explored both four-label and six-label disease classification. To better understand the prediction outcomes, the ROCs for both classification tasks are shown in Figs. 3 and 4. With the same FP rate, a higher TP rate indicates better predictive performance, making AUC a natural evaluation metric. The average AUC for four-label classification was 97.75%, with hypertension at 98%, diabetes at 97%, and both cerebral infarction and cerebrovascular diseases at 98%. The average AUC for six-label classification was 97.83%, with diabetes at 97%, cerebral infarction at 97%, cerebrovascular diseases at 98%, prehypertension at 98%, and stage 1 and stage 2 hypertension at 99% and 98%, respectively. In both four- and six-label classification, the standard deviation of AUC for each label was within 1% to 2%, indicating consistently high classification performance. Combined with the previously discussed accuracy, F1-score, subset accuracy, and Hamming loss measures, these results provide a comprehensive understanding of multi-label classification for cardiovascular diseases using PPG signals and physiological characteristics.
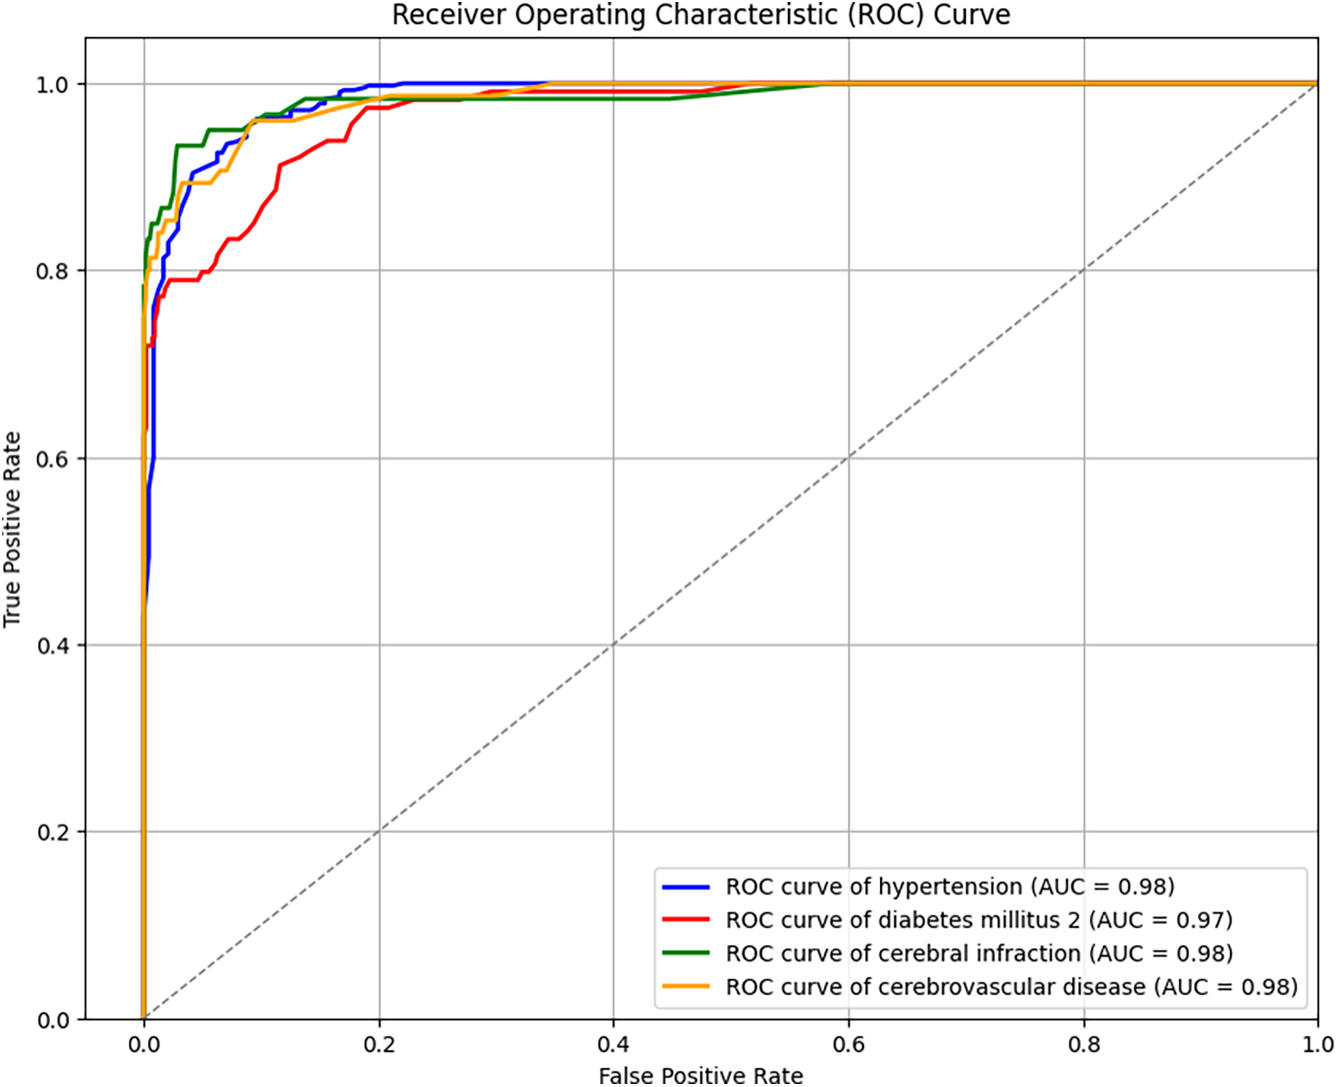
Figure 3: ROC curves for four-label prediction
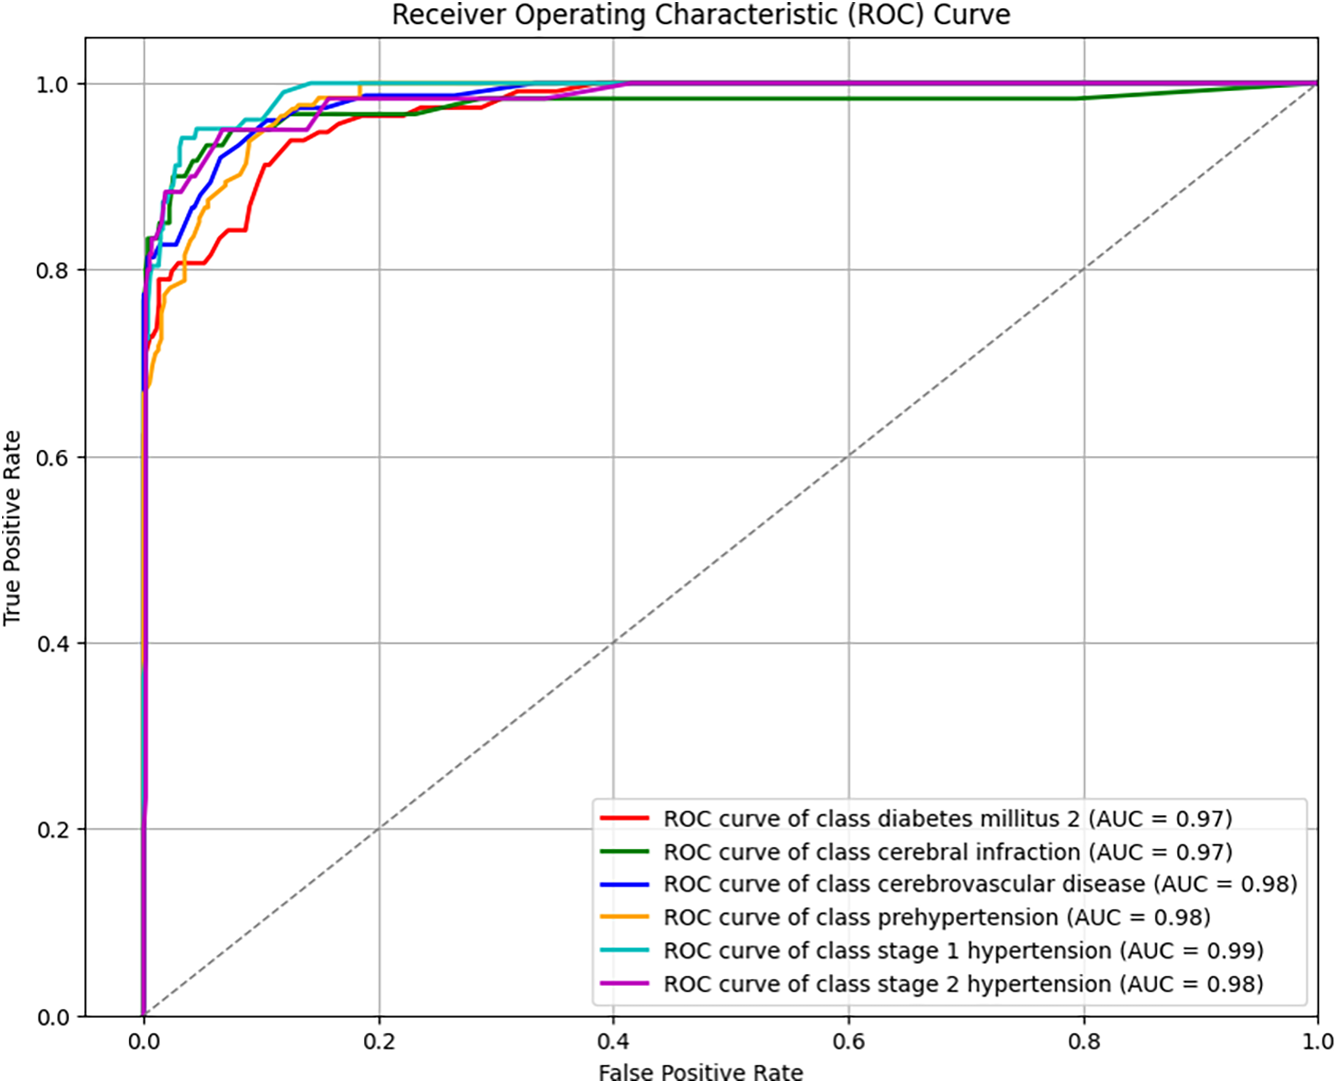
Figure 4: ROC curves for six-label prediction
The conclusions of the referenced studies [30,31] indicate that imbalanced labels should be examined using various evaluation methods, and employing multiple types of evaluation metrics is crucial. Specifically, reference [31] provides an experimental workflow that outlines appropriate evaluation metrics for analyzing imbalanced datasets. As the level of imbalance increases, relying on a single metric may yield seemingly perfect results while leading to significantly poor performance from another evaluation perspective. For instance, in the case of binary classification with a highly imbalanced dataset, a high TN rate and a low TP rate may result in high Accuracy but a low F1-score. This discrepancy underscores the limitations of relying on a single evaluation metric. To address this issue, our study incorporates multiple evaluation metrics, such as Subset Accuracy (which requires complete label matching), Accuracy (which allows partial correctness), and F1-score (which is more sensitive to positive samples), thereby providing a more comprehensive performance assessment from different perspectives.
In addition, we performed a feature importance ranking for the Random Forest algorithm in Fig. 5, where the ranking was determined by the Gini impurity, weighted by the probability of reaching the node. The importance values are normalized to sum to one, facilitating the interpretation of each feature’s relative contribution within the model. The analysis revealed that age, BMI, and the mean value of the PPG signal were the three most influential features. This finding not only validates the efficacy of our approach in converting the PPG signal into a representative statistical feature but, more importantly, aligns with existing research [2] indicating the significant impact of BMI on various diseases. Furthermore, consistent with established knowledge, unhealthy lifestyle habits, particularly those resulting in overweight and obesity, are identified as major contributors to cardiovascular diseases (CVDs). These results underscore the importance of public health initiatives promoting awareness of BMI and overall physical well-being.
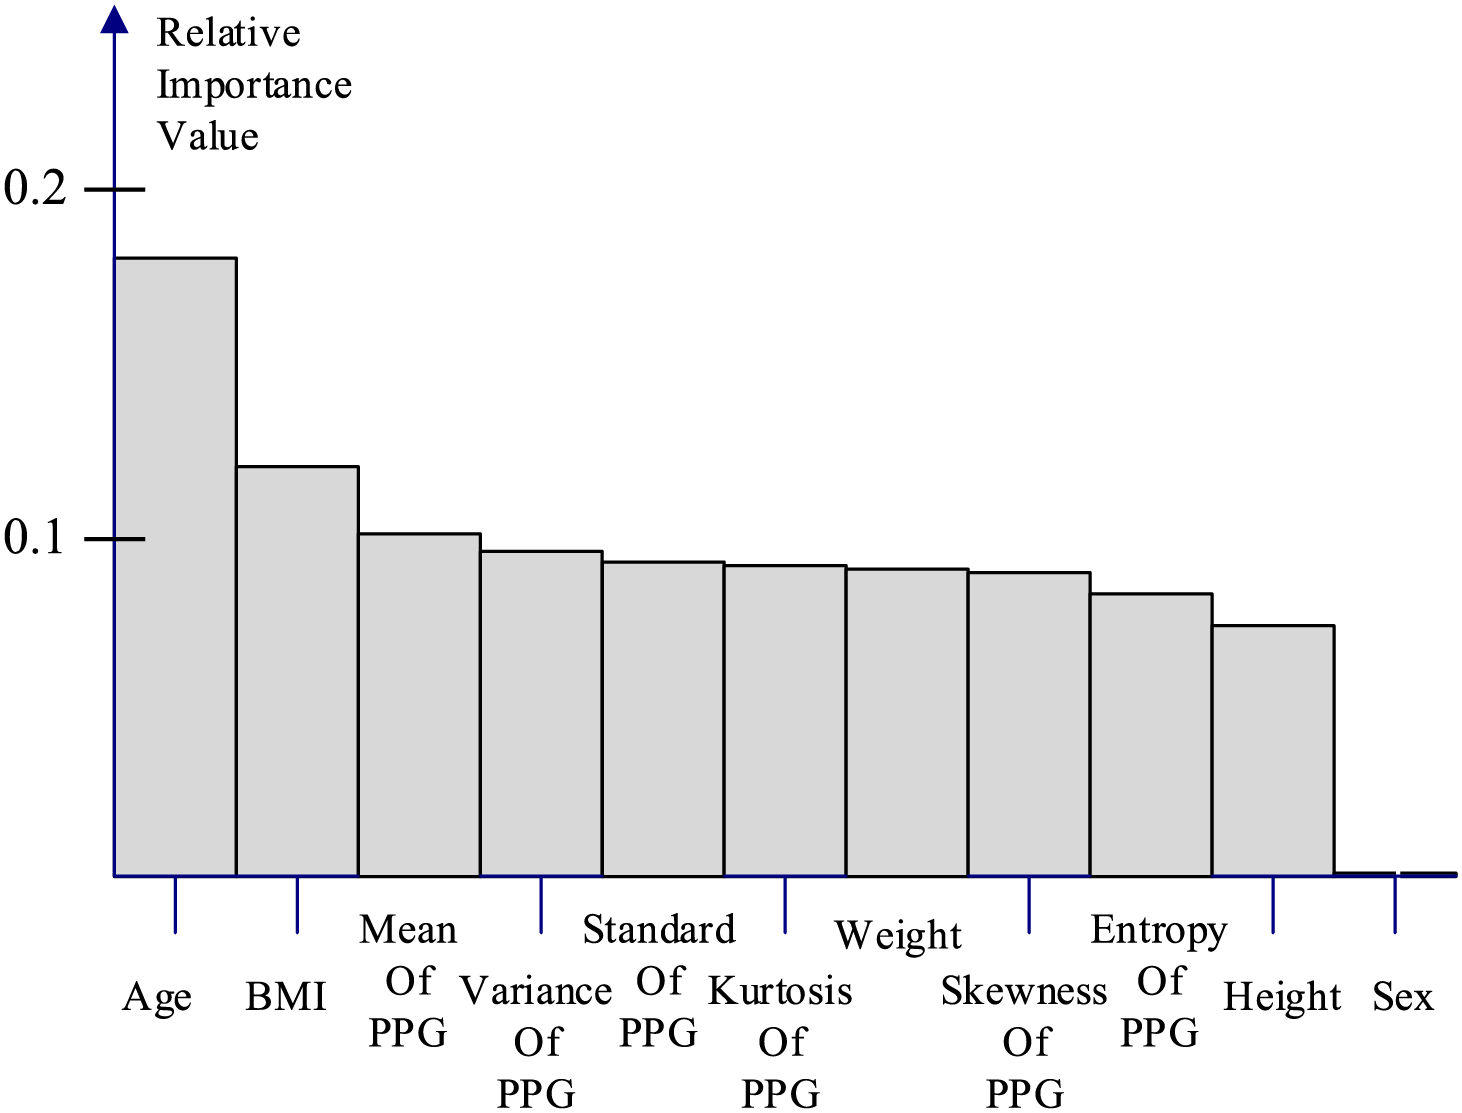
Figure 5: Relative feature importance of random forest algorithm
In our comparative experiments, due to the limited availability of similar studies on multi-label classification, we primarily reference existing research on multi-class classification, as it closely aligns with our approach. Accuracy and F1-score are used as the primary evaluation metrics. The comparison table includes both deep learning techniques and traditional machine learning methods. Overall, our multi-label classification approach outperforms all multi-class classification methods in terms of F1-score and accuracy, even when utilizing the same machine learning models. This improvement is primarily due to the binary relevance strategy in multi-label classification, which independently predicts each label, allowing for more flexible and accurate modeling. Additionally, a key observation is the significant performance variation between machine learning and deep learning models on the PPG-BP dataset. In general, machine learning models demonstrate superior performance, which may be attributed to the dataset’s sample size. As noted in reference [8], deep learning methods often exhibit reduced robustness compared to traditional machine learning techniques when trained on small datasets. Moreover, Table 3 shows that the F1-score is significantly affected by the number of classification labels. This is because changing from four to six labels splits the hypertension label into three distinct categories, leading to a more pronounced data imbalance and, consequently, a substantial decrease in the F1-score.
CVDs pose a significant health risk on a global scale. The WHO has demonstrated that the regular monitoring and management of hypertension, one of the primary causes of CVDs, can effectively prevent these conditions. Although this is a positive development, there are other factors that contribute to CVDs in addition to hypertension. The present study was conducted to facilitate the management of CVDs by using six different machine learning algorithms to predict risk factors and diseases using PPG signals and physiological characteristics. Using accuracy and F1-score, we compared the results of four- and six-label disease prediction with those from other studies. Our random forest algorithm outperformed the baseline methods with an accuracy of 95.59% and F1-score of 91.05% for four-label classification. Furthermore, we utilized common multi-label metrics including the Hamming loss, ROC, and AUC to obtain a more comprehensive and accurate understanding of multi-label CVD prediction. We use a variety of evaluation metrics to comprehensively assess model performance on imbalanced datasets, in order to avoid misleading results from relying on a single metric. With multi-label classification, we will be able to predict CVDs and their risk factors for a broader range of samples in the future without being limited to specific combinations. This objective represents the focus of our future work. Although multi-label classification may sacrifice a degree of accuracy in exchange for convenience, it is more than sufficient as a simple self-assessment tool for detecting potential problems at an early stage.
Acknowledgement: We thank for supporting of the National Science and Technology Council (NSTC) and the National Taiwan University of Science and Technology. And we also thank for editor kind coordination. Moreover, we are grateful the editor and reviewers for constructive suggestions.
Funding Statement: We thank for supporting of the National Science and Technology Council NSTC (grant nos. NSTC 112-2221-E-019-023, NSTC 113-2221-E-019-039) and the National Taiwan University of Science and Technology.
Author Contributions: Conceptualization, Chih-Ta Yen; methodology, Chih-Ta Yen; software, Chih-Ta Yen, Jung-Ren Wong and Chia-Hsang Chang; validation, Chih-Ta Yen, Jung-Ren Wong and Chia-Hsang Chang; formal analysis, Chih-Ta Yen; investigation, Chih-Ta Yen, Jung-Ren Wong and Chia-Hsang Chang; resources, Chih-Ta Yen; data curation, Chih-Ta Yen; writing—original draft preparation, Chih-Ta Yen, Jung-Ren Wong and Chia-Hsang Chang; writing—review and editing, Chih-Ta Yen; visualization, Chih-Ta Yen; supervision, Chih-Ta Yen; project administration, Chih-Ta Yen; funding acquisition, Chih-Ta Yen. All authors reviewed the results and approved the final version of the manuscript.
Availability of Data and Materials: The datasets generated or analysed during the current study are available in the “Figshare” at https://figshare.com/articles/dataset/PPG-BP_Database_zip/5459299 (accessed on 23 April 2025).
Ethics Approval: This study involved human subjects and received ethical approval from the Ethics Committee of Guilin People’s Hospital and Guilin University of Electronic Technology. All procedures involving human participants were conducted in accordance with institutional guidelines and the Declaration of Helsinki. The data collection process followed strict protocols to ensure privacy and data protection.
Conflicts of Interest: The authors declare no conflicts of interest to report regarding the present study.
References
1. World Health Organization. Summary status of the health-related SDGs and GPW 13 indicators. In: World health statistics 2023: monitoring health for the SDGs, sustainable development goals. Geneva, Switzerland: World Health Organization; 2023. [Google Scholar]
2. World Health Organization. Cardiovascular diseases (CVDs) [Internet]. WHO.int. 2021 [cited 2025 Apr 23]. Available from: https://www.who.int/news-room/fact-sheets/detail/cardiovascular-diseases-(cvds). [Google Scholar]
3. Makram OM, Nain P, Vasbinder A, Weintraub NL, Guha A. Cardiovascular risk assessment and prevention in cardio-oncology: beyond traditional risk factors. Cardiol Clin. 2025;43(1):1–11. doi:10.1016/j.ccl.2024.08.003. [Google Scholar] [PubMed] [CrossRef]
4. He Y, Zhang X, Mei Y, Deng Q, Zhang X, Chen Y, et al. Construction of a machine learning-based prediction model for unfavorable discharge outcomes in patients with ischemic stroke. Heliyon. 2024;10(17):e37179. doi:10.1016/j.heliyon.2024.e37179. [Google Scholar] [PubMed] [CrossRef]
5. Nour M, Polat K. Automatic classification of hypertension types based on personal features by machine learning algorithms. Math Probl Eng. 2020;2020(28):1–13. doi:10.1155/2020/2742781. [Google Scholar] [CrossRef]
6. Barsasella D, Bah K, Mishra P, Uddin M, Dhar E, Suryani DL, et al. A machine learning model to predict length of stay and mortality among diabetes and hypertension inpatients. Medicina. 2022;58(11):1568. doi:10.3390/medicina58111568. [Google Scholar] [PubMed] [CrossRef]
7. Groenewegen A, Zwartkruis VW, Rienstra M, Hollander M, Koffijberg H, Cramer MJM, et al. Improving early diagnosis of cardiovascular disease in patients with type 2 diabetes and COPD: protocol of the RED-CVD cluster randomised diagnostic trial. BMJ Open. 2021;11(10):e046330. doi:10.1136/bmjopen-2020-046330. [Google Scholar] [PubMed] [CrossRef]
8. Raza S. A machine learning model for predicting, diagnosing, and mitigating health disparities in hospital readmission. Health Anal. 2022;2(80):100100. doi:10.1016/j.health.2022.100100. [Google Scholar] [CrossRef]
9. Mohsen S. Hybrid energy harvester for medical sensor node toward real-time healthcare monitoring. Proc Eng Technol Innovat. 2021;18:43–8. doi:10.46604/peti.2021.7002. [Google Scholar] [CrossRef]
10. Hussain A, Malik H, Chaudhry MU. Supervised learning based classification of cardiovascular diseases. Proc Eng Technol Innovat. 2021;20:24–34. doi:10.46604/peti.2021.7217. [Google Scholar] [CrossRef]
11. Sadad T, Bukhari SAC, Munir A, Ghani A, El-Sherbeeny AM, Rauf HT. Detection of cardiovascular disease based on PPG signals using machine learning with cloud computing. Comput Intell Neurosci. 2022;2022:1–11. doi:10.1155/2022/1672677. [Google Scholar] [PubMed] [CrossRef]
12. Sinha N, Joshi A. iHyptn: predicting hypertension using PPG signal for cardiovascular disease with machine learning models. In: TENCON 2023-2023 IEEE Region 10 Conference (TENCON); 2023 31 Oct 31–Nov 3; Chiang Mai, Thailand. p. 908–13. doi:10.1109/TENCON58879.2023.10322322. [Google Scholar] [CrossRef]
13. Yen C-T, Chang S-N, Liao C-H. Deep learning algorithm evaluation of hypertension classification in less photoplethysmography signals conditions. Meas Control. 2021;54(3-4):002029402110019. doi:10.1177/00202940211001904. [Google Scholar] [CrossRef]
14. Martinez-Rios E, Montesinos L, Alfaro-Ponce M. A machine learning approach for hypertension detection based on photoplethysmography and clinical data. Comput Biol Med. 2022;145(2):105479. doi:10.1016/j.compbiomed.2022.105479. [Google Scholar] [PubMed] [CrossRef]
15. Nasir N, Sameer M, Barneih F, Alshaltone O, Ahmed M. Deep learning classification of photoplethysmogram signal for hypertension levels. arXiv:2405.14556. 2024. [Google Scholar]
16. Gupta S, Singh A, Sharma A, Tripathy RK, Tripathy BK. dSVRI: a PPG-based novel feature for early diagnosis of type-II diabetes mellitus. IEEE Sens Lett. 2022;6(9):1–4. doi:10.1109/LSENS.2022.3203609. [Google Scholar] [CrossRef]
17. Ko KW, Lee S. Biosignal-based multimodal biometric system. Adv Technol Innovat. 2016;2(3):89–94. [Google Scholar]
18. Chowdhury A, Das D, Hasan K, Cheung RCC, Chowdhury MH. An FPGA implementation of multiclass disease detection from PPG. IEEE Sens Lett. 2023;7(11):1–4. doi:10.1109/LSENS.2023.3322288. [Google Scholar] [CrossRef]
19. Liang Y, Chen Z, Liu G, Elgendi M. A new, short-recorded photoplethysmogram dataset for blood pressure monitoring in China. Sci Data. 2018;5(1):180020. doi:10.1038/sdata.2018.20. [Google Scholar] [PubMed] [CrossRef]
20. Liang Y, Liu G, Chen Z, Elgendi M. PPG-BP Database [Internet]. Figshare. 2018. [cited 2025 Apr 23]. Available from: https://figshare.com/articles/dataset/PPG-BP_Database_zip/5459299. [Google Scholar]
21. Zhang ML, Zhou ZH. A review on multi-label learning algorithms. IEEE Trans Knowl Data Eng. 2014;26(8):1819–37. doi:10.1109/TKDE.2013.39. [Google Scholar] [CrossRef]
22. Zhang M-L, Li Y-K, Liu X-Y, Geng X. Binary relevance for multi-label learning: an overview. Front Comput Sci. 2018;12(2):191–202. doi:10.1007/s11704-017-7031-7. [Google Scholar] [CrossRef]
23. Aldossary Y, Ebrahim M, Hewahi NM. A comparative study of heart disease prediction using tree-based ensemble classification techniques. In: 2022 International Conference on Data Analytics for Business and Industry (ICDABI); 2022 Oct 25–26; Online. p. 353–7. doi:10.1109/ICDABI56818.2022.10041488. [Google Scholar] [CrossRef]
24. Champa AI, Rabbi MF, Mahedy Hasan SM, Zaman A, Kabir MH. Tree-Based classifier for hyperspectral image classification via hybrid technique of feature reduction. In: 2021 International Conference on Information and Communication Technology for Sustainable Development (ICICT4SD); 2021 Feb 27–28; Dhaka, Bangladesh. p. 115–9. [Google Scholar]
25. Ali J, Khan R, Ahmad N, Maqsood I. Random forests and decision trees. Int J Comput Sci Issues (IJCSI). 2012;9(3):272–8. [Google Scholar]
26. Peng C, Cheng QS. Discriminative ridge machine: a classifier for high-dimensional data or imbalanced data. IEEE Trans Neural Netw Learn Syst. 2021;32(6):2595–609. doi:10.1109/TNNLS.2020.3006877. [Google Scholar] [PubMed] [CrossRef]
27. Pollreisz D, TaheriNejad N. Detection and removal of motion artifacts in PPG signals. Mobile Netw Appl. 2019;27(2):728–38. doi:10.1007/s11036-019-01323-6. [Google Scholar] [CrossRef]
28. Siam A, Sedik A, El-Shafai W, Elazm AA, El-Bahnasawy NA, El Banby GM, et al. Bio-Signal classification for human identification based on convolutional neural networks. Int J Commun Syst. 2021;34(7):e4685. doi:10.1002/dac.4685. [Google Scholar] [CrossRef]
29. Savitzky A, Golay MJE. Smoothing and differentiation of data by simplified least squares procedures. Anal Chem. 1964;36(8):1627–39. doi:10.1021/ac60214a047. [Google Scholar] [CrossRef]
30. Gaudreault J-G, Branco P, Gama J. An analysis of performance metrics for imbalanced classification. In: Discovery Science (DS 2021). Cham, Switzerlan: Springer; 2021. p. 67–77. [Google Scholar]
31. Gaudreault J-G, Branco P. Empirical analysis of performance assessment for imbalanced classification. Mach Learn. 2024;113(8):1–43. doi:10.1007/s10994-023-06497-5. [Google Scholar] [CrossRef]
Cite This Article
 Copyright © 2025 The Author(s). Published by Tech Science Press.
This work is licensed under a Creative Commons Attribution 4.0 International License , which permits unrestricted use, distribution, and reproduction in any medium, provided the original work is properly cited.
 Downloads
 Citation Tools