
 Submit a Paper
 Propose a Special lssue
 Open Access
ARTICLE
FSFS: A Novel Statistical Approach for Fair and Trustworthy Impactful Feature Selection in Artificial Intelligence Models
1 Department of Computer Engineering, Ankara University, Ankara, 06830, Trkiye
2 Center for Theoretical Physics, Khazar University, Baku, Az1096, Azerbaijan
3 Department of Cyber Security, Taibah University, Medina, 42353, Saudi Arabia
4 Department of Artificial Intelligence, Ankara University, Ankara, 06830, Trkiye
* Corresponding Author: Ali Hamid Farea. Email:
Computers, Materials & Continua 2025, 84(1), 1457-1484. https://doi.org/10.32604/cmc.2025.064872
Received 26 February 2025; Accepted 08 May 2025; Issue published 09 June 2025
 View Full Text
 Download PDF
Abstract
Feature selection (FS) is a pivotal pre-processing step in developing data-driven models, influencing reliability, performance and optimization. Although existing FS techniques can yield high-performance metrics for certain models, they do not invariably guarantee the extraction of the most critical or impactful features. Prior literature underscores the significance of equitable FS practices and has proposed diverse methodologies for the identification of appropriate features. However, the challenge of discerning the most relevant and influential features persists, particularly in the context of the exponential growth and heterogeneity of big data—a challenge that is increasingly salient in modern artificial intelligence (AI) applications. In response, this study introduces an innovative, automated statistical method termed Farea Similarity for Feature Selection (FSFS). The FSFS approach computes a similarity metric for each feature by benchmarking it against the record-wise mean, thereby finding feature dependencies and mitigating the influence of outliers that could potentially distort evaluation outcomes. Features are subsequently ranked according to their similarity scores, with the threshold established at the average similarity score. Notably, lower FSFS values indicate higher similarity and stronger data correlations, whereas higher values suggest lower similarity. The FSFS method is designed not only to yield reliable evaluation metrics but also to reduce data complexity without compromising model performance. Comparative analyses were performed against several established techniques, including Chi-squared (CS), Correlation Coefficient (CC), Genetic Algorithm (GA), Exhaustive Approach, Greedy Stepwise Approach, Gain Ratio, and Filtered Subset Eval, using a variety of datasets such as the Experimental Dataset, Breast Cancer Wisconsin (Original), KDD CUP 1999, NSL-KDD, UNSW-NB15, and Edge-IIoT. In the absence of the FSFS method, the highest classifier accuracies observed were 60.00%, 95.13%, 97.02%, 98.17%, 95.86%, and 94.62% for the respective datasets. When the FSFS technique was integrated with data normalization, encoding, balancing, and feature importance selection processes, accuracies improved to 100.00%, 97.81%, 98.63%, 98.94%, 94.27%, and 98.46%, respectively. The FSFS method, with a computational complexity of O(fn log n), demonstrates robust scalability and is well-suited for datasets of large size, ensuring efficient processing even when the number of features is substantial. By automatically eliminating outliers and redundant data, FSFS reduces computational overhead, resulting in faster training and improved model performance. Overall, the FSFS framework not only optimizes performance but also enhances the interpretability and explainability of data-driven models, thereby facilitating more trustworthy decision-making in AI applications.Keywords
FS is a crucial aspect of machine learning and deep learning methodologies, significantly impacting model accuracy and reliability [1]. As data size and complexity grow in the era of big data, models face challenges in managing large numbers of features. This often leads to overfitting, poor generalization, and inflated computational costs due to redundant or irrelevant features [2]. FS aims to address these issues by reducing data dimensionality, ensuring that only the most relevant features are used for training, thereby enhancing model performance and evaluation reliability [3]. Researchers and practitioners alike struggle with selecting the most influential features, a task further complicated by the massive and varied nature of modern datasets [4]. The failure to identify key features can result in inaccurate models, negatively affecting the decisions based on them. Moreover, irrelevant features increase training time, model complexity, and computational costs. Consequently, FS techniques have evolved to improve model performance and efficiency by reducing unnecessary data noise. While optimization-focused feature selection can yield models with high predictive accuracy, it often does so at the expense of a deeper understanding of feature relevance and impact. A more balanced approach one that combines performance metrics with direct measures of feature importance and domain insights can lead to models that are not only accurate but also more interpretable and robust.
Feature selection (FS) techniques encompass a broad spectrum of methodologies, ranging from traditional statistical analyses to advanced machine learning approaches. Although machine learning methods can operate with high efficiency, they often function as black boxes in the context of feature selection, thereby limiting interpretability and potentially compromising reliability [5]. Commonly implemented FS techniques include filter methods (e.g., CS, ANOVA (Analysis of Variance)), wrapper methods (e.g., GA), and embedded methods (e.g., Lasso regression) [5]. The primary objectives of these approaches are to accelerate training processes and enhance predictive accuracy. However, methods that achieve high accuracy by arbitrarily selecting features may sacrifice the reliability of results. In big data environments, effective FS is crucial not only for improving model performance but also for reducing training times and computational costs [6]. In applications where precision is of utmost importance, such as finance and security, FS plays a vital role in ensuring accurate and dependable outcomes. The current study continues to innovate new methodologies to address the increasing complexity of contemporary datasets, thereby facilitating the development of more robust and interpretable models [7]. Filter methods, in particular, are widely favoured due to their strong statistical foundation, which allows for rapid data interpretation and efficient filtering. Nonetheless, traditional filter approaches typically do not account for interactions among dependent variables.
To mitigate this shortcoming, there is a pressing need for novel techniques that simultaneously balance accuracy and reliability by integrating similarity metrics. In response, we propose a new filter-based approach that not only interprets the data but also identifies features with significant impact on model outcomes. Unlike conventional techniques that assess each feature in isolation, our method computes a similarity metric that reflects both the intrinsic importance of individual features and their relationships within the overall data structure, thereby providing a more comprehensive and holistic feature selection process.
This manuscript presents a novel statistical method called Farea Similarity for Feature Selection (FSFS), designed to automatically select the most important and impactful features on model outcomes without losing essential data. The FSFS technique measures the similarity between each feature and the approximate average of records, ranking features according to the highest similarity scores. The proposed automatic threshold classifies features as either important or less important by calculating the mean of the total similarities. The most similar features are considered the most important, while the least similar ones are discarded. The FSFS approach eliminates outlier values that negatively affect model outcomes. FSFS incorporates encoding techniques to improve data processing. Data encoding methods are used to transform raw data into structured numerical data, making it machine-readable for AI models. After data structuring, the proposed method performs statistical operations and calculates the highest similarity and correlation between features and records. FSFS stands out from traditional statistical feature selection methods because it doesn’t merely rank features based on isolated metrics (like correlation or mutual information) but rather quantifies the similarity between each feature and the overall data pattern. In conventional filter methods, each feature is evaluated independently, often overlooking how features work together.
The scientific contributions of this paper are as follows:
• Proposing a new, innovative statistical method for selecting the most important features called Farea Similarity for Feature Selection (FSFS).
• Developing a fair FSFS approach that ranks features based on their similarity and feature dependencies with the approximate average of each record, discarding outliers that distort evaluation outcomes.
• Classifying features into most and least important categories based on an FSFS automatic threshold.
• Comparing the FSFS proposed method with existing FS methods and evaluating their performance.
This paper is organized as follows: Section 2 provides a review of related work, contextualizing the contributions of the proposed FSFS framework against existing methods. Section 3 outlines the methodology, detailing the FSFS architecture, step-by-step pseudocode, and practical implementation examples. Section 4 conducts a comprehensive statistical analysis comparing FSFS to state-of-the-art approaches, supported by rigorous experimental results and performance evaluations. Finally, Section 5 summarizes the key findings, discusses current limitations, and proposes actionable insights for future research directions.
2 Comparative Analysis of Feature Selection Approaches
The body of literature on FS provides a crucial foundation for understanding the available tools and techniques for selecting optimal features and improving model performance and evaluation results. However, with the continuous advancement in this field, challenges remain, such as ensuring fair and adaptive FS in response to evolving and diverse datasets. Challenges include handling imbalanced data and noise, as well as variations in data types and model training approaches. Existing studies highlight the need for developing new methods that address these challenges, opening new horizons for solving future problems as technologies and data representation methods evolve.
This section outlines some of the key FS techniques. Filter Techniques: Filter techniques are among the oldest methods used in FS [8]. Studies such as [9] emphasized the importance of statistical methods in evaluating the relationship between features and target variables. Researchers employed tests like the Chi-square test and ANOVA to identify the most relevant features [10]. These studies demonstrated that using filter techniques can significantly reduce the number of features without losing critical information. Wrapper Methods: Wrapper methods are more complex, relying on evaluating model performance with a specific subset of features. In the study by [11], the concept of eliminating unnecessary features was introduced through Recursive Feature Elimination (RFE) [12]. Their results indicated that this approach significantly improved model accuracy compared to traditional methods. Embedded Methods: Embedded methods, which combine the benefits of both filter and wrapper approaches, are gaining increasing popularity. In the study [13] on Lasso Regression, the regression technique was used to strike a balance between model complexity and accuracy by imposing constraints on the coefficients. The results showed that Lasso could lead to effective FS while reducing overfitting. Recent Innovations: With the development of machine and deep learning techniques, new studies have emerged that utilize deep learning for FS. In a study by [14], the paper proposes a metaheuristic method for selecting optimal features in HER2 (Human epidermal growth factor receptor 2) image classification, enhancing accuracy and reducing complexity. It utilizes a transfer learning model combined with NSGA-II (non-dominated sorting genetic algorithm) and SVM (support vector machine) classifiers for improved performance. Study [15] focuses on enhancing phishing detection using machine learning techniques, particularly through feature selection and deep learning models. A dataset comprising 58,645 URLs was analyzed, identifying 111 features. A feedforward neural network model achieved an accuracy of 94.46% using only 14 selected features. Table 1 provides a summary of existing feature selection (FS) methods, highlighting their key characteristics and differences. Table 2 illustrates widely used FS approaches and compares them with the proposed FSFS theory. Previous studies, as summarized in Tables 1 and 2, have played a fundamental role in improving machine learning model performance. Some focus on enhancing system performance, others on optimizing evaluation metrics, while certain methods emphasize selecting noise-free features to improve model interpretability. Existing approaches often assume that the features leading to high performance are the most suitable without considering their significance. As a result, less important features that enhance system performance may be selected over more impactful ones. On the other hand, some methods focus solely on achieving high evaluation results, disregarding the importance of the selected features. These methods aim to balance feature selection and optimization, often sacrificing the more critical features that could increase the reliability of the results. Hence, techniques designed to improve system performance may not necessarily select the most important features, as their goal is to maximize performance and speed without emphasizing feature relevance. Similarly, techniques aimed at maximizing evaluation results may not prioritize the most crucial features, as their objective is to find features that yield high results, regardless of their impact on model outputs. However, there are significant differences in the operation of these methods. Techniques that prioritize system performance and select features to achieve the model’s performance.
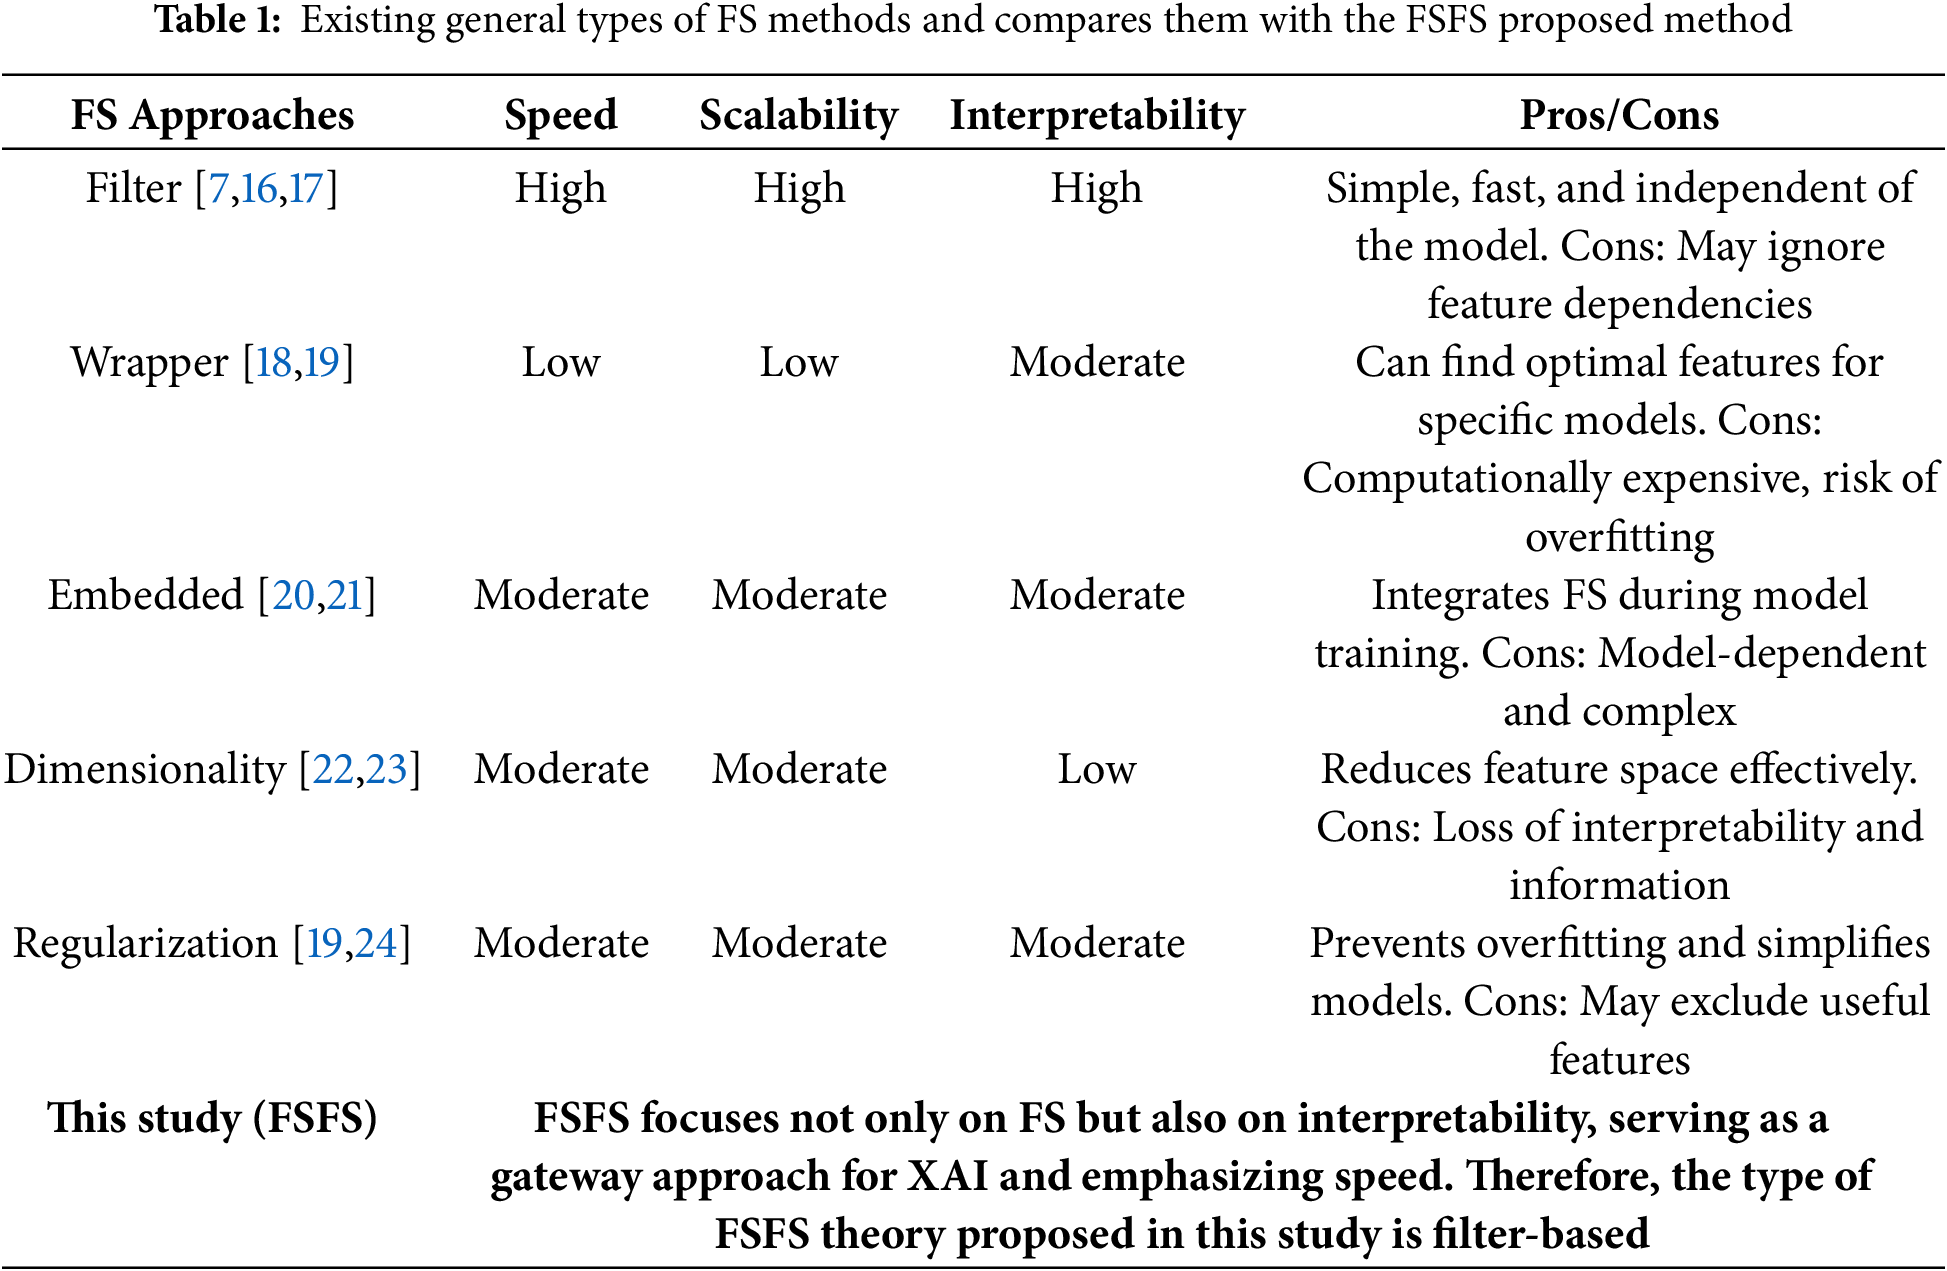
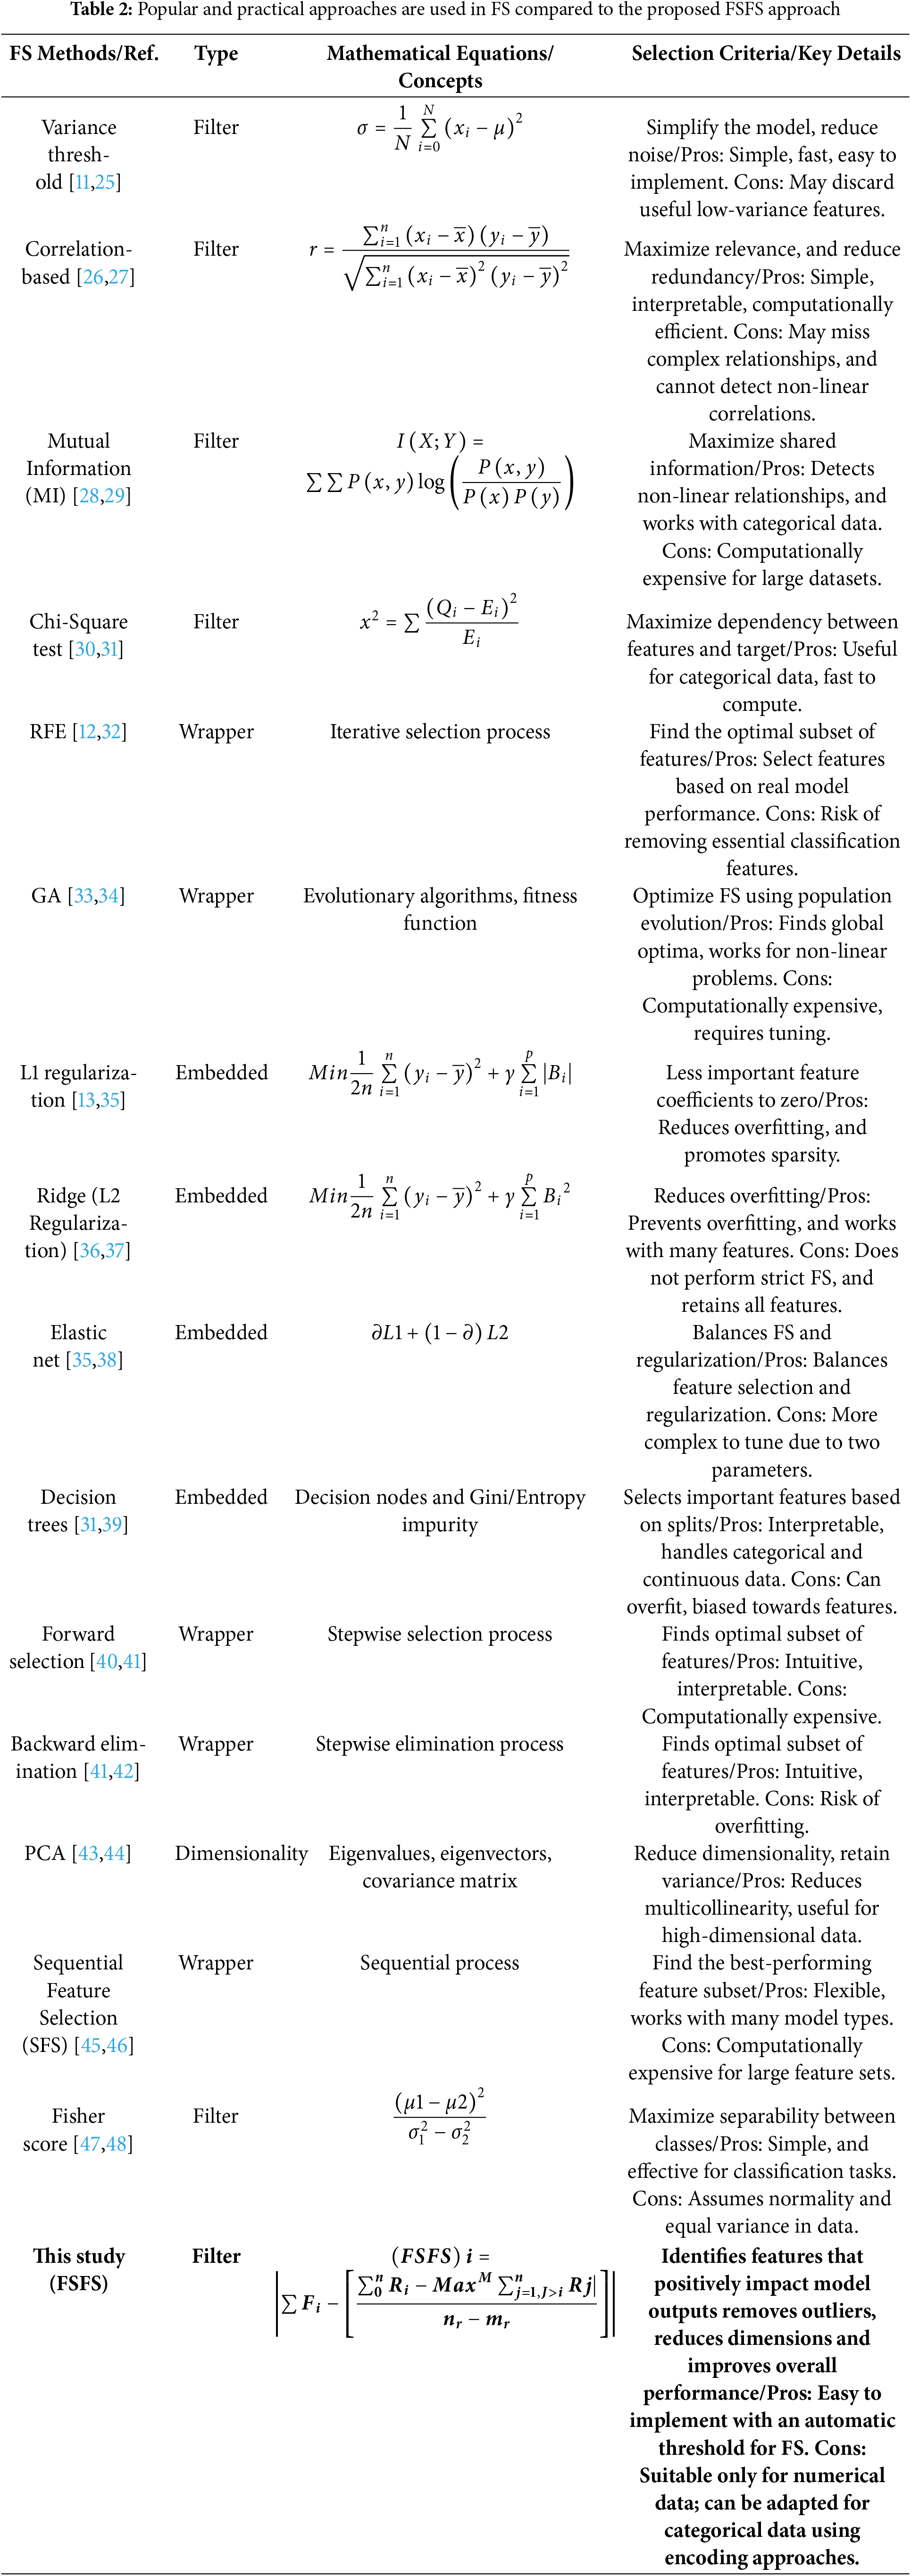
The evaluation in Tables 1 and 2 demonstrates that our proposed FSFS filter-based methods rely on statistical measures to assess feature importance. Their ability to analyze features independently and efficiently establishes them as a powerful foundation for explainable AI, outperforming existing FS approaches in extracting and analyzing meaningful evidence. Traditional filter-based methods evaluate features independently using metrics like correlation or mutual information, enabling fast and computationally efficient feature ranking. However, this isolated evaluation often overlooks feature interactions or dependencies. For example, two features may exhibit weak individual correlations with the target variable, yet their combined interdependence could yield significant predictive power—a nuance addressed by our proposed FSFS approach. While filter-based methods excel at rapid dimensionality reduction, their inability to capture such joint relationships may result in missed critical insights. By contrast, the FSFS framework accounts for feature interdependencies, enhancing robustness in scenarios where collaborative feature effects are pivotal. This distinction underscores its superiority in identifying complex patterns that conventional filter methods fail to detect.
FSFS designed to automatically identify and select the most important and impactful features in data-driven models while preserving essential information. The FSFS technique measures the similarity between each feature and the mean of records, ranking features based on their similarity scores. To ensure objective feature selection, an automatic thresholding mechanism is employed, classifying features as either important or less significant by calculating the average similarity score. Features with higher similarity scores are retained, while those with lower similarity scores are discarded. Additionally, the FSFS method effectively eliminates outlier values that could negatively impact model outputs. The FSFS framework effectively identifies and selects features exhibiting strong statistical relationships and high similarity, ensuring fairness in FS while maintaining reliable evaluation outcomes. Although FSFS is inherently optimized for numerical data, it can be adapted for categorical data through preprocessing techniques that map categorical variables to numerical representations.
This framework includes an automated ranking mechanism to identify features with the highest statistical significance and impact on the trustworthiness of models. To enable precise feature selection, FSFS integrates advanced data encoding techniques, transforming raw datasets into structured numerical formats compatible with machine learning workflows. Once structured, statistical analyses—the proposed FSFS metrics are applied to guide the right selection process, ensuring robustness, reproducibility, and alignment with model objectives. The proposed FSFS method focuses on fair feature selection, emphasizing the most critical and correlated features that influence overall system outputs while achieving high performance and reliable, reasonable evaluation results. Moreover, new FSFS methods provide greater interpretability of models by offering insights into data features from multiple perspectives, thus increasing users’ confidence in the results.
The significance of this approach lies in its ability to select the most similar and related features by calculating the ratio of similarity and dependencies among features. This is achieved by comparing the total feature similarity with the average of each record to identify the minimum distance, where the shortest distance indicates the highest similarity. Higher similarity corresponds to a stronger relationship between features. After normalization (data standardization and unification), the dataset values are transformed into a uniform range, such as 0–1, 0–100, or 100–1000, depending on the dataset’s scale. This normalization process mitigates the effects of data anomalies and extreme values. The FSFS method further eliminates extreme values after normalization, reducing their influence on model outputs. For illustration, consider a dataset containing information on patients with cancer and diabetes. If the focus is on cancer-related data, the FSFS method calculates feature similarity to prioritize parameters most closely related to cancer, while minimizing the influence of dissimilar features that may be more associated with diabetes. This targeted approach enhances performance and yields more reliable results by leveraging the similarity and dependencies in data patterns. As displayed in Fig. 1, the proposed FSFS methodology involves calculating the approximate average for each record and subtracting it from the sum of each attribute, incorporating deep and intelligent scaling values. The scaling process (e.g., Max-value division scaling) eliminates values that negatively impact the output of data-driven models, ensuring that the target values in testing data remain consistent across records while aligning with the corresponding target class (e.g., class X or Y). FSFS methodology is further integrated with the replacement encoding techniques, which preserves the dimensionality of the data while maintaining privacy and ensuring data encryption. The replacement encoding mechanism transforms categorical data into numerical representations, facilitating seamless integration within AI models. In this study, the proposed method for FS and classification into the most important and least important features consists of several stages: Data Structuring and Formatting: This stage involves organizing and structuring the data through replacement encoding, transforming it into a numerical format to ensure uniformity and make it suitable for FSFS statistical analysis. It maintains both the data’s dimensions and structure. Datasets containing numerical data do not require this encoding process. However, datasets with categorical data must undergo data encoding to facilitate easy computation. Statistical Stage: This is the most crucial stage in The FSFS proposed method for feature selection, designed to identify the most and least significant features. In this stage, the similarity between each feature and the approximate average of all records is calculated to determine the most correlated and similar features. Automatic Threshold Stage: In this final stage, the automatic threshold is used to classify the features into those with the highest significance and those with lower importance. The threshold is calculated by determining the average of the sum of the similar features. Features that are more correlated and similar are classified as the most important and are less than the output of the automatic threshold. Conversely, features with less correlation and similarity are classified as less important, having less impact on model outcomes, and are greater than the output of the automatic threshold. Fig. 1 illustrates the workflow underpinning the proposed FSFS theory, along with the equations that define its theoretical framework. The output of the automated preprocessing consists of numerical data, although outlier values may still affect the performance of AI models. To address this, the output dataset undergoes standard normalization techniques tailored to the dataset’s characteristics. The choice of normalization method depends on the specific dataset characteristics and the desired value ranges. Once normalized, the dataset—with reduced outlier effects—serves as input for the FSFS methodology. The FSFS approach conducts statistical computations by deeply analyzing and removing outliers using the Min-Max (M) function. FSFS calculates feature similarity by summing feature values correlated with the approximate averages of records. Finally, the method applies an automated optimal thresholding process, classifying features into the most important and least important categories, respectively.
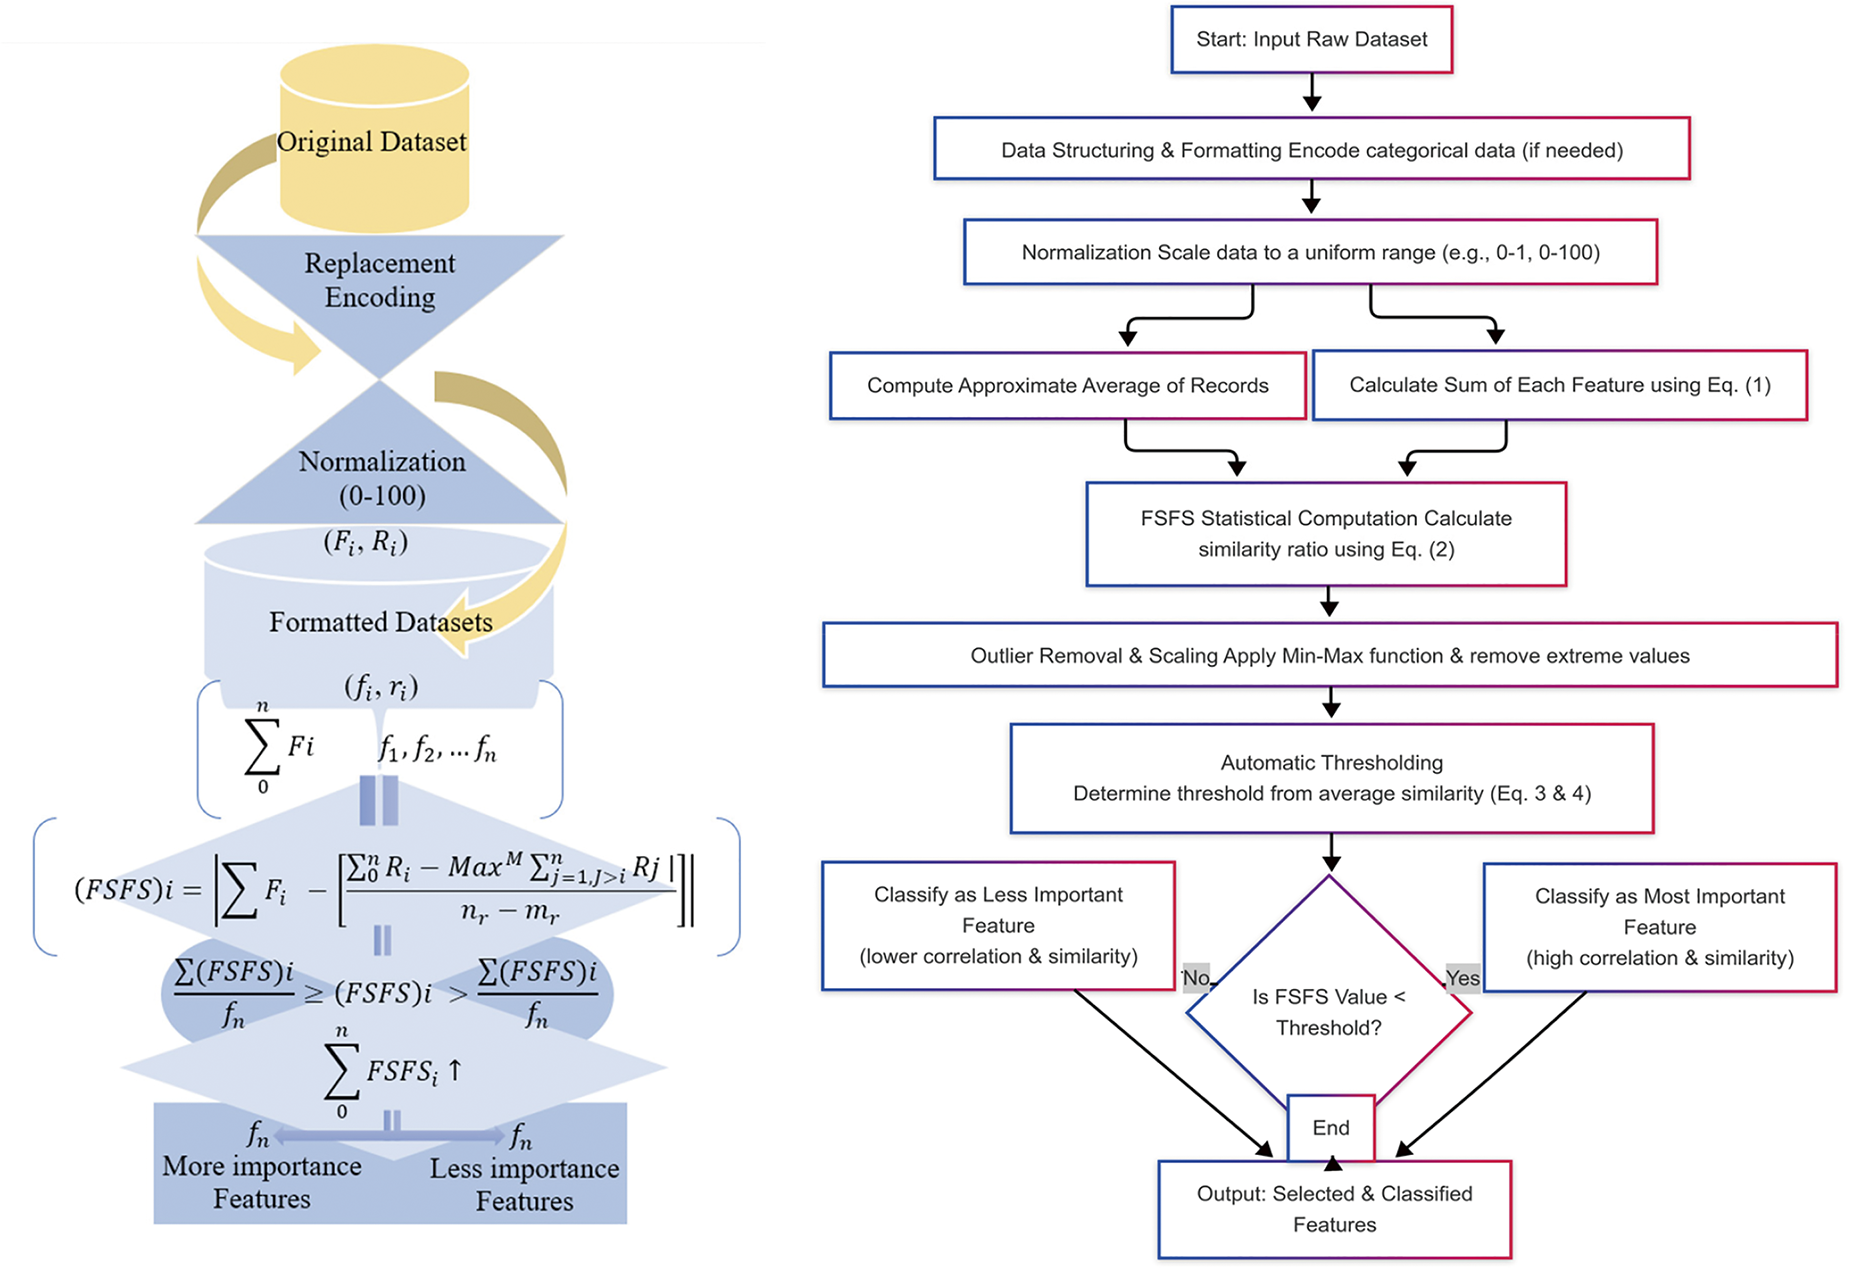
Figure 1: Workflow and equations underpinning the proposed FSFS theory
The proposed equation for feature selection consists of three components: the preliminary condition in Eq. (1), denoted as (
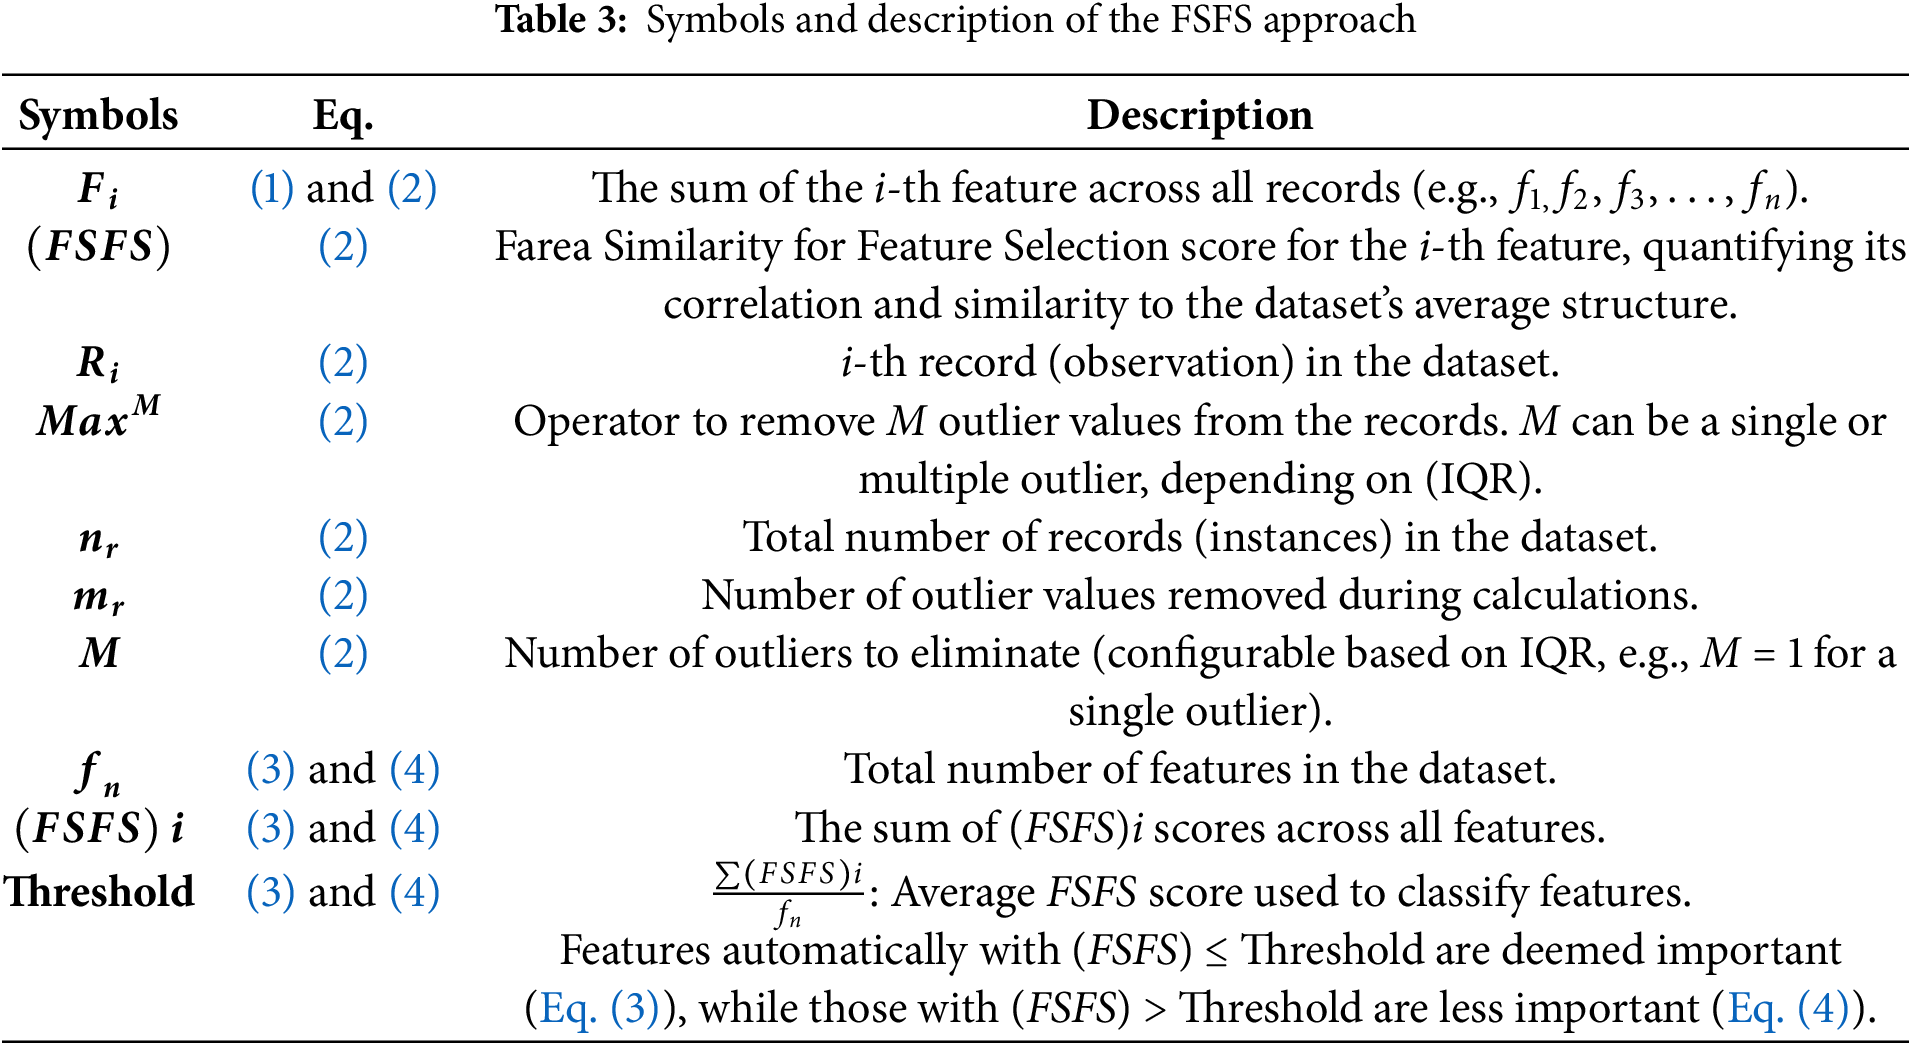
In Eq. (2), feature interactions are quantified by subtracting the sum of each feature from the average of each record, thereby minimizing the distance and maximizing similarity and correlation both vertically (across features) and horizontally (across records). The subtraction operation represents finding the smallest distance, which signifies the highest degree of similarity. In other words, the equation calculates the overall similarity between each feature (representing vertical data) and the average of each record (representing horizontal data). This process establishes a connection between the features and records to determine their correlation. FSFS considers feature dependencies rather than isolated metrics. This approach evaluates both feature consistency and inter-feature similarity to the overall data pattern. The FSFS measure, calculated as the absolute difference, quantifies dissimilarity, with a smaller difference indicating higher similarity. Traditional methods often neglect feature interactions. For instance, individually weak features may collectively possess strong predictive power, which FSFS aims to capture.
Furthermore, FSFS incorporates outlier and irrelevant feature removal post-normalization, potentially impacting AI results. In the proposed method, we also account for outlier removal, as these anomalous values can have a direct impact on the evaluation and calculation results. The equation allows for the removal of either a single outlier or multiple outliers. Considering the elimination of outliers is crucial in this proposed equation, as outliers significantly affect feature selection and result variability. Additionally, the method operates on a general statistical basis for calculating the correlation and similarity between features, ensuring a robust and accurate selection process. In the FSFS approach, outlier removal is integrated into the FS process, ensuring data preservation without arbitrary elimination and maintaining meaningful information. This study deliberately avoids the arbitrary exclusion of extreme values, which could result in significant information loss if such values were indiscriminately treated as part of data cleaning. The careful handling of extreme values was a central focus of this study, aligning with the overarching goal of improving feature selection.
Eqs. (3) and (4) illustrate the automatic threshold condition used to classify the most important features from the less important ones. The automatic threshold is calculated by determining the average of the total similarity for all features. Features that are of the highest importance have values below the threshold, indicating they are the most similar and significant, as shown in Eq. (3). Conversely, features with lower importance have values greater than the threshold, indicating they are less correlated, as outlined in Eq. (4).
The proposed algorithm processes the features and records of the dataset, which serves as the input to our model. The outputs are the number of features classified as highly similar and of utmost importance, as well as the number of features identified as less correlated and having lower significance and impact on the model’s outputs. A data encoding technique is employed to ensure the proper reorganization and structuring of the data. Following this, a normalization process is applied to scale down large values. The FSFS Statistical computations are then performed. Finally, the condition and description of the automatic threshold equation are applied to distinguish and classify the important features from the less significant ones. Fig. 2 illustrates the pseudocode detailing the sequence of operations in our proposed method.
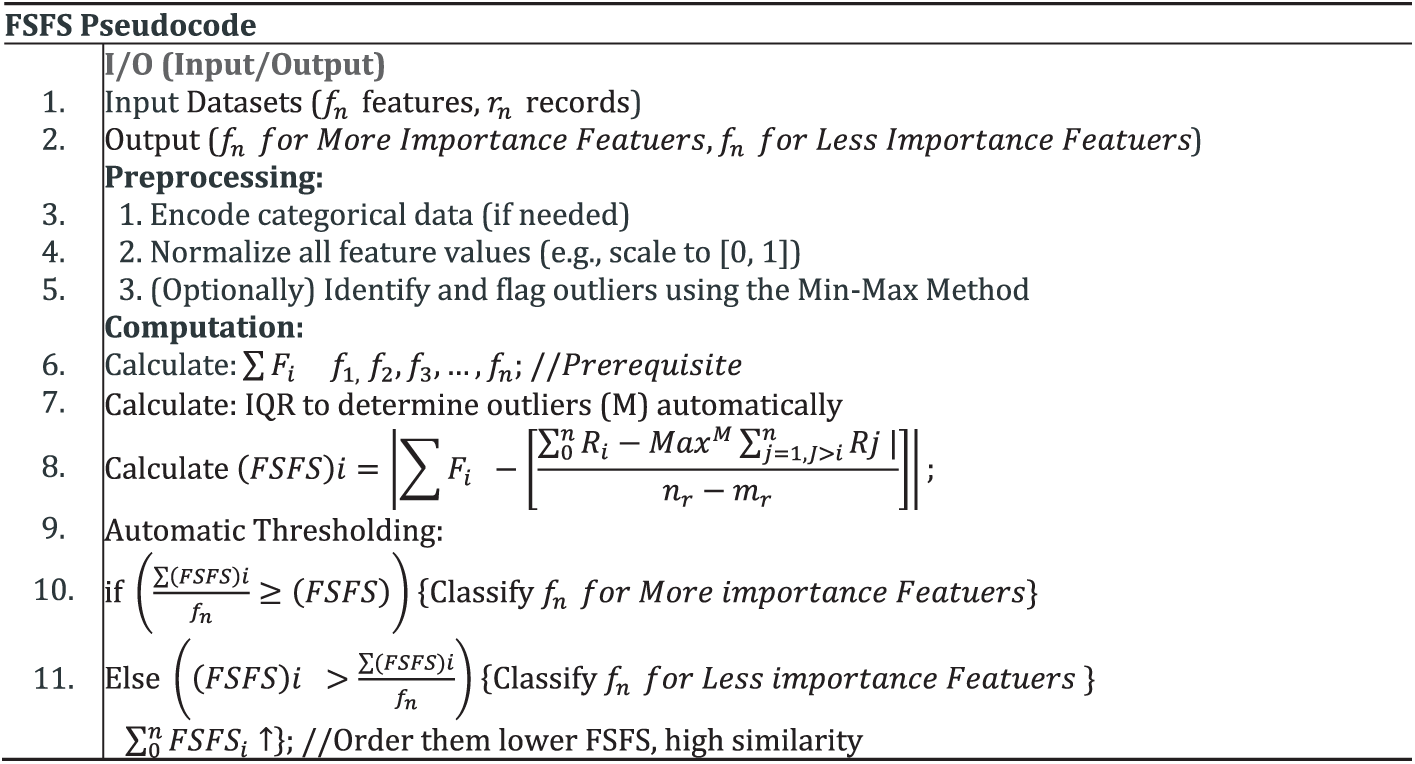
Figure 2: FSFS pseudocode detailing the sequence of operations in our proposed method
The proposed theory has been evaluated, tested, and compared with various feature selection techniques and datasets. The selected datasets include experimental data, Breast Cancer Wisconsin (Original) [49], KDD CUP 1999 DATASET [50], NSL-KDD, UNSW-NB15 and Edge-IIoT [51] datasets while the techniques compared with the FSFS proposed method include CS, Gain Ratio, Filtered Subset Eval, Genetic Approach, Exhaustive Approach, and Greedy Stepwise Approach. We assessed and tested the FSFS approach across three scenarios to validate its effectiveness and efficiency, which are detailed as follows: The first scenario involved simple experimental data to demonstrate and simplify the step-by-step calculations of the FSFS proposed theory, ensuring its ease of use and applicability to data-driven models. The second scenario utilized health data related to breast cancer. Lastly, the third scenario applied cybersecurity data to evaluate the approach further.
Scaling dataset values to a specific range through data normalization is crucial, particularly for handling anomalous values and mitigating the influence of outliers that can adversely affect the performance of AI models. The purpose of the first scenario is solely to provide a mathematical understanding of the proposed FSFS approach. In experimental setups, normalization helps in computationally understanding the proposed theory, Hence, we employed division by the maximum value as a normalization step for the datasets. The choice of normalization method depends on the dataset characteristics and desired value ranges. These techniques ensure data standardization and unification, avoiding the adverse effects of outliers. For instance, consider a testing record R with features R (f1 = 16, f2 = 18, f3 = 1000, f4 = 7, T = ?), where f1, f2, f3, and f4 represent features, and T is the target label. The training dataset includes two records: R1 (f1 = 15, f2 = 13, f3 = 500, f4 = 4, T = P) R2 (f1 = 17, f2 = 17, f3 = 300, f4 = 8, T = N). Before normalization, these records contain anomalies, such as the values f3 = 1000 in R, f3 = 500 in R1 and f3 = 300 in R2. After normalization (scaling the data to the specific range using max-value division), the transformed records are: R′ (f1′ = 0.016, f2′ = 0.018, f3′ = 1.000, f4′ = 0.007, T = ?), R1′ (f1′ = 0.015, f2′ = 0.013, f3′ = 0.500, f4′ = 0.004, T = P), R2′ (f1′ = 0.017, f2′ = 0.017, f3′ = 0.300, f4′ = 0.008, T = N). In traditional methods, similarity between records is calculated using the absolute differences between corresponding normalized feature values (e.g., |R′_f1-R1′_f1|, |R′_f2-R2′_f2|, etc.). Based on these calculations, R′ is closer to R1′, which would associate T with class P. However, the proposed FSFS approach introduces additional preprocessing steps by eliminating outliers and unrelated features (e.g., f3), thus altering the results. For example, FSFS detects that R′ shares more similarity with R2′ when focusing on related features f1′, f2′, and f4′, and avoids using the anomaly-prone feature f3′. As a result, T is correctly classified into class N, demonstrating how FSFS enhances model reliability via interaction and dependency between features. This highlights the significance of normalization in ensuring accurate AI outputs and underscores the added value of the FSFS method. By removing unrelated and outlier features, FSFS improves the trustworthiness of results and supports more sensitive and precise calculations that affect AI model outputs. Compared to standard normalization techniques, FSFS offers a more robust and context-aware approach to feature selection, ensuring reliable and consistent decision-making in AI systems.
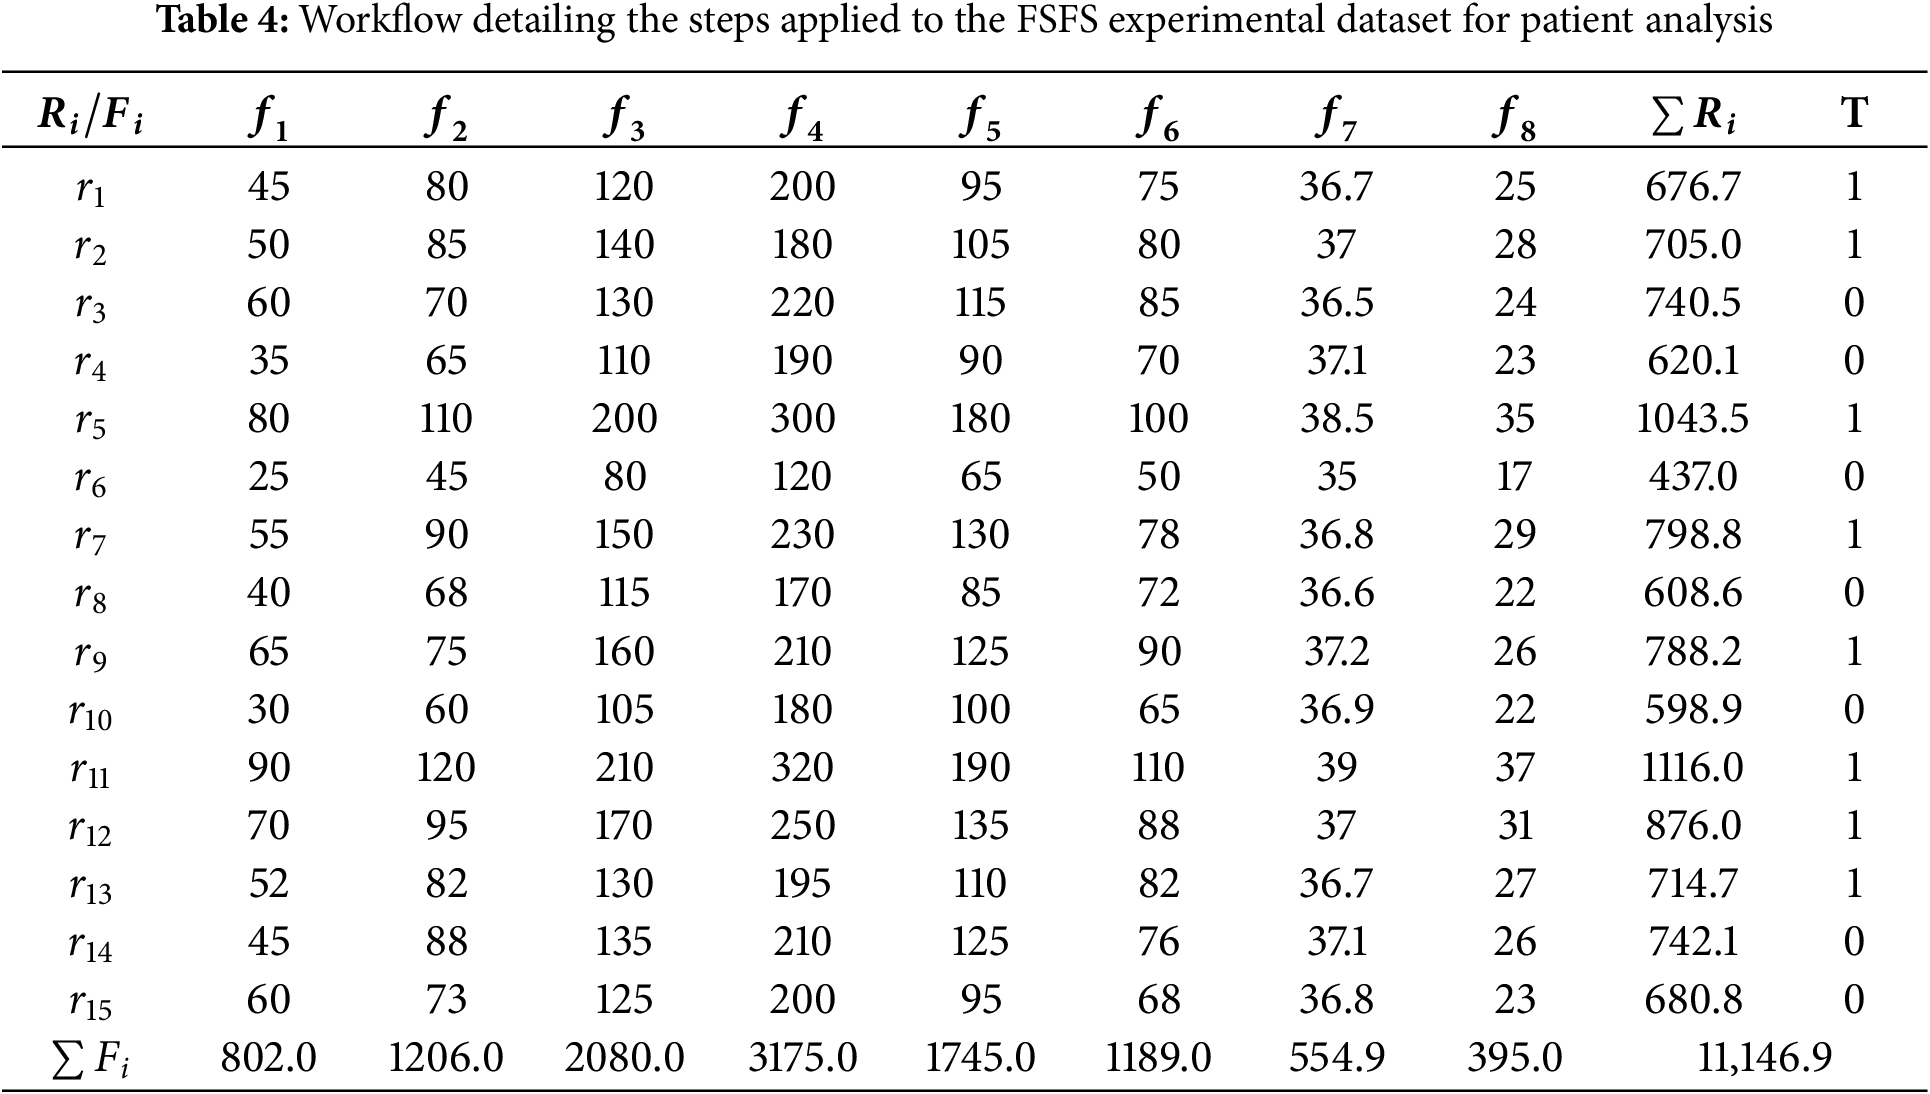
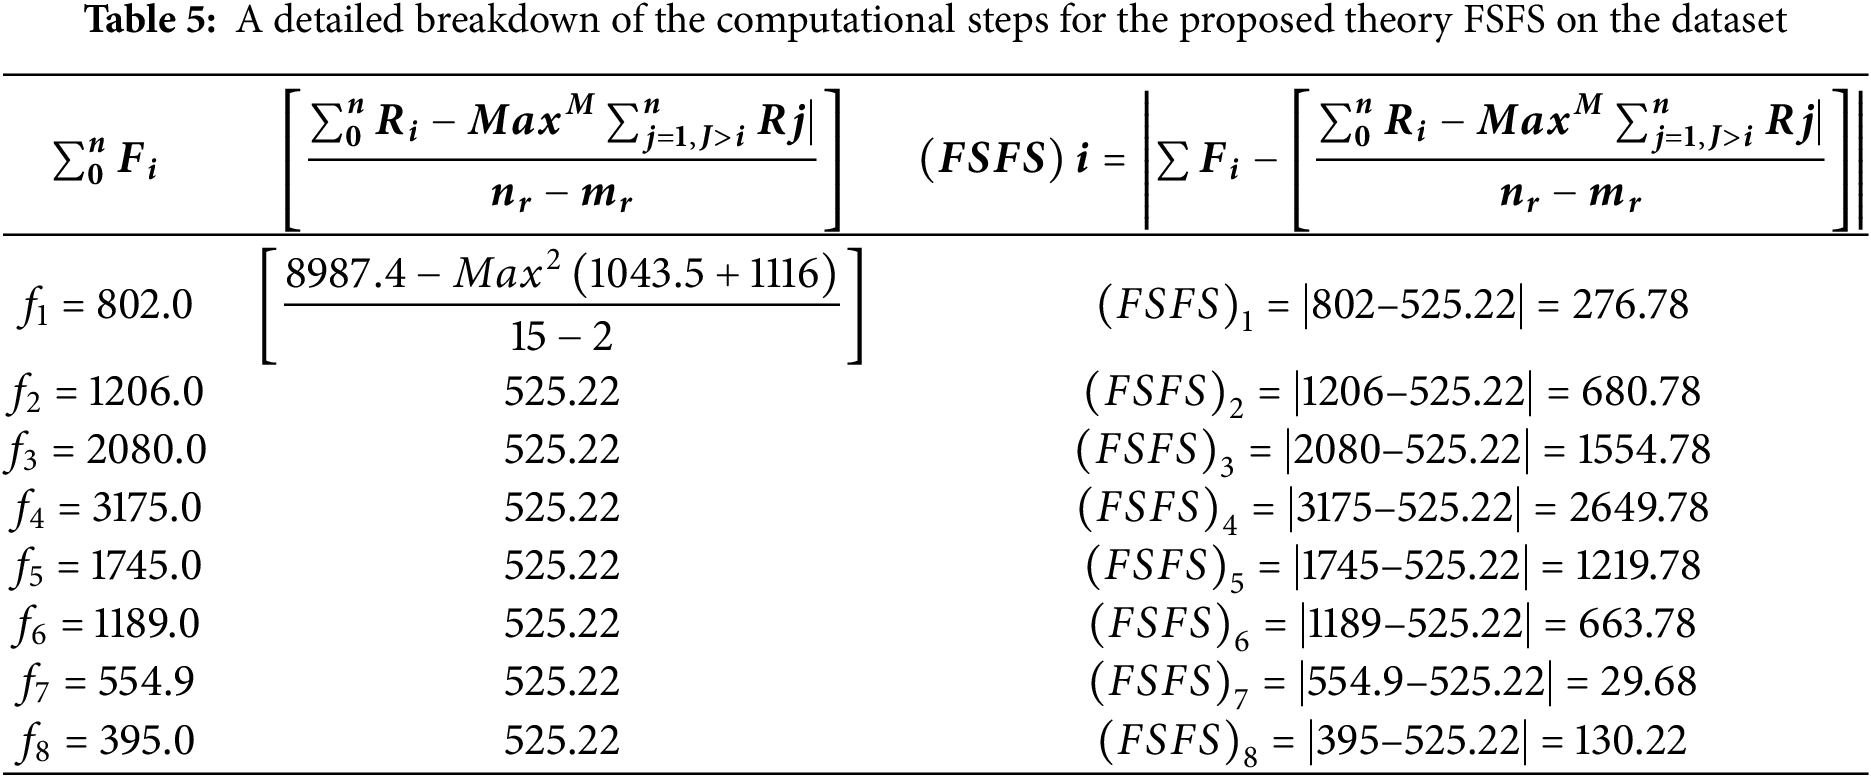
To enhance understanding of the proposed theory, we applied a simple numerical example to a small dataset, aiming to illustrate the workflow of the FSFS theory and simplify it for the reader. The experimental dataset used in this example, to comprehend and apply the proposed theory, consists of 8 features and 15 patient records. The objective is to classify the 8 features into those of utmost importance and those of lesser significance. Table 4 presents the data from the experimental dataset to facilitate understanding. The features include Patient ID, Age, Weight, Blood Pressure, Cholesterol, Glucose, Heart Rate, Body Temp, BMI (Body mass index), and Oxygen Saturation (%). This small dataset was carefully selected to demonstrate the step-by-step mathematical calculations and the functioning of our proposed theory. The goal is to simplify its application and understanding, ensuring it can be effectively used on larger datasets in the next future scenarios. Table 5 provides a detailed breakdown of the computational steps for the proposed theory FSFS as applied to the dataset shown in Table 4. The first column represents the sum of each feature, serving as the initial condition for our proposed theory. The second column shows the approximate sum of the average of each record, excluding outliers that negatively impact the results. The upper and lower boundaries for detecting outliers are determined using the IQR (Interquartile Range) method. In this case, the IQR is 145.1. This yields a lower boundary of 430.75 and an upper boundary of 1011.15. Any values outside this range—such as 1043.5 and 1116—are classified as outliers. The third column presents the complete calculation of our proposed method FSFS, which involves measuring the similarity and correlation of features both vertically and horizontally. Table 6 summarizes the computational results of the proposed FSFS theory, FSFS indicating the similarity ratio between the features. It also delineates the automatic threshold employed for feature selection and classification into highly similar, moderately related, and less correlated categories. Features with an aggregate below the mean of FSFS are sequentially the most similar and related. Conversely, features above the average of FSFS are sequentially the least significant features.
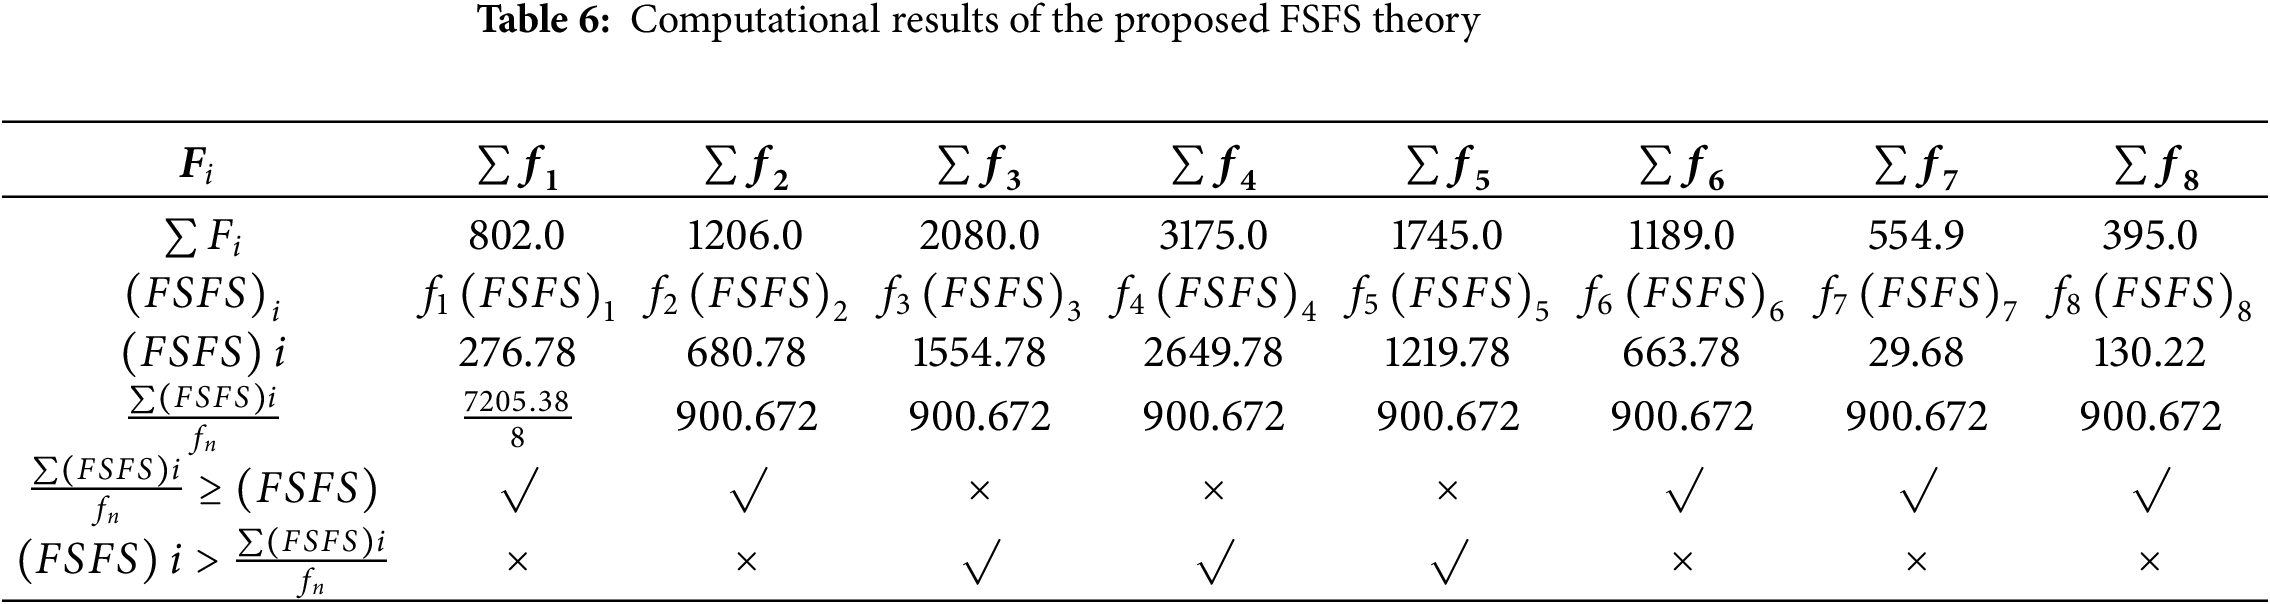
The similarity between features does not merely reflect the closeness of their numerical values but also highlights the relationship and relevance among the features themselves. Features that exhibit strong associations as f1, f2, f6, and f7, and tend to group, indicating their collective influence on reliable classification results. This underscores the importance of evaluating not only numerical proximity but also feature relevance when diagnosing cases or drawing conclusions. For instance, assigning features f3, f4, and f5 to one condition (e.g., a specific disease) and grouping other features under another condition is more effective than treating them as part of the same group. This differentiation enhances diagnostic accuracy and result reliability. In the context of this study, the features with the smallest differences in values are considered the most similar, and the most similar features are typically the most correlated. Conversely, larger differences indicate lower similarity and weaker correlation. This relationship can be conceptualized geometrically: the determination of correlation strength can be visualized as finding the least vertical and horizontal deviations between points, which helps pinpoint the strength and direction of the correlation. In this context, the most significant features are f7, f8, f1, and f6. Among these, f7 demonstrates the least difference in value compared to other features, making it the most similar and correlated. On the other hand, f4 has the greatest difference in value, making it the least similar and least correlated feature. To better illustrate this concept, consider a scenario where similarity is assessed between a given individual and two others based on specific features. By calculating the differences in feature values, the individual is determined to be closer to the person with the smallest overall difference, signifying greater similarity. This principle underlines the importance of minimizing differences in critical features to identify strong correlations and reliable relationships within data. According to the FSFS approach, the computational results presented in Table 6 indicate a stronger correlation and similarity between features f1, f2, f6, f7, and f8, compared to features f3, f4, and f5. Since the distance between features f1, f2, f6, f7, and f8 is much smaller than that between features f3, f4, and f5, it follows that features f1, f2, f6, f7, and f8 are more similar to each other than features f3, f4, and f5. Fig. 3 illustrates the distribution of important and unimportant data within the experimental dataset. The lower the value of variable FSFS, the more significant the feature, as these points fall below the FSFS average line. Conversely, higher values indicate less importance. This is because lower values represent smaller differences in the output, signifying greater similarity among features. Thus, features with smaller FSFS values are more strongly correlated and considered more critical in influencing the model’s results. Table 7 presents a ranked list of features based on their statistical significance and similarity. Features f7, f8, f1, f6, and f2 exhibit the highest levels of significance, with f7 being the most important feature overall. In contrast, features f5, f3, and f4 show the lowest levels of significance, with f4 having the weakest correlation. The overall ranking from most to least significant is: f7, f8, f1, f6, f2, f5, f3, and f4. Therefore, f7 has the strongest correlation, while f4 demonstrates the weakest correlation. Fig. 4 illustrates the significance levels, where the zigzag line represents the FSFS ratio, shown in light orange. Feature f7 exhibits the smallest distance, indicating the highest similarity and correlation, while feature f4 shows the largest difference and distance, reflecting the lowest similarity and correlation. Table 8 details a comparison of feature selection techniques with the proposed FSFS method integrated with a Random Forest (RF) classifier. It compares the FSFS theory with several other methods, such as CS, CC, and GA, showing the number and names of the selected features in each method along with the evaluation results. The proposed FSFS method achieved competitive evaluation results, reaching up to 100% accuracy compared to other techniques.
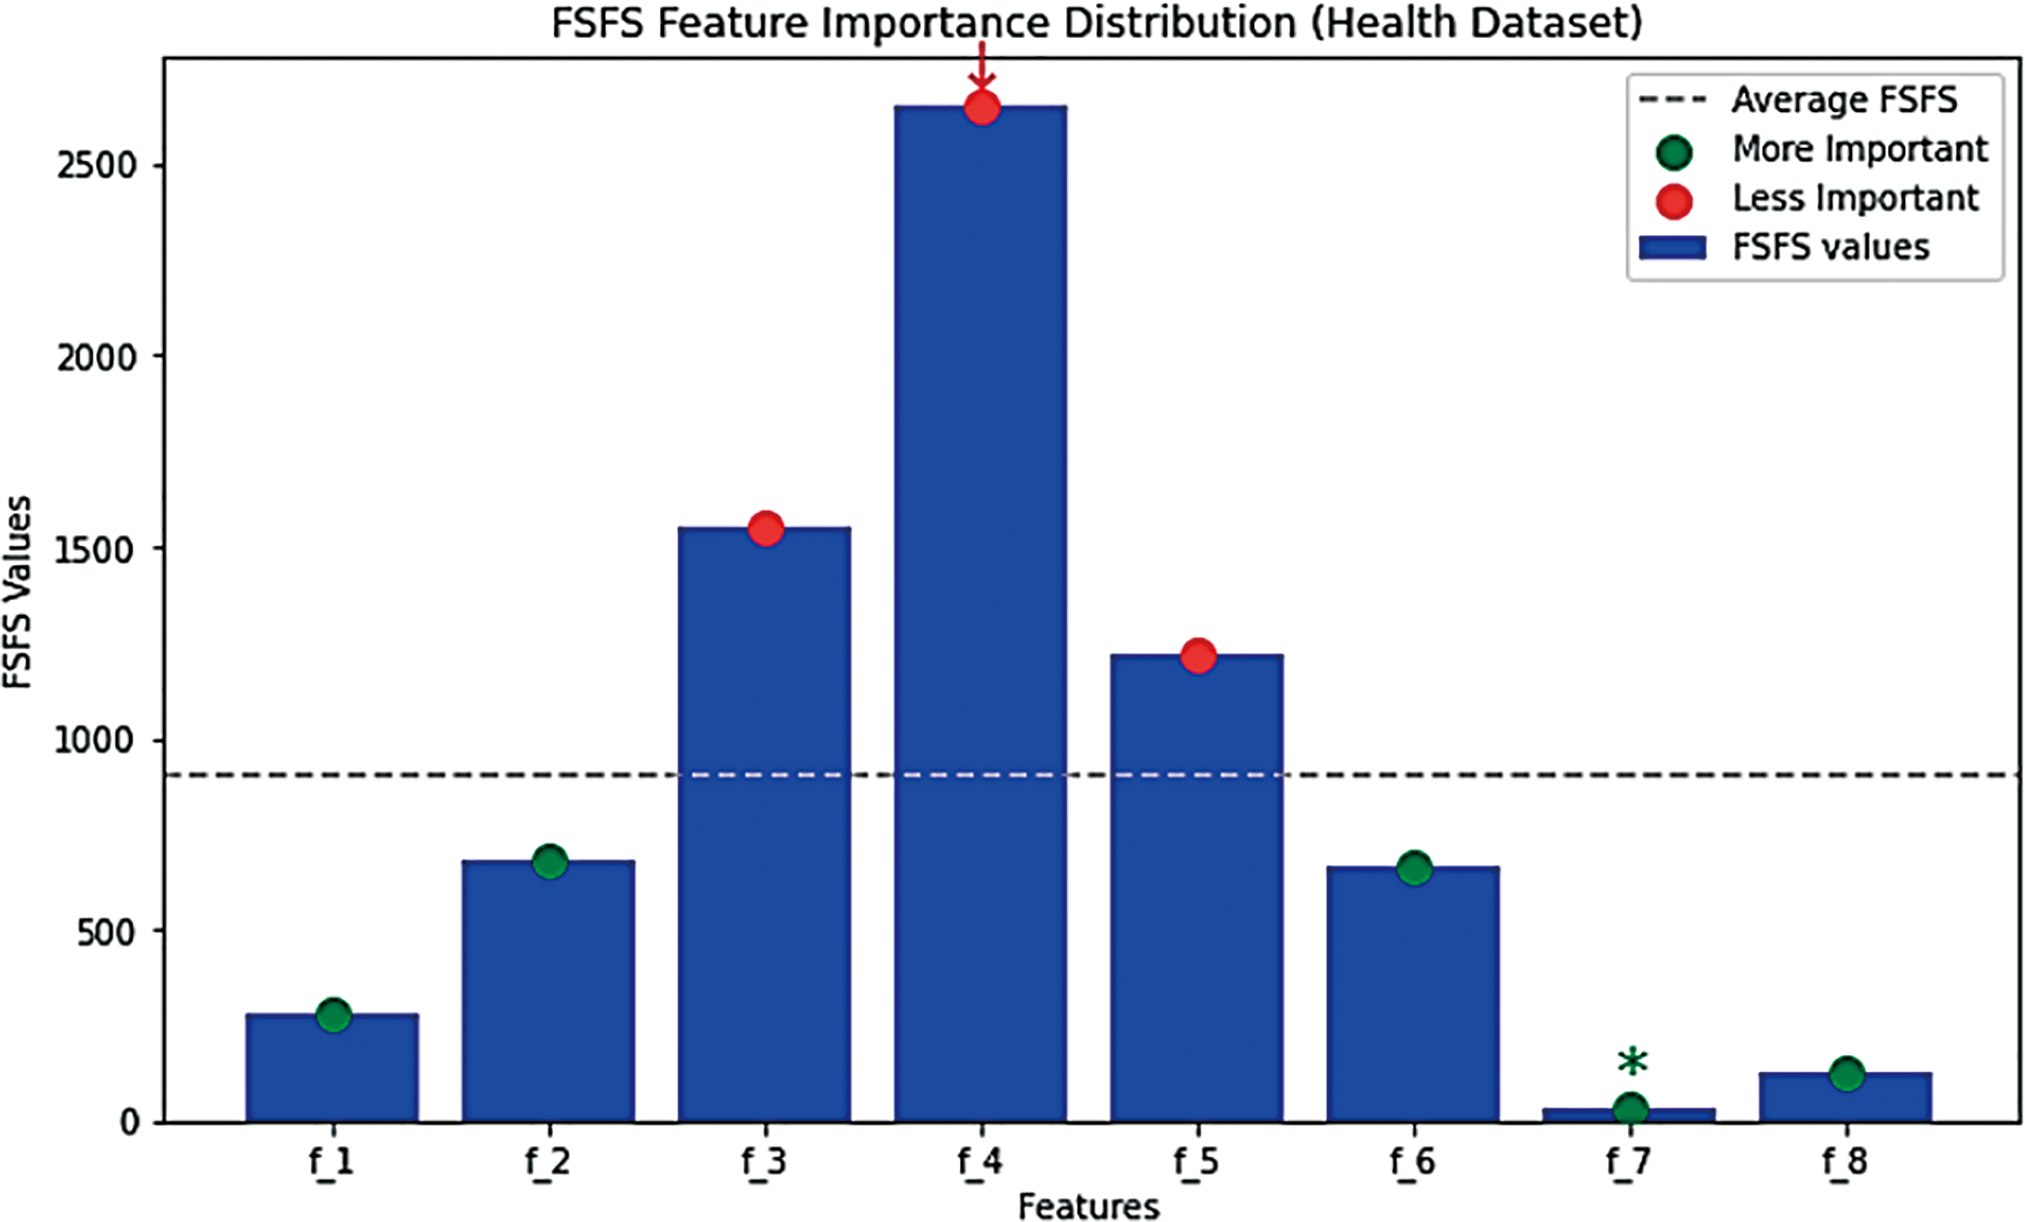
Figure 3: Distribution of important and unimportant data as classified by the FSFS theory
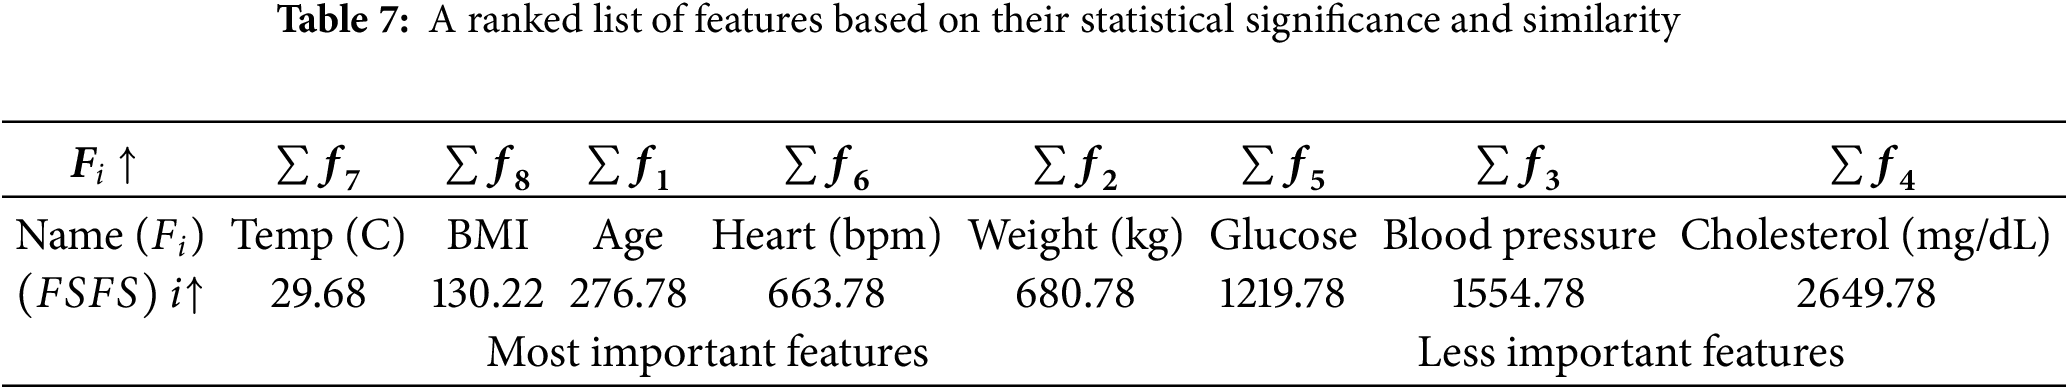
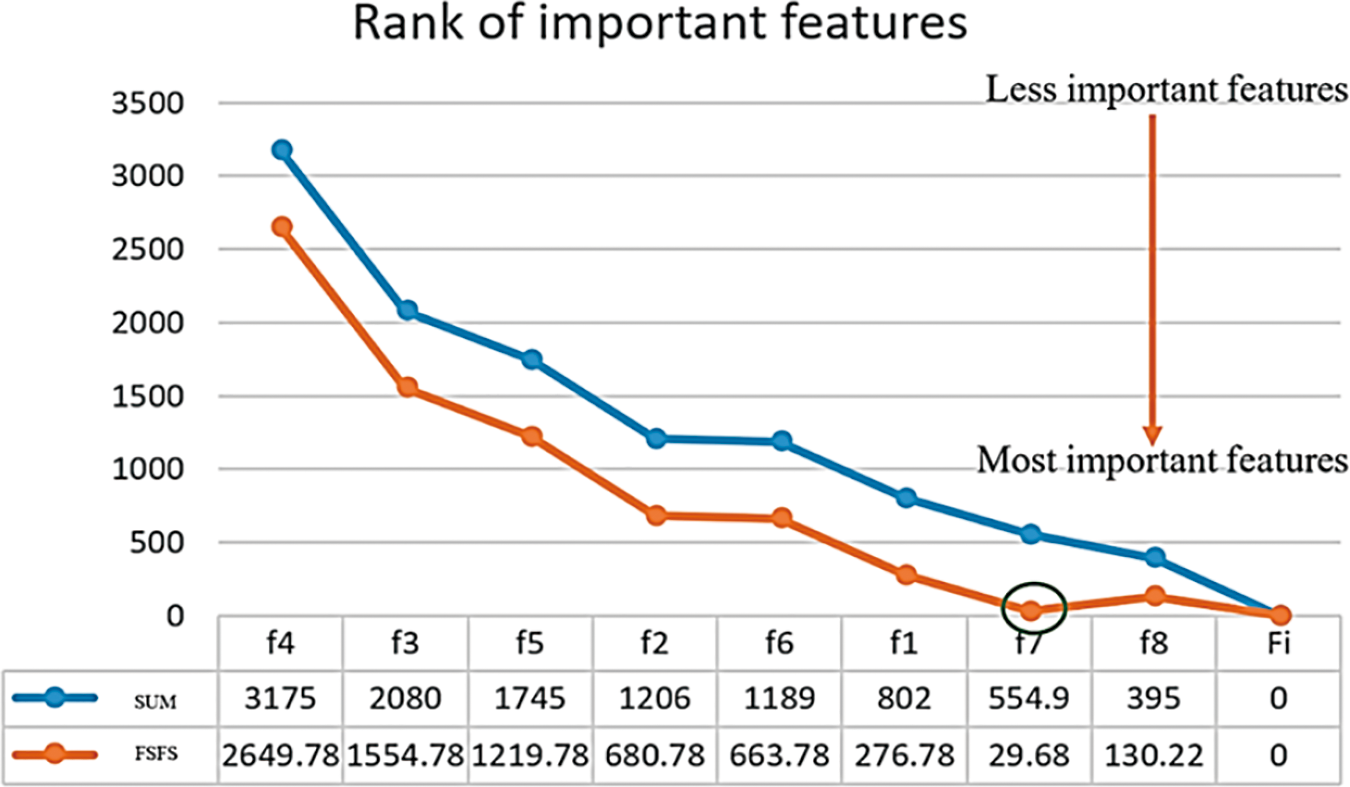
Figure 4: Significance levels, and FSFS values
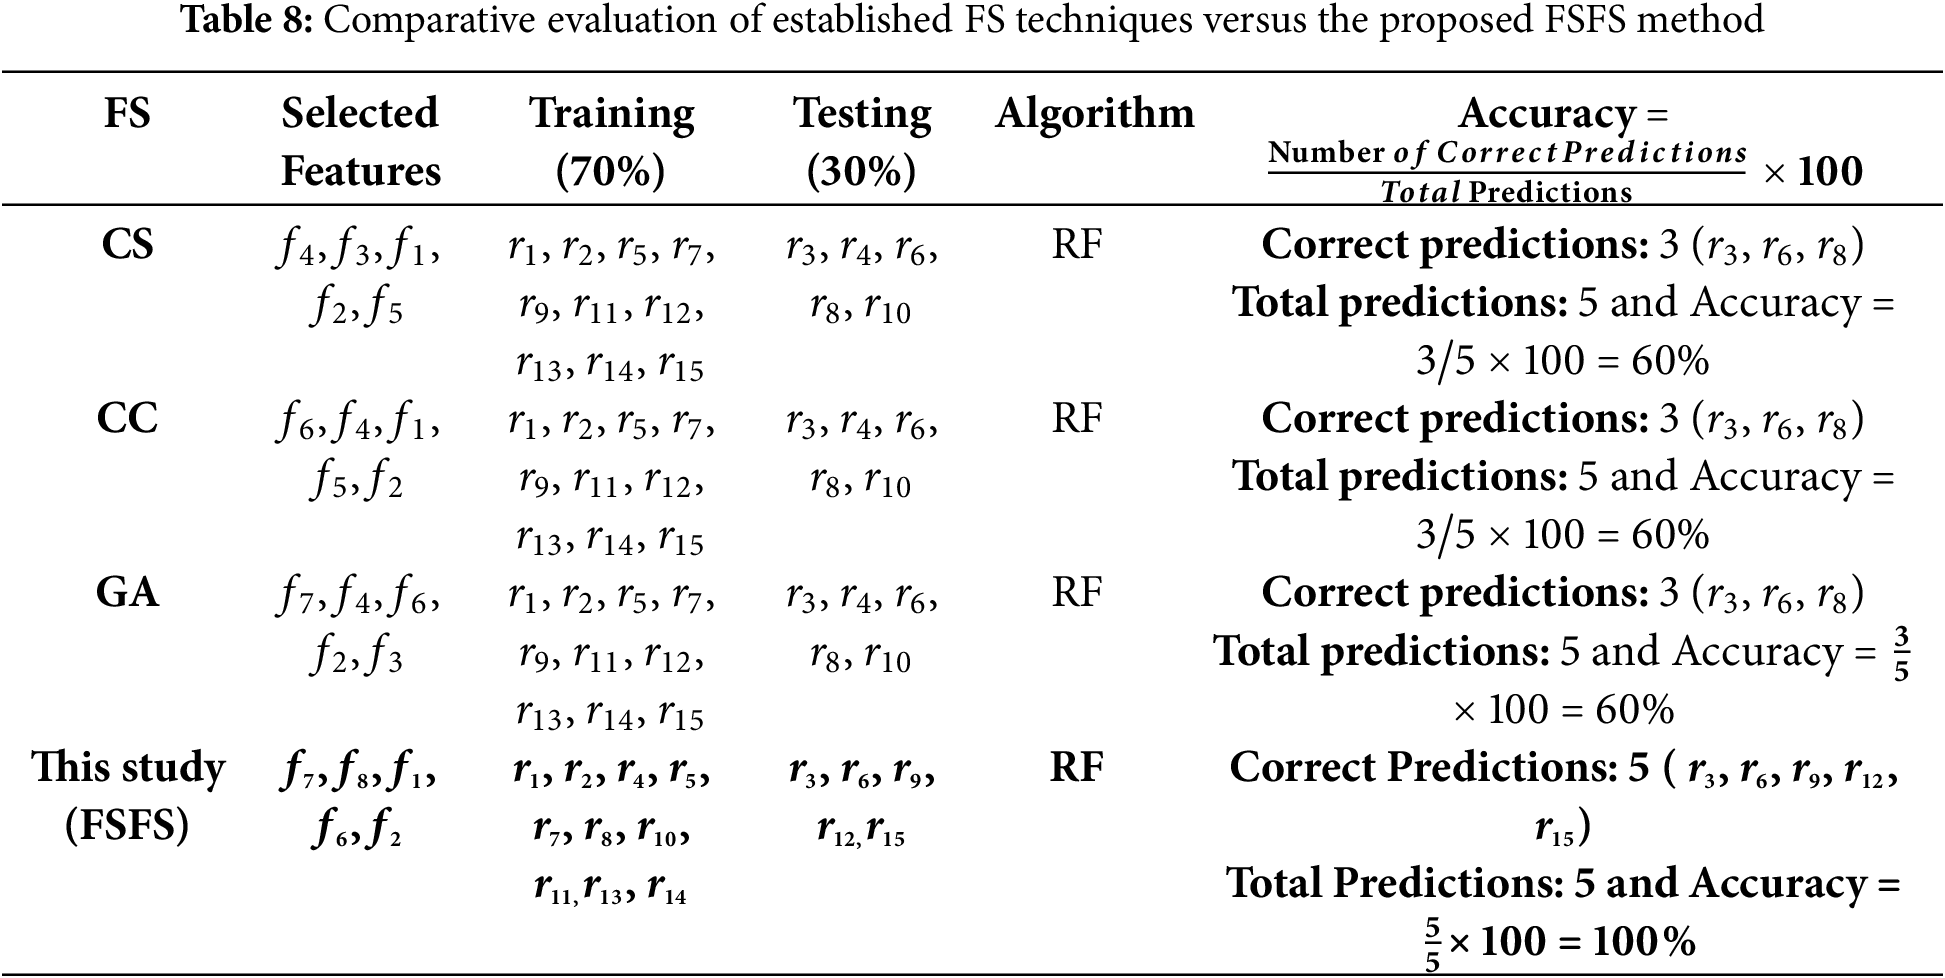
In this study, we define affected model outputs as cases where selecting less important features leads to contradictory outcomes. For example, selecting 5 features out of 8 may classify a new data record into class A, while selecting 6 features out of 8 from the same dataset may classify the same record into class B. This inconsistency arises due to the removal of features with extreme values that significantly and directly affect the model’s results, resulting in inconsistent and volatile outcomes. Figs. 5 and 6 present a comparison of our proposed feature selection method on the experimental dataset with several widely used and established techniques, namely CS, CC, GA, and RF. In our newly developed statistical FSFS method, the features f3, f4, and f5 were identified as less significant, while f7, f8, f1, f6, and f2 were ranked as more important, in that order. When applying the CS method to the same dataset, f6, f7, and f8 were classified as less important, while f4, f3, f1, f2, and f5 were categorized as more important, also in that order. similarly, the CC method selected f6, f4, f1, f5, and f2 as the most important features. Additionally, when using the GA method on the same dataset, the features f1, f5, and f8 were deemed less important, whereas f7, f4, f6, f2, and f3 were ranked as more significant. Furthermore, implementing the encoding mechanisms on the same dataset with full feature selection resulted in optimal model performance. This outcome suggests that ignoring some features can lead to negative results and highlights the significant impact that the choice of test data has on model performance.
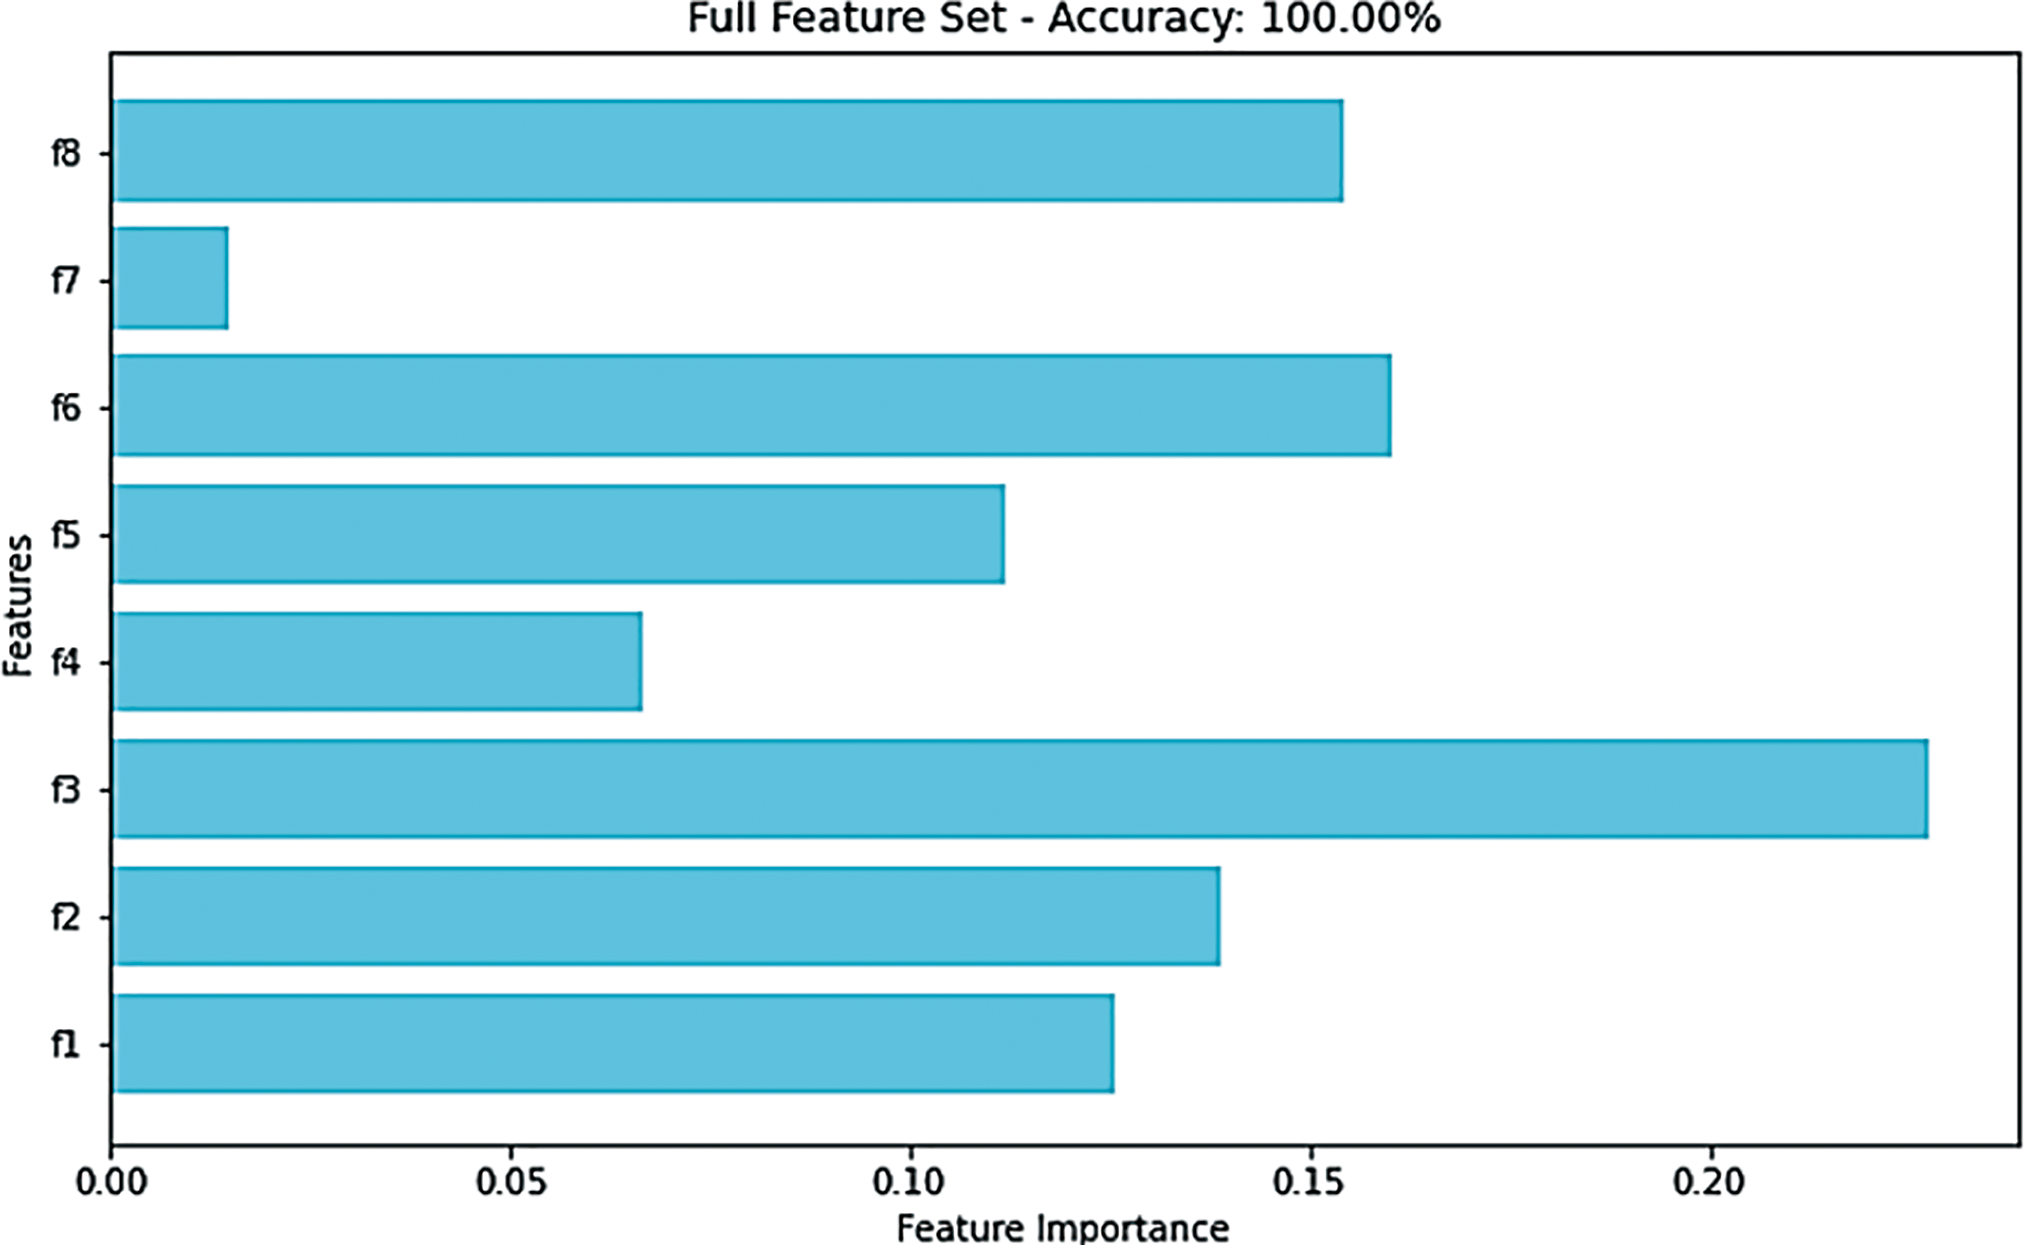
Figure 5: Feature significance determined using the RF method on the complete feature set
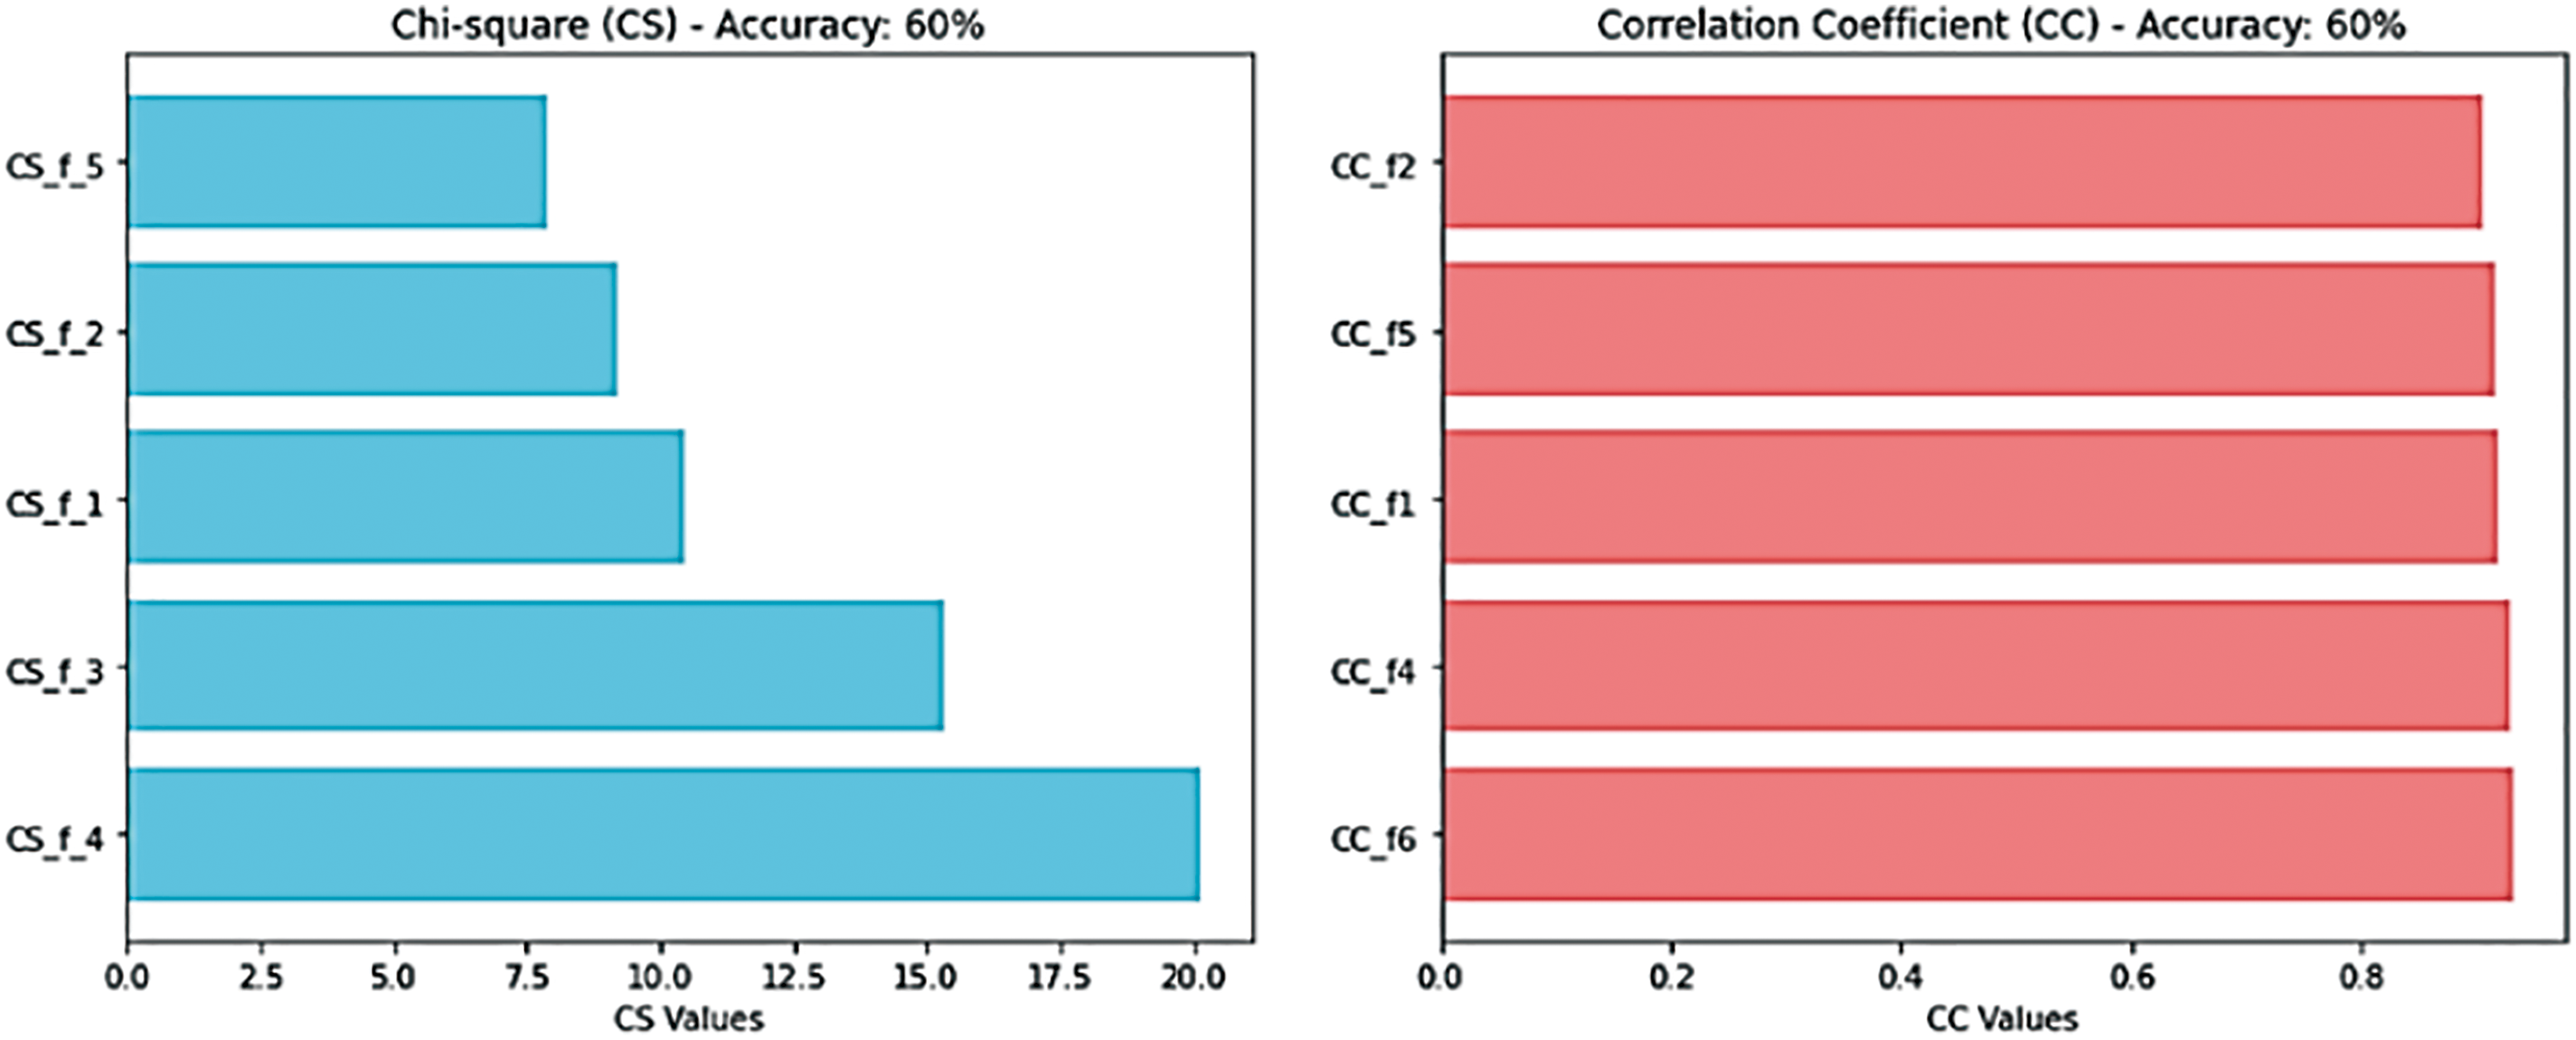
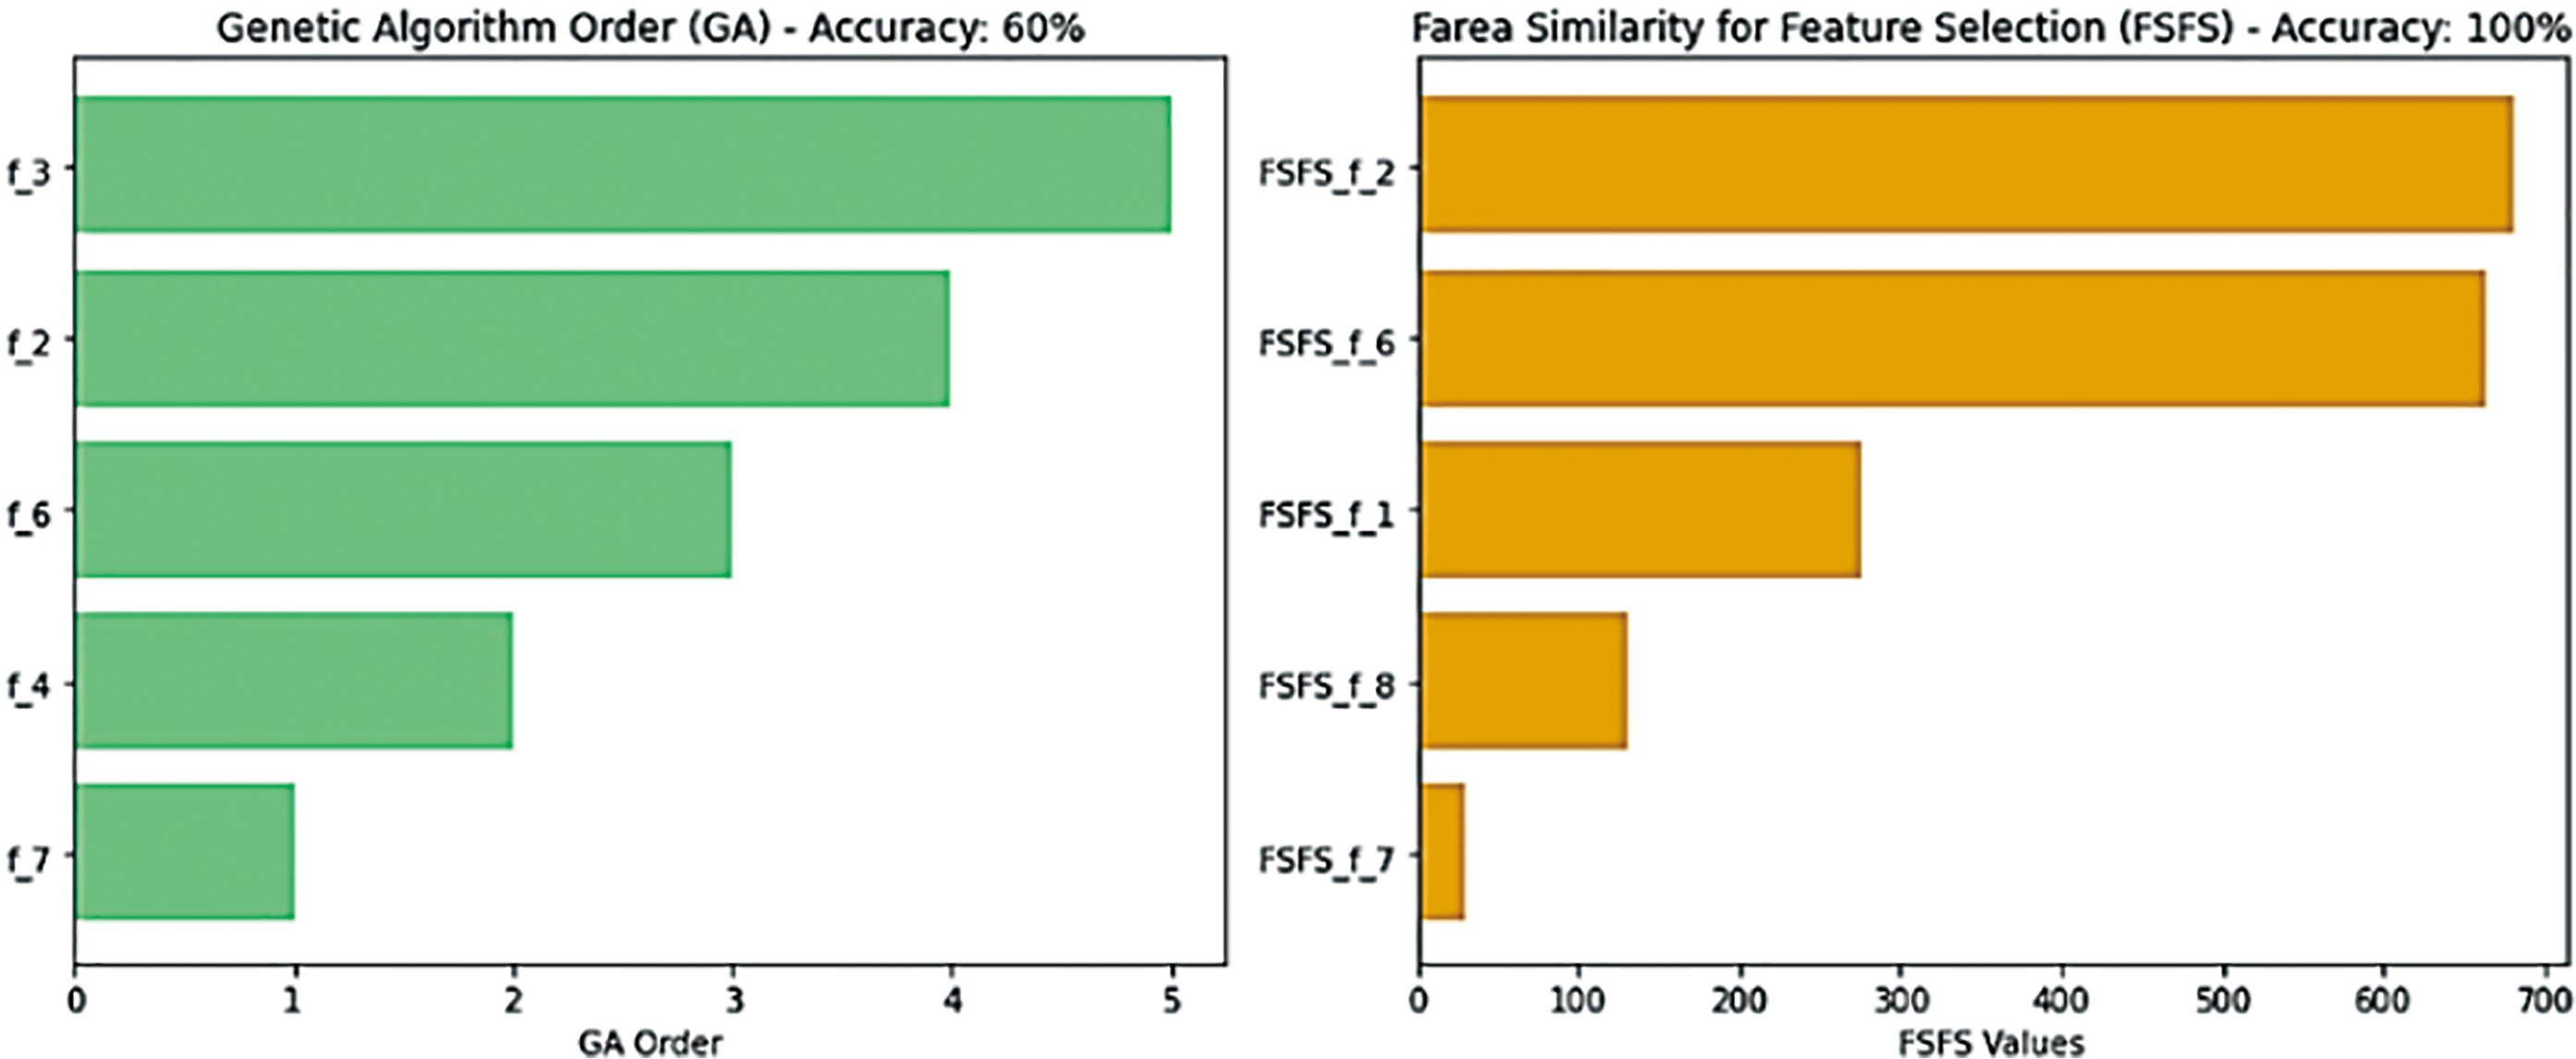
Figure 6: FSFS vs. CS, CC & GA on dataset
In the second scenario, a health-related dataset, referred to as the Breast Cancer Wisconsin (Original) dataset was used. This dataset was applied and evaluated using the proposed FSFS method. The dataset contains 10 features, with the ID feature excluded due to its significant deviation from the other data. The dataset comprises 699 records. The proposed FSFS method was calculated for each feature, along with the average for each record, as shown in Table 9. Table 10 presents the calculation of similarity based on the proposed FSFS theory applied to the dataset. It is observed that features f3, f4, f6, f8, and f9 were classified as highly significant, while features f1, f2, f5 and f7 showed lower similarity and correlation. The features were automatically classified based on the FSFS proposed threshold. Additionally, the chart illustrates the relationship between the total number of features and the correlation within the proposed FSFS framework. Fig. 7 illustrates the relation between the sum and FSFS values for similarity. Table 11 ranks the importance of the features, with feature f9 being the most important, while feature f1 is the most distinct, having the lowest similarity and correlation. Overall, the features are ranked in terms of importance, similarity, and correlation from highest to lowest as follows: f9, f4, f3, f6, f8, f2, f5, f7, and f1, respectively. Fig. 8 shows the distribution of significant and insignificant data within the Breast Cancer Wisconsin (Original) dataset, while Fig. 9 illustrates the feature importance rankings in the same dataset. Features with lower FSFS values are considered more important, as they lie below the FSFS average line, while higher values correspond to less important features. Lower FSFS values indicate smaller output differences, which reflect a higher similarity among features. Therefore, features with the smallest FSFS values are those most closely aligned and have the greatest impact on the model’s outcomes. Table 12 presents a comparative analysis of the proposed FSFS method and theory against several other feature selection techniques, such as the Genetic Approach, Exhaustive Approach, and Greedy Stepwise Approach. The number of selected features varies among these methods, influenced by their underlying principles, methodologies, and statistical formulations. Notably, the FSFS method identified only five features, namely f9, f4, f3, f6, and f8, as highly significant and impactful on the model’s outcomes. This represents the smallest feature subset selected by any of the methods, yet it consistently outperformed the others in terms of evaluation metrics. Fig. 10 presents a comparative analysis of the proposed FSFS theory against other feature selection techniques, visualizing accuracy and the number of features selected by each method. The RF classifier integrated with the FSFS approach achieved an accuracy of 97.81% on the Breast Cancer Wisconsin (Original) dataset, along with a precision of 97.2%, recall of 98.1%, and an F1-score of 97.7%.
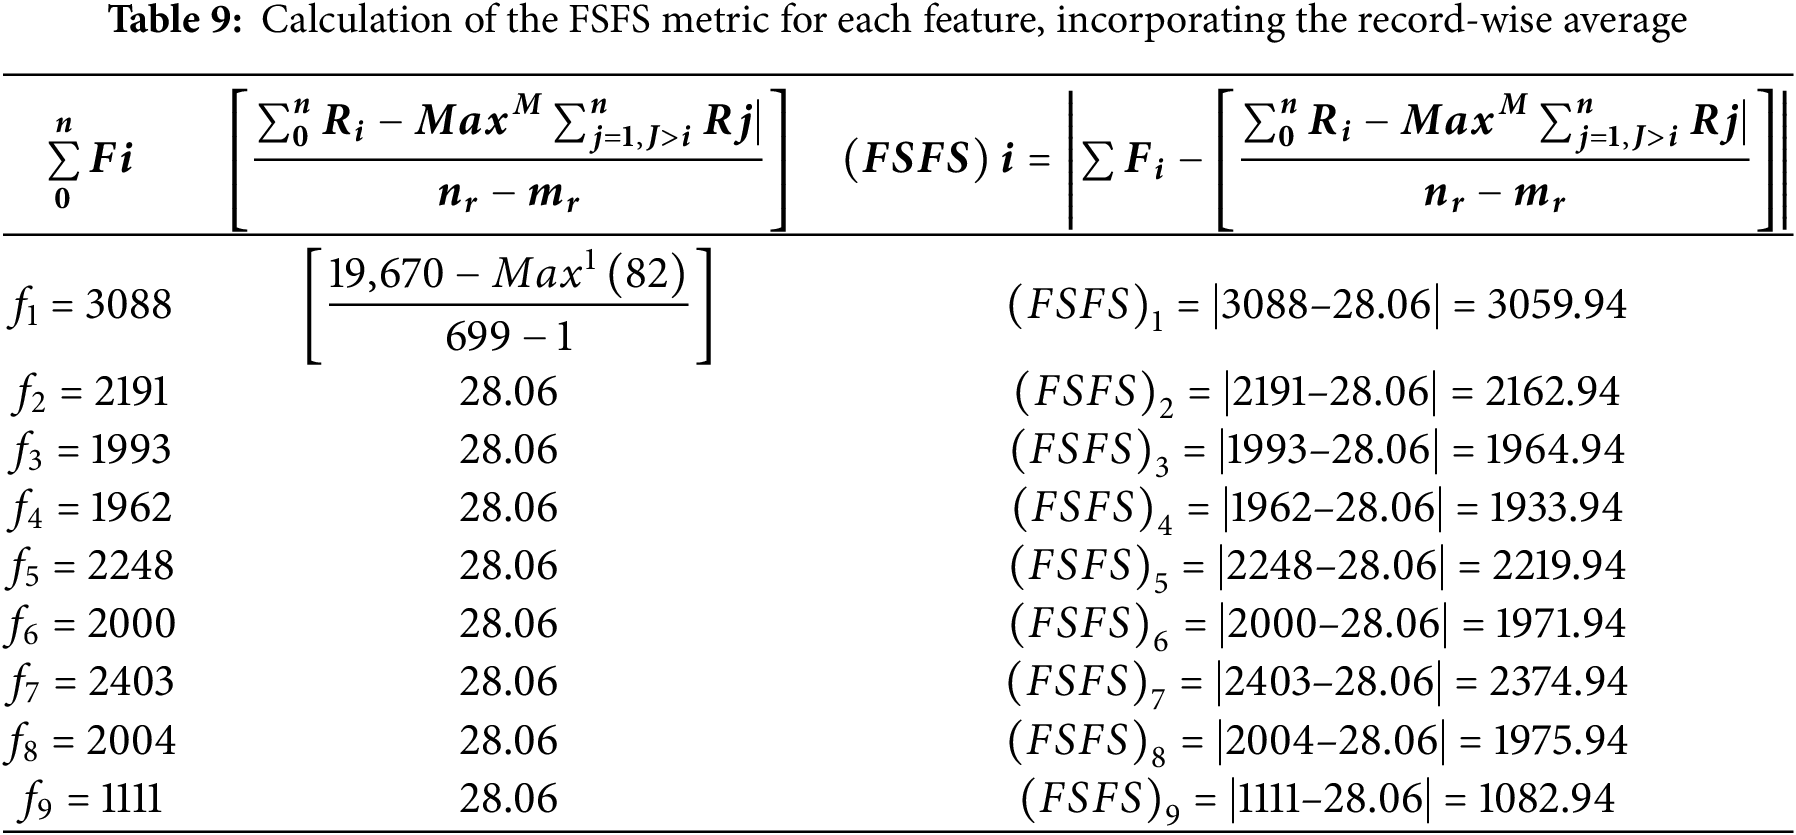
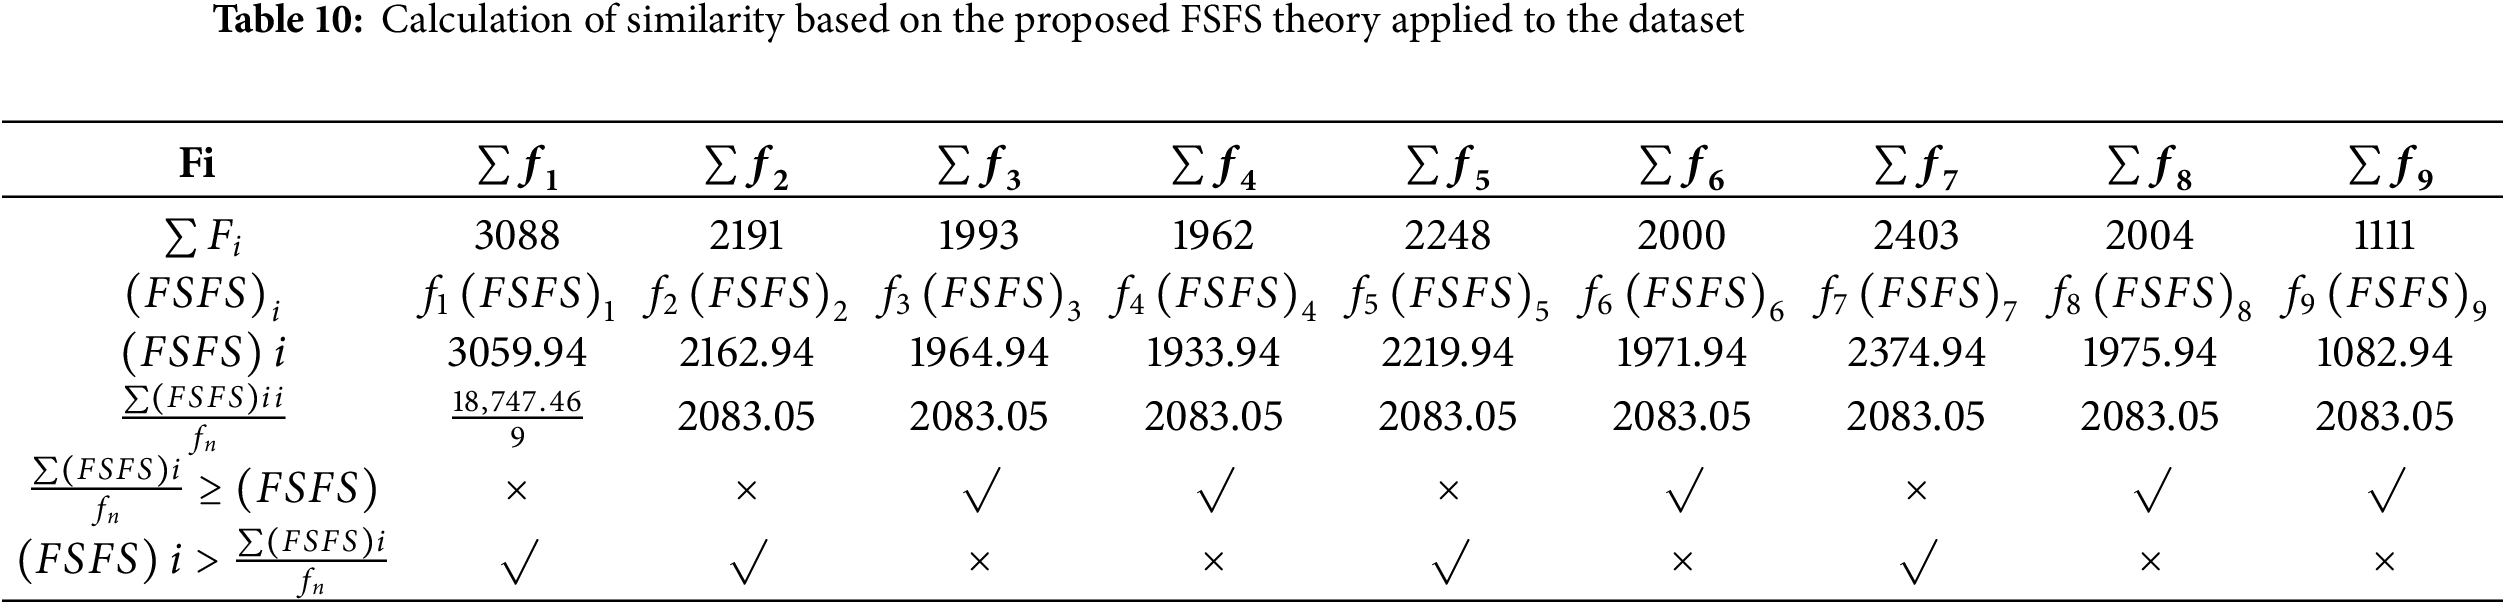
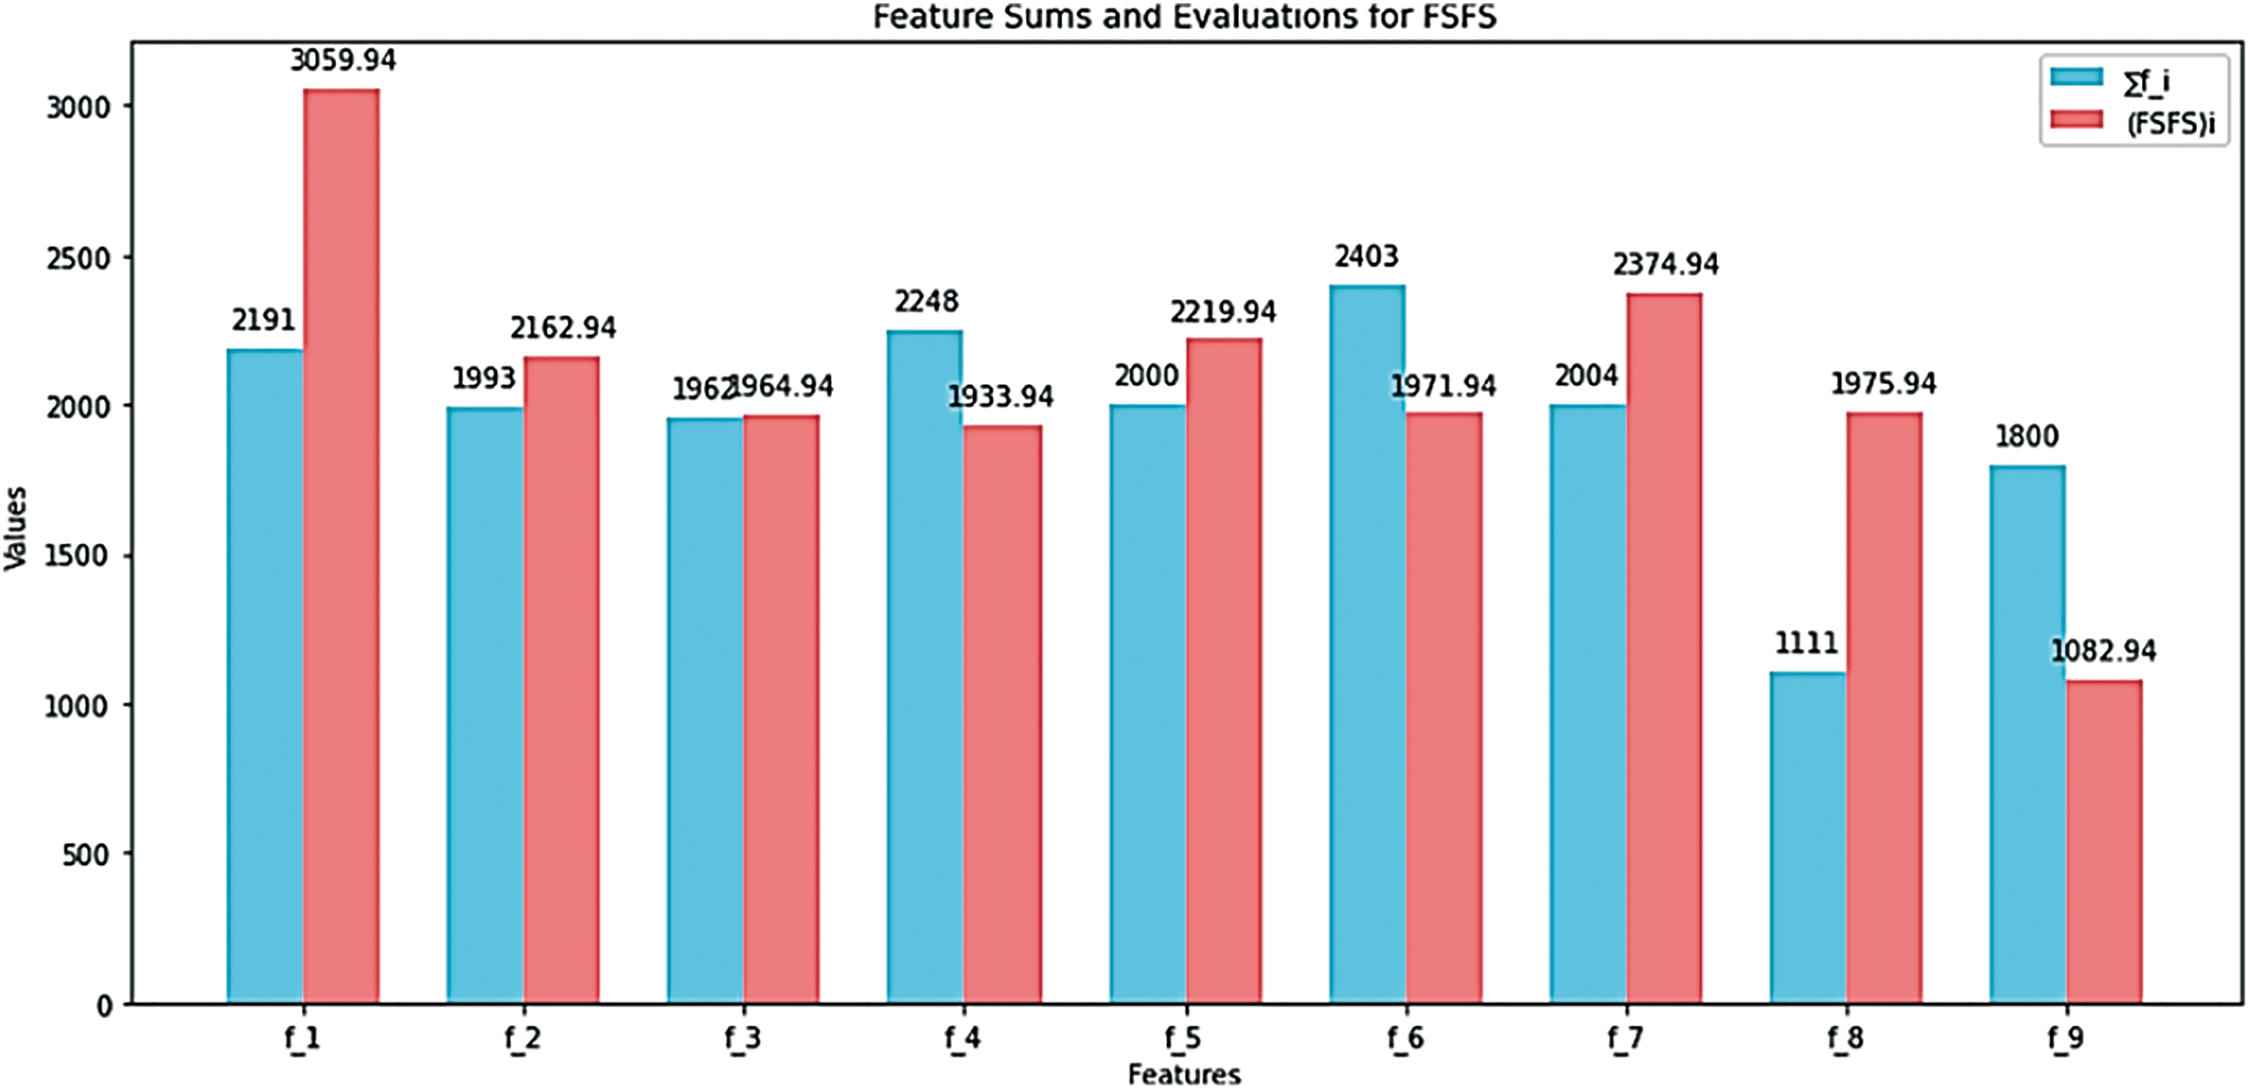
Figure 7: Relationship between the sum and FSFS values for similarity
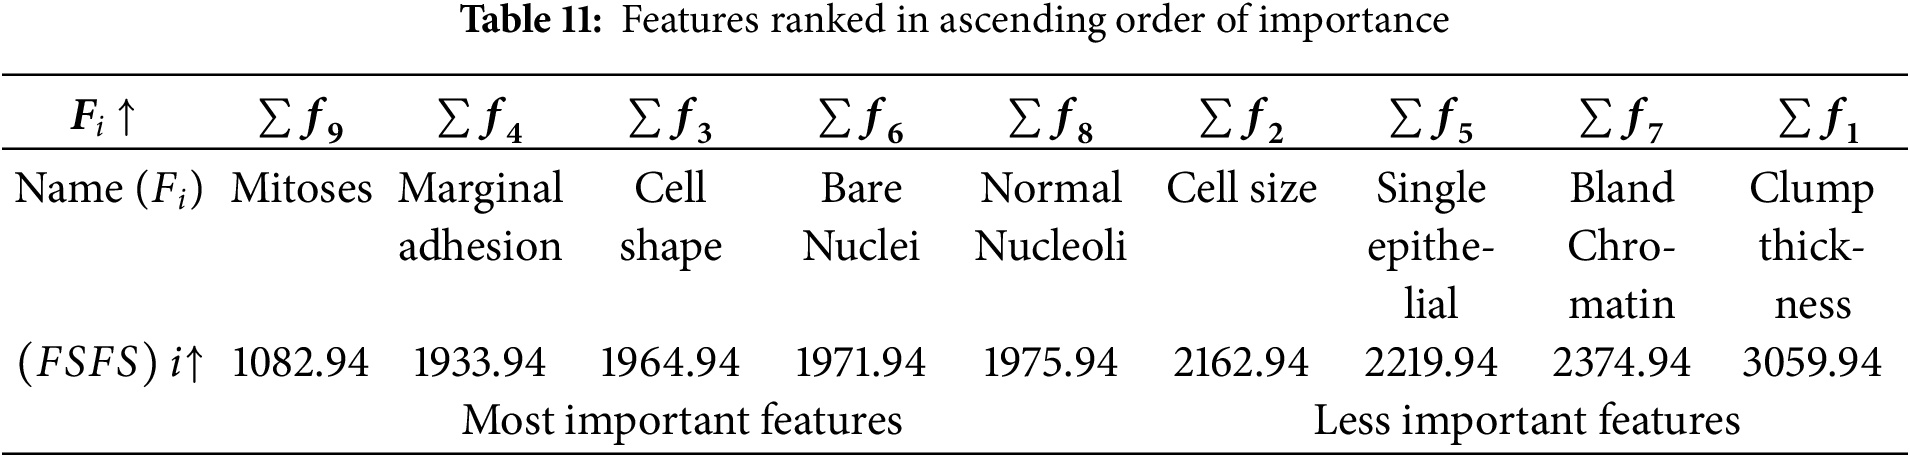
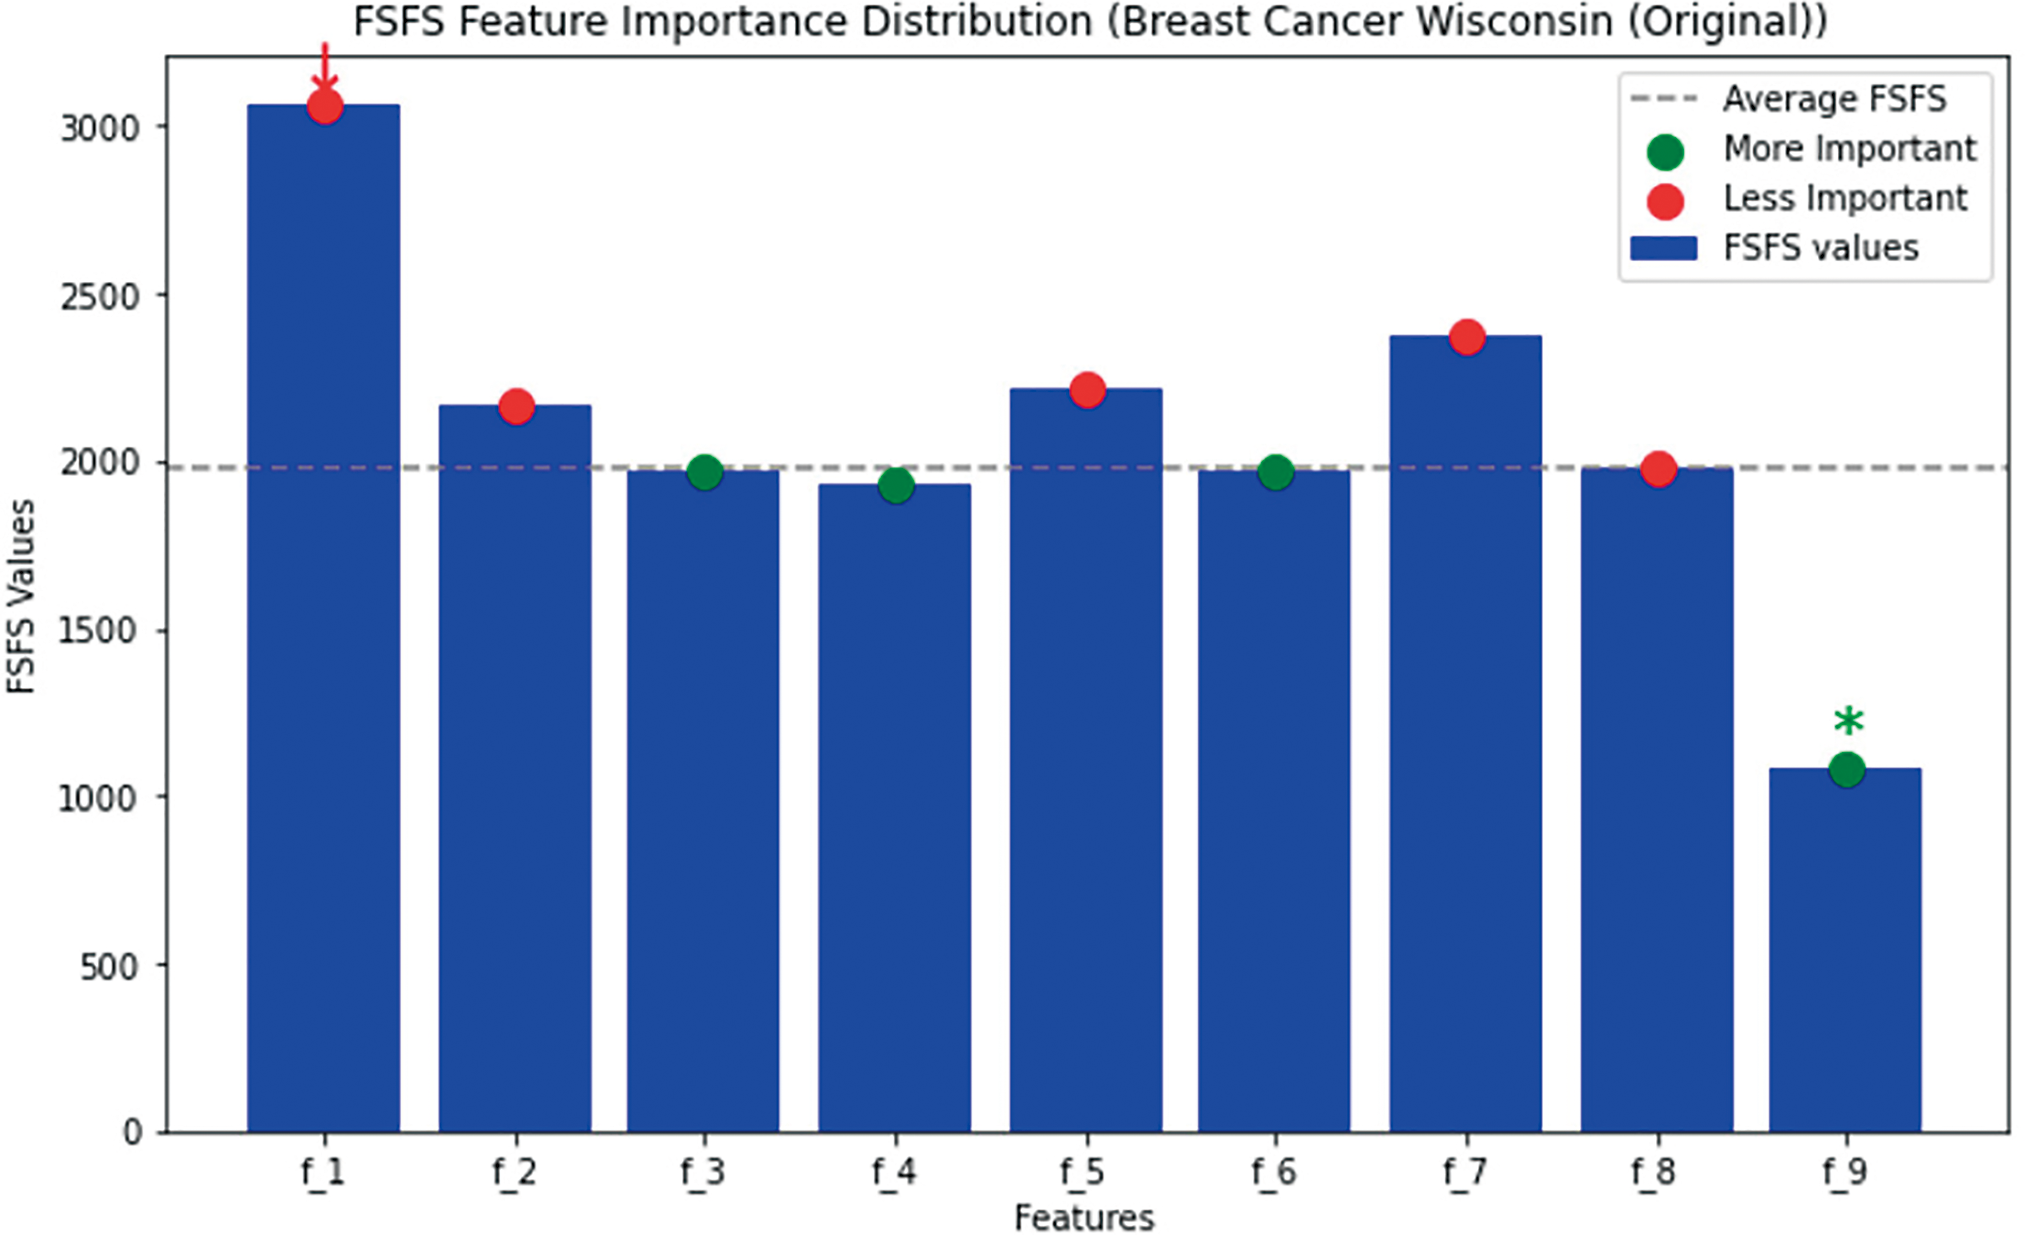
Figure 8: Distribution of data classified as significant and insignificant by the FSFS method
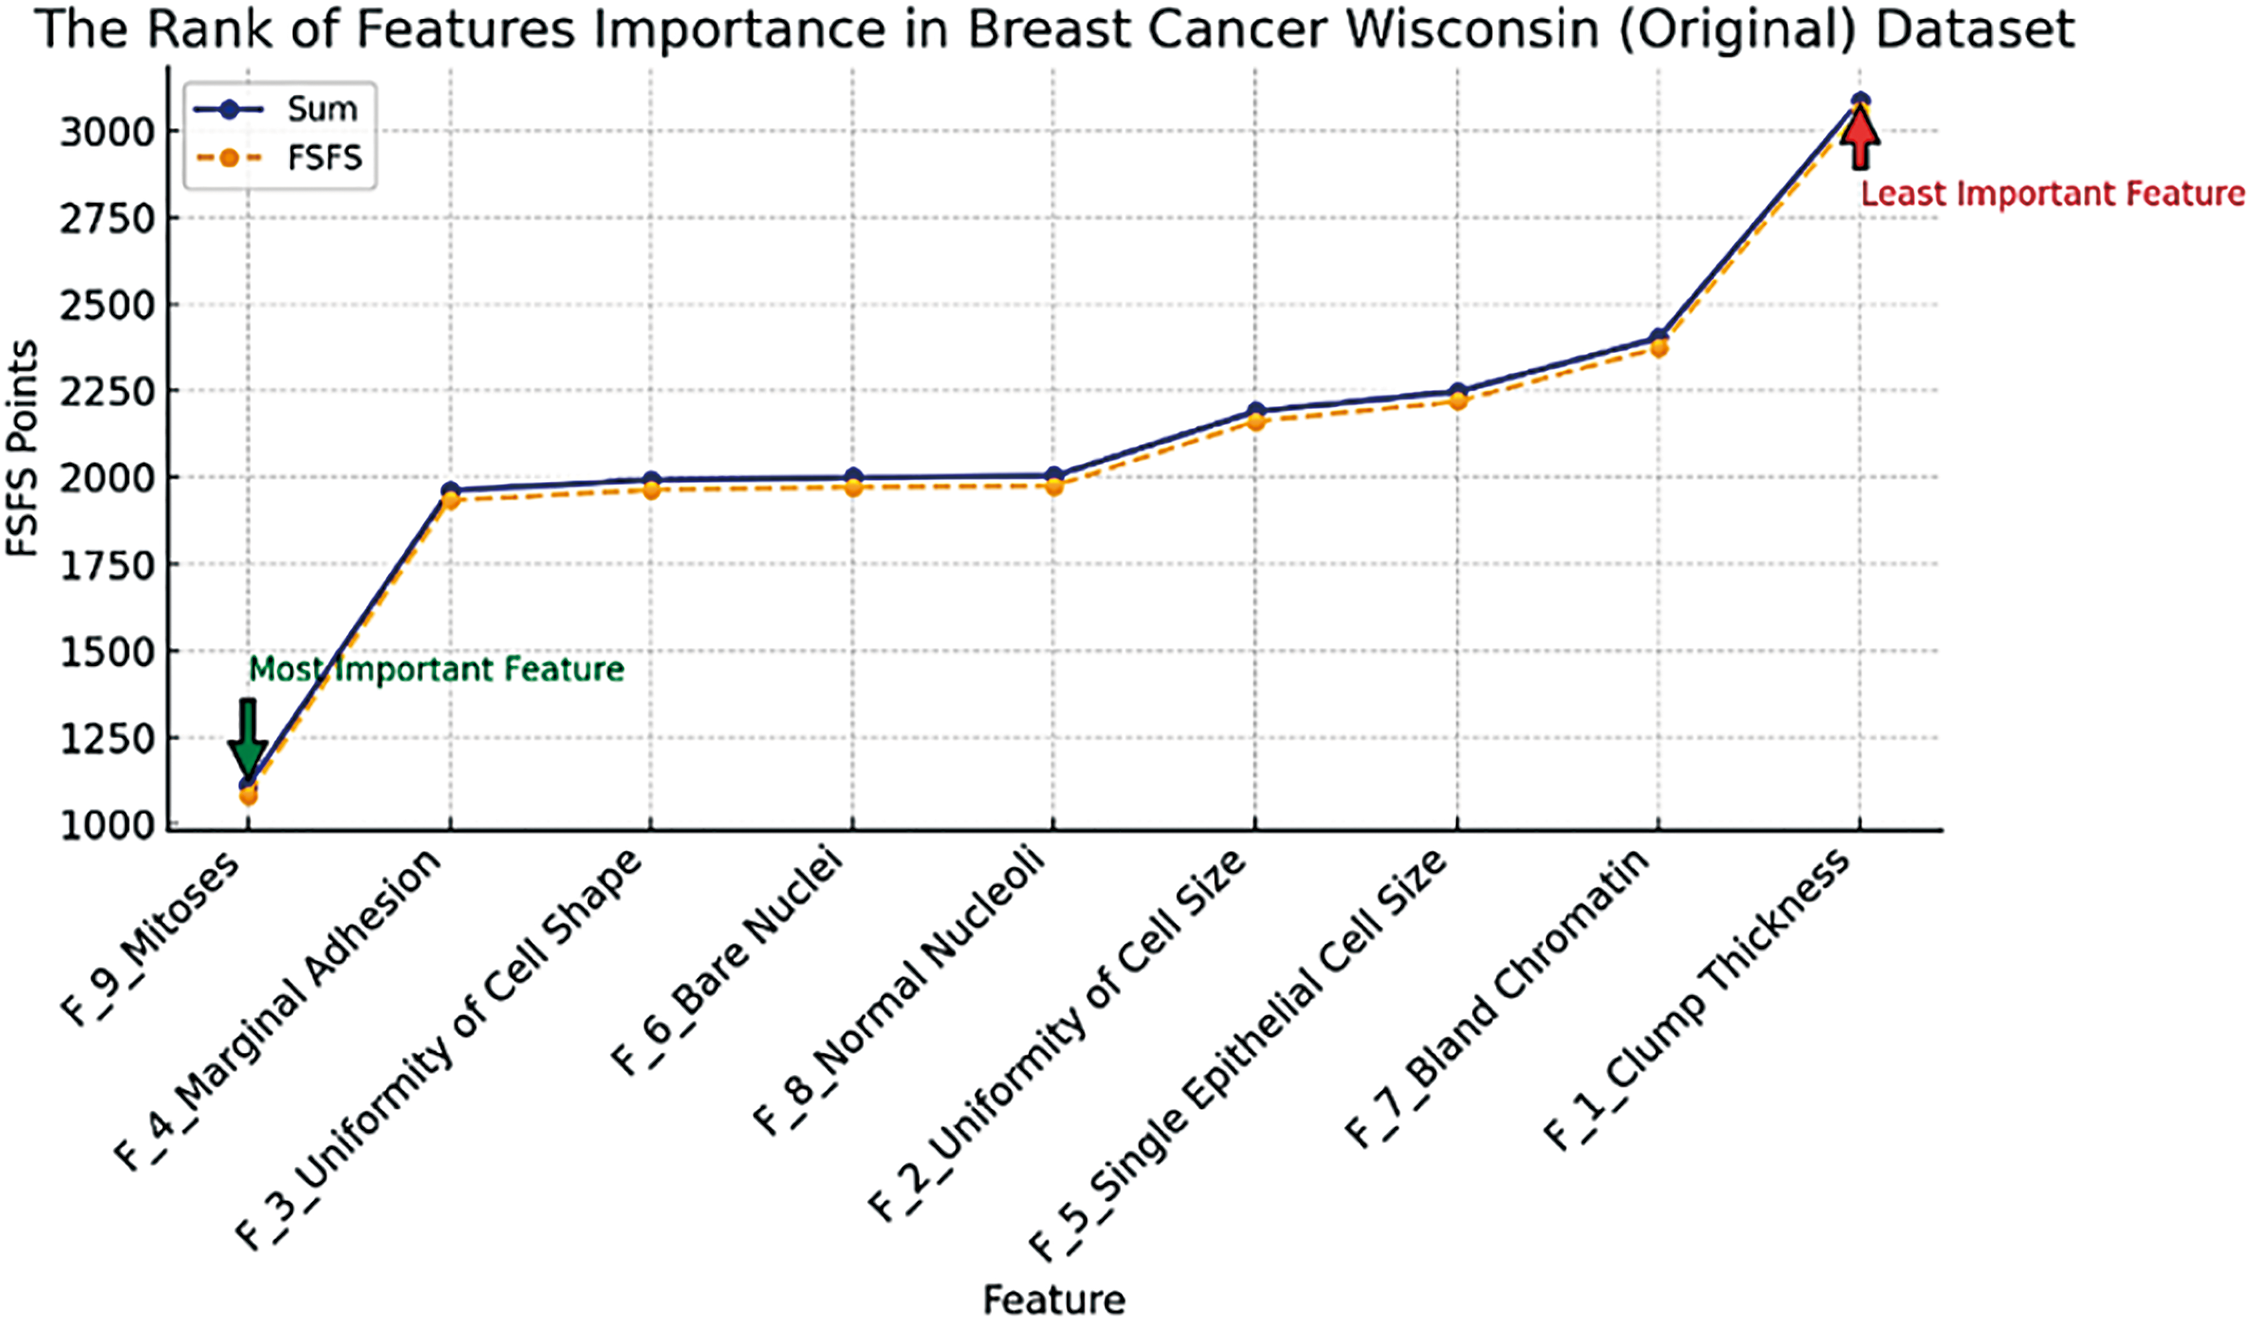
Figure 9: Rank of features importance in Breast Cancer Wisconsin (Original) dataset
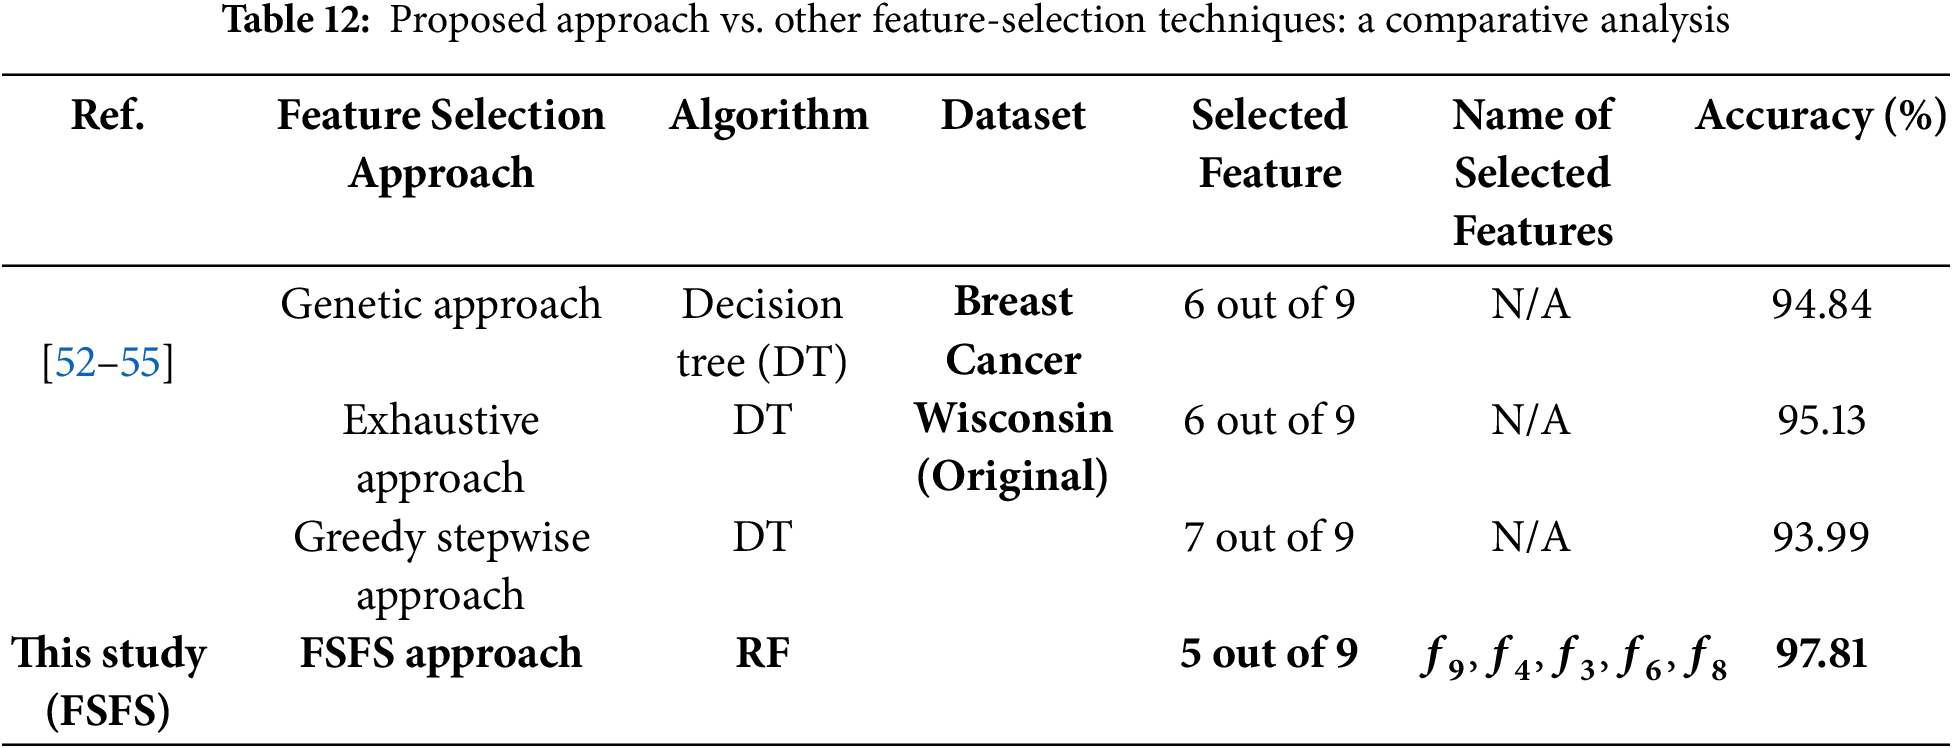
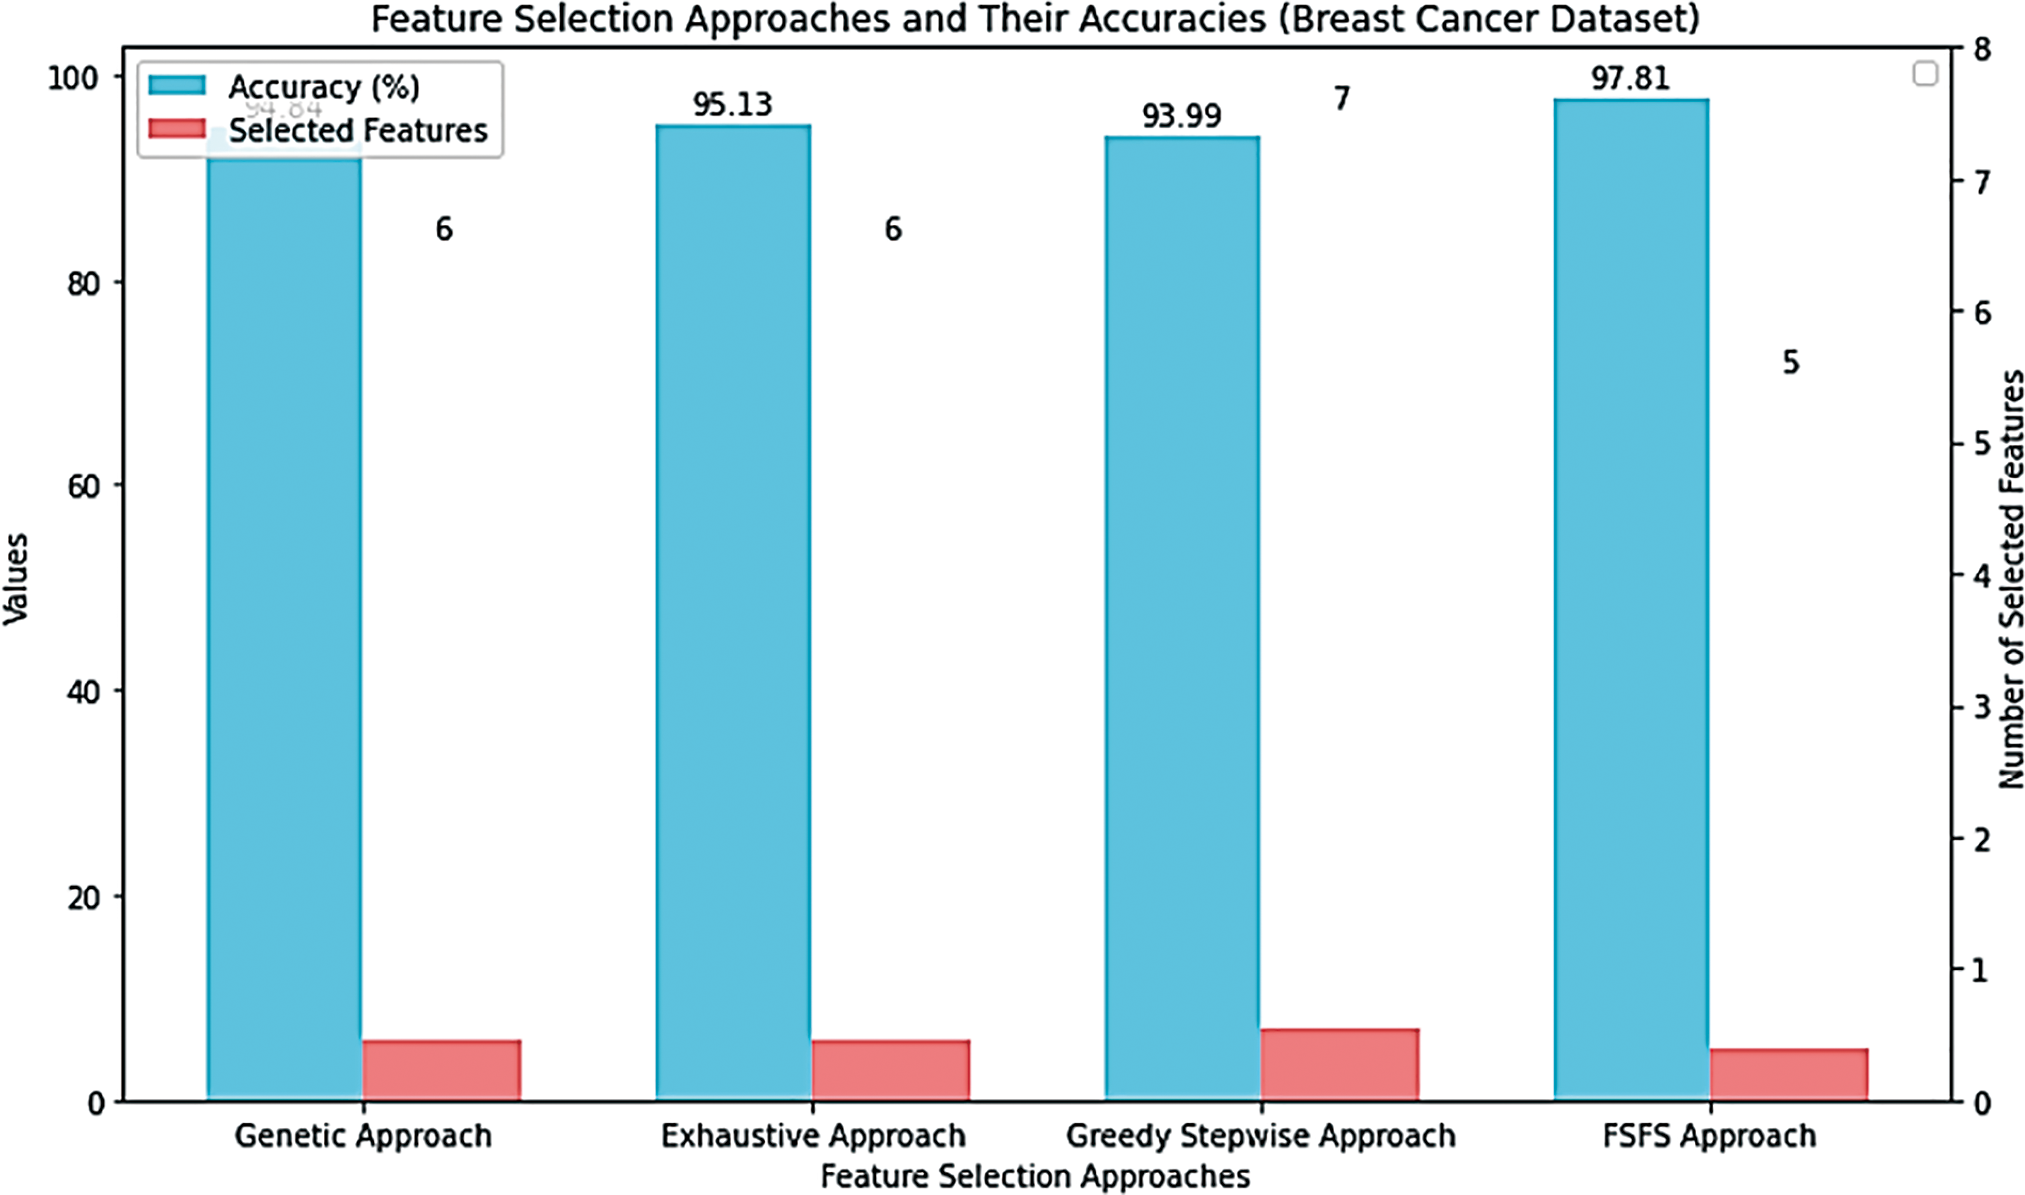
Figure 10: Comparative analysis of the proposed FSFS theory against other FS techniques
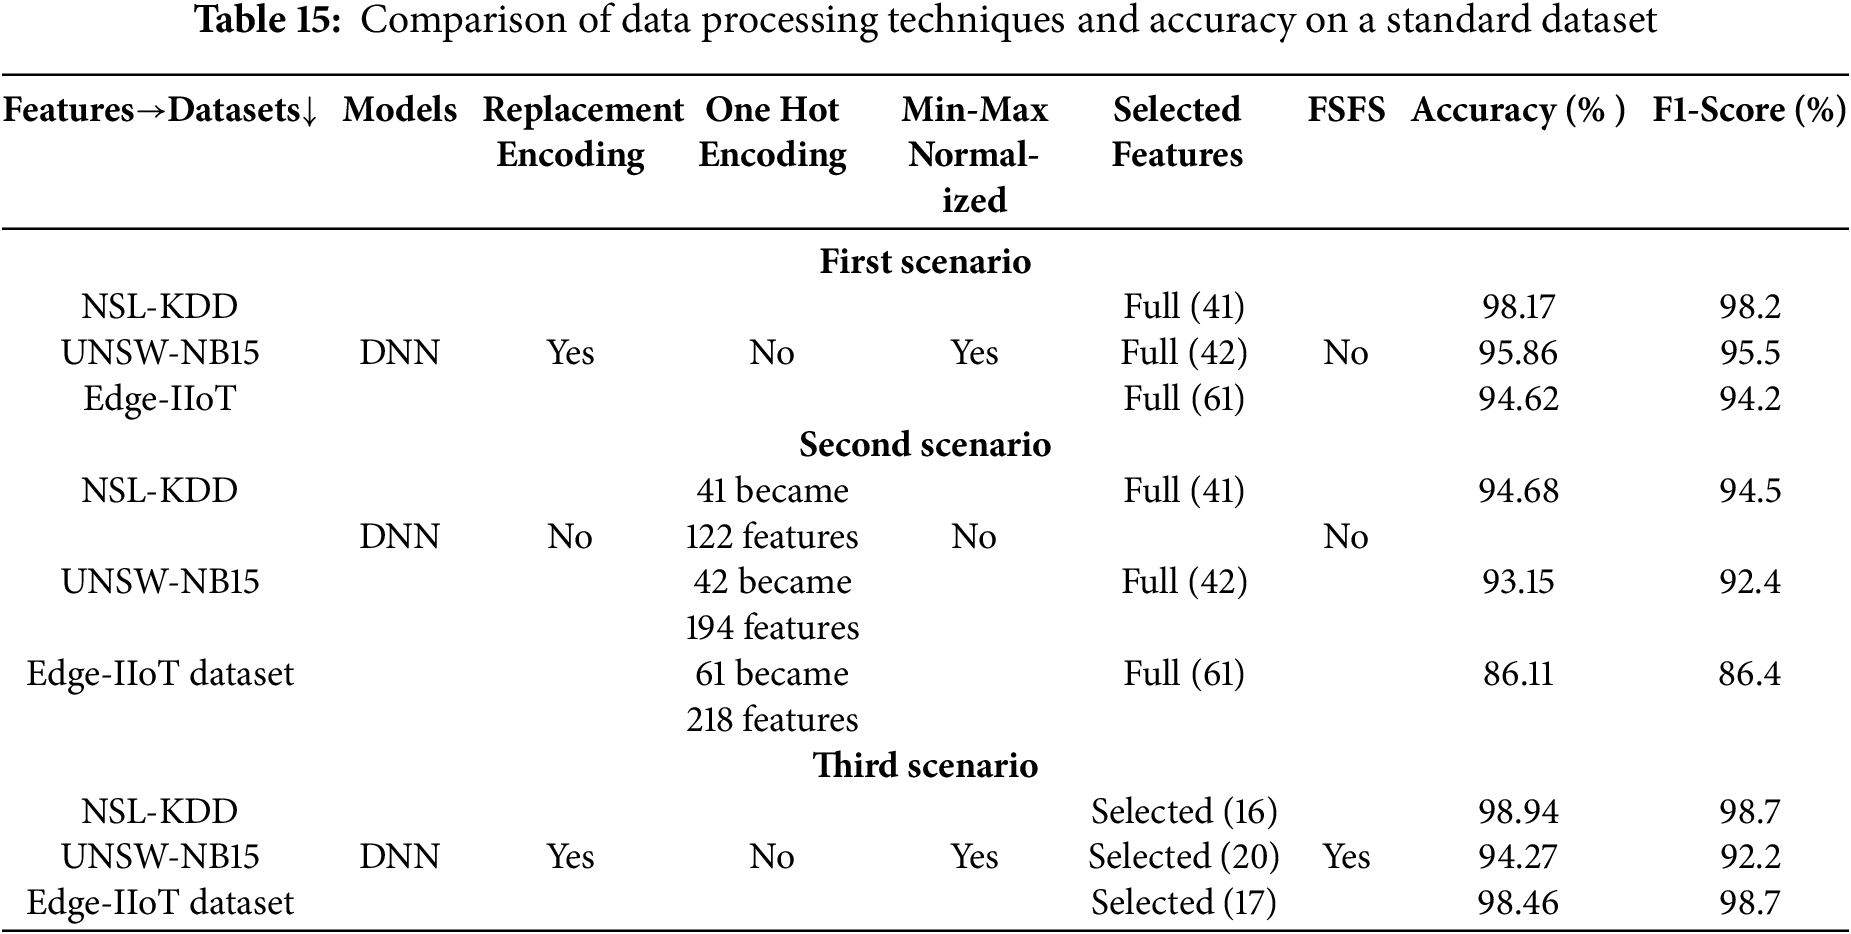
In this scenario, a cybersecurity-focused dataset known as the KDD CUP 1999 DATASET was employed. This dataset, consisting of 41 features and 4,000,000 instances, was subjected to the proposed FSFS method. The FSFS metric was calculated for each feature, and an average FSFS score was determined for each record, as presented in Table 13. The proposed FSFS theory selected only eight features from the total 41, prioritizing those with the highest significance and correlation. In this scenario, the eight features were selected using the same mechanism as in the first and second scenarios, and the proposed FSFS method was applied for the calculations, as outlined step by step in the earlier scenarios. The features identified as most impactful, ranked from highest to lowest according to the FSFS theory, are f4, f1, f23, f9, f22, f3, f11, and f19. Feature f4 (flag) is the most significant, while f19 (Num access files) is the least, as depicted in Fig. 11. The corresponding labels for these features are flag, Duration, count, Urgent, Is guest login, Service, Number failed logins, Num access files, Is host login, and Logged in, … , etc., respectively. Notably, 31 features were deemed insignificant and discarded by the FSFS approach. Table 14 presents a comparative analysis of the proposed FSFS method and theory against several other feature selection techniques, including the CS Approach, Gain Ratio Approach, and Filtered Subset Eval Approach. The number of selected features varies among these methods, influenced by their underlying principles, methodologies, and statistical formulations. Notably, the FSFS method identified only eight features, namely f4, f1, f23, f9, f22, f3, f11, and f19, as highly significant and impactful on the model’s outcomes. The integration of the FSFS approach with the RF classifier yielded robust results on the KDD CUP 1999 dataset. Specifically, the model achieved an accuracy of 98.63%, with precision, recall, and F1-score values of 97.9%, 98.3%, and 98.5%, respectively. This demonstrates the FSFS method’s ability to select a minimal feature subset while consistently outperforming the others in terms of evaluation metrics. Fig. 12 presents a comparative analysis of the proposed FSFS theory against other feature selection techniques, visualizing the accuracy achieved and the number of features selected by each method. Table 15 presents a comparison of several data processing techniques applied to a standard dataset, all implemented on the same Deep Neural Network (DNN) model, which demonstrated superior performance compared to other models for the selected data. The results reveal that applying encoding approaches integrated with normalization techniques had a positive and direct impact on the model outputs in the first scenario. In contrast, when the one-hot encoding technique was used without normalization, the results deteriorated due to an increase in data dimensionality, which led to misclassification, as observed in the second scenario. In the third scenario, which aligns with the workflow proposed in this study, encoding mechanisms were integrated with normalization techniques and the proposed FSFS approach. This combination resulted in notable variations in performance compared to the first scenario, with improvements attributed to the selection of reliable features based on similarity. These reliable features contributed to achieving balanced outcomes. The findings underscore that encoding and normalization techniques play a crucial role in improving model performance. However, achieving high accuracy alone is insufficient unless the results are reliable, balanced and reasonable, preserving the data most critical to the model’s outputs. In this discussion, we analyze and conclude the observations and results of the proposed FSFS method, comparing it to similar techniques. The primary objective of the proposed FSFS method was to identify features that have the most significant impact—whether positive or negative—on the model outputs. These findings provide increased reliability in model outcomes, making them highly dependable for decision-making processes. Moreover, the FSFS technique is highly interpretable, making it a crucial foundation for the concept of XAI. It also contributes to the overall improvement of data-driven models’ performance. While FSFS achieves reasonably good accuracy compared to its counterparts, it stands out in its interpretability.
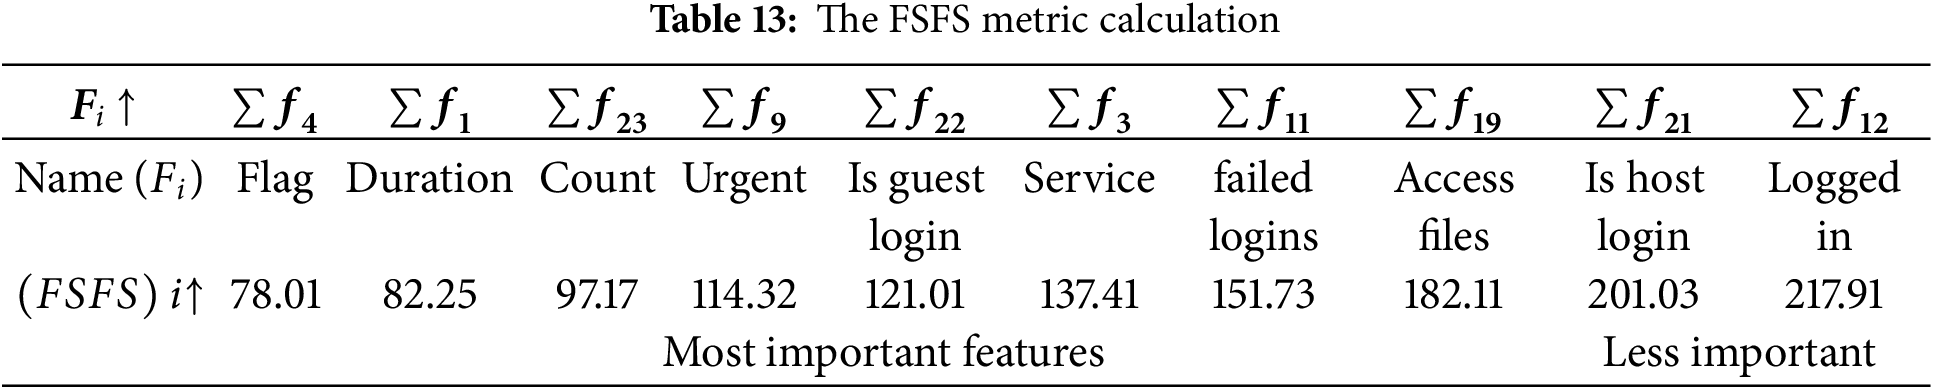
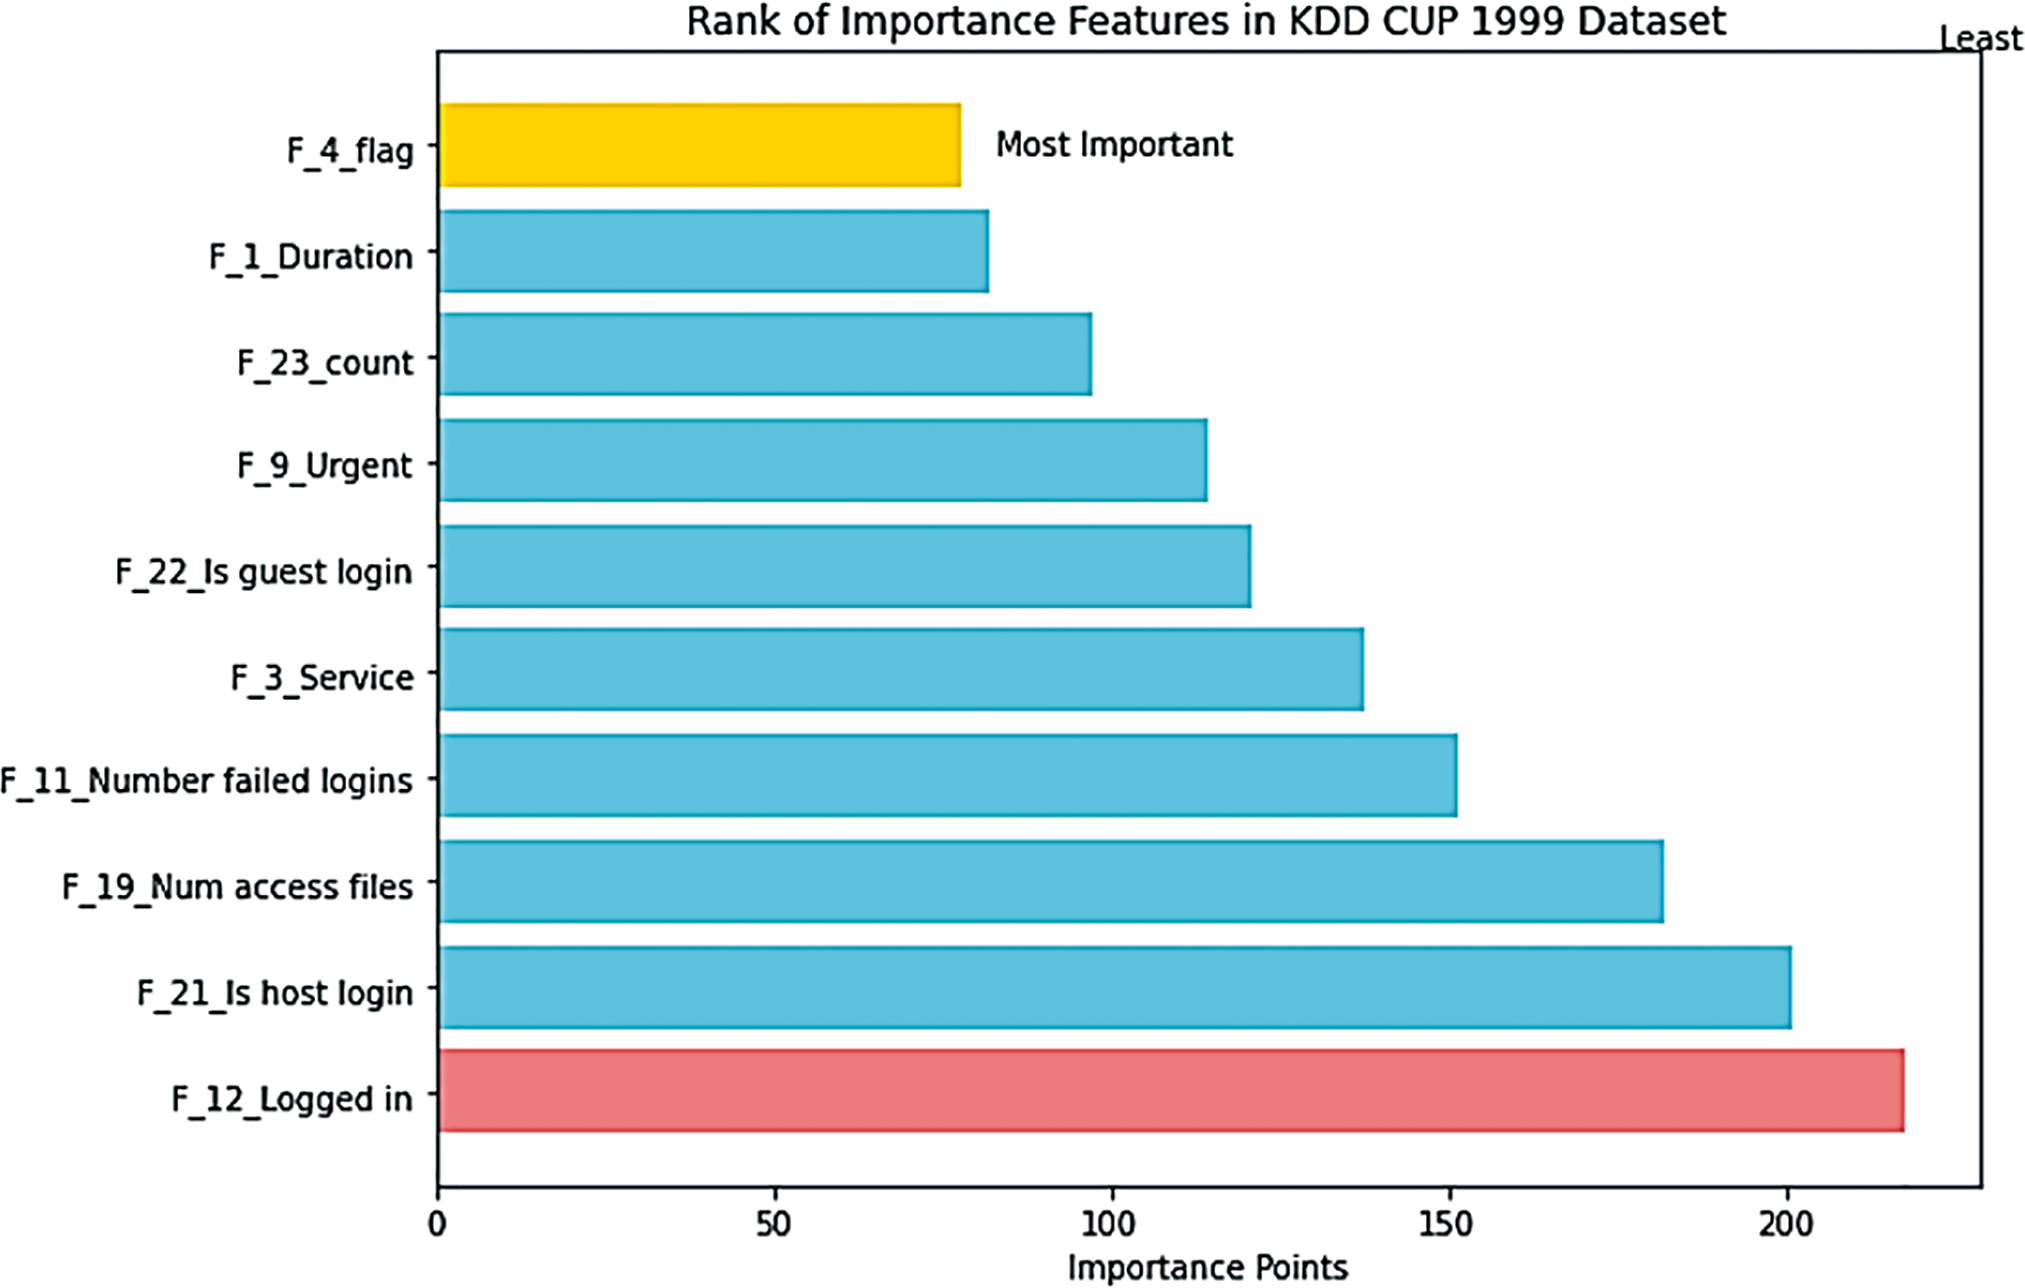
Figure 11: Features ranked by impact, from highest to lowest, according to the FSFS approach
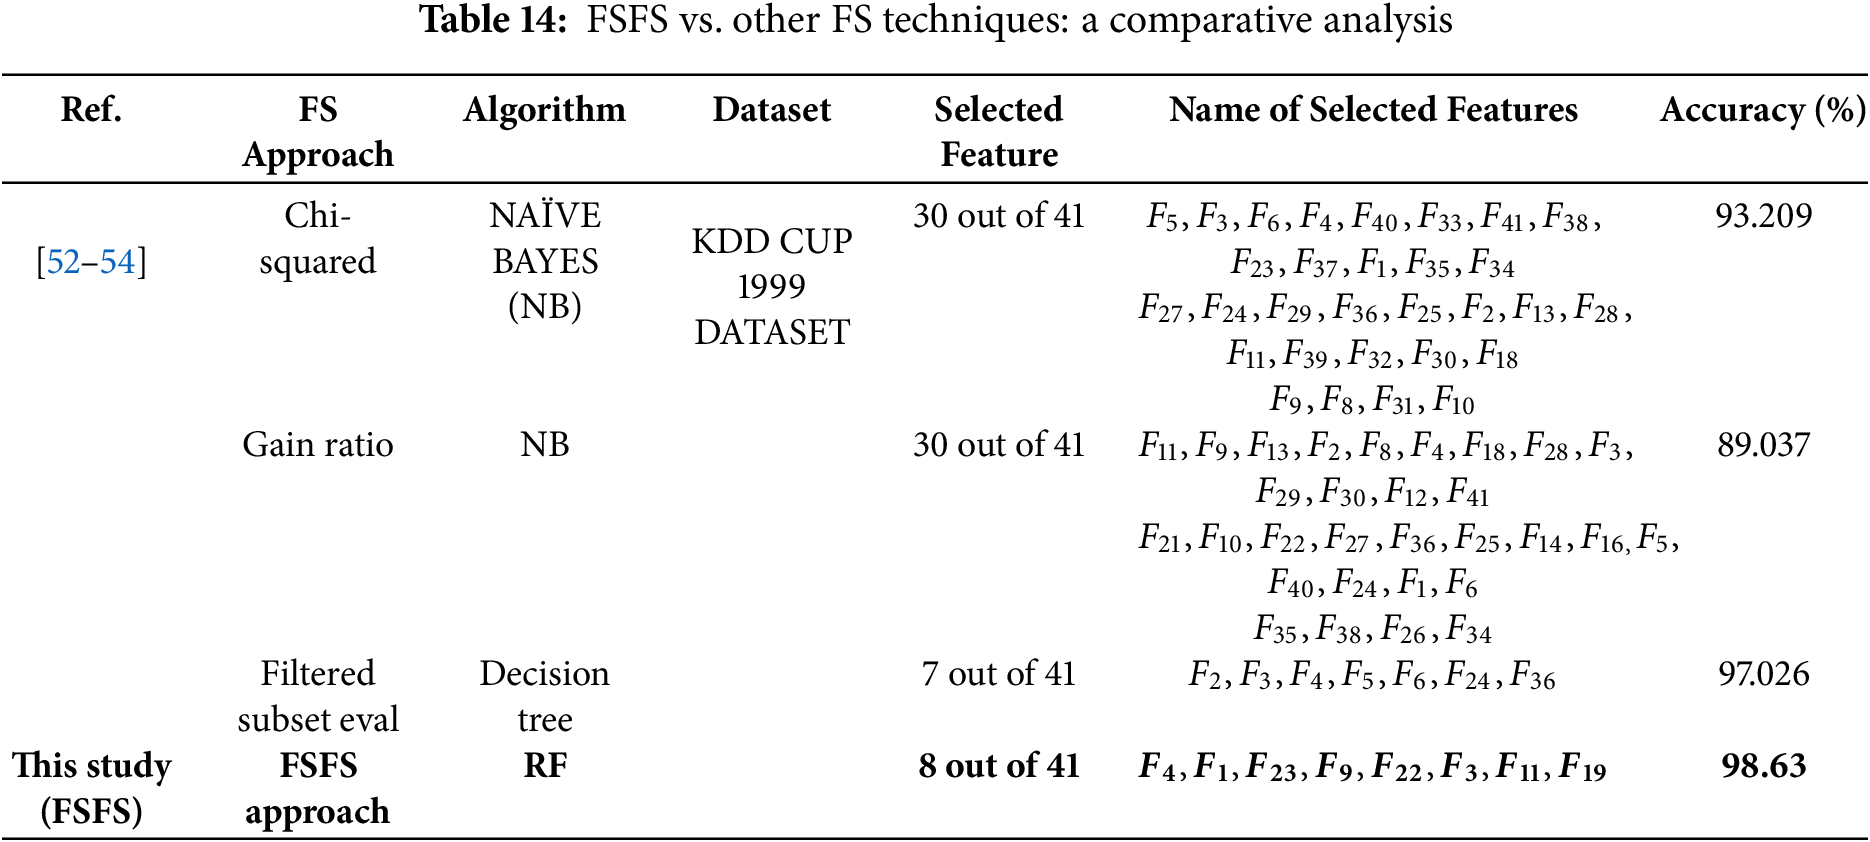
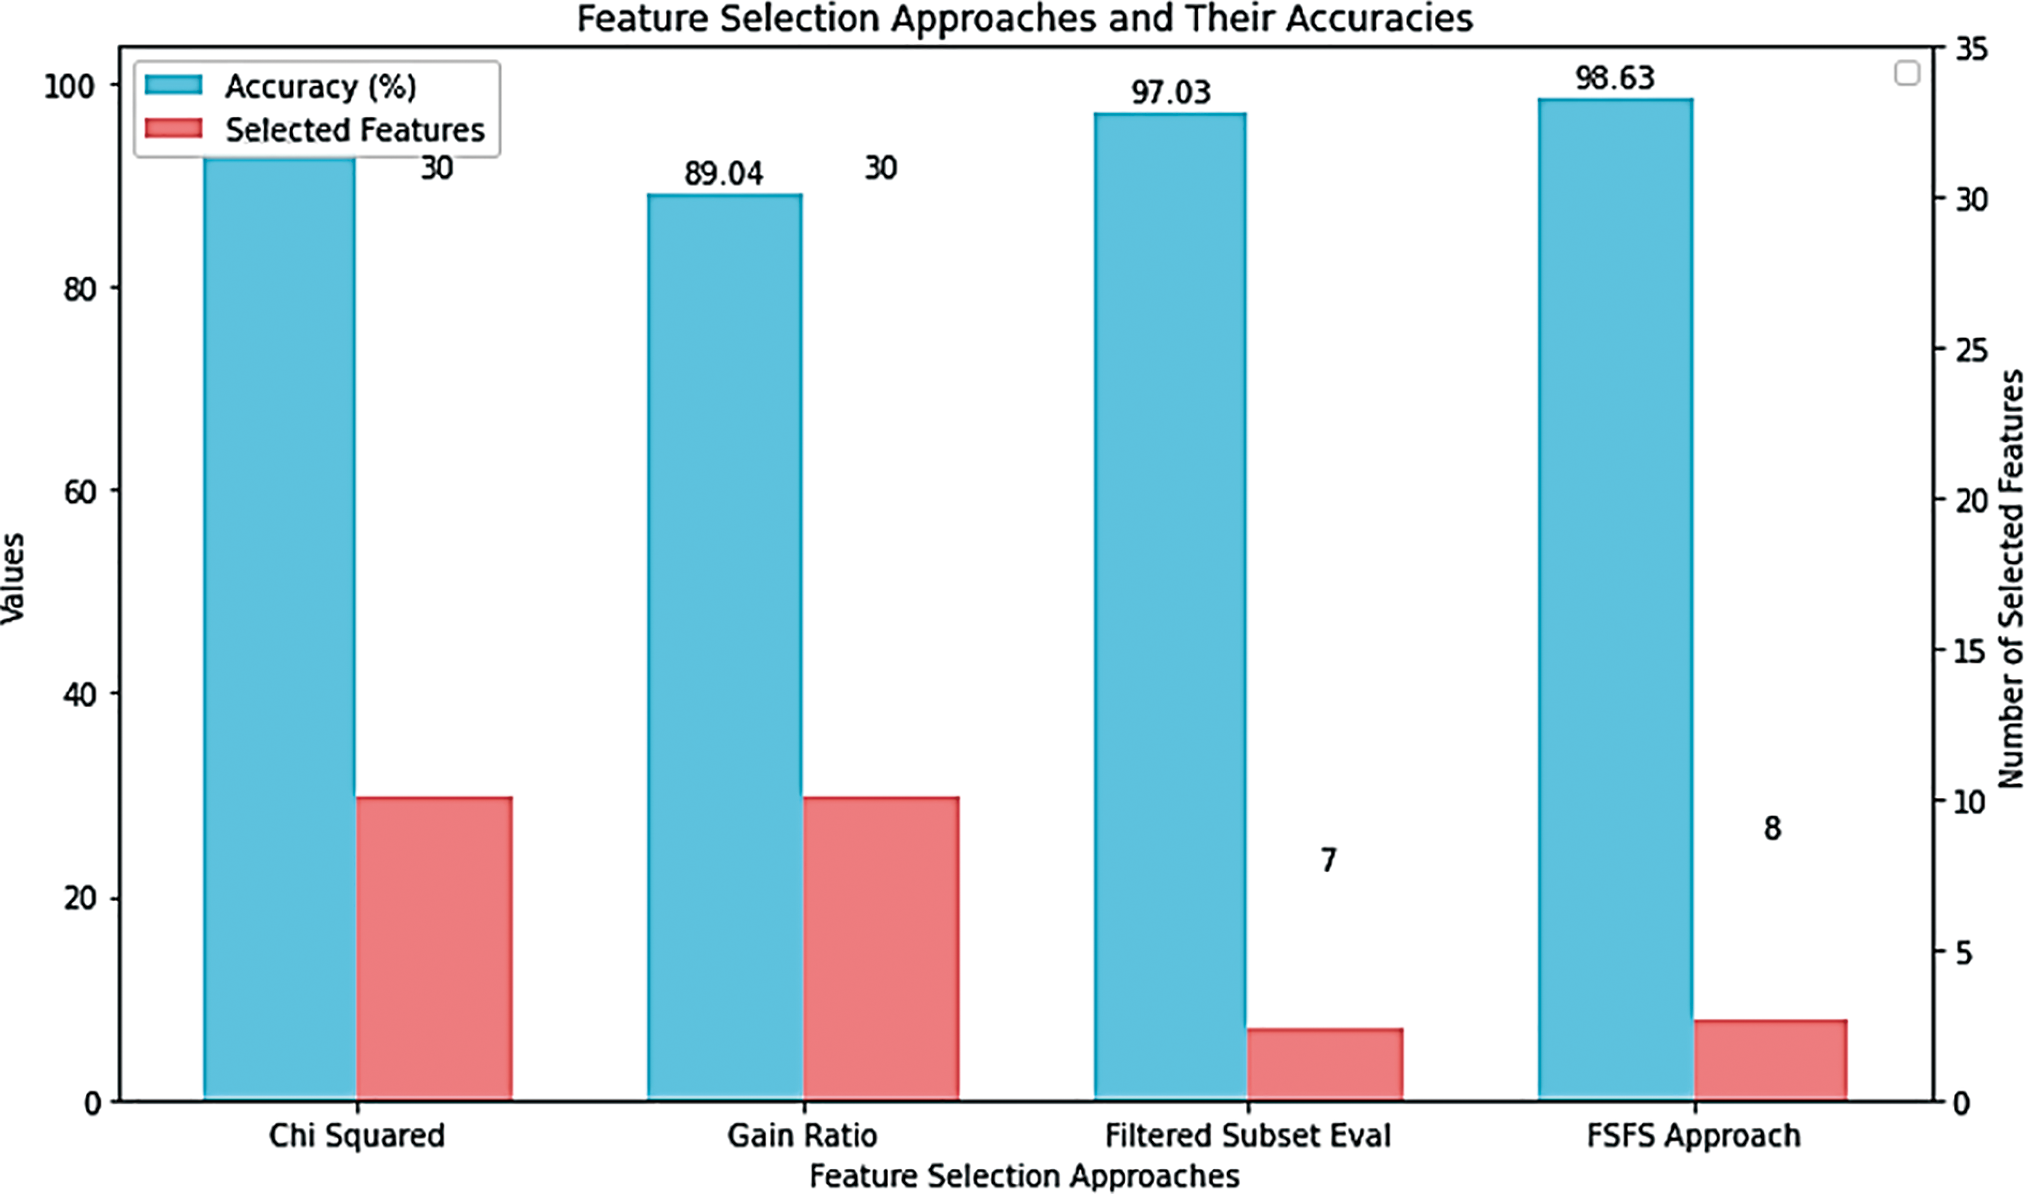
Figure 12: Comparative analysis of the proposed FSFS theory against other feature selection techniques
FS techniques range from traditional to modern, each with specific goals. They differ in how they operate and choose the most suitable features. It is observed that each method selects different features based on its mechanism of operation, but certain features are consistently ranked as more important across all feature selection techniques (FSFS, GA, CC, etc.). This indicates that differences in feature selection reflect the unique statistical principles of each technique. The most suitable features are not necessarily the most important but are often the most tailored to achieve high performance and evaluation results. Conversely, agreement on certain features among the techniques suggests common factors in the statistical processes and feature selection criteria, possibly representing the calculation of feature similarity. Some techniques focus on improving system performance by reducing data dimensions, such as CC and CS methods, which were highlighted and compared in the first and third scenarios. Others prioritize achieving high evaluation results through optimal solutions, like GA techniques, discussed in the first and second scenarios. Meanwhile, others aim to select noise-free features. Methods focused on system performance cannot often choose the most impactful features for model outputs. Conversely, less impactful features may sometimes be more critical for achieving high performance. In both cases, reducing features generally enhances performance. Some methods prioritize high evaluation results regardless of feature importance, navigating through feature selection to find optimal solutions, resulting in high accuracy but overlooking crucial features. However, feature navigation does not always guarantee high results. Therefore, techniques that prioritize high performance do not necessarily select the most important features, instead focusing on performance optimization and speed without considering feature importance in ensuring reliable outcomes. It is better to choose features that provide reliable results regardless of their accuracy level. However, in this study, selecting the most suitable and important features guarantees reliable outcomes with reasonable performance and evaluation results. The computational complexity of the FSFS approach, which utilizes the IQR method for outlier detection, is primarily driven by the sorting required for each feature. For a dataset with features (f) and records (n), sorting each feature to compute quartiles incurs a time complexity of O(n log n) per feature, resulting in an overall complexity of O(fn log n). Additional operations such as computing feature sums and correlations contribute linearly, but they are overshadowed by the sorting step. In terms of space, the method requires O(fn) to store the dataset and minimal additional space for intermediate computations. This analysis indicates that while the FSFS approach is scalable for large-sized datasets, its performance may be impacted when dealing with very large datasets due to the computational cost associated with sorting. It emphasized the dependencies and interactions among features, as characterized by similarity measures, to ensure reliable model predictions. The proposed FSFS method addresses the challenge of ensuring both performance and reliability by prioritizing the identification of similarities among features. This approach highlights the correlations between data points and selects the most relevant features, ensuring that critical information is preserved. By focusing on these relationships, FSFS enhances the reliability and trustworthiness of the results while maintaining reasonable performance levels. Thus, continuous innovation in FS techniques is essential for adapting to evolving and diverse datasets.
One limitation of the proposed FSFS method is its current applicability only to numerical data, but it can be adapted with data encoding techniques to transform data into structured numerical forms suitable for statistical operations. As a future direction for this study, FSFS is interpretable for data because it operates by calculating the difference between features and the similarity ratio. Methods based on proximity and similarity are comparable to features, allowing us to compare features based on their similarity ratios. Thus, it serves as a fundamental approach, and we strive to develop it further to become a gateway for interpretable artificial intelligence. This is referred to as evidence and feature analysis based on similarity.
Farea Similarity for Feature Selection (FSFS) is introduced as a novel statistical mechanism for feature selection. FSFS is an automated statistical method designed to identify and classify the most significant features in large-scale and data-driven AI models. FSFS not only demonstrated reliable results by selecting the features with the greatest impact on model outcomes but also effectively reduced data dimensionality without compromising accuracy. By calculating the similarity ratio between features and the approximate average of each record, FSFS systematically excluded outliers, improving the fairness and trustworthiness of feature selection.
In comparison to existing approaches, FSFS achieved a robust balanced evaluation matrix by fairly identifying the most important features, ensuring that those with the highest similarity were selected while irrelevant features were discarded. The accuracy of the best classifiers without employing the FSFS approach reached 60.00%, 95.13%, 97.02%, 98.17%, 95.86%, and 94.62% on the Experimental dataset, Breast Cancer Wisconsin (Original), KDD CUP 1999, NSL-KDD, UNSW-NB15, and Edge-IIoT datasets, respectively. However, integrating the FSFS method with data normalization, encoding, data balancing, and feature importance selection improved accuracy to 100.00%, 97.81%, 98.63%, 98.94%, 94.27%, and 98.46%. Although results fluctuated across datasets, rigorous testing against existing feature selection techniques, including CS, CC, and GA, demonstrated that FSFS excels in selecting features strongly correlated with model outcomes, enhancing its reliability and effectiveness. Notably, the significant predictive power afforded by the interplay of feature interactions and dependencies underscores the importance of explicitly modelling these relationships—a critical gap addressed by our FSFS approach. The FSFS approach, using IQR for outlier detection, is influenced by sorting-related computational complexity, making it suitable for large datasets but challenging for very large ones. A linear scan can enhance performance.
Extensive validation demonstrates the applicability of this method in data-driven domains—such as cybersecurity and healthcare—where informed and interpretable insights are paramount for reliable decision-making. By elucidating inter-feature relationships and providing a clear rationale for feature importance, FSFS establishes a robust foundation for transparent and accountable AI models, thereby facilitating their deployment in high-stakes environments.
Acknowledgement: Not applicable.
Funding Statement: The authors received no specific funding for this study.
Author Contributions: All authors—Ali Hamid Farea, Iman Askerzade, Omar H. Alhazmi, and Savaş Takan contributed to the conceptualization, literature review, methodology, data curation, implementation, validation, writing, and editing of the manuscript. All authors reviewed the results and approved the final version of the manuscript.
Availability of Data and Materials: The data are openly available in a public repository and are cited in the references.
Ethics Approval: Not applicable.
Conflicts of Interest: The authors declare no conflicts of interest to report regarding the present study.
References
1. Bouktif S, Fiaz A, Ouni A, Serhani M. Optimal deep learning LSTM model for electric load forecasting using feature selection and genetic algorithm: comparison with machine learning approaches. Energies. 2018;11(7):1636. doi:10.3390/en11071636. [Google Scholar] [CrossRef]
2. Philip Chen CL, Zhang CY. Data-intensive applications, challenges, techniques and technologies: a survey on Big Data. Inf Sci. 2014;275(4):314–47. doi:10.1016/j.ins.2014.01.015. [Google Scholar] [CrossRef]
3. Zebari R, Abdulazeez A, Zeebaree D, Zebari D, Saeed J. A comprehensive review of dimensionality reduction techniques for feature selection and feature extraction. J Appl Sci Technol Trends. 2020;1(1):56–70. doi:10.38094/jastt1224. [Google Scholar] [CrossRef]
4. Leskovec J, Rajaraman A, Ullman JD. Mining of massive data sets. Cambridge, UK: Cambridge University Press; 2020. [Google Scholar]
5. Cheng X. A comprehensive study of feature selection techniques in machine learning models. Ins Comput Signal Syst. 2024;1(1):65–78. doi:10.70088/xpf2b276. [Google Scholar] [CrossRef]
6. Theng D, Bhoyar KK. Feature selection techniques for machine learning: a survey of more than two decades of research. Knowl Inf Syst. 2024;66(3):1575–637. doi:10.1007/s10115-023-02010-5. [Google Scholar] [CrossRef]
7. Schwalbe G, Finzel B. A comprehensive taxonomy for explainable artificial intelligence: a systematic survey of surveys on methods and concepts. Data Min Knowl Discov. 2024;38(5):3043–101. doi:10.1007/s10618-022-00867-8. [Google Scholar] [CrossRef]
8. Munirathinam DR, Ranganadhan M. A new improved filter-based feature selection model for high-dimensional data. J Supercomput. 2020;76(8):5745–62. doi:10.1007/s11227-019-02975-7. [Google Scholar] [CrossRef]
9. Kira K, Rendell LA. The feature selection problem: traditional methods and a new algorithm. In: Proceedings of the Tenth National Conference on Artificial Intelligence; 1992 Jul 12–16; San Jose, CA, USA. p. 129–34. [Google Scholar]
10. Franke TM, Ho T, Christie CA. The chi-square test: often used and more often misinterpreted. Am J Eval. 2012;33(3):448–58. doi:10.1177/1098214011426594. [Google Scholar] [CrossRef]
11. Guyon I, Elisseeff A. An introduction to variable and feature selection. J Mach Learn Res. 2003;3:1157–82. doi:10.5555/944919.944968. [Google Scholar] [CrossRef]
12. Chen XW, Jeong JC. Enhanced recursive feature elimination. In: Proceedings of the 6th International Conference on Machine Learning and Applications (ICMLA); 2007 Dec 13–15; Cincinnati, OH, USA. p. 429–35. doi:10.1109/ICMLA.2007.35. [Google Scholar] [CrossRef]
13. Tibshirani R. Regression shrinkage and selection via the lasso. J R Stat Soc Ser B Stat Methodol. 1996;58(1):267–88. doi:10.1111/j.2517-6161.1996.tb02080.x. [Google Scholar] [CrossRef]
14. Rashid TA, Majidpour J, Thinakaran R, Batumalay M, Dewi DA, Hassan BA, et al. NSGA-II-DL: metaheuristic optimal feature selection with deep learning framework for HER2 classification in breast cancer. IEEE Access. 2024;12:38885–98. doi:10.1109/access.2024.3374890. [Google Scholar] [CrossRef]
15. Nayak GS, Muniyal B, Belavagi MC. Enhancing phishing detection: a machine learning approach with feature selection and deep learning models. IEEE Access. 2025;13(12):33308–20. doi:10.1109/access.2025.3543738. [Google Scholar] [CrossRef]
16. Tang J, Alelyani S, Liu H. Feature selection for classification: a review. Data Classif Algorithms Appl. 2014;37:1–29. doi:10.1201/b17320. [Google Scholar] [CrossRef]
17. Sadeghian Z, Akbari E, Nematzadeh H, Motameni H. A review of feature selection methods based on meta-heuristic algorithms. J Exp Theor Artif Intell. 2025;37(1):1–51. doi:10.1080/0952813x.2023.2183267. [Google Scholar] [CrossRef]
18. Chen RC, Dewi C, Huang SW, Caraka RE. Selecting critical features for data classification based on machine learning methods. J Big Data. 2020;7(1):52. doi:10.1186/s40537-020-00327-4. [Google Scholar] [CrossRef]
19. Rong M, Gong D, Gao X. Feature selection and its use in big data: challenges, methods, and trends. IEEE Access. 2019;7:19709–25. doi:10.1109/access.2019.2894366. [Google Scholar] [CrossRef]
20. Obaid L, Hamad K, Ali Khalil M, Nassif AB. Effect of feature optimization on performance of machine learning models for predicting traffic incident duration. Eng Appl Artif Intell. 2024;131(6):107845. doi:10.1016/j.engappai.2024.107845. [Google Scholar] [CrossRef]
21. Rickert CA, Henkel M, Lieleg O. An efficiency-driven, correlation-based feature elimination strategy for small datasets. APL Mach Learn. 2023;1(1):016105. doi:10.1063/5.0118207. [Google Scholar] [CrossRef]
22. Jia W, Sun M, Lian J, Hou S. Feature dimensionality reduction: a review. Complex Intell Syst. 2022;8(3):2663–93. doi:10.1007/s40747-021-00637-x. [Google Scholar] [CrossRef]
23. Malik HK, Al-Anber NJ. Comparison of feature selection and feature extraction role in dimensionality reduction of big data. J Tech. 2023;5(1):16–24. doi:10.51173/jt.v5i1.1027. [Google Scholar] [CrossRef]
24. Abdel Majeed Y, Awadalla SS, Patton JL. Regression techniques employing feature selection to predict clinical outcomes in stroke. PLoS One. 2018;13(10):e0205639. doi:10.1371/journal.pone.0205639. [Google Scholar] [PubMed] [CrossRef]
25. Jain A, Zongker D. Feature selection: evaluation, application, and small sample performance. IEEE Trans Pattern Anal Mach Intell. 1997;19(2):153–8. doi:10.1109/34.574797. [Google Scholar] [CrossRef]
26. Hall MA. Correlation-based feature selection for machine learning [dissertation]. Hamilton, New Zealand: University of Waikato; 1999. [cited 2025 May 7]. Available from: https://www.lri.fr/~pierres/donn%E9es/save/these/articles/lpr-queue/hall99correlationbased.pdf. [Google Scholar]
27. Brown G, Pocock A, Zhao MJ, Luján M. Conditional likelihood maximisation: a unifying framework for information theoretic feature selection. J Mach Learn Res. 2012;13:27–66. [Google Scholar]
28. Peng H, Long F, Ding C. Feature selection based on mutual information criteria of max-dependency, max-relevance, and min-redundancy. IEEE Trans Pattern Anal Mach Intell. 2005;27(8):1226–38. doi:10.1109/TPAMI.2005.159. [Google Scholar] [PubMed] [CrossRef]
29. Fleuret F. Fast binary feature selection with conditional mutual information. J Mach Learn Res. 2004;5:1531–55. doi:10.5555/1005332.1044711. [Google Scholar] [CrossRef]
30. Liu H, Setiono R. Chi2: feature selection and discretization of numeric attributes. In: Proceedings of 7th IEEE International Conference on Tools with Artificial Intelligence; 1995 Nov 5–8; Herndon, VA, USA. p. 388–91. doi:10.1109/TAI.1995.479783. [Google Scholar] [CrossRef]
31. Quinlan JR. Induction of decision trees. Mach Learn. 1986;1(1):81–106. doi:10.1007/BF00116251. [Google Scholar] [CrossRef]
32. Priyatno AM, Widiyaningtyas T. A systematic literature review: recursive feature elimination algorithms. J Ilmu Pengetah Dan Teknol Komput (JITK). 2024;9(2):196–207. doi:10.33480/jitk.v9i2.5015. [Google Scholar] [CrossRef]
33. Siedlecki W, Sklansky J. A note on genetic algorithms for large-scale feature selection. Pattern Recognit Lett. 1989;10(5):335–47. doi:10.1016/0167-8655(89)90037-8. [Google Scholar] [CrossRef]
34. Mitra P, Murthy CA, Pal SK. Unsupervised feature selection using feature similarity. IEEE Trans Pattern Anal Mach Intell. 2002;24(3):301–12. doi:10.1109/34.990133. [Google Scholar] [CrossRef]
35. Zou H, Hastie T. Regularization and variable selection via the elastic net. J R Stat Soc Ser B Stat Methodol. 2005;67(2):301–20. doi:10.1111/j.1467-9868.2005.00503.x. [Google Scholar] [CrossRef]
36. Hoerl AE, Kennard RW. Ridge regression: biased estimation for nonorthogonal problems. Technometrics. 2000;42(1):80. doi:10.2307/1271436. [Google Scholar] [CrossRef]
37. Hastie T, Tibshirani R, Friedman J. The elements of statistical learning. Berlin/Heidelberg, Germany: Springer; 2009. [Google Scholar]
38. Friedman J, Hastie T, Tibshirani R. Regularization paths for generalized linear models via coordinate descent. J Stat Softw. 2010;33(1):1–22. doi:10.1145/1401890.1401893. [Google Scholar] [CrossRef]
39. Breiman L. Random forests. Mach Learn. 2001;45(1):5–32. [Google Scholar]
40. Whitney AW. A direct method of nonparametric measurement selection. IEEE Trans Comput. 1971;C-20(9):1100–3. doi:10.1109/T-C.1971.223410. [Google Scholar] [CrossRef]
41. Miller A. Subset selection in regression. Boca Raton, FL, USA: CRC Press; 2002. [Google Scholar]
42. Hocking RR. A biometrics invited paper. the analysis and selection of variables in linear regression. Biometrics. 1976;32(1):1. doi:10.2307/2529336. [Google Scholar] [CrossRef]
43. Jolliffe IT. Principal component analysis. 2nd ed. Berlin/Heidelberg, Germany: Springer; 2002. [Google Scholar]
44. Abdi H, Williams LJ. Principal component analysis. Wires Comput Stat. 2010;2(4):433–59. doi:10.1002/wics.101. [Google Scholar] [CrossRef]
45. Pudil P, Novovičová J, Kittler J. Floating search methods in feature selection. Pattern Recognit Lett. 1994;15(11):1119–25. doi:10.1016/0167-8655(94)90127-9. [Google Scholar] [CrossRef]
46. Kohavi R, John GH. Wrappers for feature subset selection. Artif Intell. 1997;97(1–2):273–324. doi:10.1016/S0004-3702(97)00043-X. [Google Scholar] [CrossRef]
47. Duda RO, Hart PE, Stork DG. Pattern classification. 2nd ed. Hoboken, NJ, USA: Wiley; 2001. [Google Scholar]
48. Gu Q, Li Z, Han J. Generalized Fisher score for feature selection. In: Proceedings of the 27th Conference on Uncertainty in Artificial Intelligence (UAI 11); 2011 Jul 14–17; Barcelona, Spain. p. 266–73. [Google Scholar]
49. Wolberg W. Breast cancer Wisconsin (original) [Dataset]. Irvine, CA, USA: UCI Machine Learning Repository; 1990 [cited 2025 Jan 1]. Available from: 10.24432/C5HP4Z. [Google Scholar] [CrossRef]
50. Cup KDD. Data [Online]. Irvine, CA, USA: UCI Machine Learning Repository; 1999 [cited 2025 Jan 1]. Available from: https://archive.ics.uci.edu/ml/datasets/KDD+Cup+1999+Data. [Google Scholar]
51. Ferrag MA, Friha O, Hamouda D, Maglaras L, Janicke H. Edge-IIoTset: a new comprehensive realistic cyber security dataset of IoT and IIoT applications for centralized and federated learning. IEEE Access. 2022;10:40281–306. doi:10.21227/mbc1-1h68. [Google Scholar] [CrossRef]
52. Singh R, Kumar H, Singla RK. Analysis of feature selection techniques for network traffic dataset. In: Proceedings of the 2013 International Conference on Machine Intelligence and Research Advancement; 2013 Dec 21–23; Katra, India. p. 42–6. doi:10.1109/ICMIRA.2013.15. [Google Scholar] [CrossRef]
53. Kumar M, Nidhi, Sharma B, Handa D. Building predictive model by using data mining and feature selection techniques on academic dataset. Int J Mod Educ Comput Sci. 2022;14(4):16–29. doi:10.5815/ijmecs.2022.04.02. [Google Scholar] [CrossRef]
54. Lavanya D, Rani DKU. Analysis of feature selection with classification: breast cancer datasets. Indian J Comput Sci Eng (IJCSE). 2011;2(5):756–63. [Google Scholar]
55. Farea AH, Alhazmi OH, Kucuk K. Advanced optimized anomaly detection system for IoT cyberattacks using artificial intelligence. Comput Mater Contin. 2024;78(2):1525–45. doi:10.32604/cmc.2023.045794. [Google Scholar] [CrossRef]
Cite This Article
 Copyright © 2025 The Author(s). Published by Tech Science Press.
This work is licensed under a Creative Commons Attribution 4.0 International License , which permits unrestricted use, distribution, and reproduction in any medium, provided the original work is properly cited.
 Downloads
 Citation Tools