
 Submit a Paper
 Propose a Special lssue
 Open Access
ARTICLE
Rice Spike Identification and Number Prediction in Different Periods Based on UAV Imagery and Improved YOLOv8
1 College of Computer Science and Technology, Changchun University of Science and Technology, Changchun, 130022, China
2 Jalaid Banner National Modern Agricultural Industrial Park Management Center, Hinggan League, 137600, China
3 State Key Laboratory of Black Soils Conservation and Utilization, Northeast Institute of Geography and Agroecology, Chinese Academy of Sciences, Changchun, 130102, China
* Corresponding Authors: Hailong Li. Email: ; Xiaofeng Li. Email:
Computers, Materials & Continua 2025, 84(2), 3911-3925. https://doi.org/10.32604/cmc.2025.063820
Received 24 January 2025; Accepted 28 May 2025; Issue published 03 July 2025
 View Full Text
 Download PDF
Abstract
Rice spike detection and counting play a crucial role in rice yield research. Automatic detection technology based on Unmanned Aerial Vehicle (UAV) imagery has the advantages of flexibility, efficiency, low cost, safety, and reliability. However, due to the complex field environment and the small target morphology of some rice spikes, the accuracy of detection and counting is relatively low, and the differences in phenotypic characteristics of rice spikes at different growth stages have a significant impact on detection results. To solve the above problems, this paper improves the You Only Look Once v8 (YOLOv8) model, proposes a new method for detecting and counting rice spikes, and designs a comparison experiment using rice spike detection in different periods. The method improves the model’s ability to detect rice ears with special morphologies by introducing a Dynamic Snake Convolution (DSConv) module into the Bottleneck of the C2f structure of YOLOv8, which enhances the module’s ability to extract elongated structural features; In addition, the Weighted Interpolation of Sequential Evidence for Intersection over Union (Wise-IoU) loss function is improved to reduce the harmful gradient of low quality target frames and enhance the model’s ability to locate small spikelet targets, thus improving the overall detection performance of the model. The experimental results show that the enhanced rice spike detection model has an average accuracy of 91.4% and a precision of 93.3%, respectively, which are 2.3 percentage points and 2.5 percentage points higher than those of the baseline model. Furthermore, it effectively reduces the occurrence of missed and false detections of rice spikes. In addition, six rice spike detection models were developed by training the proposed models with images of rice spikes at the milk and wax maturity stages. The experimental findings demonstrated that the models trained on milk maturity data attained the highest detection accuracy for the same data, with an average accuracy of 96.2%, an R squared (R2) value of 0.71, and a Root mean squared error (RMSE) of 20.980. This study provides technical support for early and non-destructive yield estimation in rice in the future.Keywords
In China, agriculture serves as a foundational sector and plays a crucial role in ensuring both economic growth and societal progress [1,2]. Rice is one of the world’s major food crops, and increasing its level of rice production is crucial to guaranteeing national food security and stable economic incomes for farmers [3]. The rice spike is the organ through which the rice grain grows and is directly related to the final yield. Therefore, the accurate identification of rice spikes plays a crucial role in rice yield prediction. Conventional methods for acquiring phenotypic data of rice spikes primarily rely on manual operations. These approaches are labor-intensive, inefficient, and prone to biases introduced by human subjectivity. As the labor cost increases year by year, the cost of obtaining phenotypic data also rises annually. Therefore, it is difficult to meet the actual needs of modern precision agriculture production. Rice yield is closely related to the number, morphology, and development of rice spikes, and the phenotypic shapes of rice in different growth periods show obvious differences. So the study of rice spike detection in different periods is of great significance in achieving more accurate yield estimation and providing key data support for food security and agricultural production planning.
In recent years, UAV aerial photography detection technology has been developing rapidly and has found wide application in various scenarios, boasting such advantages as high flexibility, short image acquisition time, low cost, and high ground resolution [4]. The integration of UAVs and remote sensing technology enables high-precision, high-resolution remote sensing monitoring and data acquisition in farmland, thus giving rise to agricultural UAV remote sensing technology. This technology offers data support for agricultural information collection and represents one of the crucial development directions in precision agriculture research. Compared with satellite and aerial remote sensing, UAV remote sensing features lower dependence on weather conditions and higher resolution. In contrast to traditional monitoring methods, UAV remote sensing is more efficient and non-destructive, providing a novel tool for the applied research of remote sensing at the field scale [5–7].
Researchers have shown great interest in using deep learning techniques to detect phenotypic traits and yield prediction in rice spikes. Ramachandran and Sendhil Kumar [8] introduced a spike detection framework termed boundary-sensitive knowledge distillation. This method boosts the performance of target detection models on UAV-acquired rice spike datasets by applying feature distillation to emphasize the retention of edge-region features of rice spikes, while employing an imitation mask to differentiate spike-relevant foreground characteristics from unrelated background content. Madec et al. [9] utilized Faster regions with convolutional neural networks (Faster R-CNN) to estimate the density of wheat spikelets with an accuracy of 91%. Qiu et al. [10] initially adopted The Simplify Optimal Transport Assignment (SimOTA) method [11] for label allocation, followed by The Attention-based Intrascale Feature Interaction (AIFI) module [12] to redesign the feature extraction layer in YOLOv5s, and finally the Channel-wise Knowledge Distillation for Dense Prediction (CWD) distillation method is used to employed to achieve a trade-off between inference speed and detection precision. Zhang et al. [13] improved the Fast R-CNN by introducing null convolution, which improves the problem of poor model detection accuracy due to the small target of rice spike, and the detection accuracy reaches 80.3%, which is improved by 2.4 percentage points compared to the pre-improvement period. Li et al. [14] used the MobilenetV3 lightweight model with an attention mechanism to replace the backbone network of YOLOv5s, and the average detection accuracy of the improved spike detection model reached 97.78%, which significantly improves the spike detection in complex environments. Although existing research has improved the detection accuracy of the target detection model through a variety of methods, most of them are designed for the detection and application of rice images at a single scale, which leads to lower accuracy and poor generalization of the model when applied to images in complex field environments. Additionally, UAV-based rice spike detection still faces challenges such as intricate field backgrounds, high rice planting density, and occlusions between rice spikes—issues that continue to push the advancement of target detection algorithms.
Therefore, this study proposes an innovative rice spike detection model based on YOLOv8, and the main contributions of the work done in this paper are as follows:
(a) Construct a brand new dataset containing images of rice at the milk and wax maturity stages taken using a UAV to further enhance the generalization ability of the model, and at the same time used to validate the applicable rice growth period of the improved target detection model in this study, and contribute to the future realization of UAV-based rice yield estimation.
(b) The more advanced snake dynamic convolution is introduced into the feature extraction network of YOLOv8, allowing it to adaptively expands or increases the receptive field based on the rice spike features. This improves the network’s ability to identify subtle rice spike features that may otherwise be overlooked.
(c) In the regression calculation of the bounding box, we filter the bounding box by using WIoU and improve the model’s detection performance for small targets on rice ears by assigning a certain weight to the small target box to synthesize a balance between standard and high-quality target boxes.
The rice spike images were collected from the field in two distinct temporal periods: the first period occurred during the milk ripening stage in mid-August 2023, while the second period was during the wax ripening stage in mid- to early-September 2023. The collection location was situated within an experimental area of the National Modern Agricultural Industrial Park of Jalaid Banner. To ensure data diversity, images were primarily captured in experimental fields with different rice varieties and planting densities. The collection equipment for the rice spike dataset was a DJI Mavic 2 UAV. The images were captured using the manual shooting mode of the drone, with its gimbal shooting angle ranging from −62° to −90°, a camera field of view (FOV) of 84°, a total of 20.48 million pixels, and a resolution of 4864 × 3648. The UAV images were collected on sunny days between 10:00 and 14:00, with the shooting height maintained at 0.5 m–1 m above the rice canopy.
2.2 Data Enhancement and Dataset Construction
To minimize the number of duplicate images and reduce the interference of non-target images during model training, manual screening was carried out for data cleaning of the collected images. As a result, a total of 149 images were obtained. Since detecting small rice spikelet targets requires a large dataset for deep learning models to extract meaningful features, data augmentation techniques such as panning, flipping, mirroring, and noise addition were applied to enhance data diversity. The data augmentation method is shown in Fig. 1. This improves the model’s generalization and helps prevent overfitting. Eventually, a dataset containing 1066 rice images is created, and the rice images are not duplicated. In this study, the LabelImg annotation tool was used to label rice spikes in the images, and the main objects of annotation were all the rice spikes within the image and the rice spikes with an area greater than 30% of the edge of the image, and the rest of the image was labeled as the background. The processed data is divided into training sets, test sets, and validation sets in the ratio of 7:2:1.
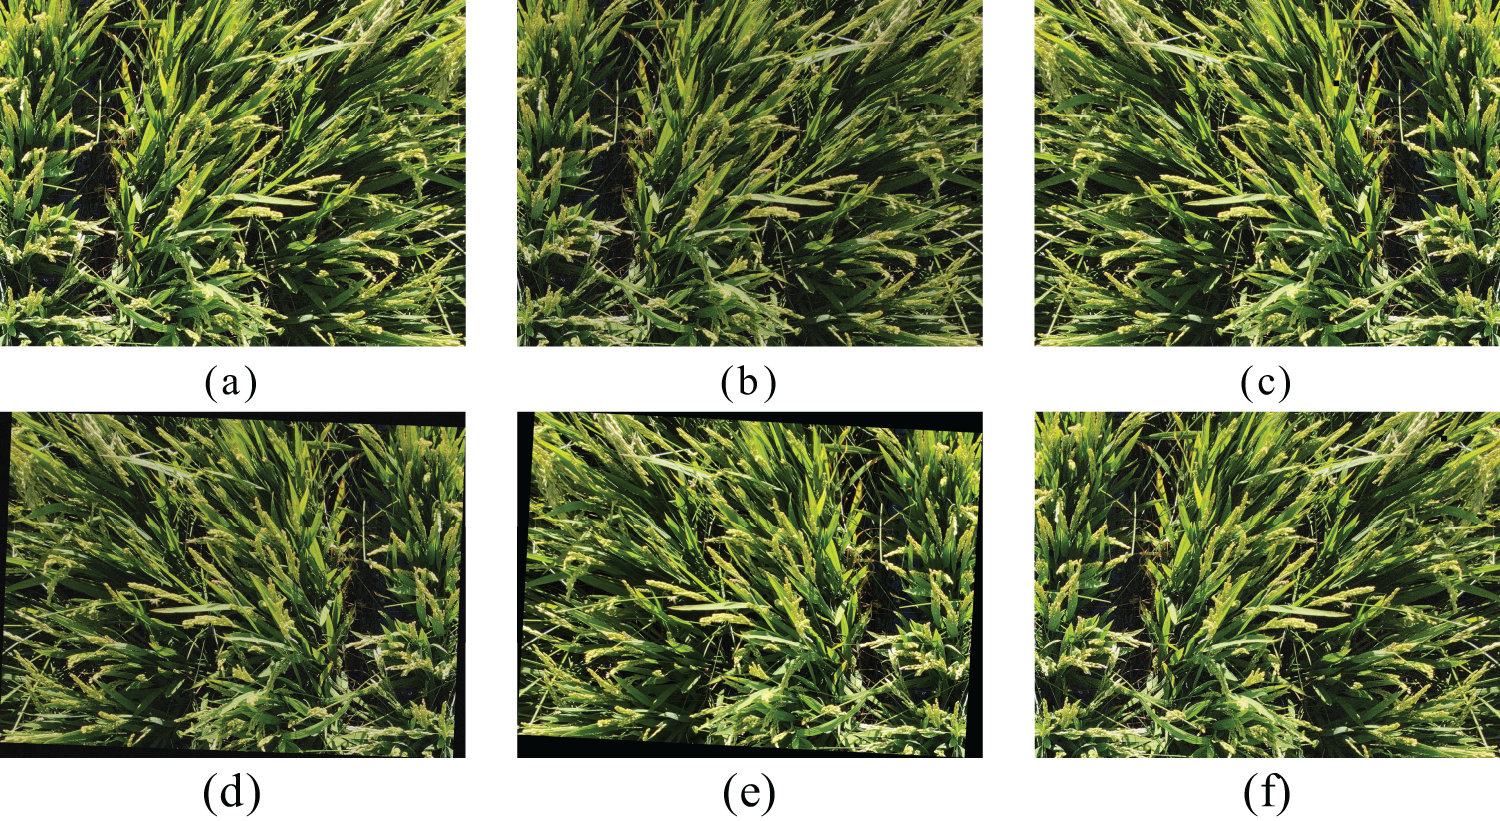
Figure 1: Data augmentation method. The (a) image is the original image; (b) is the image after adjusting the brightness; (c) is the mirrored image; (d) is the image after rotating it by a random angle and adjusting its brightness; (e) is the image after rotating it by a random angle; (f) is the image after adding the noise
2.3 Rice Spike Detection Method
YOLO series algorithms are the current advanced target detection methods. YOLOv8 has a fast detection speed, optimal recognition performance, a network structure that is uncomplicated, real-time, and so on [15]. It includes five model variants—YOLOv8n, YOLOv8s, YOLOv8m, YOLOv8l, and YOLOv8xl—which differ in network depth and width. Among them, YOLOv8n is the most lightweight, offering the highest detection speed but the lowest accuracy. In contrast, the other models improve detection precision by increasing the model’s depth and width, though at the cost of slower detection. In this paper, the data collection environment is the actual field environment, where rice spike samples are densely distributed and possess a multitude of characteristics, including small targets. Despite the lowest accuracy of YOLOv8n, it offers a high detection speed and requires a relatively modest amount of computational resources. Consequently, it is hypothesised that YOLOv8n will apply to embedded devices in the future, with the potential to achieve real-time detection. Therefore, in this paper, we use YOLOv8n as the base structural model for optimization.
2.3.1 Dynamic Snake Convolution (DSConv)
In 2023, Qi et al. proposed a Dynamic Snake Convolution (DSC) structure f designed to extract local features from tubular structures [16]. This convolution structure enhances the sensitivity to the target shape and boundary. This enhancement is achieved by continuously adapting the convolution kernel’s shape during the feature learning process, facilitating precise segmentation between slender and weak local structural features and complex and variable global morphological features. The structure of DSConv is shown in Fig. 2.
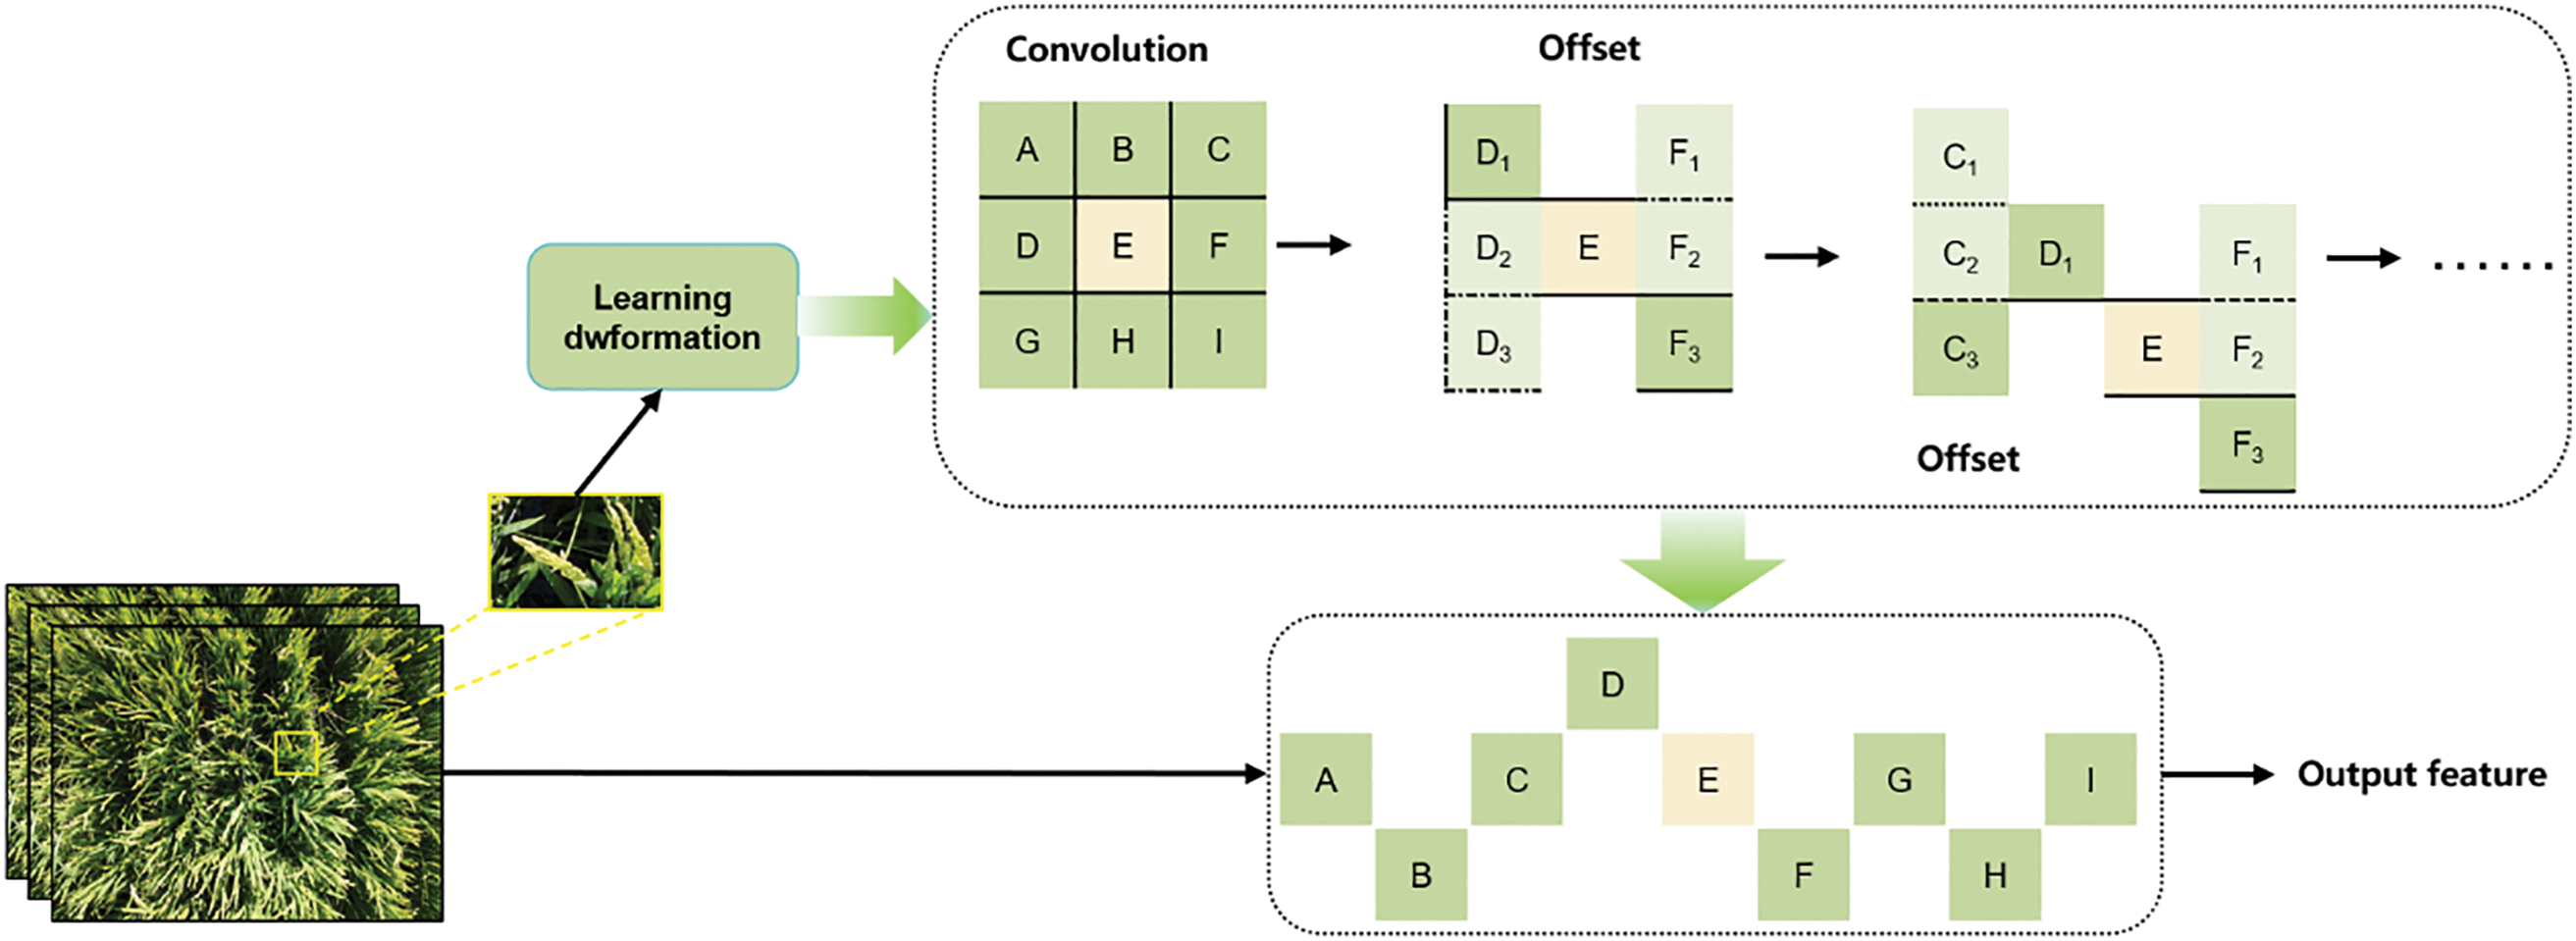
Figure 2: Schematic diagram of DSConv structure
The Dynamic Serpentine Convolution (DSC) enhances traditional convolution by introducing deformation offsetssΔ to the standard kernel, enabling it to better adapt to intricate geometric patterns. This added flexibility allows the kernel to focus more effectively on complex structures. However, unrestricted learning of these offsets can cause the network to shift its attention away from the actual target, so DSConv also adopts an iterative strategy (Fig. 3) to select the following observation positions for each target to be processed in turn, which ensures the continuity of attention without spreading out the sensory range too much due to the large deformation offset. DSConv straightens the standard convolution kernel on an X- and Y-axis basis. Taking the direction of the coordinate axes as an example, the selection of the position of each grid in the convolution kernel is a cumulative process, where the position from the center of the convolution kernel, away from the central grid, depends on the position of the previous grid, i.e., an offset is added to this
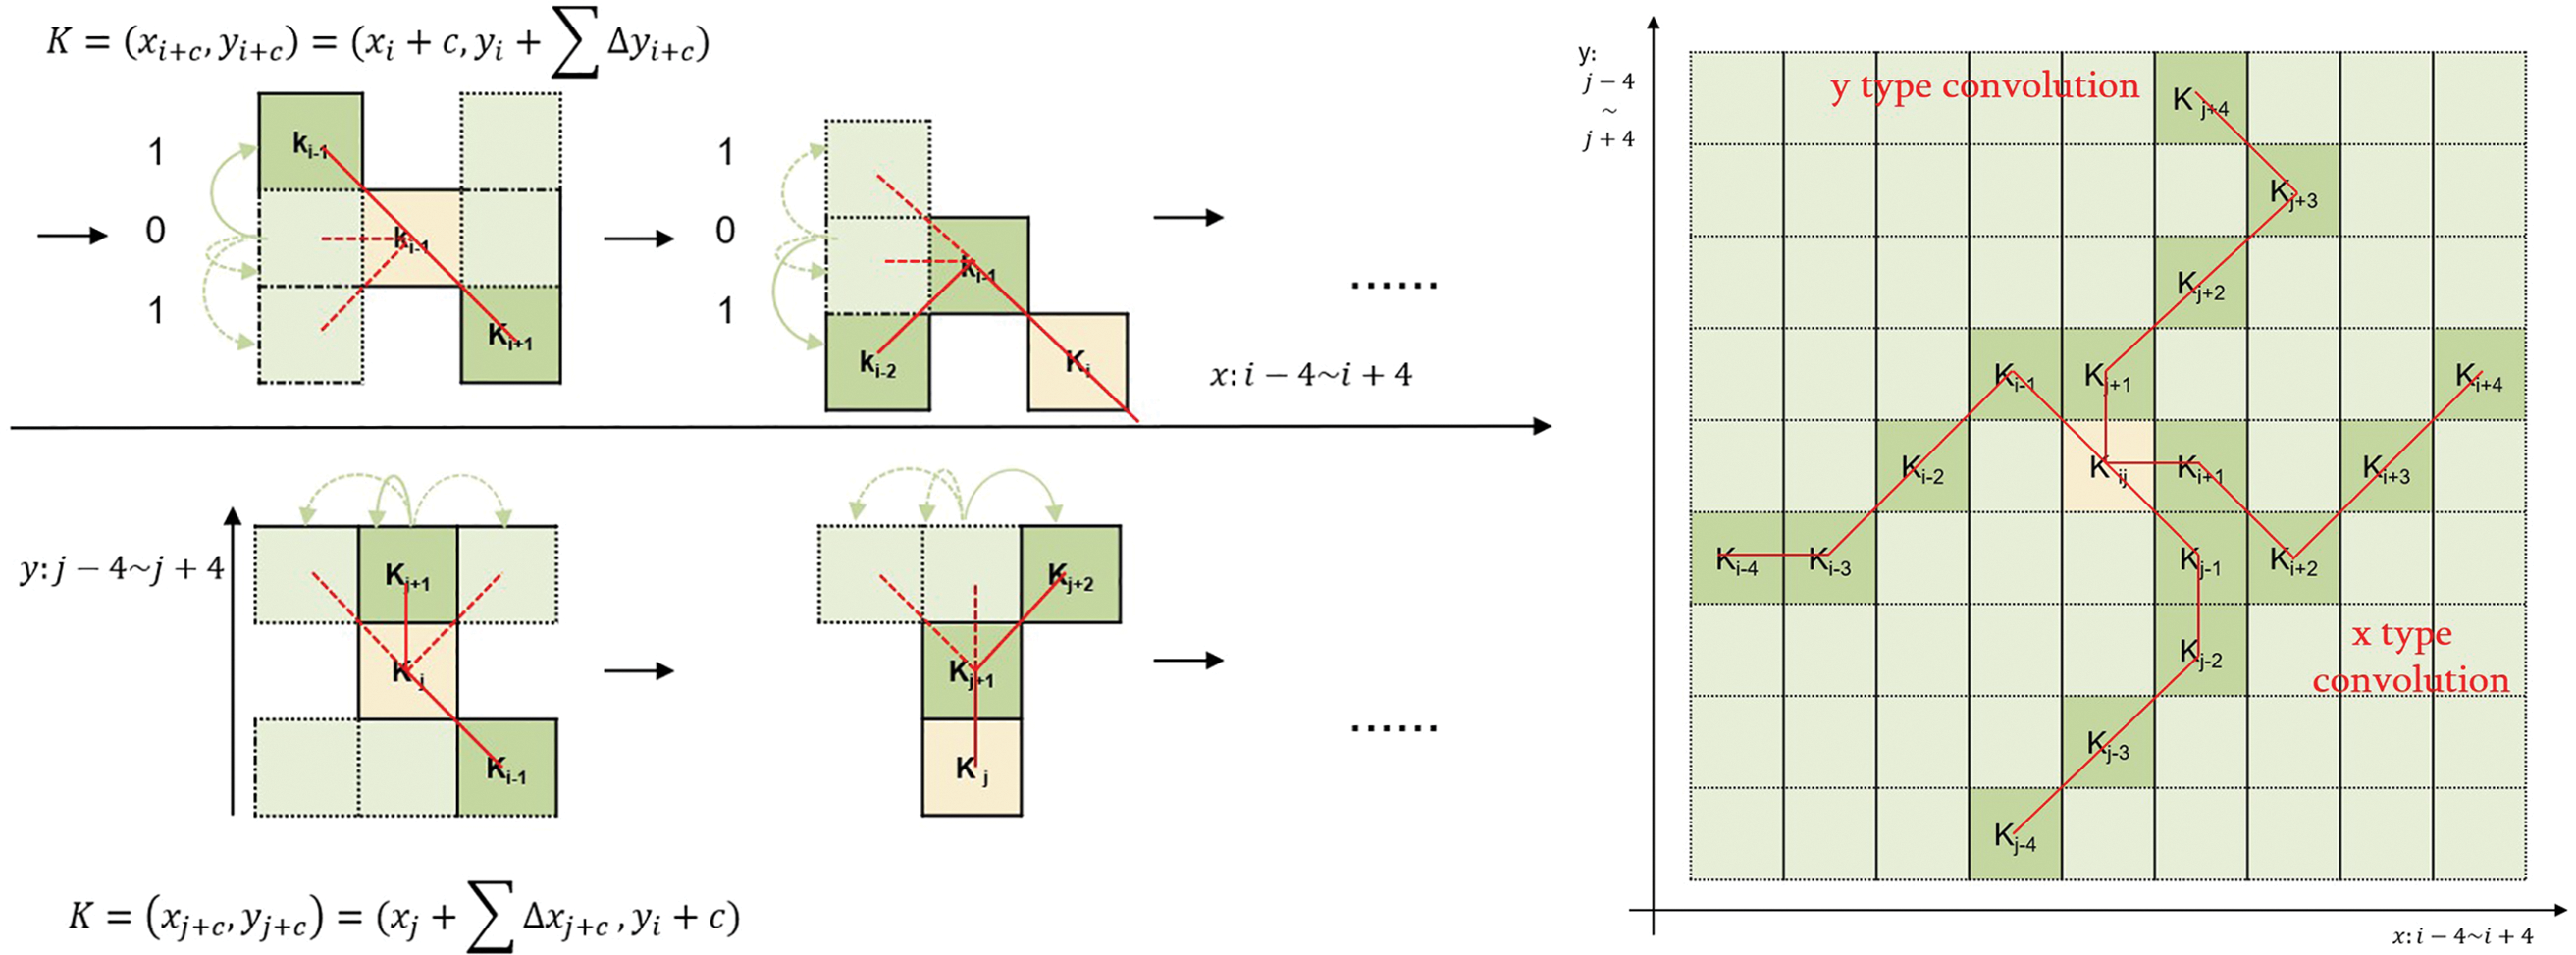
Figure 3: The left part is the schematic diagram of the coordinate calculation. The right part is DSConv’s receptive field
Fig. 3 illustrates the coordinate transformation process involved in the DSConv iteration. Due to changes in the two dimensions (x-axis and y-axis), the DSConv covers a 9 × 9 region during deformation. The DSConv is better suited for the elongated tubular structure due to its dynamic nature, leading to a better perception of key features.
Yolov8n’s network architecture consists of three main components: the backbone, the multi-scale feature fusion module (Neck), and the detection head. The C2f module enhances input feature representations by applying operations like transformation, branching, and fusion, ultimately producing more informative and representative outputs. This improvement not only boosts the network’s performance and feature representation capacity, but also enhances its adaptability to complex data scenarios, making it a key element in the overall architecture. Compared with other crops like wheat, rice ears are often characterized by their slender and narrow shape. In this case, the standard convolutional kernel can only capture local features, which will inevitably lead to the loss of some feature information and ultimately have a negative impact on the target detection results. Moreover, the convolution size of the C2f module is mostly fixed, which makes it difficult to detect the target object in depth. Under real-world field conditions, rice is typically grown at high planting densities, where spike structures often exhibit adhesion, overlapping, and entanglement. These characteristics tend to cause false detections and missed targets, thereby degrading the overall accuracy and reliability of the detection model. To address this issue, we integrated the snake dynamic convolution (DSC) structure into the C2f module by replacing the standard convolution in the Bottleneck with DSConv, resulting in a modified block referred to as Bottleneck-DSC. Accordingly, the enhanced C2f module is named C2f_DSC. The architecture of the revised C2f module is illustrated in Fig. 4. The improved architecture for rice spike detection is illustrated in Fig. 5.
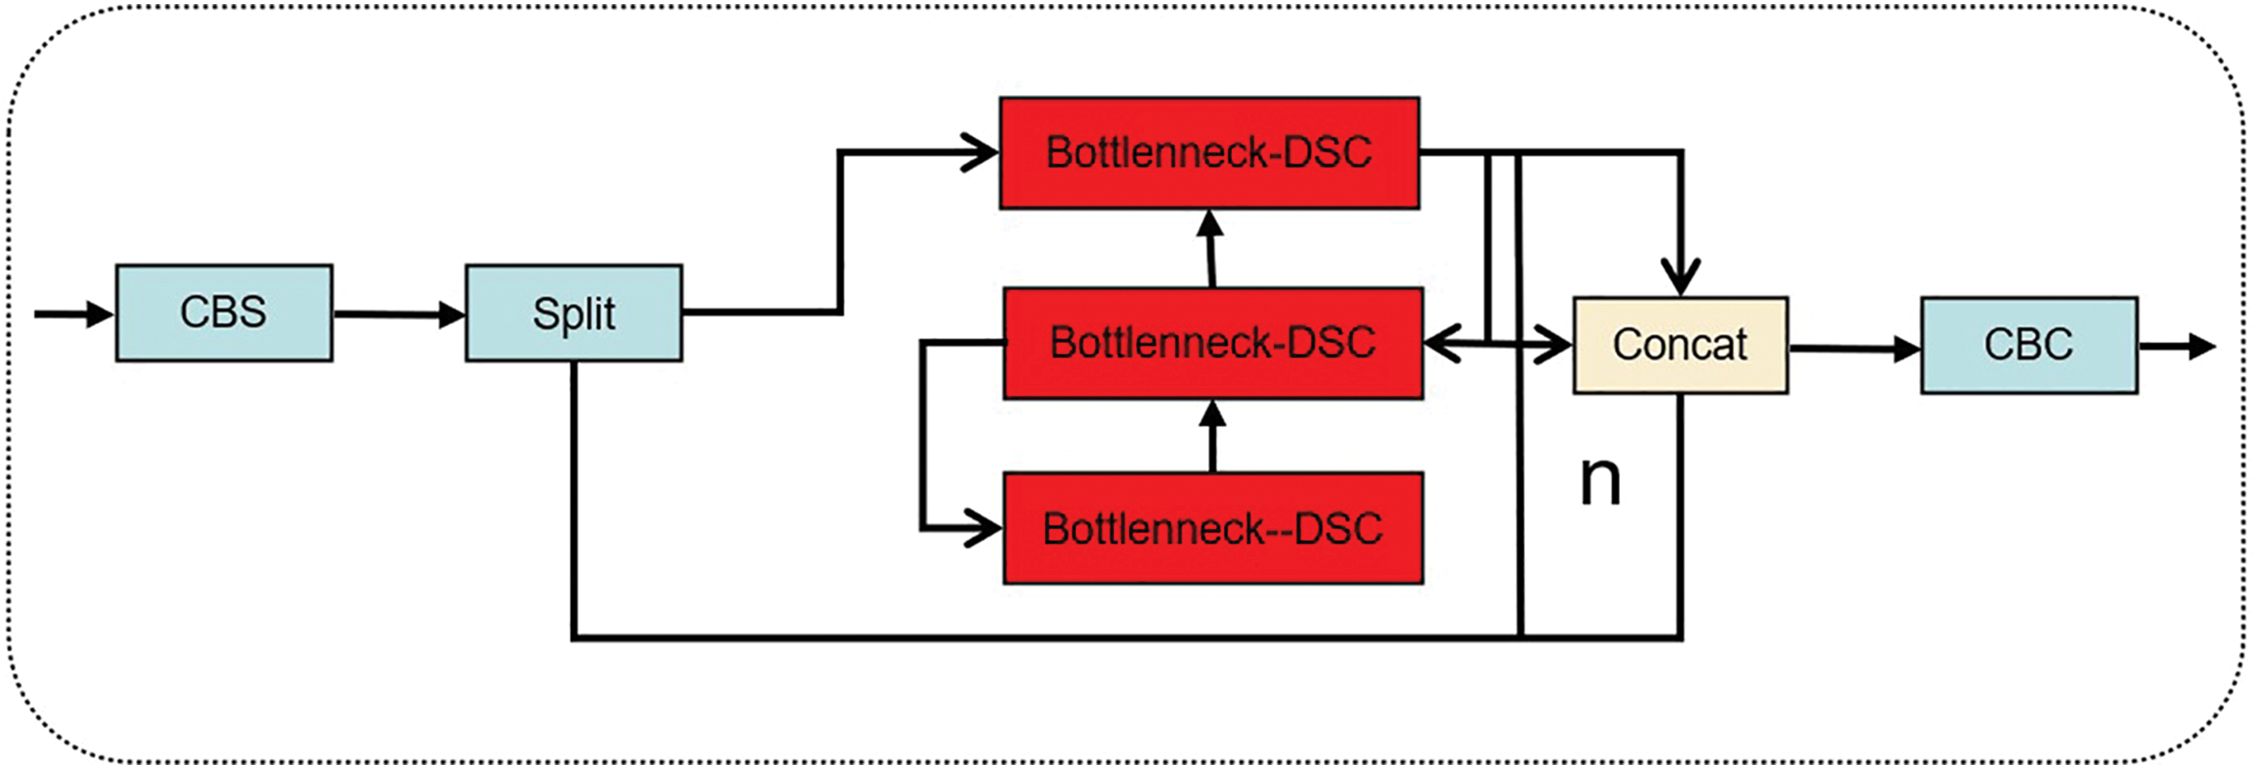
Figure 4: Improved C2f structure diagram
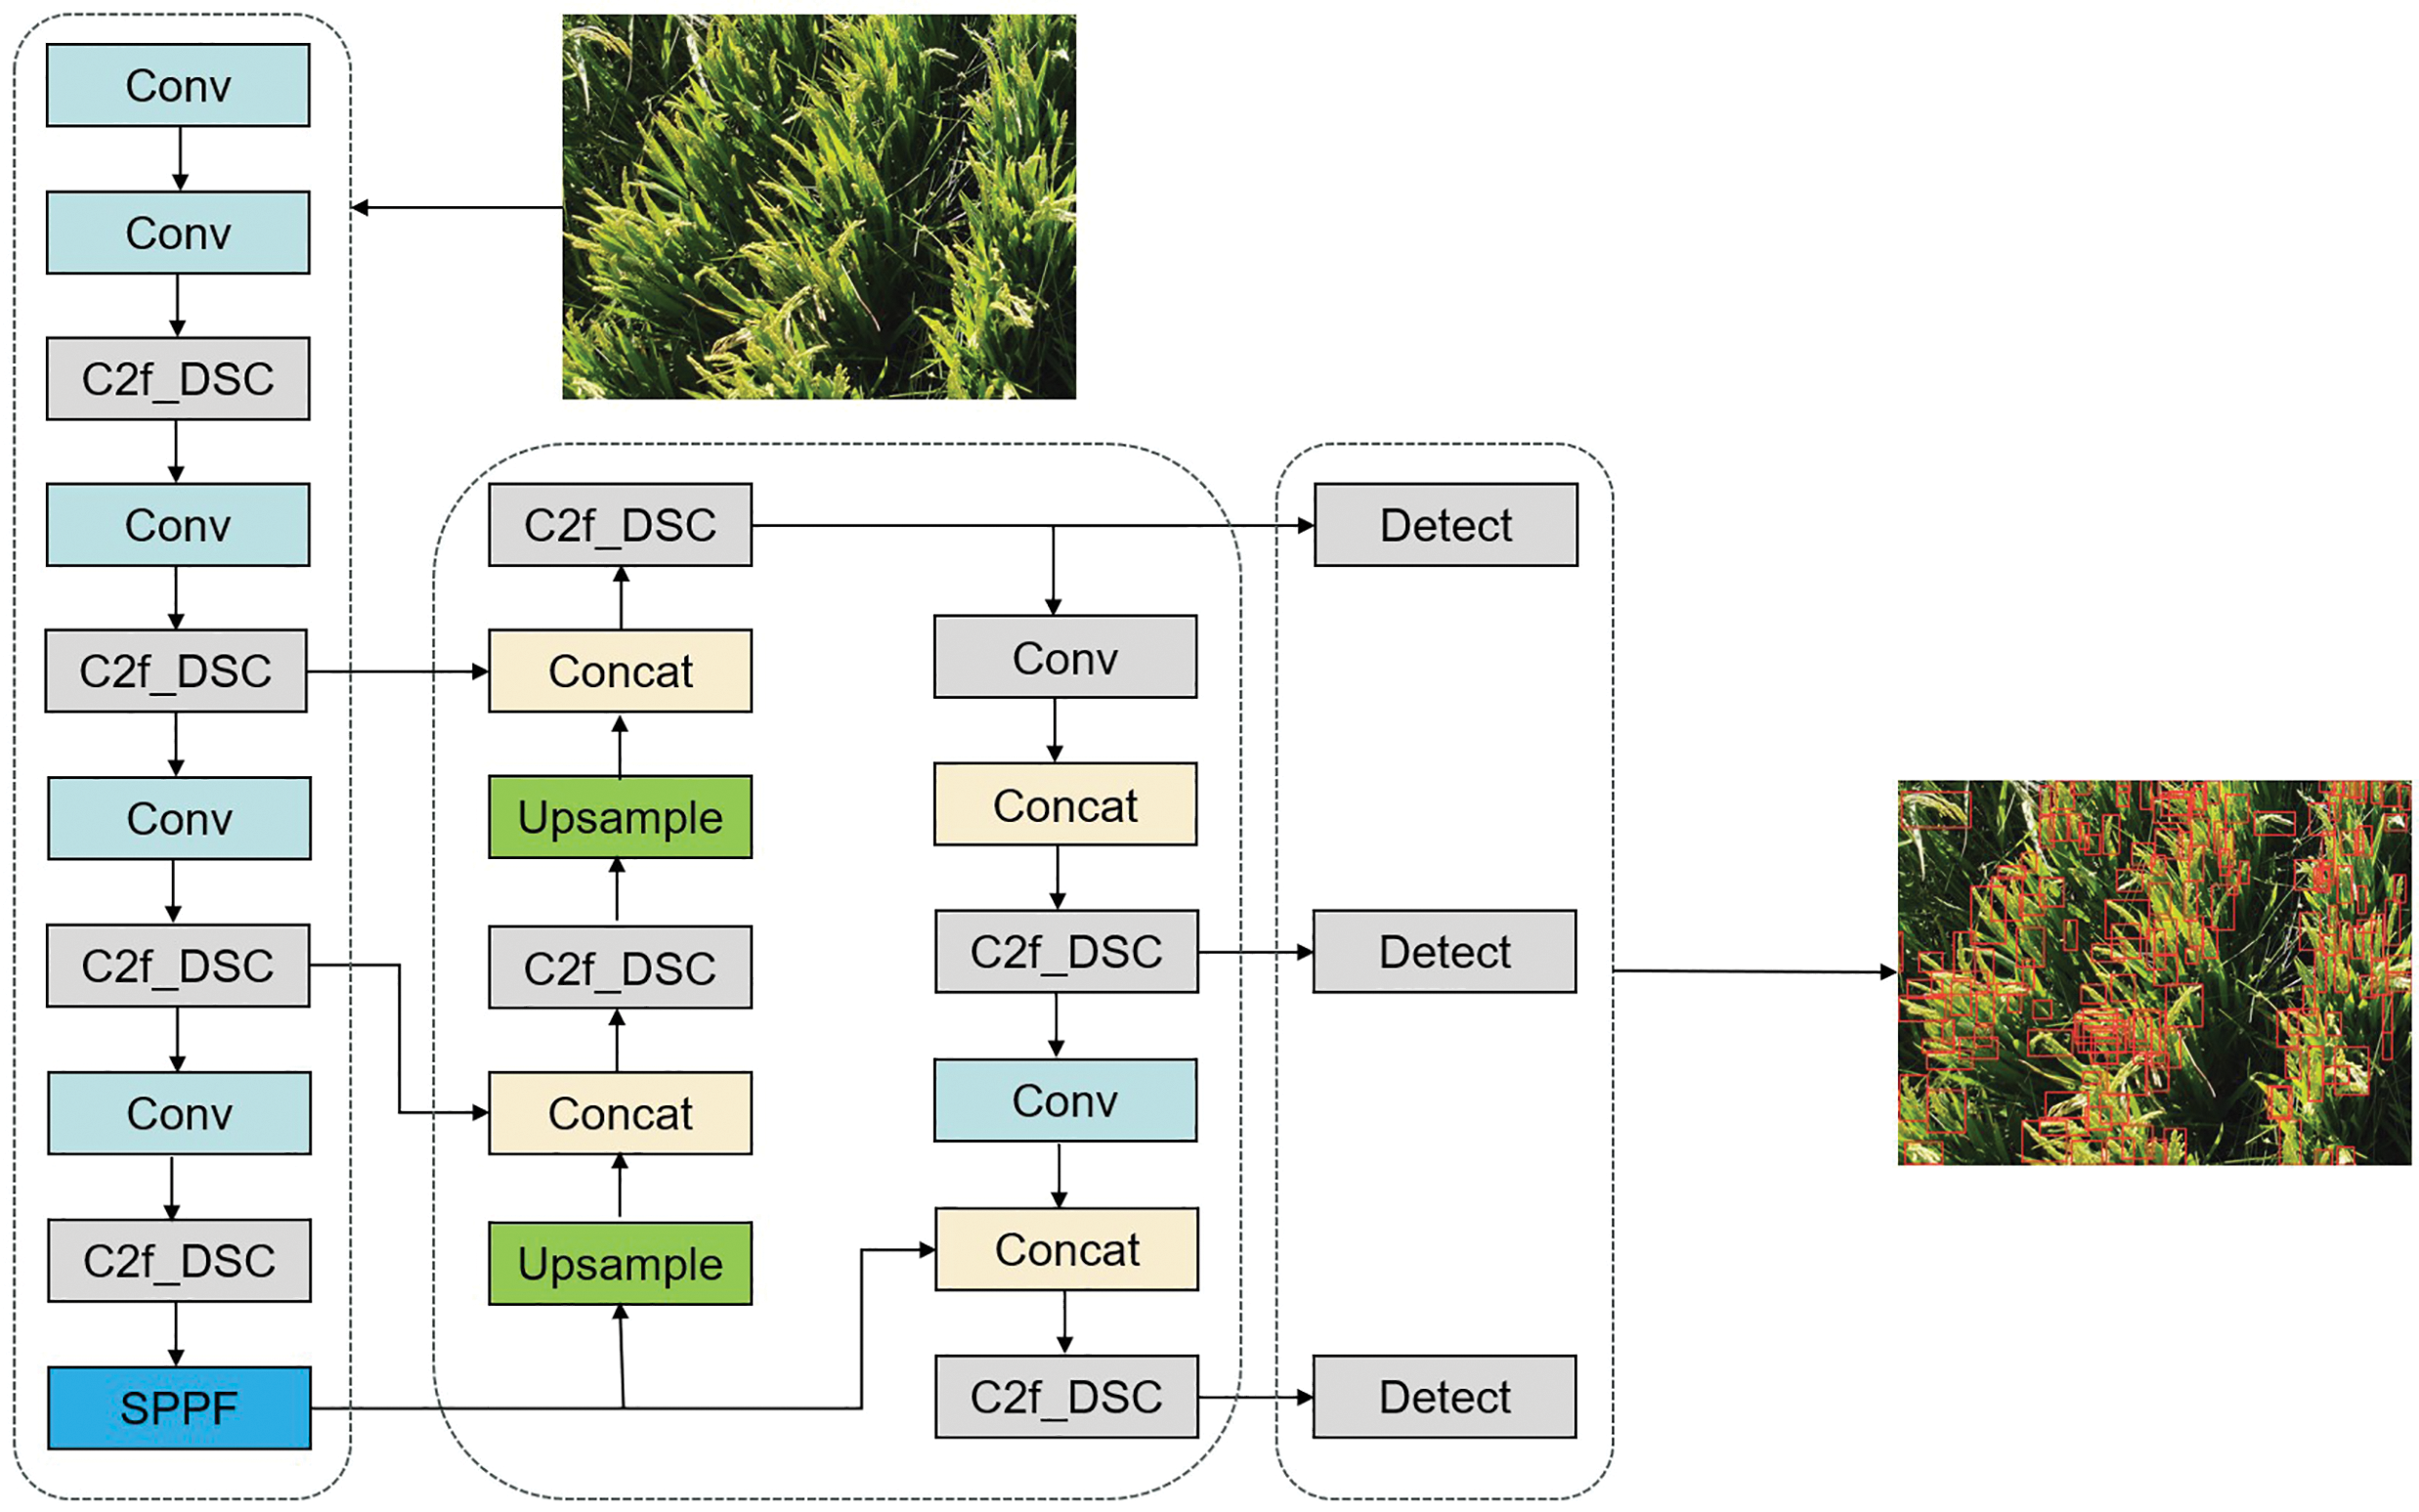
Figure 5: Schematic diagram of the improved rice ear detection network structure
Complete Intersection over Union (CIoU) is adopted as the regression box boundary loss function in YOLOv8 to gauge the error between the predicted and real bounding boxes. By introducing centroid distance, aspect ratio calculation, and area difference calculation in addition to the basic intersection over union ratio, it comprehensively measures the similarity between the predicted and real boxes. This approach more precisely guides the optimization of the model during the bounding box regression task. However, the small rice ear targets are usually located in the detailed regions of the image or the complex parts of the background. However, the loss function of CIoU, which focuses on the center of the bounding box and the overlapping region, is not effective in handling the relative positional relationship between complex backgrounds and small targets. As a result, it is difficult for CIoU to achieve the effective detection of small rice ear targets. The expressions of the CIoU loss function are shown in Eqs. (1)–(4) [17].
In the above equations,
Wise-IoU [18,19] addresses the issue of aspect ratios’ impact on small targets in CIoU by implementing a weighting mechanism. WIoU assigns distinct weights to different regions based on their importance. Specifically, it assigns higher weights to small targets, thereby facilitating the model’s learning of their features. Furthermore, it equalizes the influence of high-quality anchor boxes and ordinary anchor boxes on the regression effect of the model. The Wise-IoU loss function is delineated in Eq. (5).
In the above equation, n is the number of frames, w is the weight value,
3 Experimental Results and Analysis
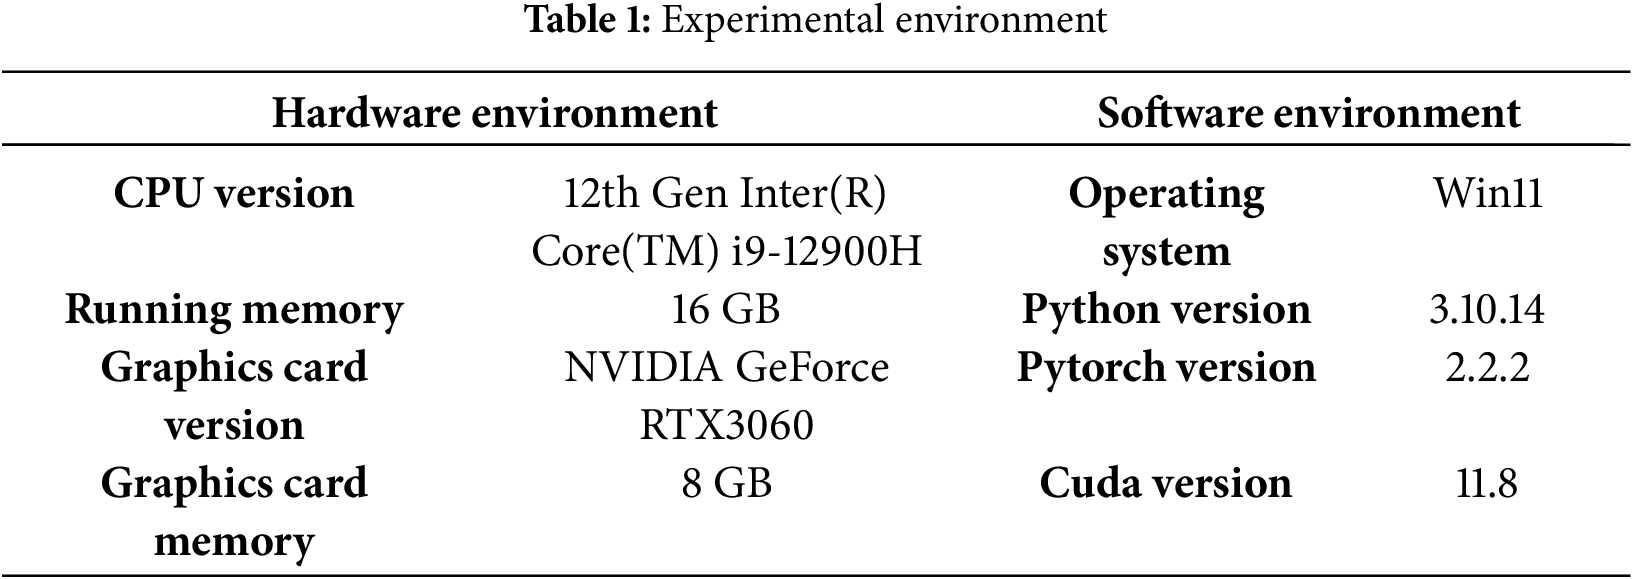
The experimental environment contains a hardware environment and a software environment, as detailed in Table 1.
3.2 Network Model Performance Evaluation
In order to objectively and comprehensively evaluate the experimental results of the detection method proposed in this paper on rice ears, this study used the Precision (P), Recall (R), Average Precision (AP), and F1 score to evaluate the comprehensive performance of the network model [20]. Precision measures the proportion of correctly identified targets among all detected instances, while Recall quantifies the proportion of true targets that are successfully identified by the model The Precision-Recall (P-R) curve is drawn with Precision on the vertical axis and Recall on the horizontal axis. AP refers to the area under the curve, i.e., the integral of the P-R curve. This integral is used to evaluate the comprehensive performance of the model.
In these formulas, TP represents the count of correctly identified positive rice spike samples; FP refers to negative samples incorrectly predicted as positive; and FN indicates the number of real positive samples that the model failed to detect.
To assess the effectiveness of the proposed network model, a comparative experiment was conducted against the widely used target detection algorithm, Faster R-CNN. All models involved in the comparison were trained on the same dataset, with identical data augmentation strategies applied. The initial learning rate was set to 0.001, and the training process was run for 500 iterations.
The results in Fig. 6 show that the test results of the improved model in the test set are generally better than the base model YOLO8n. Due to the complex background of the rice spike in the field environment and the special shape of the rice, dynamic snake convolution is introduced into the model feature extraction module to make the model pay more attention to the features of the rice spike with a slender shape, and WIoU is used in the calculation of the model’s loss to improve the accuracy and precision of the model in detecting the small rice spikes and thus improve the overall detection performance of the model. From the detection effect graph, we can intuitively see that the improved model proposed in this paper has a better detection effect in places where the rice spike is denser, so the improved model is effective for the detection of rice spikes in complex environments; although the improved model enhances the detection ability of rice spikes, there are also leakage and wrong detection, which is mainly caused by the fact that the rice spikes are affixed too close to one another and the the main reasons for this are that the spikes are too close together and the colors are the same. When the degree of overlap of the rice spike is more than 50%, multiple rice spikes will still be detected as one spike, resulting in erroneous detection of rice spikes; when the color of the spike is similar to the background, the model is not able to correctly distinguish between the background and the spike, resulting in leakage of detection, so in the future research we can use a more advanced edge feature extraction method to extract the edge features of the spike in a more detailed way and to increase the ability of spike detection in The problem of low spike detection accuracy caused by the overlapping of a large number of spikes in complex environments.
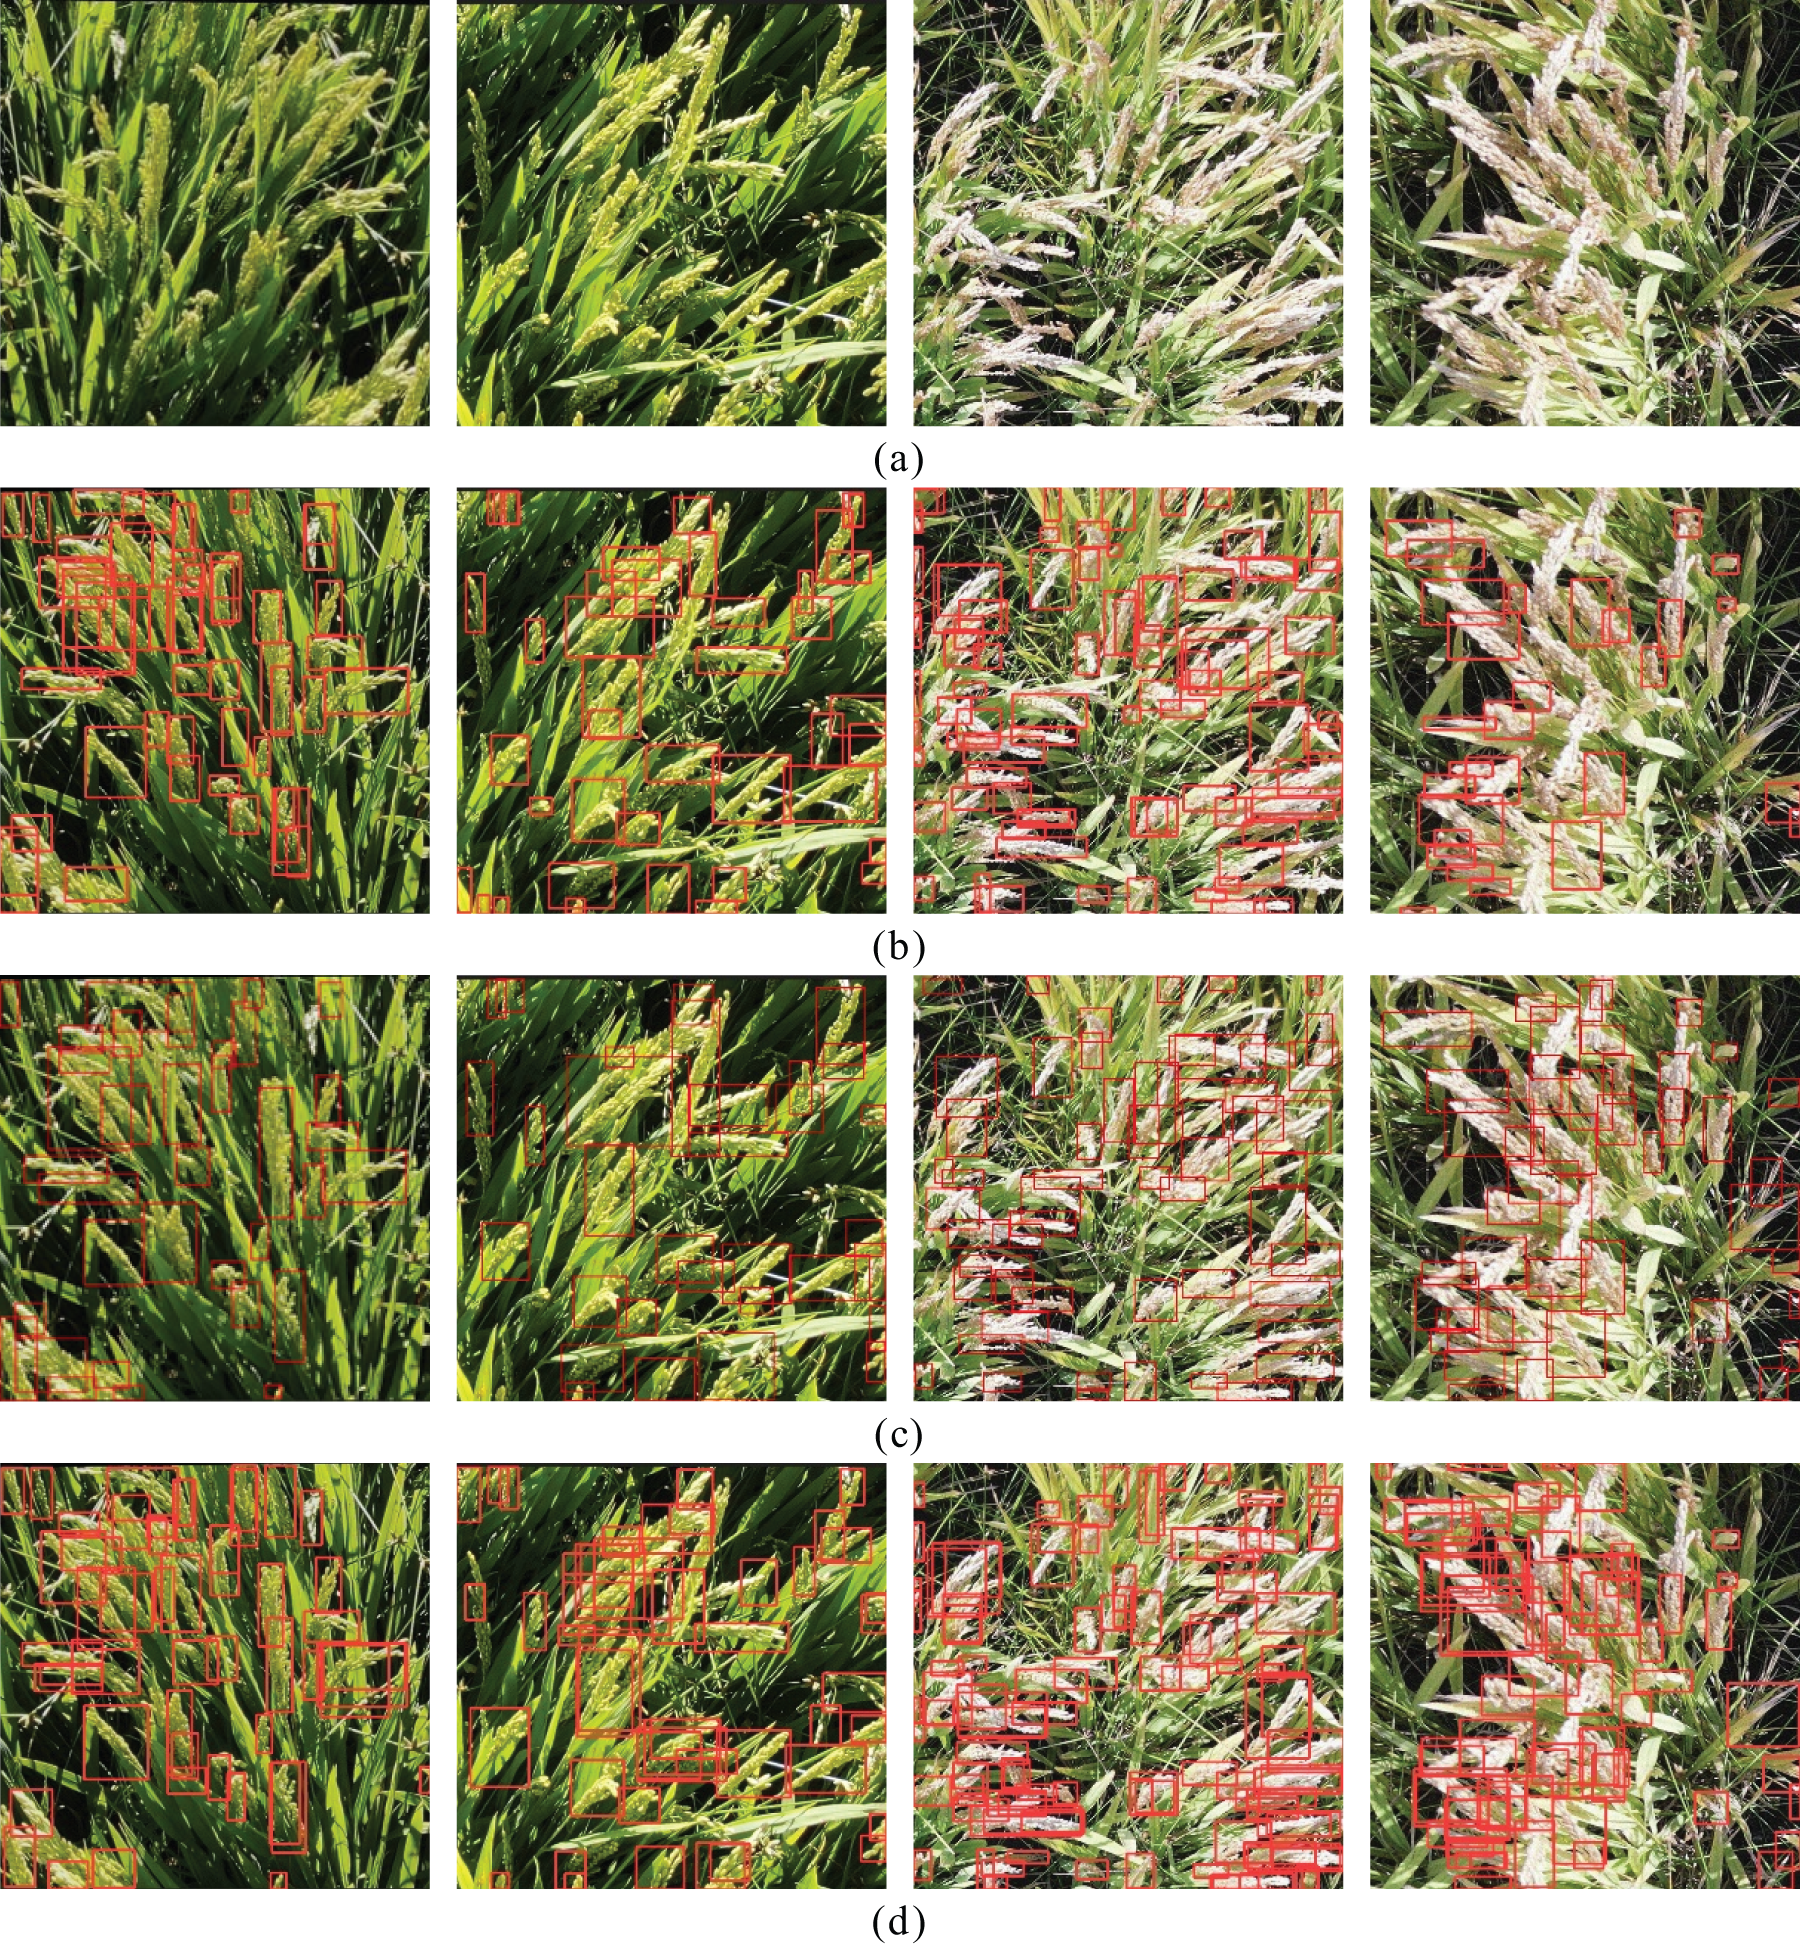
Figure 6: Comparison of the detection effect of the improved algorithm with other algorithms. (a) is the original image of the rice spikes; (b) is the detection results of the YOLOv8 algorithm; (c) is the detection results of the Faster R-CNN algorithm; (d) is the detection results of the improved algorithm
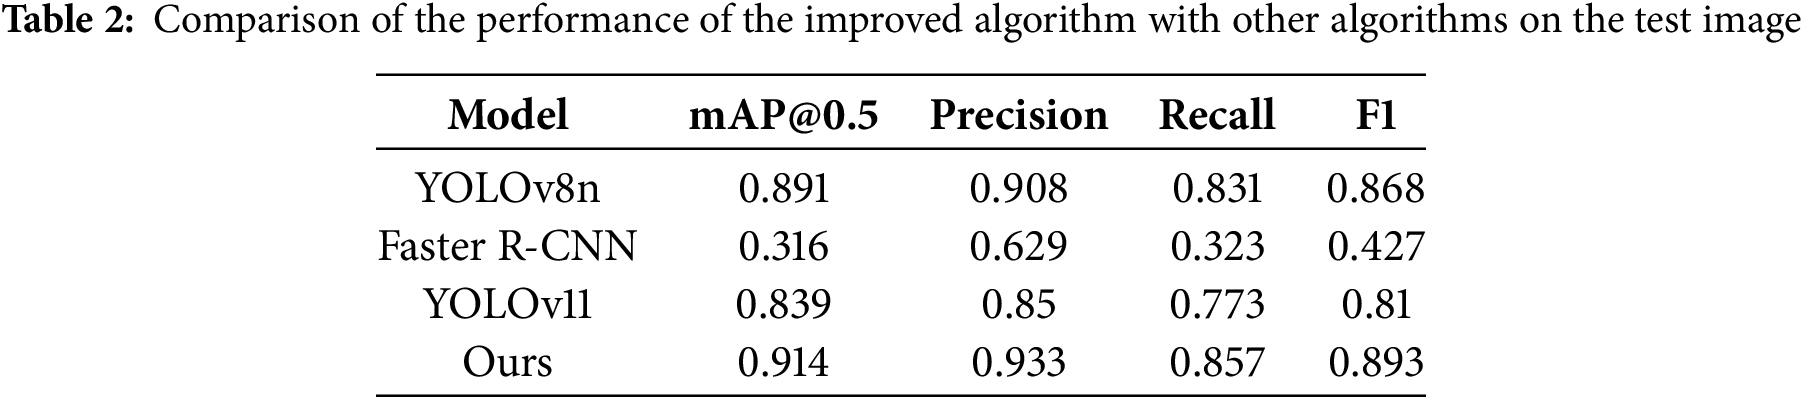
As shown by the experimental numerical results in Table 2, the enhanced network achieves a 2.3% improvement in detection accuracy on the dataset, reaching 91.4%, notably, when the confidence threshold ranges from 0.5 to 0.95, the accuracy increases by nearly 5%, indicating a substantial enhancement in the model’s detection capability. Furthermore, the observed mAP@0.5 is markedly higher than mAP@0.5–0.95, suggesting that the overlap threshold has a significant influence on the accurate identification of rice spikes.
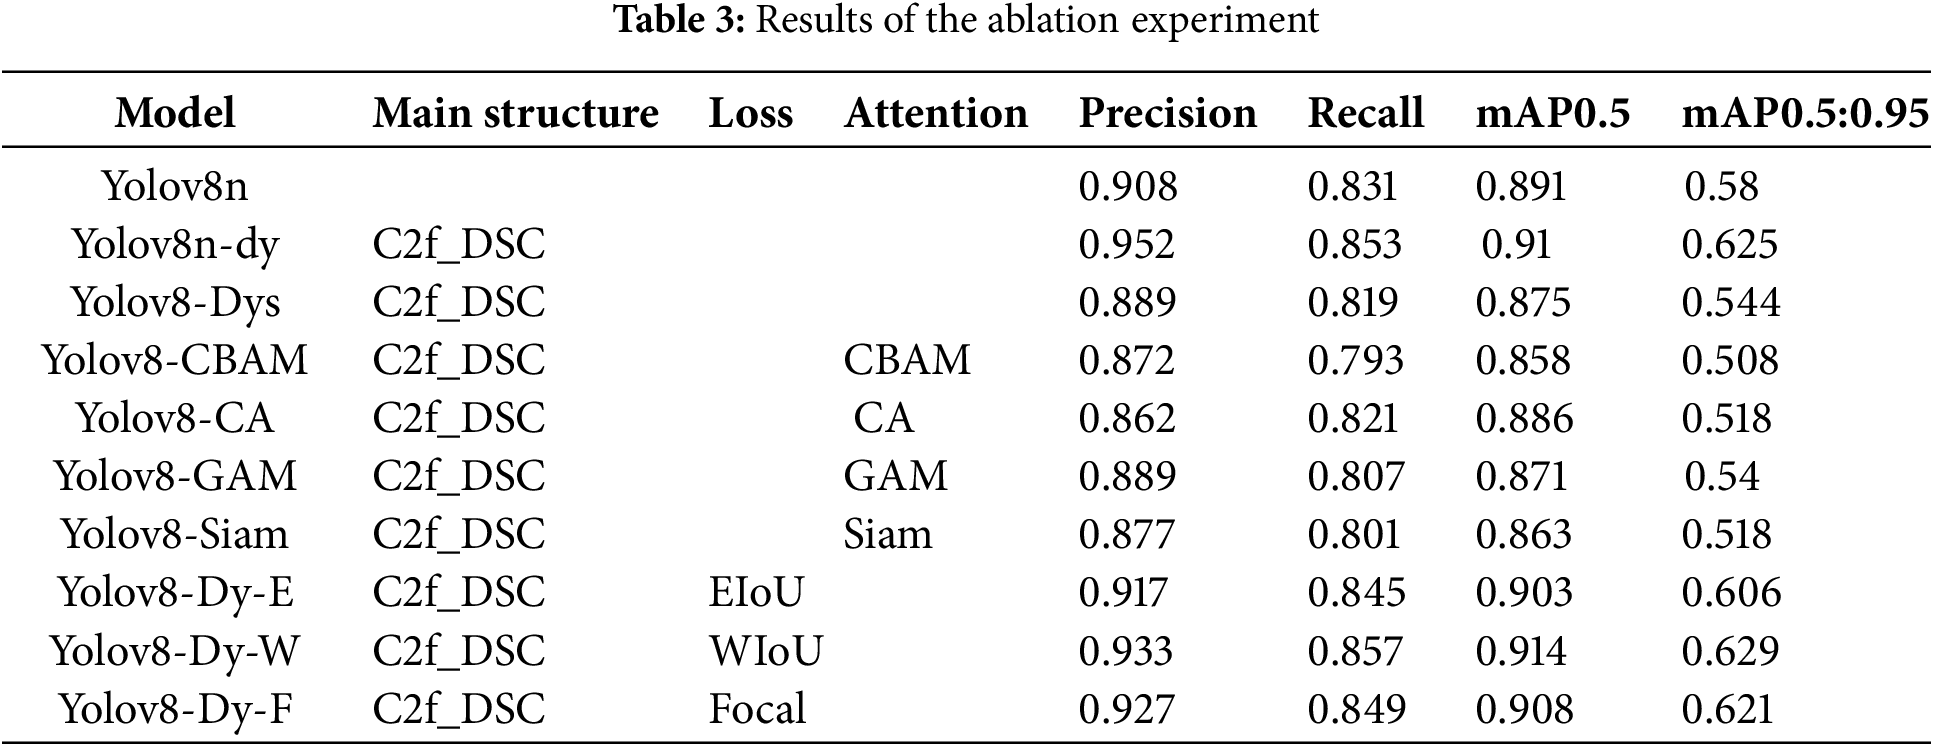
To evaluate the effectiveness of the proposed rice spike detection approach, ablation experiments were performed on the original dataset by integrating both the enhanced module and the attention mechanism component. These experiments were designed to assess the individual impact of each enhancement on overall model performance. Using YOLOv8n as the baseline, a total of 10 experiments were conducted. In each experiment, a single module was added while keeping all training parameters consistent to ensure a fair comparison. As summarized in Table 3, the proposed model achieves a 2.3% improvement over the original YOLOv8n. Notably, under the confidence interval of 0.5 to 0.95, the accuracy shows an increase of nearly 5%, reflecting a substantial enhancement in detection precision. Additionally, the model’s mAP@0.5 remains significantly higher than mAP@0.5:0.95%, indicating that intersection-over-union thresholds have a pronounced effect on spike recognition. This is mainly due to the optimization of the feature extraction structure of the model, especially the integration of the dynamic snake convolution structure, which makes the model detection effect significantly improved; the loss function of the model is replaced with the WIoU, which improves the model’s ability to locate small targets, thus improving the overall detection performance of the model. In addition, although most existing research on target detection methods enhances the model’s focus on key features during the down-sampling process by employing attention mechanisms to improve detection accuracy, experimental analyses suggest a different approach. Integrating the DSC module prior to the SPPF layer allows the convolutional network to better focus on the critical features of the elongated rice spikes during the feature extraction process. In contrast, embedding the attention mechanism in the deeper layers of the network tends to make the model overly sensitive to the distinct morphological traits, potentially overlooking relevant background information. This disproportionate emphasis can result in the loss of valuable feature data and consequently lead to a decline in detection accuracy.
3.4 Comparative Tests in Different Periods
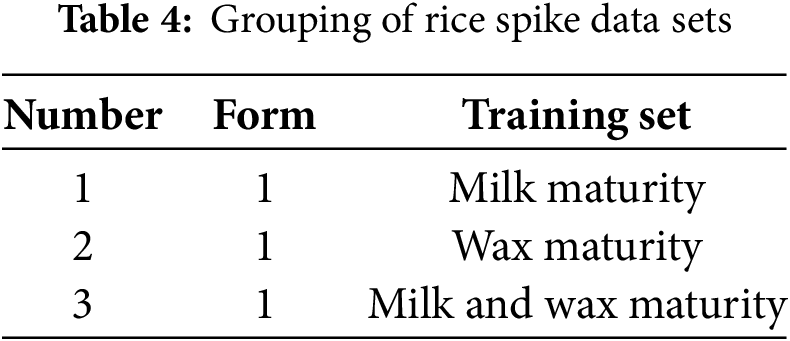
Rice spike is an important factor affecting rice yield. To realize a more accurate early estimation of rice yield, this paper designs rice spike detection experiments in different periods to verify the optimal period for rice spike detection. The growth period of rice can be divided into five key stages: the seedling stage, the tillering stage, the nodulation stage, the tasseling stage, and the maturity stage. The maturity stage, which is pivotal to both yield and quality, represents the predominant period for the detection and enumeration of rice spikes. The maturity stage is further subdivided into milk maturity, wax maturity, and full maturity. The seedling stage and tillering stage of rice did not grow spikes; the tasseling stage of rice refers to a period when rice just started to develop spikes, the number and shape of spikes in this period are very unstable, and spike detection in this period has no practical significance for the prediction of the yield of rice; the rice and the stem leaves of the full maturity are yellowish-white, therefore, this period is not suitable for spike detection, so the data in this paper are collected from the milk-ripening and wax-ripening stages of rice. The dataset is divided into two parts according to the time of acquisition, one part of the images is the milk-ripening stage, totaling 630 images, and the other part is the wax-ripening stage images, totaling 436 images, and three sets of experiments are set up, as shown in Table 4, the training set for the first set of experiments is only the images of the milk-ripening stage of the rice, the training set for the second set of experiments is only the images of the wax-ripening stage of the rice, and the training set for the third set of experiments is the images of the milk-ripening stage mixed with the wax-ripening stage. Using the benchmark model and the network model proposed in this paper to train these three sets of data, six rice spike detection models are obtained, and the test set is used to verify the model accuracy and the experimental results are shown in Table 5.
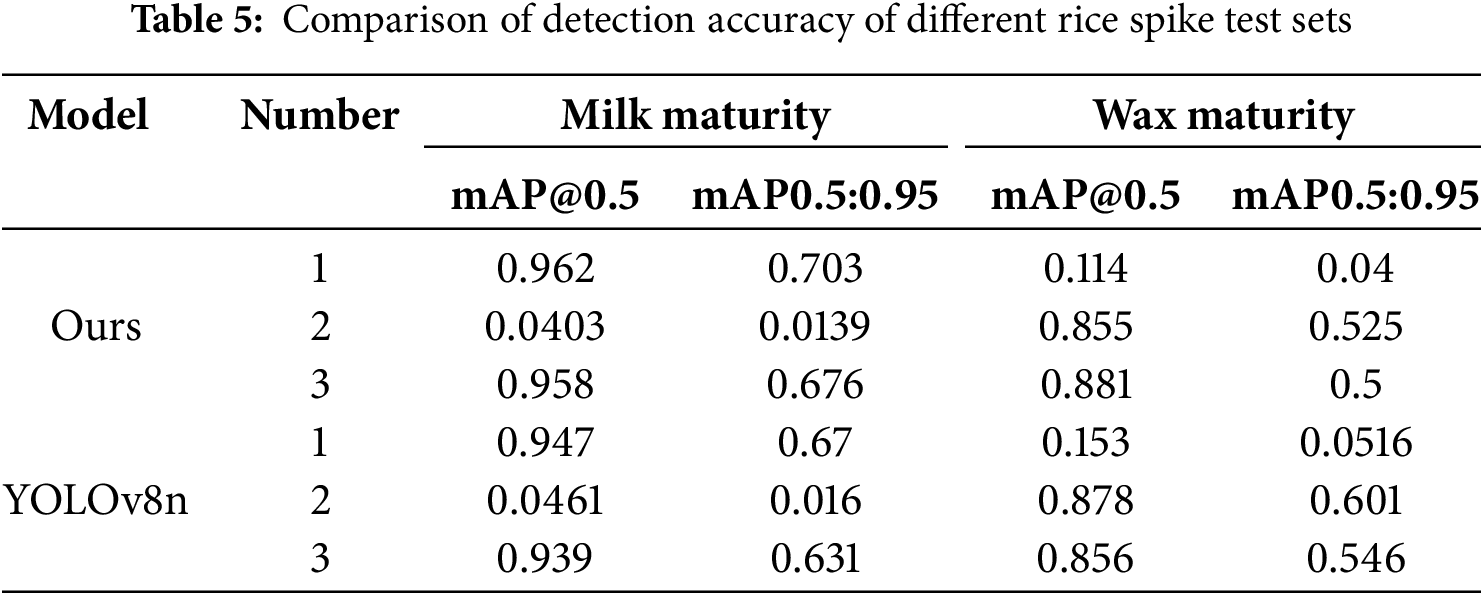
The experimental results indicate that the model trained exclusively on data from rice ears at the milky ripening stage achieves optimal detection performance for this stage. The improved model demonstrates mAP@0.5 of 96% and mAP@0.95 which exceeds the YOLOv8n model by 0.7, with the mAP@0.95 of the improved model reaching 67%. However, the rice spike detection model trained using a single period dataset is less effective in detecting data from another period, with mAP@0.5 and mAP@0.95 no more than 20% recognition accuracy. The model trained on combined data from both rice spike growth stages exhibits a moderate recognition capability across all periods. Its detection performance is notably higher for spikes in the milky ripening stage—ranking just below the model specifically trained on that stage—while its accuracy for the wax ripening stage remains comparatively lower.
3.5 Evaluation of Model Counting Performance
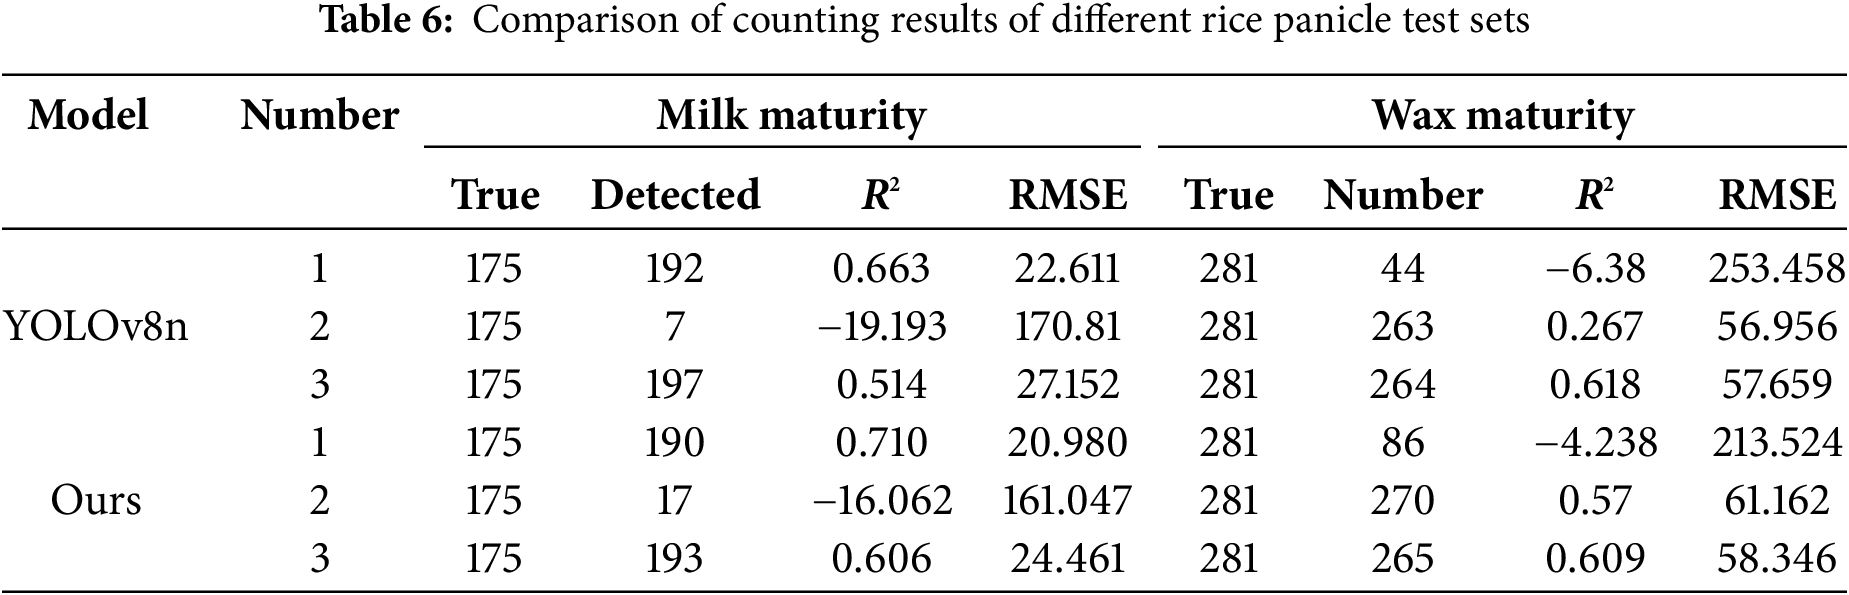
The number of rice spikes is a critical factor influencing rice yield. To assess the counting capability of the proposed model, experiments were conducted on data collected across different growth periods. The objective was to identify the most suitable model and the optimal period for accurately counting rice spikes, thereby providing technical support for rice yield predictions. A total of 130 images were randomly selected from the test and validation sets at the milk and wax maturity stages, respectively, to evaluate the model’s counting performance. These images were processed and analyzed using the model developed in Experiment 2.4, and the predicted counts were compared with the actual number of rice spikes in the images. In this study, Root mean squared error (RMSE), and R squared (R2) were used to assess the counting performance and accuracy of the model. The average difference between the predicted and true values in this dataset can be derived by calculating the RMSE, the lower the value, the more suitable the model proposed in this study is for this dataset; R2 is the square of the correlation coefficient between the actual number of spikes observed and the number of spikes detected by the model. the higher the R-squared, the better the model is. The experimental results are shown in Table 6.
In the above equations,
The results of the above experiments indicate that models trained on a mixture of data from both periods demonstrate a positive correlation with the counts of data from the milk-ripening period; the training and testing of the models for the same period are positively correlated; and the training of models using data from only one period exhibits a negative correlation with the counts of data from the other period.
The model that was trained using the dataset from the milk-ripening period is more suitable for estimating rice yield during the milk-ripening period; the model that was trained using the wax-ripening period is more suitable for estimating rice yield during the wax-ripening period; and if the desired model has to be able to detect rice ears in both periods, then UAV imagery has to be collected from both periods to train the model. The efficacy of the detection model is found to be less pronounced during the wax maturity stage in comparison to its performance during the milk maturity stage. This is attributed to the gradual increase in the weight of rice from the milk maturity stage to the wax maturity stage, which results in an enhancement of the overlap of the rice ears. Therefore, the model proposed in this paper is most effective for the detection and counting of rice ears at the milky ripening stage of rice.
This study comprehensively evaluates the performance of the YOLOv8 algorithm in rice spike detection, focusing on rice spike detection in real-world growing environments. By analyzing the morphology and state of rice in the field environment, the limitations of the YOLOv8 network under special conditions are emphasized, which mainly include the use of UAV aerial images of rice with a large number of small targets and a complex background of rice spike targets, and a dynamic serpentine convolution-based rice spike detection method is targeted to solve the blurring of spike features that occurs in the detection of rice spikes by using UAVs. The biggest contribution made by this method is the use of a dynamically variable convolution kernel instead of the standard convolution kernel, which can extract the rice cob features more completely, and greatly reduce the probability of detection accuracy due to the blurring of the cob edges caused by the target detection model in the special condition of the rice cob distance being too close; this paper also strengthens the detection capability of this method for the small target in the image of the UAV through the use of the WIoU as the regression bounding box loss function, which effectively solves the problem of small target in the image of UAVs. Detection ability effectively solves the problem of poor detection due to small targets of rice ears in rice images taken by UAVs. In addition, this study explores the optimal period for rice spike detection and counting, the data sets from different periods were used for training and testing, finally, the detection method proposed in this study is applicable to the detection and counting of rice spikes during the milky ripening period, which provides technical support for the early yield estimation of rice. In addition, from the milk-ripening stage to the wax-ripening stage of rice, the color and morphology of rice produce great differences, and factors such as the close proximity of leaves and the overlap of rice spikes due to maturation and enlargement bring difficulties and challenges to the accurate identification and counting of rice spikes under the complex environment of rice fields, and in the future research, we can consider using a camera with a higher resolution to collect data and obtain clearer edge features of the spikes, which will improve the detection effect of the model. In future research, we will further explore reducing the number of parameters and the number of operations of the method to realize the real-time monitoring of rice yield.
Acknowledgement: The authors would like to acknowledge the valuable feedback provided by the reviewers.
Funding Statement: This research is funded by Jilin Province Innovation and Entrepreneurship Talent Project, grant number 2023QN15. This research is funded by Science and Technology Development Plan Project of Jilin Province, grant number 20220202035NC.
Author Contributions: The authors confirm contribution to the paper as follows: study conception and design: Fuheng Qu, Hailong Li; data collection: Hailong Li; analysis and interpretation of results: Hailong Li, Xiaofeng Li, Ping Wang; draft manuscript preparation: Hailong Li, Sike Guo, Lu Wang. All authors reviewed the results and approved the final version of the manuscript.
Availability of Data and Materials: All data used in this study are freely available and accessible. The sources of the data utilized in this research are thoroughly explained in the main manuscript.
Ethics Approval: Not applicable.
Conflicts of Interest: The authors declare no conflicts of interest to report regarding the present study.
Abbreviations
| UAV | Unmanned Aerial Vehicle |
| DSConv | Dynamic Snake Convolution |
| WIoU | the Weighted Interpolation of Sequential Evidence for Intersection over Union |
| R2 | R squared |
| RMSE | Root mean squared error |
| Faster R-CNN | Faster regions with convolutional neural networks |
| SimOTA | Simplify Optimal Transport Assignment |
| CWD | Channel-wise Knowledge Distillation for Dense Prediction |
| YOLO | You Only Look Once |
| AIFI | Attention-based Intrascale Feature Interaction |
| FOV | Field of View |
| CIoU | Complete Intersection over Union |
References
1. Duan LF, Xiong X, Liu Q, Yang WN, Huang CL. Field rice panicle segmentation based on deep full convolutional neural network. Trans Chin Soc Agric Eng. 2018;34(12):202–9. (In Chinese). doi:10.11975/j.issn.1002-6819.2018.12.024. [Google Scholar] [CrossRef]
2. Kimball BA, Kobayashi K, Bindi M. Responses of agricultural crops to free-air CO2 enrichment. Adv Agron. 2002;77:293–368. doi:10.1016/S0065-2113(02)77017-x. [Google Scholar] [CrossRef]
3. Bouman BAM, Tuong TP. Field water management to save water and increase its productivity in irrigated lowland rice. Agric Water Manag. 2001;49(1):11–30. doi:10.1016/S0378-3774(00)00128-1. [Google Scholar] [CrossRef]
4. Puri V, Nayyar A, Raja L. Agriculture drones: a modern breakthrough in precision agriculture. J Stat Manag Syst. 2017;20(4):507–18. doi:10.1080/09720510.2017.1395171. [Google Scholar] [CrossRef]
5. Berni JAJ, Zarco-Tejada PJ, Suarez L, Fereres E. Thermal and narrowband multispectral remote sensing for vegetation monitoring from an unmanned aerial vehicle. IEEE Trans Geosci Remote Sens. 2009;47(3):722–38. doi:10.1109/TGRS.2008.2010457. [Google Scholar] [CrossRef]
6. Zhao S, Hussain M, Wang G, Bian Z, Wang M, Lan Y. Research progress of crop growth monitoring based on UAV remote sensing. Jiangsu Agric Sci. 2024;52(8):8–15. (In Chinese). doi:10.15889/j.issn.1002-1302.2024.08.002. [Google Scholar] [CrossRef]
7. Huang Y, Wang L, Zhao P, Zhao Y, DU Y, Yang Q, et al. Deep learning in urban green space extraction in remote sensing: a comprehensive systematic review. Int J Remote Sens. 2025;46(3):1117–50. doi:10.1080/01431161.2024.2424511. [Google Scholar] [CrossRef]
8. Ramachandran A, Sendhil Kumar KS. Border sensitive knowledge distillation for rice panicle detection in UAV images. Comput Mater Contin. 2024;81(1):827–42. doi:10.32604/cmc.2024.054768. [Google Scholar] [CrossRef]
9. Madec S, Jin X, Lu H, De Solan B, Liu S, Duyme F, et al. Ear density estimation from high resolution RGB imagery using deep learning technique. Agric For Meteor. 2019;264:225–34. doi:10.1016/j.agrformet.2018.10.013. [Google Scholar] [CrossRef]
10. Qiu F, Shen X, Zhou C, He W, Yao L. Rice ears detection method based on multi-scale image recognition and attention mechanism. IEEE Access. 2024;12:68637–47. doi:10.1109/ACCESS.2024.3400254. [Google Scholar] [CrossRef]
11. Ge Z, Liu S, Wang F, Li Z, Sun J. YOLOX: exceeding YOLO series in 2021. arXiv:2107.08430. 2021. [Google Scholar]
12. Shu C, Liu Y, Gao J, Yan Z, Shen C. Channel-wise knowledge distillation for dense prediction. In: 2021 IEEE/CVF International Conference on Computer Vision (ICCV); 2021 Oct 10–17; Montreal, QC, Canada. New York, NY, USA: IEEE. p. 5291–300. doi:10.1109/ICCV48922.2021.00526. [Google Scholar] [CrossRef]
13. Zhang Y, Xiao D, Chen H, Liu Y. Rice panicle detection method based on improved faster R-CNN. Trans Chin Soc Agric Mach. 2021;52:231–40. doi:10.6041/j.issn.1000-1298.2021.08.023. [Google Scholar] [CrossRef]
14. Li Y, Qiu SJ, Zhao HM, Li XB, Zhang QH, Yuan XY. Real-time detection method of grain ear based on lightweight YoloV5. Jiangsu Agric Sci. 2023;51(6):168–77. (In Chinese). doi:10.15889/j.issn.1002-1302.2023.06.024. [Google Scholar] [CrossRef]
15. Wen ZJ, Zhang S, Ma X. A review of small target detection based on YOLO model. Xizang Sci Technol. 2024(5):64–76. (In Chinese). doi:10.3969/j.issn.1004-3403.2024.05.010. [Google Scholar] [CrossRef]
16. Qi Y, He Y, Qi X, Zhang Y, Yang G. Dynamic snake convolution based on topological geometric constraints for tubular structure segmentation. In: Proceedings of the 2023 IEEE/CVF International Conference on Computer Vision (ICCV); 2023 Oct 1–6; Paris, France. doi:10.1109/ICCV51070.2023.00558. [Google Scholar] [CrossRef]
17. Zheng Z, Wang P, Liu W, Li J, Ye R, Ren D. Distance-IoU loss: faster and better learning for bounding box regression. Proc AAAI Conf Artif Intell. 2020;34(7):12993–3000. doi:10.1609/aaai.v34i07.6999. [Google Scholar] [CrossRef]
18. Wang G, Chen Y, An P, Hong H, Hu J, Huang T. UAV-YOLOv8: a small-object-detection model based on improved YOLOv8 for UAV aerial photography scenarios. Sensors. 2023;23(16):7190. doi:10.3390/s23167190. [Google Scholar] [PubMed] [CrossRef]
19. Hu D, Yu M, Wu X, Hu J, Sheng Y, Jiang Y, et al. DGW-YOLOv8: a small insulator target detection algorithm based on deformable attention backbone and WIoU loss function. IET Image Process. 2024;18(4):1096–108. doi:10.1049/ipr2.13009. [Google Scholar] [CrossRef]
20. Qayyum H, Ali F, Saleem K, Ahmad I, Iqbal MJ. YOLOCSP-PEST for crops pest localization and classification. Comput Mater Contin. 2025;82(2):2373–88. doi:10.32604/cmc.2025.060745. [Google Scholar] [CrossRef]
Cite This Article
 Copyright © 2025 The Author(s). Published by Tech Science Press.
This work is licensed under a Creative Commons Attribution 4.0 International License , which permits unrestricted use, distribution, and reproduction in any medium, provided the original work is properly cited.
 Downloads
 Citation Tools