
 Submit a Paper
 Propose a Special lssue
 Open Access
ARTICLE
Addressing Class Overlap in Sonic Hedgehog Medulloblastoma Molecular Subtypes Classification Using Under-Sampling and SVD-Enhanced Multinomial Regression
1 Department of Statistics, Faculty of Mathematical and Computer Sciences, University of Gezira, Wad Madani, 21113, Sudan
2 Department of Computer Science, College of Computer and Information Sciences, Jouf University, Sakaka, 72388, Saudi Arabia
3 Department of Information Systems, College of Computer and Information Sciences, Jouf University, Sakaka, 72388, Saudi Arabia
4 Department of Statistics, Faculty of Economic and Social Studies, Omdurman Islamic University, Khartoum, 11111, Sudan
5 Department of Molecular Biology, National Cancer Institute, University of Gezira, Wad Madani, 21113, Sudan
* Corresponding Author: Murtada K. Elbashir. Email:
Computers, Materials & Continua 2025, 84(2), 3749-3763. https://doi.org/10.32604/cmc.2025.063880
Received 27 January 2025; Accepted 29 April 2025; Issue published 03 July 2025
 View Full Text
 Download PDF
Abstract
Sonic Hedgehog Medulloblastoma (SHH-MB) is one of the four primary molecular subgroups of Medulloblastoma. It is estimated to be responsible for nearly one-third of all MB cases. Using transcriptomic and DNA methylation profiling techniques, new developments in this field determined four molecular subtypes for SHH-MB. SHH-MB subtypes show distinct DNA methylation patterns that allow their discrimination from overlapping subtypes and predict clinical outcomes. Class overlapping occurs when two or more classes share common features, making it difficult to distinguish them as separate. Using the DNA methylation dataset, a novel classification technique is presented to address the issue of overlapping SHH-MB subtypes. Penalized multinomial regression (PMR), Tomek links (TL), and singular value decomposition (SVD) were all smoothly integrated into a single framework. SVD and group lasso improve computational efficiency, address the problem of high-dimensional datasets, and clarify class distinctions by removing redundant or irrelevant features that might lead to class overlap. As a method to eliminate the issues of decision boundary overlap and class imbalance in the classification task, TL enhances dataset balance and increases the clarity of decision boundaries through the elimination of overlapping samples. Using fivefold cross-validation, our proposed method (TL-SVDPMR) achieved a remarkable overall accuracy of almost 95% in the classification of SHH-MB molecular subtypes. The results demonstrate the strong performance of the proposed classification model among the various SHH-MB subtypes given a high average of the area under the curve (AUC) values. Additionally, the statistical significance test indicates that TL-SVDPMR is more accurate than both SVM and random forest algorithms in classifying the overlapping SHH-MB subtypes, highlighting its importance for precision medicine applications. Our findings emphasized the success of combining SVD, TL, and PMR techniques to improve the classification performance for biomedical applications with many features and overlapping subtypes.Keywords
Medulloblastoma (MB) starts in the cerebellum, the part of the brain crucial for voluntary muscle movements like balance and motor control. MB is the most prevalent malignant brain tumor in children, even though it can also happen in adults [1]. The standard treatment regimen for MB, which includes surgical resection, radiation therapy, and chemotherapy, has resulted in favorable short-term outcomes. The pressing need for less toxic and more targeted therapy calls for a greater understanding of the heterogeneity within and amongst MB tumors. Sonic Hedgehog MBs (SHH-MB) molecular subgroup represents 30% of cases and is characterized by an overactive Sonic Hedgehog pathway caused by acquired or inherited mutations [2]. The SHH-MBs have been established as distinct subtypes with the advancement of molecular studies using transcriptomics and DNA methylation profiling methods. There are probably four molecular subtypes of SHH-MB: SHH_alpha, SHH_beta, SHH_delta, and SHH_gamma [3,4]. These classifications could enhance personalized plans of therapy and improve patient outcomes by improving the accuracy of predictions. Recent research into SHH-MB has significantly fostered our understanding of the molecular subtypes of the disease and their implications for tumor biology and therapy. Recent studies contributed noteworthy conclusions. A comprehensive review of current developments in SHH-MB molecular analysis has underlined significant intertumoral variability among SHH-MB tumors and led to the identification of new subtypes with distinct biochemical and clinical features [4]. The authors of [5] emphasized the combination of computational analysis with single-nucleus RNA sequencing to investigate the relationships between tumor heterogeneity and developmental trajectories in SHH MBs. The study emphasized the potential for differentiated treatment of SHH-MBs by identifying cell types associated with the various phases of granule neuron development. Investigating 96 samples of SHH-MB that were identified using RNA sequencing, targeted DNA sequencing, and genome-wide DNA methylation profiling, the authors of [2] detected molecular subtypes of this tumor and assessed their prognostic relevance. Their study concluded that adult MBs, although histologically uniform, demonstrate remarkable molecular heterogeneity. Furthermore, they deduced that the identification of two distinct molecular subtypes was integral to understanding their disparate clinical behaviors and outcomes. A cohort of 250 human SHH-MB samples was analyzed by strand-specific RNA sequencing with the incorporation of DNA methylation and whole-genome sequencing to investigate their molecular subtypes and underlying biology. The findings support the presence of four clinical subtypes based on presentation and age: SHH_alpha, SHH_beta, SHH_gamma, and SHH_delta [6].
Several factors influence the performance of any classification model, particularly in the case of multiclass classification. The effectiveness of machine learning algorithms in practical settings may be hampered by class imbalances, but this effect is dependent on class overlap as well [7]. Class overlap occurs when samples from different classes exist in common areas within the feature space, thereby creating ambiguity in the decision domains [8]. The underlying classifier’s overall performance gets worse with the increasing level of class overlap since it incorrectly classifies the samples along the boundary line [9]. Different strategies have been proposed to address the class overlap issue in the classification problem. An under-sampling-based supervised learning was created by the authors of [10] to address the class imbalance in binary datasets, where there is a class overlap issue. Their proposed under-sampling framework effectively addressed the challenge of class imbalance and class overlap in binary datasets. The visibility of the minority class was enhanced by identifying and removing overlapping majority-class samples. Their suggested method’s sensitivity was comparable to the state-of-the-art approaches. Wang et al. [11] introduced Extreme SMOTE and Synchronous Sampling Learning Methods as effective methods for improving financial distress detection in listed companies that have issues with class imbalance and class overlap. Their proposed method, while focusing on refining decision boundaries and optimizing company selection, significantly improved the classification performance of various machine learning algorithms. An under-sampling algorithm based on random forest cleaning rule (RFCL) was introduced by Zhang et al. [12]. It provides a solid solution for managing class imbalance and class overlap in classification problems. Effectively defining and applying a new decision boundary, RFCL enhances model performance, outperforming other under-sampling methods. Entropy and neighborhood-based under-sampling (ENU), a method recently developed by Kumar et al. [13] was intended to remove the majority of class samples from the overlapping regions to manage class overlap in classification tasks. ENU computes entropy scores for the majority class samples and establishes a threshold to determine which samples can be removed. The results indicate that ENU significantly outperforms several state-of-the-art methods across various metrics.
The earlier studies on class overlap in the classification task have certain drawbacks. Their primary focus is on binary classification tasks. Multiclass classification, however, adds more complexity, which, in turn, requires further research and customized methods. On the other hand, certain research avoids the majority class sample from areas where it overlaps with the samples from different classes, the selection of distance measures can make a distinction in how the overlapping regions are perceived [10,13]. Moreover, certain studies overlook the potential risk of overfitting that arises from oversampling specific types of samples, particularly when those samples are excessively similar to the training set. In our previous study, we successfully classified imbalanced MB subgroups using singular value decomposition-based penalized multinomial regression (SVDPMR) [14]. In the present study, we aimed at further sub-classifying a main molecular subgroup of MB, namely SHH-MB, by applying Tomek links-based SVDPMR (TL-SVDPMR) to analyze DNA methylation probe features from samples of SHH-MB patients. Penalized multinomial regression (PMR) model is helpful for multiclass classification tasks, mainly when working with high-dimensional data. The PMR model is a penalized generalized linear model that is fitted by minimizing the penalized loss function. Numerical techniques are employed to estimate the coefficients in the PMR model. We employed SVD and group lasso as dimensionality reduction techniques. SVD created a new low-dimensional input feature space from the training set. Then, the group lasso selected features that distinctly represent each SHH-MB subtype. Tomek Links (TL) finds the sample pairings of different subtypes that are closest to one another [15]. By eliminating the sample from the majority subtype in these pairs, TL helps to improve model performance and decision boundaries by removing samples that lead to class overlap. By reducing the number of features and selectively decreasing samples from the majority classes, these methods could enhance the clarity of class boundaries and improve the performance of the classification model. Our ultimate objective was to achieve high performance in correctly distinguishing the four subtypes within SHH-MB with less error.
This study’s dataset represents the genome-wide DNA methylation profiling of 763 primary SHH-MB samples. Each MB sample has 321,174 DNA methylation probe features. The samples were separated into subtypes within the four main molecular subgroups of MB. We chose a subset of the methylation dataset that includes only the four SHH-MB subtypes. The dataset is found on Gene Expression Omnibus with accession number GSE85212.
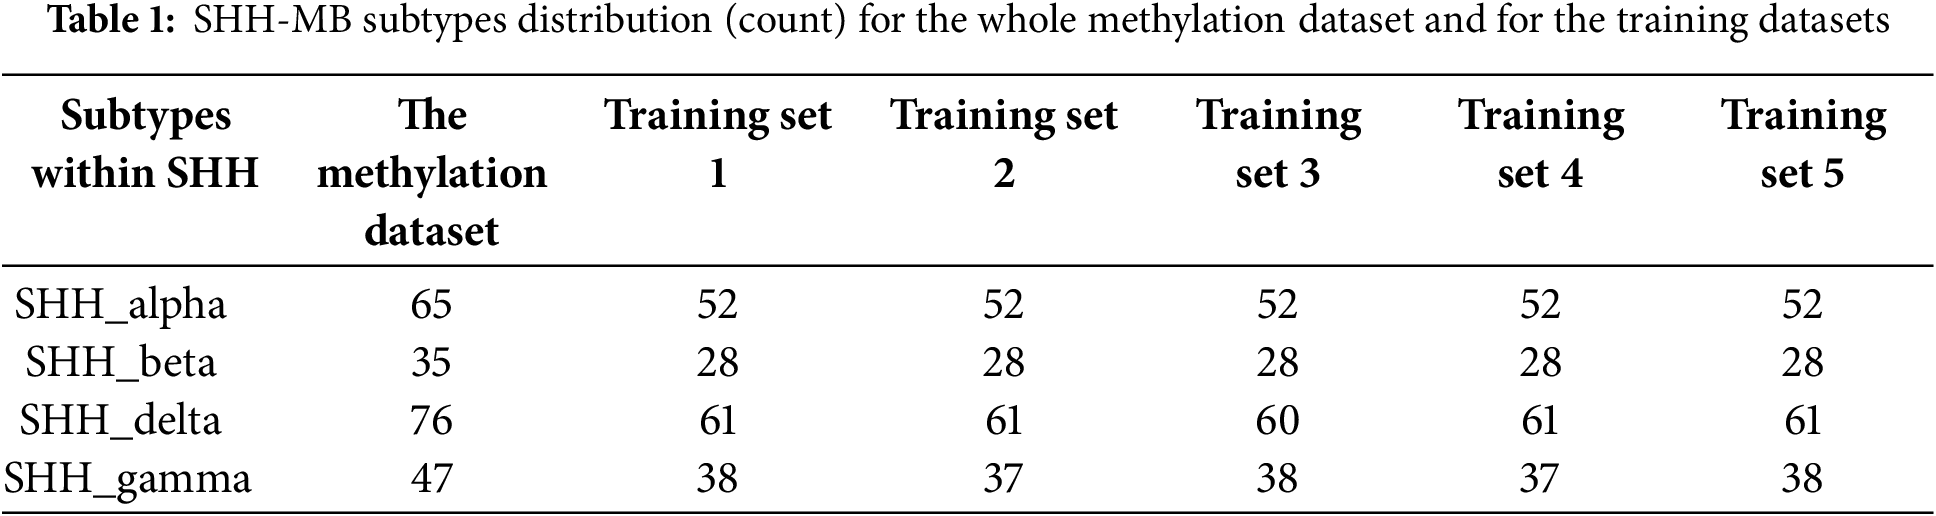
We used stratified fivefold cross-validation to ensure the generalization of the proposed models to the unseen samples. This resampling method includes randomly splitting the SHH-MB samples into five groups that are roughly equal in size. One fold is used as a test set, while the remaining four folds are used to fit the proposed method, and the performance of the predicted models is recorded based on the test set. This procedure is repeated until all five folds are used as a test set. Consequently, there are five different training sets (Training Set 1, Training Set 2, Training Set 3, Training Set 4, and Training Set 5) in five-fold cross-validation and a corresponding testing set for each training set. To perform five-fold cross-validation, we used a k-fold function from the Bimba R package, version 1.3.14. The model’s performance metrics were then calculated as the average of the reported scores. Table 1 shows the distribution (count) of SHH-MB subtypes for each training set and the whole methylation dataset. There is an unequal distribution of SHH-MB samples among their subtypes in each training set and high feature dimensionality (321,174 features).
The proposed strategy combined various techniques to solve the class overlap problem in classifying SHH-MB subtypes as presented in Fig. 1. In the first step, SVD was applied to the training set to map the original input feature space to the new low-dimensional input feature space. SVD is used to overcome the impact of correlated or redundant features on the classification method’s performance. Moreover, it reduces the dimension of the training set while preserving the most important information. Second, by undersampling the majority subtypes in the area where they overlap with the minority subtypes, TL improves the clarity of the decision boundaries separating the SHH-MB subtypes. Third, implementing PMR on the standardized new input features space to create the classification models. In this step, group lasso, as a penalization method, plays a crucial role in selecting features that can help clarify the class boundaries between SHH-MB subtypes. Finally, we evaluated the classification models on the testing sets using standard evaluation metrics.
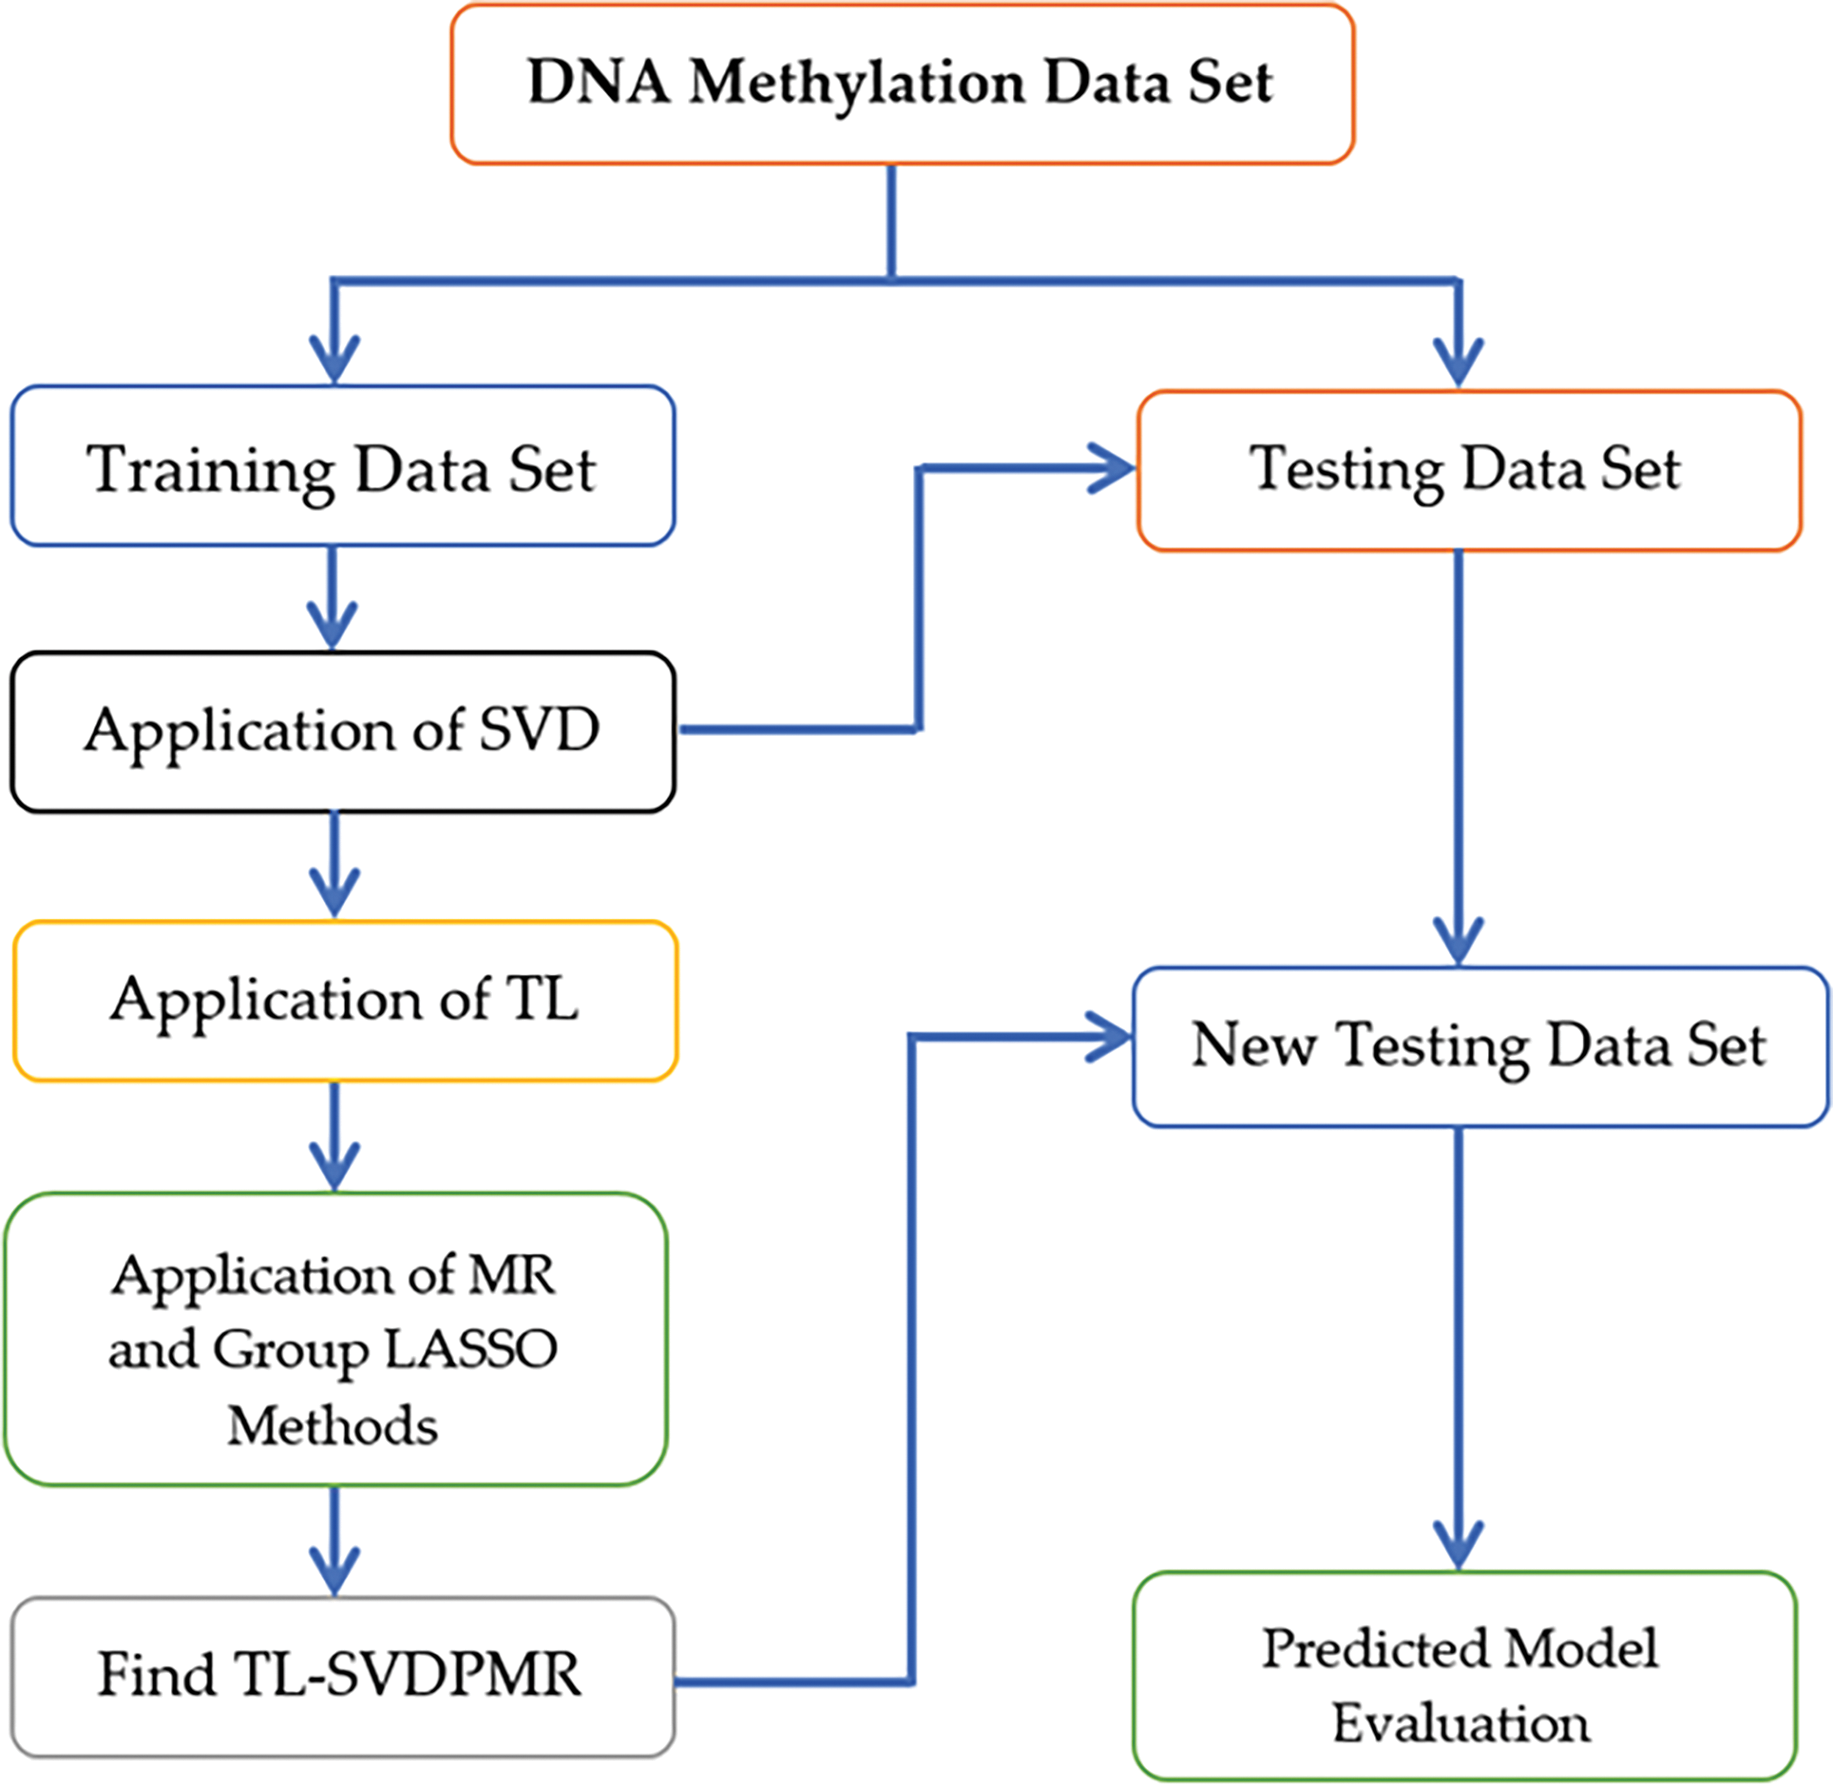
Figure 1: Flow chart of the proposed method for SHH-MB subtypes classification
2.3.1 Singular Value Decomposition (SVD)
SVD can be used to decompose a real matrix. A positive semidefinite normal matrix’s eigenvalue decomposition can be extended to apply to any
where
The explained variances of all the newly added features up to a particular feature are added together to create cumulative explained variance [14,16]. For the application of the SVD method to the methylation dataset, we used the SVD function in the base R package (version 0.5.2).
2.3.2 Undersampling-Based Tomek Links
The Euclidean distance between the two samples, x and y, which belong to different classes, is represented by
2.3.3 Penalized Multinomial Regression (PMR)
Consider a design matrix
where
The total probability that each sample belongs to the true SHH-MB subtype is represented by the value of
Regularization techniques use penalization, or the penalized loss function, to address the statistical difficulties of high-dimensional data. It is possible to carry the high-dimension parameter matrix
The L2 norm, written as
Coordinate descent was used to get the estimate of coefficients in the penalized negative-log-likelihood problem in Eq. (6) [21]. We utilized the fit function from the msgl R package, version 2.3.9, to perform PMR.
Different performance metrics were employed to determine the effectiveness of our proposed classification model on unseen samples. Overall accuracy (ACC), specificity, recall, area under the curve (AUC), NLL, and the 95% confidence interval (CI) for ACC are some of these performance metrics [14,22,23]. Four values are crucial to understand to assess the classification model’s performance: (1) the number of samples that belong to a class and are accurately predicted is known as the class’s TPs (
where
The following formula is used to calculate the specificity of class
To determine the ACC and 95% CI for our classification approach, we utilized the confusion Matrix function from the caret R package, version 6.0.93. Recall and specificity were obtained by using ml_test from the mltest package, version 1.0.1. Furthermore, A fitted model’s residual deviance is equal to twice its log-likelihood minus i.e., −2 log-likelihood (NLL) in Eq. (6) [24]. Deviance is defined as the average of −2 log-likelihood for a dataset with n observations. When the highest predicted probability deviates from the correct class, the NLL increases. We used the Err function from the sglOptim R package, version 1.3.8, to get the values of NLL. Receiver operating characteristic (ROC) curves were also utilized to evaluate the proposed classifier. The area under the curve (AUC), which is commonly used for technique comparison in the ROC context, measures a binary classifier’s performance. A better classification is indicated by a higher AUC. The “one vs. all” (OvA) method can be used to extend ROC curves from binary classification to multiclass classification as follows: (1) create a binary classification task for each class in your dataset. This implies that one class will be considered as the positive class and the other classes as the negative classes. (2) Based on the predicted probabilities related to each class, determine the sensitivity and specificity for each binary variable associated with that class for various thresholds. Four predicted probability vectors relating to the SHH-MB subtypes and four binary variables representing each subtype were used in this study. The ROC curve represents the specificity and sensitivity of a classification at a given threshold. Trapezoids are used to compute AUCs [25,26]. The roc function from the pROC package, version 1.18.0, was used to get the AUC values for each SHH-MB subtype. Moreover, to plot ROC curves, we utilized the ggplot function from the ggplot2 package, version 3.5.1.
3.1 Classification Performance of SVDPMR with Different Resampling Methods
We employed fivefold cross-validation as a way to assess the performance of SVDPMR with different resampling methods in the classification of the four overlapped molecular subtypes within SHH-MB. These resampling methods include the synthetic minority oversampling technique (SMOTE), edited nearest neighbors (ENN), and tomek links (TL). The aforementioned techniques were applied to increase the minority class (SHH_beta) samples’ visibility in the area where they overlap with the other classes.
Employing the SMOTE method, we tried to improve the representation of the minority class by creating synthetic samples. The ENN technique was applied to clean the dataset from the noisy samples. Finally, Tomek links were used to find the nearest neighbor pairs of samples from different classes. The technique cleans the dataset and lessens class overlap by eliminating the majority of class instances that make up these linkages.
After training our classification model with different numbers of SVD-transformed features, we selected the optimal number of features for our classification job, which enhanced the model’s performance. The majority of the information in our dataset, which consists of 178 transformed features, is captured by the first two transformed features in each of the five folds, which account for at least 96% of the variance. Fig. 2 shows a plot of each patient in each training dataset in the first new 2-dimensional feature space obtained via SVD using colors that match their SHH-MB subtype to allow us to investigate the degree of class overlap between the SHH-MB subtypes. The findings from Fig. 2a–e demonstrate that for each of the five training datasets, SHH-delta samples and SHH_alpha samples showed some overlap. In contrast, SHH-beta shows a considerable overlap with SHH-gamma. Table 2 summarizes the SVDPMR model’s performance through the previously described resampling techniques. It displays the ACC with 95% CI and NLL using fivefold cross-validation. The results presented in Table 2 demonstrate that the best accuracy was obtained when SVDPMR with TL models is applied across all cross-validation folds except the third fold, with an average ACC value of 94.6%. The SVDPMR with the ENN method also showed a competitive average ACC of 92.8%, suggesting it could be a viable alternative. On the other hand, the lowest ACC was obtained when SVDPMR with SMOTE was applied across all cross-validation folds except the third fold; an average ACC value of 90.2% was achieved. Moreover, the average NLL of using SVDPMR with TL is 0.308, indicating that the sum up of the probabilities that each sample belongs to the incorrect class is around 0.3.
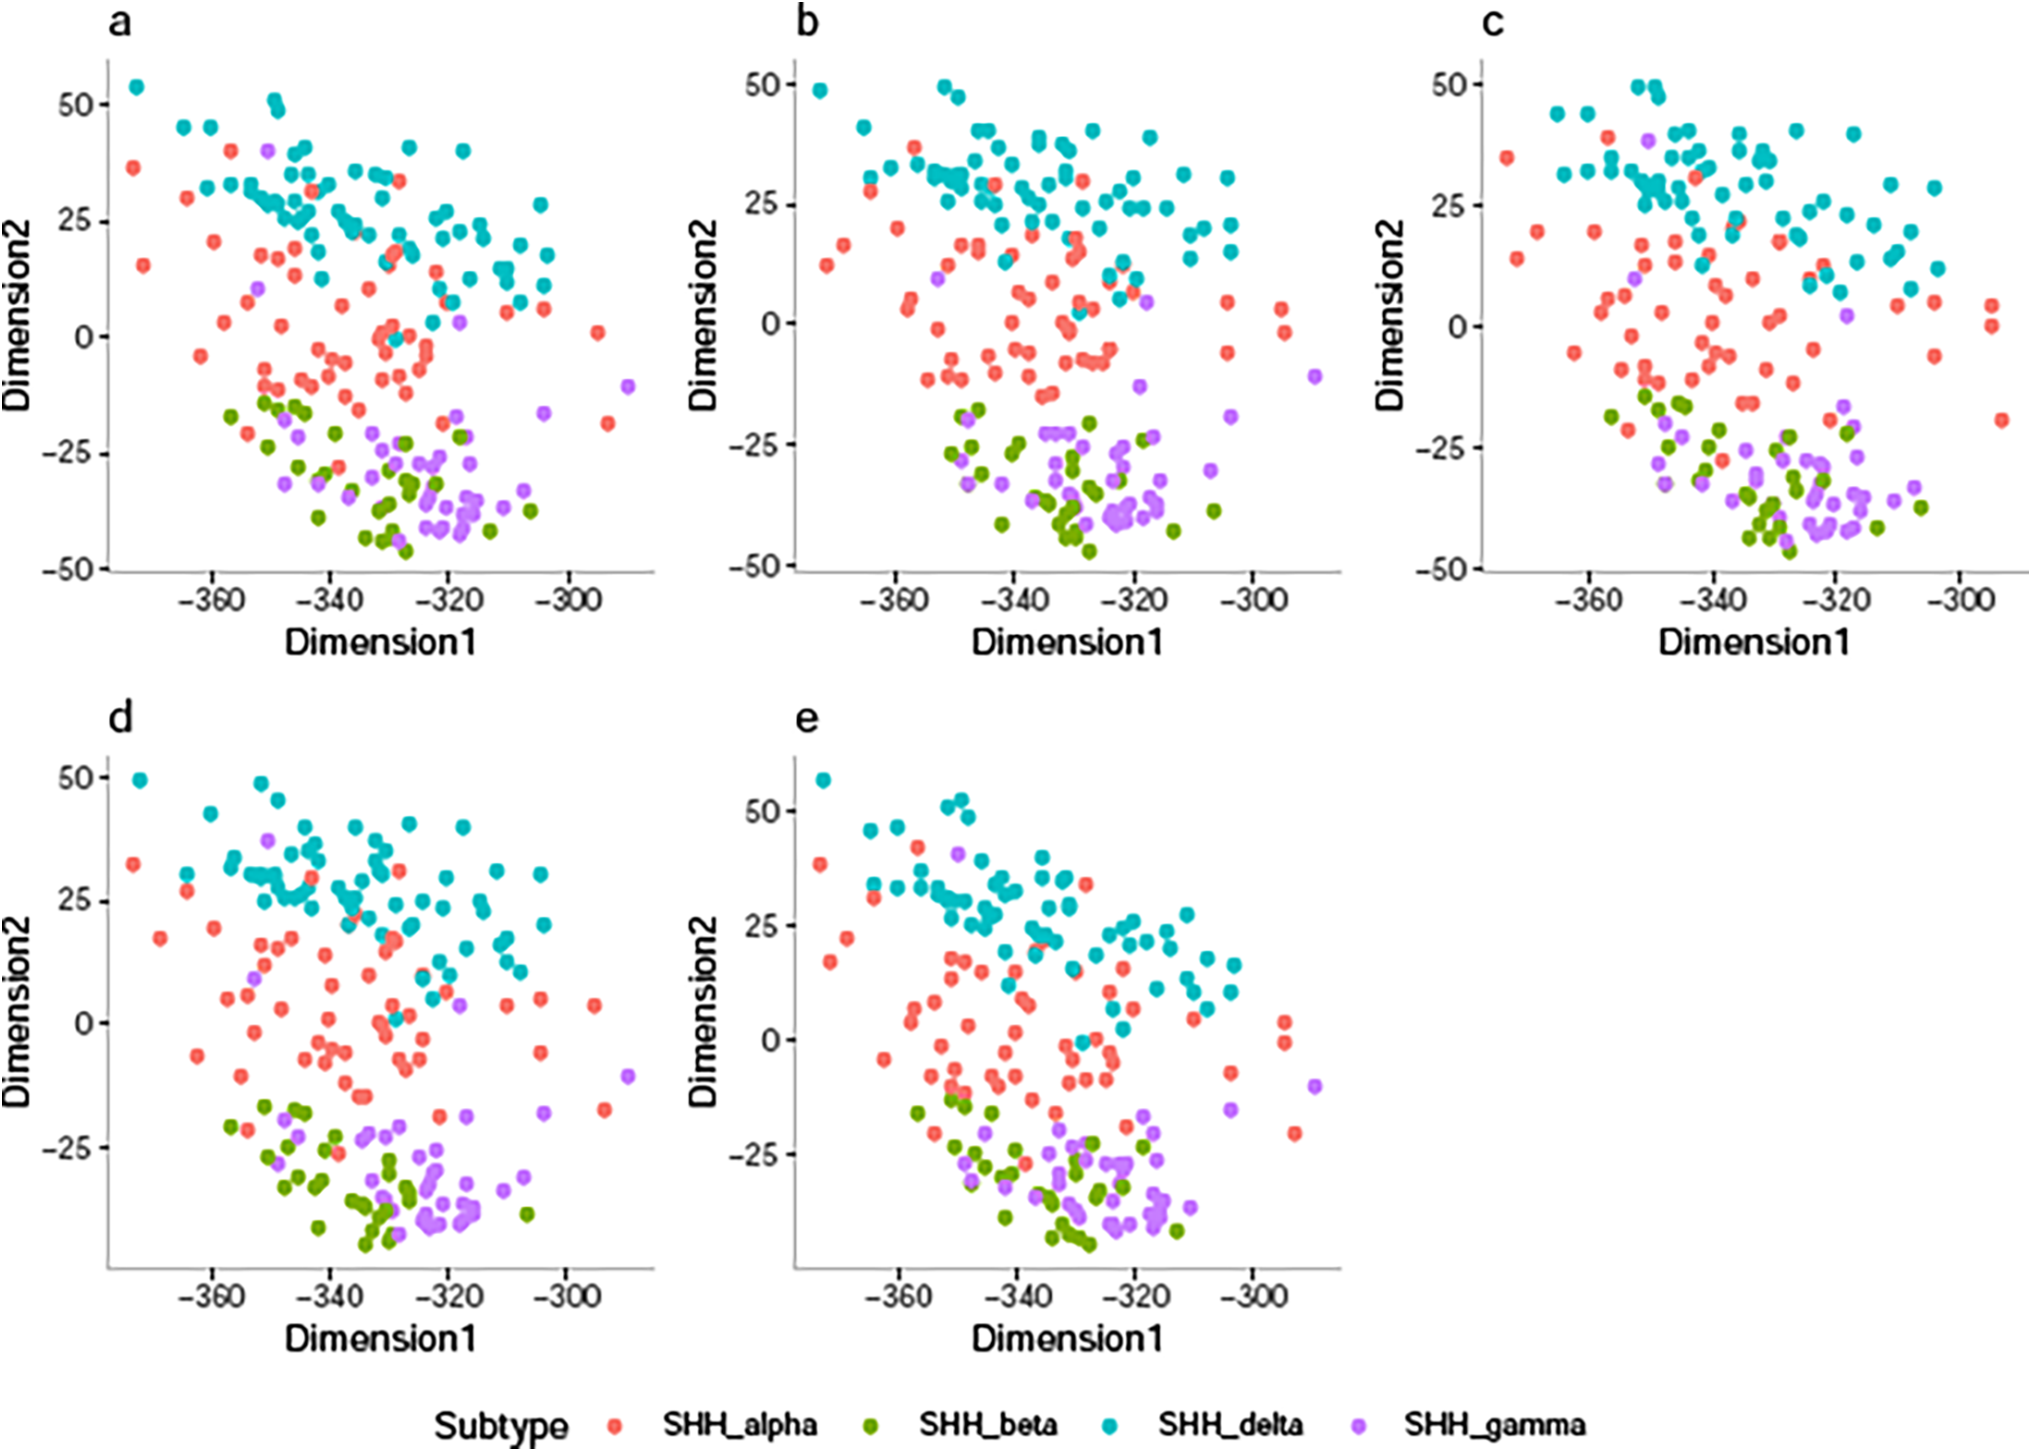
Figure 2: 2D-SVD plot representing the SHH-MB samples in the (a) Training Set 1, (b) Training Set 2, (c) Training Set 3, (d) Training Set 4, and (e) Training Set 5
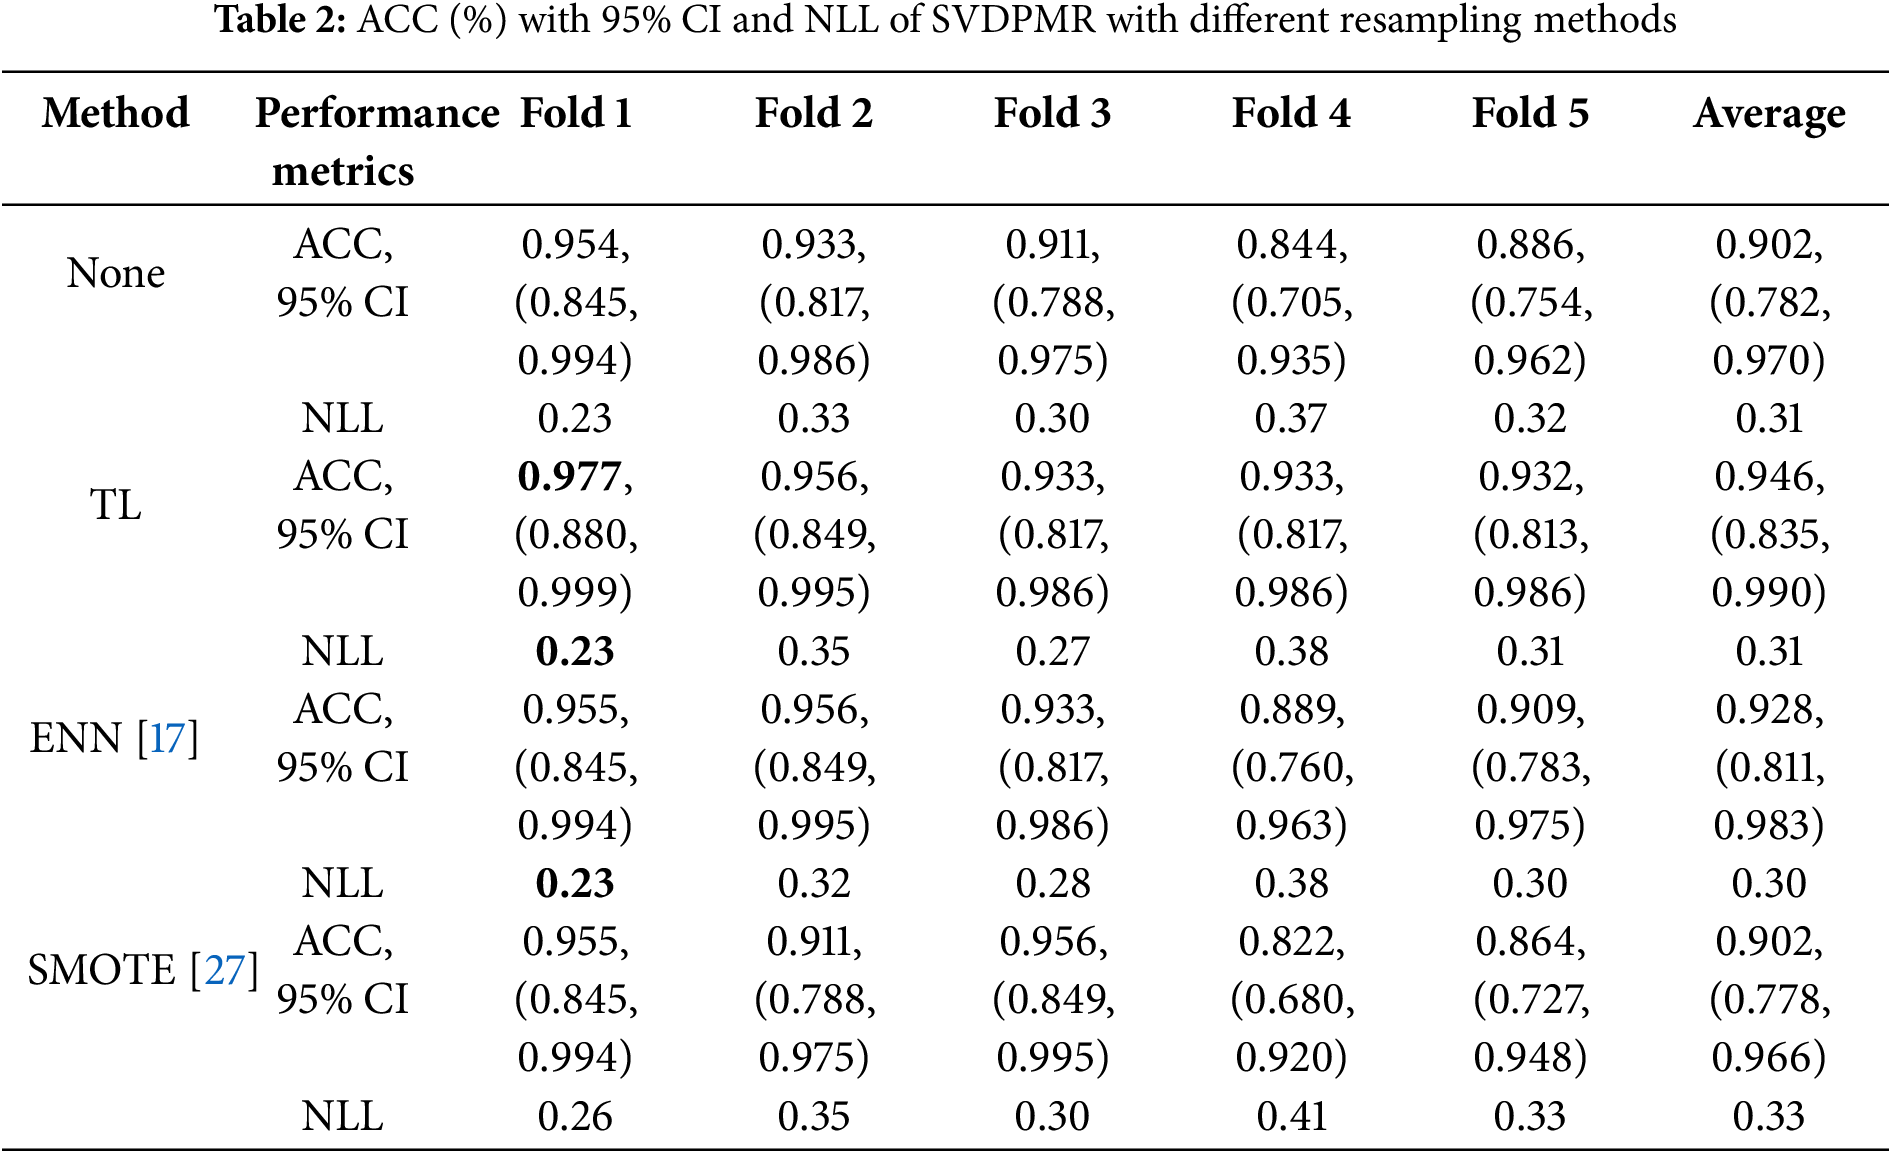
In brief, applying the SVDPMR model with TL (TL-SVDPMR) on the dataset across all folds of cross-validation performed well in maximizing the value of ACC. Moreover, TL-SVDPMR’s average NLL is 0.31, which is lower than SVDPMR with SMOTE but comparable to SVDPMR and SVDPMR with ENN approaches.
3.2 Classification Performance of TL-SVDPMR for the Subtypes within SHH-MB
To explore the effect of TL-SVDPMR, which can be used to solve class overlap issues, we used confusion matrices as a highly effective analytical procedure. First, we identified TL between SHH-MB subtypes using various feature sets across multiple folds. We specifically looked at SHH_alpha and SHH_delta in one context and SHH_beta and SHH_gamma in another. For training sets 1, 2, 3, 4, and 5, we utilized the first 150, 117, 42, 9, and 29 transformed features by SVD, respectively. To build the trained models by PMR, we used different numbers of features from each training set. We utilized the first 15, 15, 70, 89, and 9 features, respectively, from training sets 1, 2, 3, 4, and 5. Additionally, we selected the penalization parameter to 0.05.
Fig. 3 illustrates the confusion matrices resulting from applying the TL-SVDPMR models in each testing fold. As apparent in Fig. 3a, the models discovered that one SHH_beta sample had been incorrectly classified as a SHH_alpha sample in the first fold. Fig. 3b’s findings demonstrate that when the TL-SVDPMR model is used in fold2, one SHH_gamma patient was falsely classified as a SHH_delta patient, and one SHH_alpha patient was incorrectly classified as a SHH_gamma patient. When the proposed model was applied to fold 3, Fig. 3c shows that two SHH_gamma patients and one SHH_delta patient were incorrectly classified as SHH_beta and SHH_alpha, respectively. Fig. 3d’s findings demonstrate that when the model was applied to fold4, two SHH_alpha patients were mistakenly classified as SHH_gamma and SHH_delta patients, while one SHH_beta patient was mistakenly classified as a SHH_gamma patient. Lastly, Fig. 3e demonstrates that two SHH_alpha patients and one SHH_gamma patient were misclassified as SHH_delta and SHH_alpha, respectively, when the proposed model was applied to fold 5.
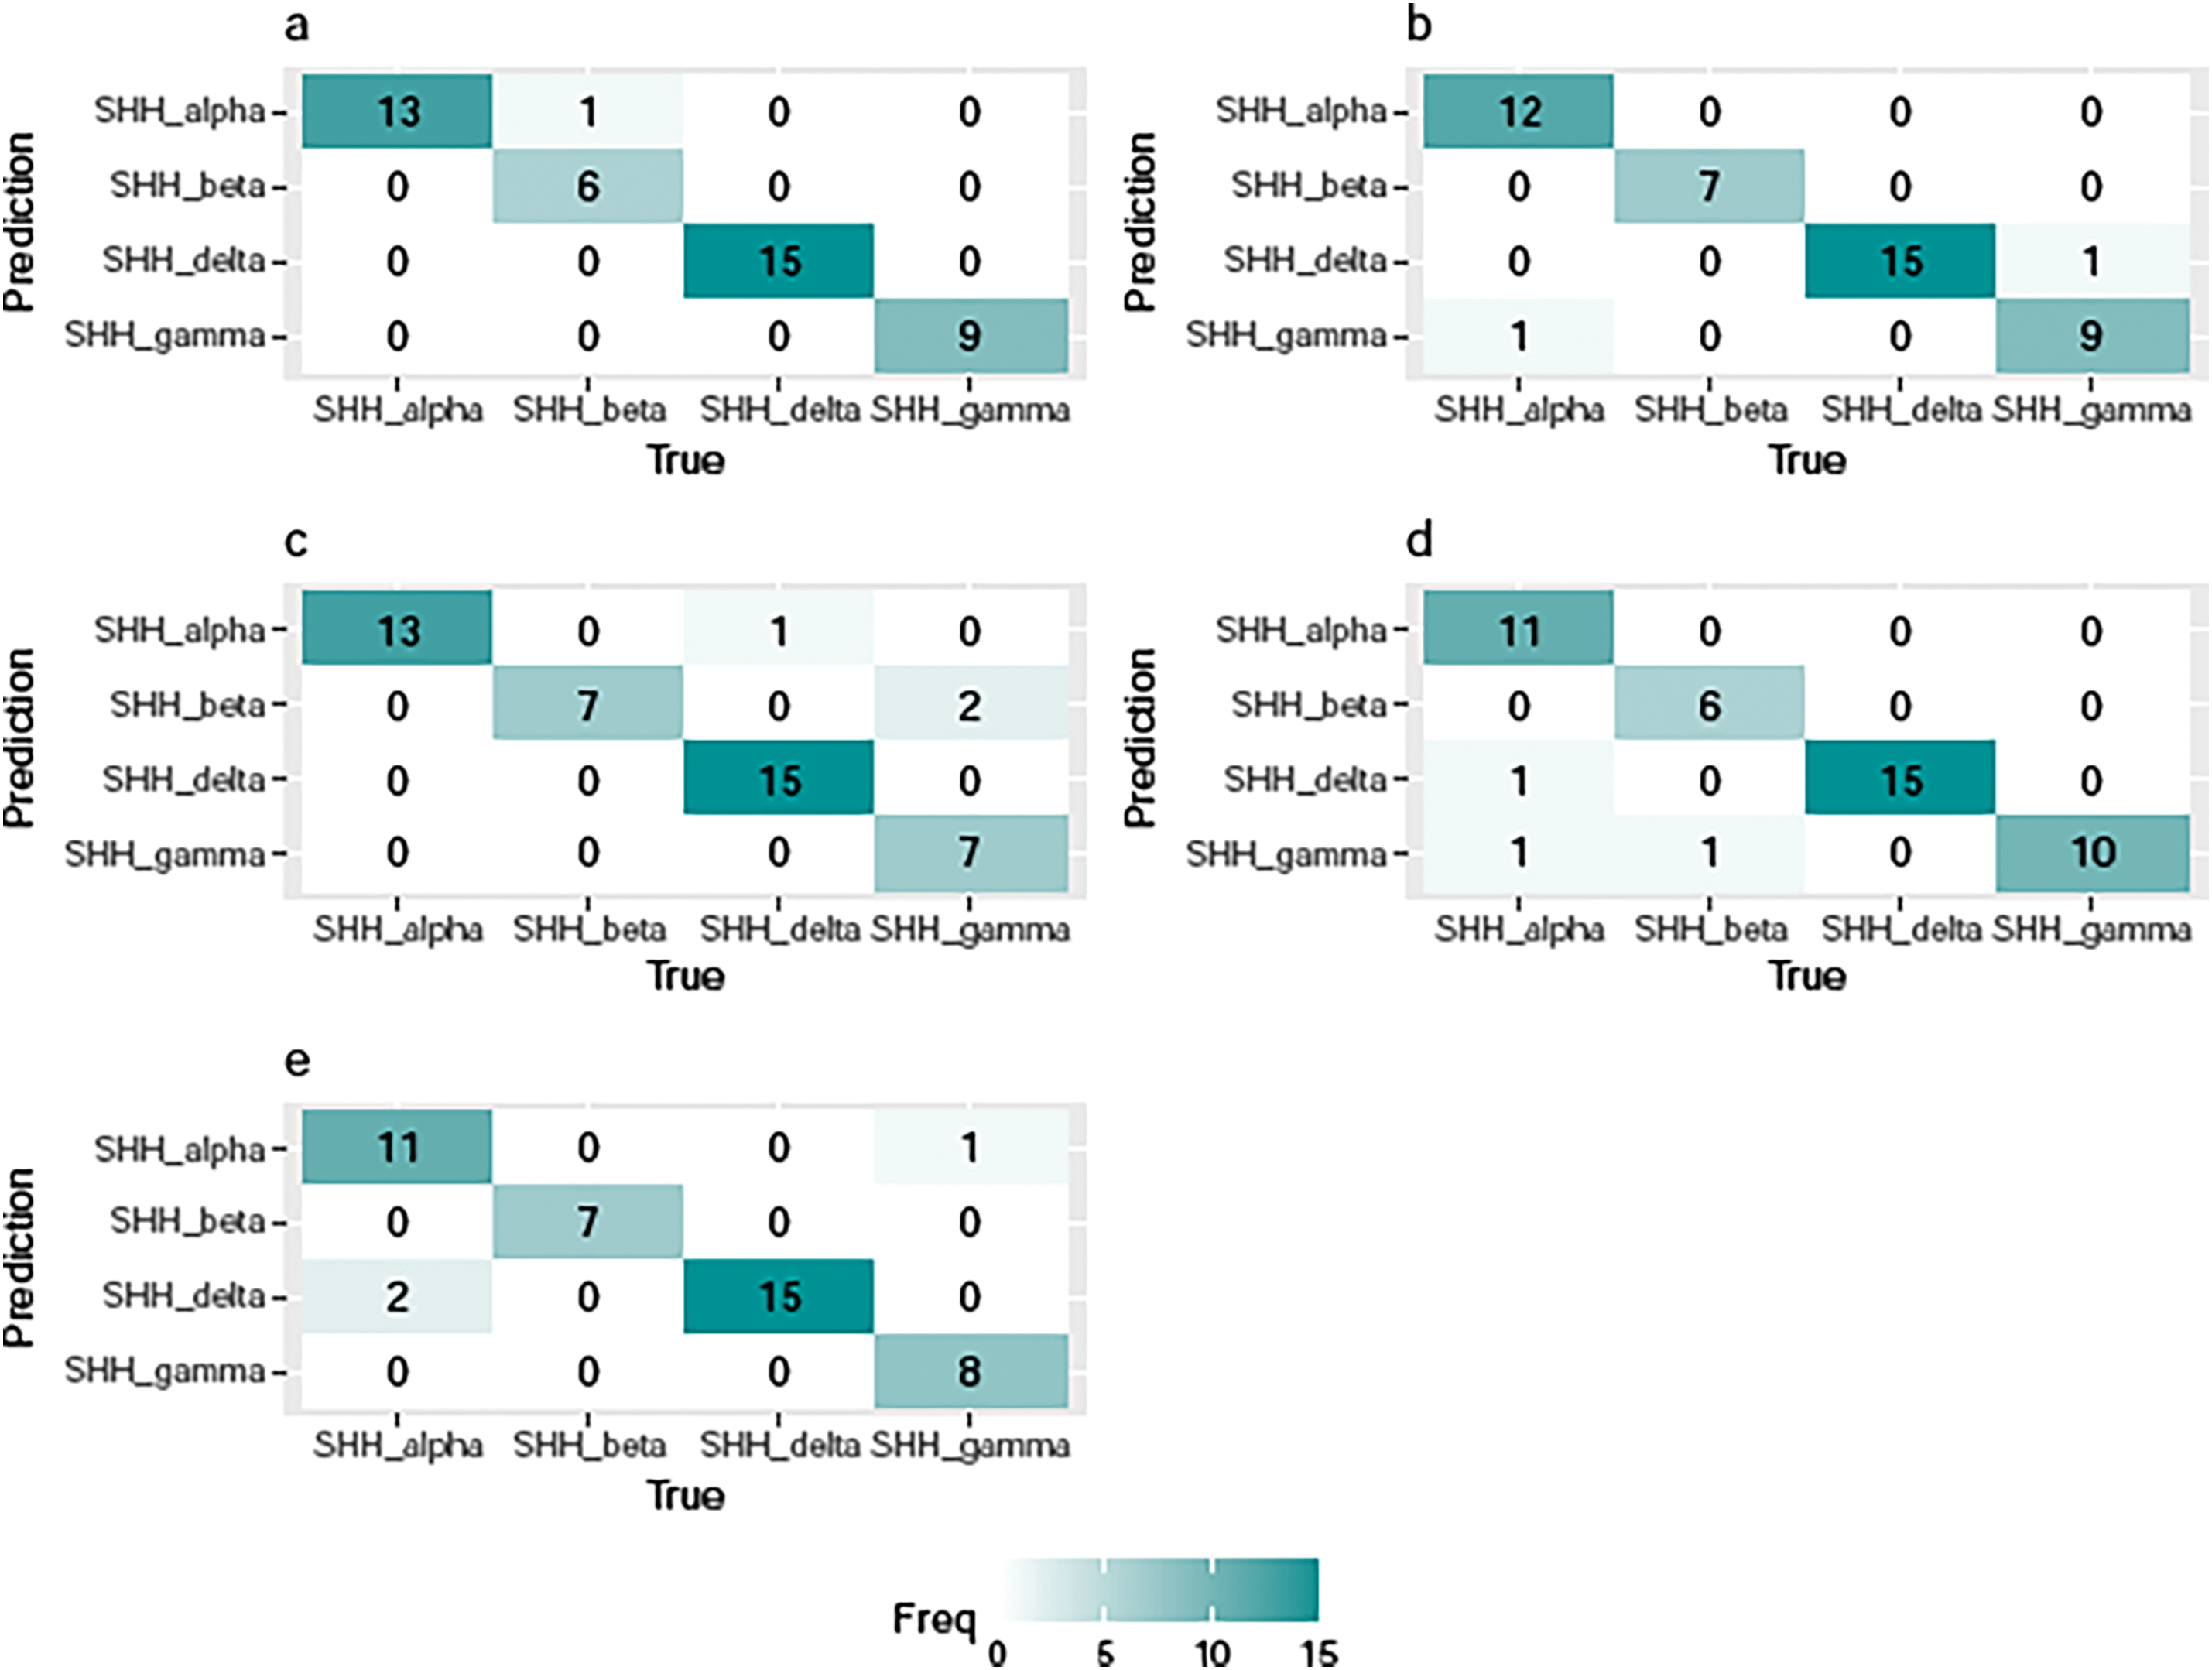
Figure 3: Confusion matrices of TL-SVDPMR based on (a) fold 1, (b) fold 2, (c) fold 3, (d) fold 4, and (e) fold 5
In short, the TL-SVDPMR approach may be able to successfully handle class overlap problems, but more work is needed to improve accuracy across all SHH-MB subtypes. Fig. 4 represents the ROC curve of our classifier’s performance across around 50 thresholds. Based on the predicted probability for each subtype, it plotted the specificities against the sensitivities across around 50 thresholds. For each subtype, we consider it as the positive class and all combined other subtypes as the negative class. This results in a separate ROC curve for each subtype. From Fig. 4a–e, the results indicate that, on each testing fold, a greater sensitivity value corresponds to a lower specificity value, and vice versa. The average area under the curve (AUC) for the subtypes SHH_alpha, SHH_beta, SHH_delta, and SHH_gamma was 0.984, 0.996, 0.997, and 0.975, respectively. This trade-off highlights the balance between correctly identifying positive cases (sensitivity) and minimizing false positives (specificity). The results indicate a strong performance of the proposed classification model across different subtypes of SHH-MB based on the average AUC values.
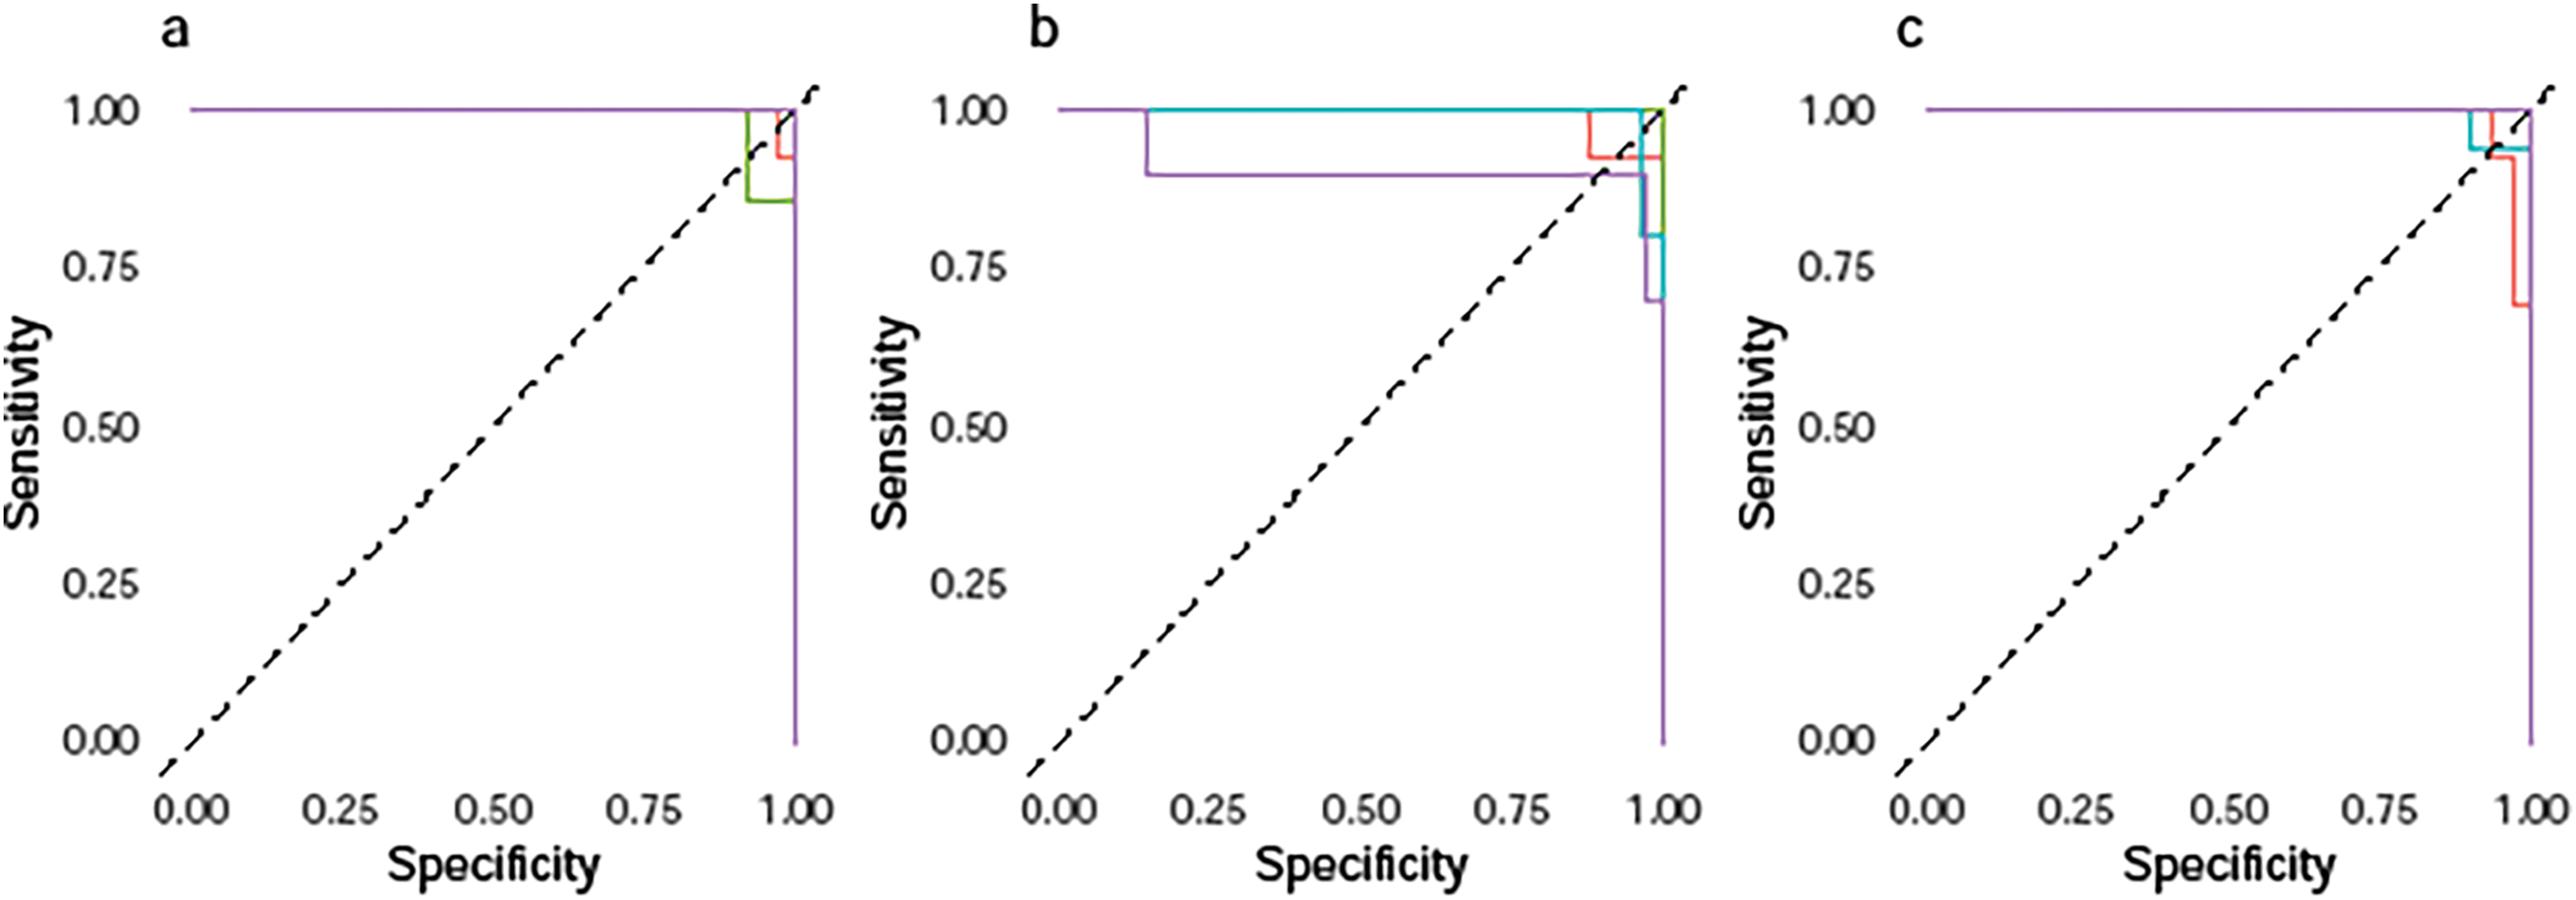
Figure 4: Multiclass ROC curves of TL-SVDPMR on (a) fold 1, (b) fold 2, (c) fold 3, (d) fold 4, and (e) fold 5
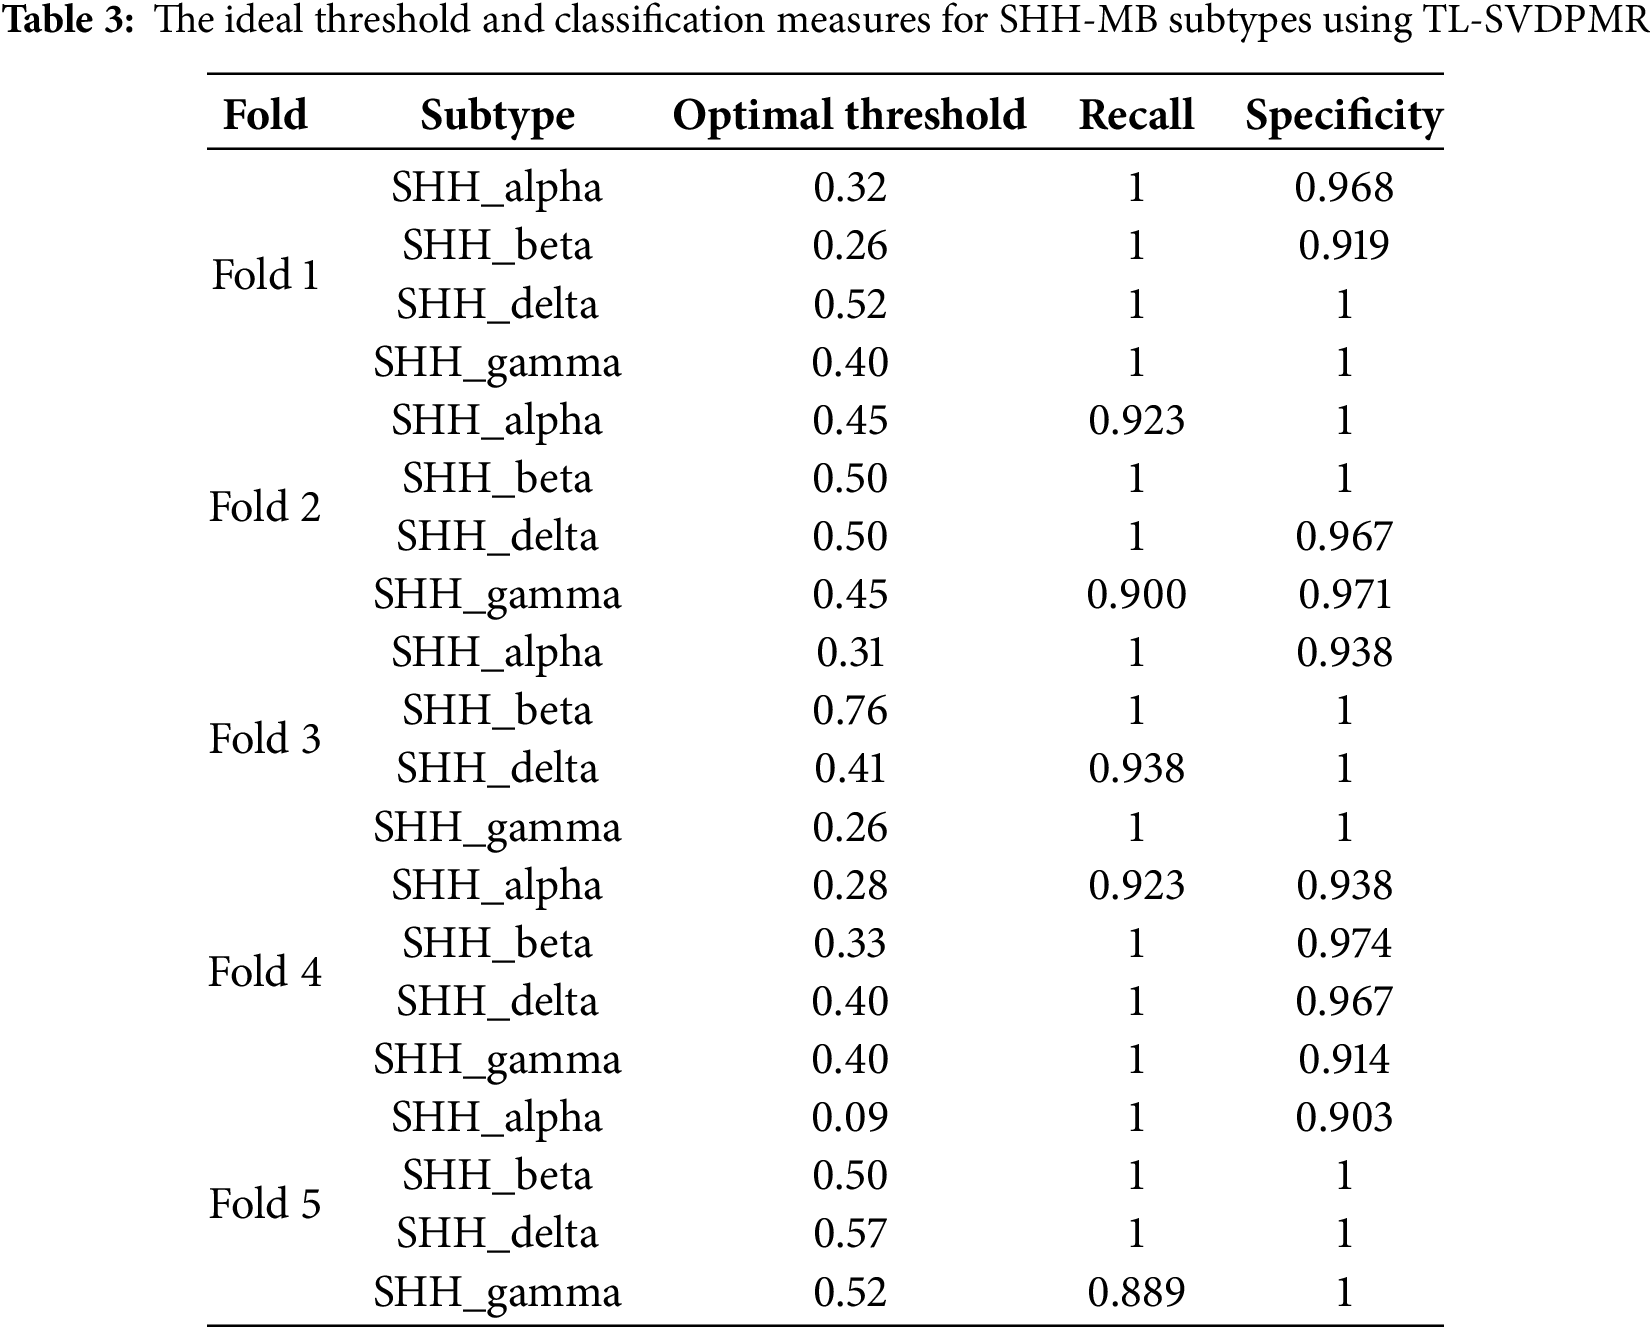
The findings in Table 3 shed light on the best thresholds, along with the associated recall and specificity, for the different SHH-MB subtypes when using the TL-SVDPMR method in a binary classification framework. Each subtype is treated as the positive class in this situation, and the others are considered as negative classes. The sensitivity and specificity of the TL-SVD-PMR models at each threshold were calculated using Eqs. (8) and (9), respectively. Excellent sensitivity was demonstrated by the high recall rates (1) achieved for multiple subtypes across folds, and the specificity values were also generally high.
A robust machine for predicting overlapped molecular subtypes in SHH-MB using DNA methylation data is created by using SVD for dimensionality reduction, TL for undersampling the majority subtypes that are located in the overlapping region with the minority subtypes, PMR as a classifier, and Coordinate Descent for optimization. The mean accuracy of about 95% achieved shows the feasibility of this approach, indicating the utility of this strategy for precision medicine and tailored therapies.
Employing DNA methylation data, we compared our proposed method (TL-SVDPMR) with a random forest (RF) algorithm [28]and support vector machine (SVM) [29]. We used SVD to reduce the dimensionality of the features before using RF and SVM techniques. To train effective RF and SVM models, we selected the number of first features derived by SVD based on variance explained and model performance. TL is used to make the decision boundaries for separating the SHH subtypes less blurry by reducing the number of samples in the majority classes. In addition, we chose a numerical optimization method, which can take advantage of minimizing the loss function, expressed as the sum of the probabilities that each sample is assigned to the wrong class. Based on fivefold cross-validation, the results shown in Table 4 summarize the performance of the three methods in classifying SHH-MB subtypes using the DNA methylation dataset. The assessment is provided by AUC values, specificity, and sensitivity metrics in a multiclass classification context.
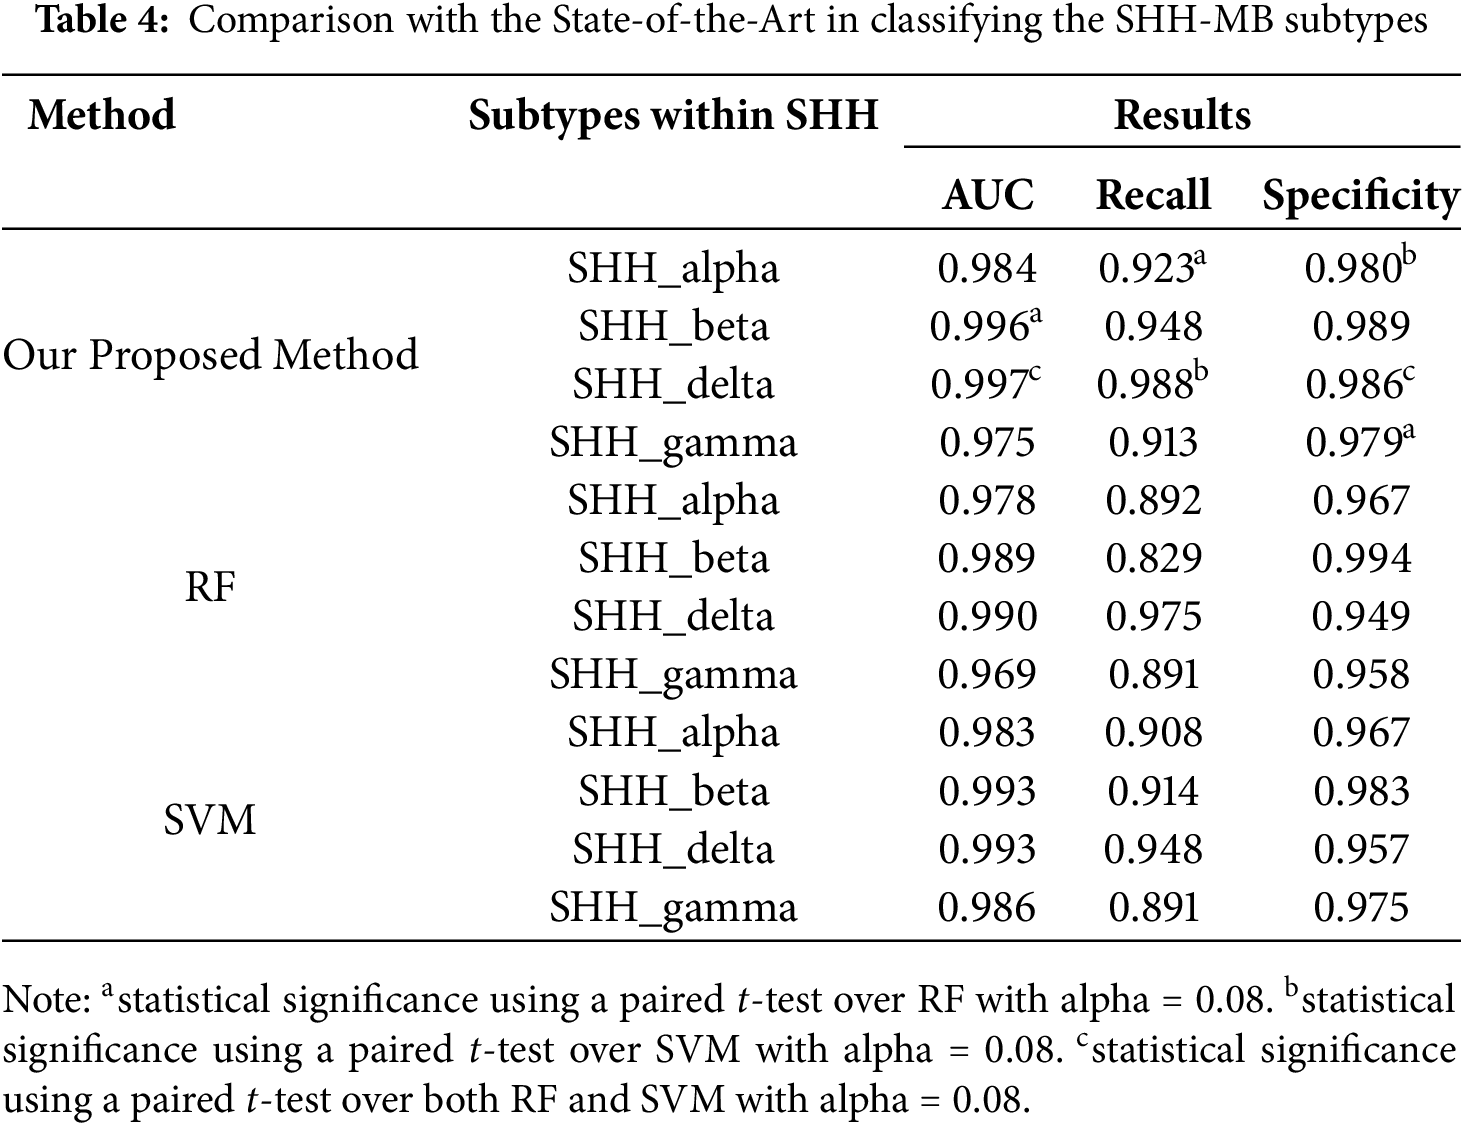
All of the SHH-MB subtypes, including SHH_delta, have a high average AUC value (0.997), indicating our proposed method’s exceptional classification ability. Next in line is SHH_beta at 0.996. For RF and SVM, the competitive AUC values were between 0.969 and 0.990 and 0.983 and 0.993, respectively. However, our method consistently outperformed both.
The recall metrics show the high sensitivity of our method, particularly for SHH_delta (0.988) and SHH_beta (0.948). These figures suggest that positive cases within these subtypes can be identified with a high degree of accuracy. Both RF and SVM showed lower recall values, with RF reaching a maximum of 0.975 for SHH_delta and SVM reaching 0.948 for SHH_delta. With high specificity, our method demonstrated good negative case classification for all subtypes, particularly SHH_beta (0.989). In conclusion, our proposed method performs significantly better in the classification of SHH-MB subtypes than RF and SVM. The statistical significance of these results indicates the robustness of the method, making it a valuable tool for doctors to correctly diagnose and treat SHH-MB subtypes. Applying TL-SVDPMR has several benefits. First, utilizing SVD to reduce feature dimensions enhances computational efficiency and effectively handles high-dimensional data. Second, TL enhances the clarity of decision boundaries, making it a valuable technique for tackling class overlap and class imbalance in classification tasks. Furthermore, the method obtains the probabilities of a new sample belonging to each of the four SHH subtypes, adding a layer of interpretability to the classification process.
While our study provides significant advancements in the classification of SHH-MB subtypes, several limitations should be acknowledged. Because of the small sample size of some SHH-MB subtypes, performance metrics can differ significantly between folds. This variability could lead to inconsistent results and interpretations. Although we compared our approach to RF and SVM, many more machine-learning algorithms and approaches could be explored. A broader comparison could provide a more comprehensive understanding of the model’s performance compared to the state of the art. Finally, External datasets have not yet been used to test the model’s robustness. Confirming the model’s efficacy and robustness in clinical practice requires the validation of independent datasets.
Our study demonstrates the utility of TL-SVDPMR as a method for developing precision medicine approaches toward accurate categorization of the molecular subtypes within SHH-MB based on DNA methylation data. Effectively mitigating class overlap, class imbalance, and high feature dimensionality issues, this framework improves the discriminative nature of decision boundaries which in turn allows for more accurate classifying. The combination of SVD for dimensionality reduction, TL for undersampling the majority classes, group lasso for feature selection, and MR for the classification task has resulted in an effective classification framework for SHH-MB subtypes. Using the fivefold cross-validation technique, our proposed method produced an average overall accuracy of about 95%. Converting the data into a lower-dimensional space while keeping important features, SVD reduced computational complexity. This also leads to a better relevance of information in DNA methylation data. TL improves the intelligibility of decision boundaries by resulting in a more balanced dataset, which is essential to efficiently address class overlap and class imbalance in the classification problem. We automatically selected informative features, and then used them as regressors in our classification model, by applying a group lasso that forces sparsity at the group level (a subtype of SHH-MB). Coordinate descent is used to solve our loss function associated with the group lasso, which promotes sparsity.
Through using our proposed approach, the classification model showed excellent performance on different overlapped SHH-MB subtypes in terms of the various performance metrics.
Acknowledgement: The authors acknowledge the Deanship of Graduate Studies and Scientific Research at Jouf University.
Funding Statement: This work was funded by the Deanship of Graduate Studies and Scientific Research at Jouf University under grant No. (DGSSR-2024-02-01137).
Author Contributions: Isra Mohammed: Conceptualization, Methodology, Formal Analysis, Software, Writing—Original Draft. Mohamed Elhafiz M. Musa: Software. Murtada K. Elbashir: Conceptualization, Supervision, Writing—Reviewing and Editing. Ayman Mohamed Mostafa: Reviewing. Amin Ibrahim Adam: Supervision. Areeg S. Faggad: Supervision, Writing—Reviewing and Editing. Mahmood A. Mahmood: Validation. All authors reviewed the results and approved the final version of the manuscript.
Availability of Data and Materials: The experimental data and the simulation results that support the findings of this study are available at the following website: https://www.ncbi.nlm.nih.gov/geo/query/acc.cgi?acc=GSE85212 (acccessed on 28 April 2025).
Ethics Approval: Not applicable.
Conflicts of Interest: The authors declare no conflicts of interest to report regarding the present study.
References
1. Northcott PA, Robinson GW, Kratz CP, Mabbott DJ, Pomeroy SL, Clifford SC, et al. Medulloblastoma. Nat Rev Dis Primers. 2019;5:11. [Google Scholar] [PubMed]
2. Korshunov A, Okonechnikov K, Stichel D, Ryzhova M, Schrimpf D, Sahm F, et al. Integrated molecular analysis of adult sonic hedgehog (SHH)-activated medulloblastomas reveals two clinically relevant tumor subsets with VEGFA as potent prognostic indicator. Neuro-Oncol. 2021;23(9):1576–85. doi:10.1093/neuonc/noab031. [Google Scholar] [PubMed] [CrossRef]
3. Cavalli FMG, Remke M, Rampasek L, Peacock J, Shih DJH, Luu B, et al. Intertumoral heterogeneity within medulloblastoma subgroups. Cancer Cell. 2017;31:737–54. doi:10.1016/j.ccell.2017.05.005. [Google Scholar] [PubMed] [CrossRef]
4. Garcia-Lopez J, Kumar R, Smith KS, Northcott PA. Deconstructing sonic hedgehog medulloblastoma: molecular subtypes, drivers, and beyond. Trends Genet. 2021;37(3):235–50. doi:10.1016/j.tig.2020.11.001. [Google Scholar] [PubMed] [CrossRef]
5. Gold MP, Ong W, Masteller AM, Ghasemi DR, Galindo JA, Park NR, et al. Developmental basis of SHH medulloblastoma heterogeneity. Nat Commun. 2024;15(1):270. doi:10.1038/s41467-023-44300-0. [Google Scholar] [PubMed] [CrossRef]
6. Skowron P, Farooq H, Cavalli FMG, Morrissy AS, Ly M, Hendrikse LD, et al. The transcriptional landscape of Shh medulloblastoma. Nat Commun. 2021;12:1749. doi:10.1038/s41467-021-21883-0. [Google Scholar] [PubMed] [CrossRef]
7. Prati RC, Batista GEAPA, Monard MC. Class imbalances versus class overlapping: an analysis of a learning system behavior. In: Proceedings of the MICAI 2004: Advances in Artificial Intelligence; 2004 Apr 26–30; Mexico City, Mexico. [Google Scholar]
8. Santos MS, Abreu PH, Japkowicz N, Fernández A, Santos J. A unifying view of class overlap and imbalance: key concepts, multi-view panorama, and open avenues for research. Inf Fusion. 2023;89(2):228–53. doi:10.1016/j.inffus.2022.08.017. [Google Scholar] [CrossRef]
9. Mahmood Z, Safran M, Abdussamad, Alfarhood S, Ashraf I. Algorithmic and mathematical modeling for synthetically controlled overlapping. Sci Rep. 2025;15(1):7517. doi:10.1038/s41598-025-87992-8. [Google Scholar] [PubMed] [CrossRef]
10. Vuttipittayamongkol P, Elyan E. Neighbourhood-based undersampling approach for handling imbalanced and overlapped data. Inf Sci. 2020;509(2):47–70. doi:10.1016/j.ins.2019.08.062. [Google Scholar] [CrossRef]
11. Wang X, Zhang R, Zhang Z. A novel hybrid sampling method ESMOTE + SSLM for handling the problem of class imbalance with overlap in financial distress detection. Neural Process Lett. 2022;55(3):3081–105. doi:10.1007/s11063-022-10998-0. [Google Scholar] [CrossRef]
12. Zhang R, Zhang Z, Wang D. RFCL: a new under-sampling method of reducing the degree of imbalance and overlap. Pattern Anal Appl. 2021;24(2):641–54. doi:10.1007/s10044-020-00929-x. [Google Scholar] [CrossRef]
13. Kumar A, Singh D, Yadav RS. Entropy and improved k-nearest neighbor search based under-sampling (ENU) method to handle class overlap in imbalanced datasets. Concurr Comput Pract Exp. 2024;36(2):e7894. doi:10.1002/cpe.7894. [Google Scholar] [CrossRef]
14. Mohammed I, Elbashir MK, Faggad AS. Singular value decomposition-based penalized multinomial regression for classifying imbalanced medulloblastoma subgroups using methylation data. J Comput Biol. 2024;31(5):458–71. doi:10.1089/cmb.2023.0198. [Google Scholar] [PubMed] [CrossRef]
15. Guzmán-Ponce A, Valdovinos RM, Sánchez JS, Marcial-Romero JR. A new under-sampling method to face class overlap and imbalance. Appl Sci. 2020;10(15):5164. doi:10.3390/app10155164. [Google Scholar] [CrossRef]
16. Wall ME, Rechtsteiner A, Rocha LM. Singular value decomposition and principal component analysis. In: Berrar DP, Dubitzky W, Granzow M, editors. A practical approach to microarray data analysis. Berlin/Heidelberg, Germany: Springer; 2003. p. 91–109. doi:10.1007/0-306-47815-3_5. [Google Scholar] [CrossRef]
17. Batista GEAPA, Prati RC, Monard MC. A study of the behavior of several methods for balancing machine learning training data. ACM SIGKDD Explor Newsl. 2004;6(1):20–9. doi:10.1145/1007730.1007735. [Google Scholar] [CrossRef]
18. Elhassan AT, Aljourf M, Al-Mohanna F, Shoukri M. Classification of imbalance data using Tomek Link (T-Link) combined with random under-sampling (RUS) as a data reduction method. Glob J Technol Optim. 2016;1:1–11. doi:10.4172/2229-8711.S1111. [Google Scholar] [CrossRef]
19. Meier L, Van De Geer S, Bühlmann P. The group lasso for logistic regression. J R Stat Soc Ser B Stat Methodol. 2008;70(1):53–71. doi:10.1111/j.1467-9868.2007.00627.x. [Google Scholar] [CrossRef]
20. Vincent M, Perell K, Nielsen FC, Daugaard G, Hansen NR. Modeling tissue contamination to improve molecular identification of the primary tumor site of metastases. Bioinformatics. 2014;30(10):1417–23. doi:10.1093/bioinformatics/btu044. [Google Scholar] [PubMed] [CrossRef]
21. Vincent M, Hansen NR. Sparse group lasso and high dimensional multinomial classification. Comput Stat Data Anal. 2014;71(4):771–86. doi:10.1016/j.csda.2013.06.004. [Google Scholar] [CrossRef]
22. Tharwat A. Classification assessment methods. Appl Comput Inform. 2018;17:168–92. [Google Scholar]
23. Franco C, Little RJA, Louis TA, Slud EV. Comparative study of confidence intervals for proportions in complex sample surveys. J Surv Stat Methodol. 2019;7(3):334–64. doi:10.1093/jssam/smy019. [Google Scholar] [PubMed] [CrossRef]
24. Hastie T, Tibshirani R, Friedman J. The elements of statistical learning: data mining, inference, and prediction. 2nd ed. Berlin/Heidelberg, Germany: Springer; 2009. 745 p. doi: 10.1007/978-0-387-84858-7. [Google Scholar] [CrossRef]
25. Fawcett T. An introduction to ROC analysis. Pattern Recognit Lett. 2006;27:861–74. doi:10.1016/j.patrec.2005.10.010. [Google Scholar] [CrossRef]
26. Robin X, Turck N, Hainard A, Tiberti N, Lisacek F, Sanchez JC, et al. pROC: an open-source package for R and S+ to analyze and compare ROC curves. BMC Bioinform. 2011;12(1):1–8. doi:10.1186/1471-2105-12-77. [Google Scholar] [PubMed] [CrossRef]
27. Chawla NV, Bowyer KW, Hall LO, Kegelmeyer WP. SMOTE: synthetic minority over-sampling technique. J Artif Intell Res. 2011;16:321–57. doi:10.1613/jair.953. [Google Scholar] [CrossRef]
28. Capper D, Jones DTW, Sill M, Hovestadt V, Schrimpf D, Sturm D, et al. DNA methylation-based classification of central nervous system tumours. Nature. 2018;555(7697):469–74. doi:10.1038/nature26000. [Google Scholar] [PubMed] [CrossRef]
29. Jiang J, Li L, Yin G, Luo H, Li J. A molecular typing method for invasive breast cancer by serum raman spectroscopy. Clin Breast Cancer. 2024;24(4):376–83. doi:10.1016/j.clbc.2024.02.008. [Google Scholar] [PubMed] [CrossRef]
Cite This Article
 Copyright © 2025 The Author(s). Published by Tech Science Press.
This work is licensed under a Creative Commons Attribution 4.0 International License , which permits unrestricted use, distribution, and reproduction in any medium, provided the original work is properly cited.
 Downloads
 Citation Tools