
 Submit a Paper
 Propose a Special lssue
 Open Access
ARTICLE
Physics-Informed Gaussian Process Regression with Bayesian Optimization for Laser Welding Quality Control in Coaxial Laser Diodes
1 State Key Laboratory of Precision Manufacturing for Extreme Service Performance, Central South University, Changsha, 410000, China
2 College of Mechanical Engineering, Hunan University of Science and Technology, Xiangtan, 411201, China
* Corresponding Author: Lian Duan. Email:
(This article belongs to the Special Issue: Computing Technology in the Design and Manufacturing of Advanced Materials)
Computers, Materials & Continua 2025, 84(2), 2587-2604. https://doi.org/10.32604/cmc.2025.065648
Received 18 March 2025; Accepted 23 May 2025; Issue published 03 July 2025
 View Full Text
 Download PDF
Abstract
The packaging quality of coaxial laser diodes (CLDs) plays a pivotal role in determining their optical performance and long-term reliability. As the core packaging process, high-precision laser welding requires precise control of process parameters to suppress optical power loss. However, the complex nonlinear relationship between welding parameters and optical power loss renders traditional trial-and-error methods inefficient and imprecise. To address this challenge, a physics-informed (PI) and data-driven collaboration approach for welding parameter optimization is proposed. First, thermal-fluid-solid coupling finite element method (FEM) was employed to quantify the sensitivity of welding parameters to physical characteristics, including residual stress. This analysis facilitated the identification of critical factors contributing to optical power loss. Subsequently, a Gaussian process regression (GPR) model incorporating finite element simulation prior knowledge was constructed based on the selected features. By introducing physics-informed kernel (PIK) functions, stress distribution patterns were embedded into the prediction model, achieving high-precision optical power loss prediction. Finally, a Bayesian optimization (BO) algorithm with an adaptive sampling strategy was implemented for efficient parameter space exploration. Experimental results demonstrate that the proposed method effectively establishes explicit physical correlations between welding parameters and optical power loss. The optimized welding parameters reduced optical power loss by 34.1%, providing theoretical guidance and technical support for reliable CLD packaging.Keywords
Coaxial Laser Diodes (CLDs), known for their compact structure and high stability, have become indispensable components in high-speed optical communication and precision optical measurement systems [1]. The quality of CLD packaging profoundly governs their optical output consistency and long-term reliability. Effective CLD packaging demands meticulous optical alignment and mechanical stabilization at the micrometer scale, rendering high-precision laser welding a widely embraced technique in this field [2,3]. Compared to conventional adhesive bonding or mechanical clamping, laser welding affords distinct advantages, including a diminished heat-affected zone, superior forming precision, and non-contact processing, which collectively mitigate structural deformation induced by thermal stress during encapsulation [4]. Nevertheless, fiber misalignment and residual stress accumulation, stemming from parameter mismatches during welding, frequently precipitate excessive optical power loss, leading to device failure and reduced yield rates. This challenge is particularly pronounced in miniaturized, high-density CLD packaging [5].
To laser welding parameter optimization, existing research primarily focuses on constructing thermal-mechanical or thermal-fluid [6,7] coupling models through finite element method (FEM) [8–10], combined with intelligent algorithms for adaptive parameter search [11,12]. For instance, Chuang et al. [13] proposed a laser welding parameter optimization framework based on finite element simulation and dual neural networks. By jointly predicting molten pool size, cooling rate, heat-affected zone width, and angular deformation, they achieved angular deformation below 564 μm for SS316L butt joints, using a quadruple quality criterion for parameter screening. Escribano-García et al. [14] developed a rapid heat source model parameter optimization method combining response surface methodology (RSM) and FEM. They generated simulation data using three-dimensional transient thermal analysis and elastoplastic mechanical models, and determined the optimal heat source parameters through RSM, significantly reducing engineering time compared to traditional trial-and-error methods. Lu et al. [15] established a temperature field simulation model for friction stir ring welding of 2219 aluminum alloy large cylindrical tanks using ABAQUS, employing RSM, multi-objective particle swarm optimization (PSO) to minimize heat-affected zone length and thickness direction temperature difference, obtaining optimal process parameters. Tan et al. [16] used FEM to simulate residual stress and deformation in Q345 steel T-type double-sided welded joints. Applying NSGA-II and multi-objective PSO for optimization effectively reduced residual stress and deformation, offering valuable guidance for welding parameter selection. However, these methods face fundamental challenges in CLD packaging scenarios: the millimeter-scale packaging structure makes it difficult to directly measure temperature gradients, molten pool flow, and residual stress distribution in the welding zone. As a result, finite element models often lack reliable experimental validation. Consequently, the industry still largely relies on the “weld-test-adjust” trial-and-error approach, resulting in prolonged process development cycles and insufficient stability.
Recent years have seen attempts to apply machine learning techniques to welding quality prediction [17,18]. For example, Wang et al. [19] proposed a computer-aided computational framework based on Gaussian Process Regression (GPR) and Genetic Algorithm (GA), optimizing welding heat source model shape parameters. Costa et al. [20] developed a novel approach using Support Vector Regression (SVR) models and Sequential Quadratic Programming (SQP) algorithms, successfully minimizing surface porosity in ASTM A36 steel plates through prediction and optimization of underwater flux-cored arc welding (FCAW) process parameters. Zhang et al. [21] introduced a multi-objective jellyfish search algorithm based on Random Forest (RF) models and Bayesian optimization (BO), significantly improving welded joint performance by optimizing steel/aluminum welding process parameters. Wang et al. [22] optimized double-pulse MIG welding process parameters by constructing process-performance meta-models. They applied reliability-based multi-objective optimization methods to search for optimal solutions under performance requirements, guiding welding process design in automotive manufacturing. However, the performance of these methods is limited by feature selection challenges in high-dimensional parameter spaces, resulting in poor model interpretability and susceptibility to overfitting in small-sample scenarios.
To address these limitations, this study proposes a synergistic optimization framework integrating physics-informed (PI) and data-driven methodologies. A thermal-fluid-solid coupling finite element model is initially employed to quantify the influence of welding parameters on critical physical characteristics, such as residual stress. Parameters exhibiting significant correlation with optical power loss are thereby identified. Based on these parameters, a GPR model is constructed, incorporating stress distribution patterns revealed by finite element simulations through physics-informed kernel (PIK) functions. Finally, an adaptive BO algorithm is implemented to facilitate efficient global optimization of process parameters.
The core components of a CLD include the fiber module and the laser module, as illustrated in Fig. 1a. The fiber module primarily consists of a single-mode fiber, a fiber sleeve, and a collimating lens, while the laser module comprises a laser chip, a heat sink, and a packaging substrate. During optical power transmission, the beam emitted by the laser chip is collimated and focused through a micro-optical system (e.g., a collimating lens) and subsequently coupled into the single-mode fiber. This process requires perfect alignment between the fiber end face and the laser chip to ensure efficient optical power transmission and minimize signal loss. As shown in Fig. 1b,c, the CLD packaging process involves two critical steps: optical coupling optimization and laser welding fixation. The detailed procedure is as follows:

Figure 1: Schematic diagram of CLD structure and packaging process
Step 1: Optical Coupling Optimization. Before welding, the fiber position is adjusted in real time using a high-precision optical power meter combined with a six-degree-of-freedom motion platform. The motion platform adjusts the fiber position with micron-level precision, while the optical power meter continuously monitors the output power. This process continues until the maximum power point is found, ensuring optimal coupling between the fiber and the laser chip.
Step 2: Laser Welding Fixation. Three welding guns, symmetrically distributed at 120° around the fiber sleeve, are employed for spot welding to form a uniformly stressed welding structure. Predefined welding parameters ensure uniform temperature distribution in the welding zone and minimize thermal stress. After welding, the laser’s output power is measured again using the optical power meter, and the power variation before and after welding is calculated. If the power loss exceeds a predefined threshold, the device is deemed defective.
The above process demonstrates that the evaluation of packaging quality heavily relies on the macroscopic indicator of optical power loss, which fails to directly reflect the intrinsic physical mechanisms during welding, such as residual stress distribution and molten pool dynamics. This limitation has led to long-term reliance on empirical trial-and-error methods for process optimization, making it challenging to establish precise correlations between welding parameters and packaging quality. As a result, further improvements in CLD packaging efficiency and reliability are hindered.
2.2 Experimental Equipment and Configuration
The coaxial laser welding system employed in this study is illustrated in Fig. 2. It primarily consists of an Nd:YAG fiber-pulsed laser, a high-precision three-axis displacement platform, and a real-time optical power measurement module. The Nd:YAG fiber-pulsed laser operates at a wavelength of 1064 nm, with a maximum output power of 5 kW. It features high pulse peak power and adjustable pulse width, making it suitable for high-precision micro-welding applications. The laser beam is transmitted to the welding workstation via optical fiber, where it is split into three beams before being delivered through the welding torch. As shown in Fig. 2b, the welding torch is positioned at a specific incident angle relative to the workpiece surface to optimize energy distribution and minimize the heat-affected zone.

Figure 2: Experimental equipment. (a) physical equipment, (b) schematic diagram of the motion platform and welding torch arrangement
To ensure precise alignment between the fiber module and the laser module, a high-precision three-axis displacement platform (XYZ-axis accuracy of ±0.1 μm) was utilized. By adjusting the position of the fiber module along the X, Y, and Z axes, combined with the real-time optical power measurement module (including a high-sensitivity optical power meter and an automated scanning strategy), the output power was monitored in real-time to identify the maximum power point, ensuring optimal coupling between the two modules. Notably, a small gap was maintained between the fiber module and the laser module before welding to prevent mechanical stress accumulation caused by thermal expansion during the process. The key process parameters summarized in Table 1 represent the industrial-standard baseline settings for coaxial laser welding systems. These parameters have been experimentally validated and widely adopted in commercial CLD packaging processes.

The proposed method for predicting and optimizing the quality of CLD welding is illustrated in Fig. 3. Its core framework integrates three key modules: feature extraction driven by multi-physics FEM, physics-informed Gaussian process regression (PI-GPR) modeling, and adaptive BO for parameter tuning. First, the influence of welding process parameters on physical characteristics, such as residual stress, is quantified through coupled thermal-fluid-solid FEM. This step identifies sensitivity parameters significantly correlated with optical power loss, providing a physical basis for subsequent modeling. Second, a GPR model is constructed based on the selected physical features. By incorporating PIK, the stress distribution patterns are embedded into the prediction process, enabling accurate mapping of optical power loss. Finally, an objective function is derived from the GPR model, and an adaptive BO algorithm is utilized to conduct global optimization within the parameter space. By dynamically balancing exploration and exploitation, this strategy enhances the convergence rate of optimal process parameters.

Figure 3: Overview of the proposed system
3.2 FEM-Assisted Feature Selection
In the optimization of laser welding packaging processes, experimental measurements can only provide macroscopic performance indicators, such as optical power loss. However, they fail to reveal the underlying physical mechanisms, including residual stress distribution, microscopic weld morphology, and the evolution of material microstructures. Therefore, this study introduces a thermal-fluid-solid multi-physics coupled FEM to systematically investigate the welding process. A multi-physics evolution model of the welding process is constructed to identify key process parameters that significantly affect optical power loss. These parameters serve as critical input features for building the subsequent GPR model.
In the thermal-fluid-solid simulation, the multi-physics computational model of the welding process is established using the continuity equation, energy conservation equation, and momentum conservation equation:
where
In mechanical analysis, the material’s yield condition follows the von Mises yield criterion. The total strain increment can be expressed as the sum of three components:
where
In the laser welding process, the distribution of the heat source is critical for calculating the temperature and stress fields. This study employs a Gaussian volumetric heat source model [23,24] to describe the distribution of laser energy in the welding zone. The Gaussian volumetric heat source model assumes that the laser energy follows a Gaussian distribution in space, and its heat source model can be expressed as:
where
Accurately defining boundary conditions is crucial for simulating welding behavior correctly. The force boundary conditions for fluid flow within the molten pool include surface tension
where
where
where
For the surface of the welded components, heat transfer through radiation
where
where
Based on the FEM calculation results, the relationship between welding parameters
where
It is noteworthy that multiple physical mechanisms, such as molten pool morphology, temperature gradient, and residual stress, may influence optical power loss during the welding process. The selection of residual stress as the key physical feature is rooted in its decisive influence on optical coupling stability. Usually, the maximum principal stress concentration occurs precisely at the fiber-laser module interface. This stress distribution characteristic induces two critical effects: (1) Fiber displacement caused by stress-induced deformation, which directly affects the mode field matching degree. (2) Stress-optic effect altering the refractive index distribution of optical components. These coupled physical mechanisms establish an intrinsic connection between residual stress and optical power loss [5].
Subsequently, local sensitivity analysis is employed to evaluate the influence of each parameter on residual stress:
where
In the modeling of laser welding packaging processes, the relationship between optical power loss and residual stress exhibits high nonlinearity and complexity. Traditional data-driven modeling methods, such as neural networks and support vector machines, can fit nonlinear relationships but are prone to overfitting under small sample conditions. In contrast, the non-parametric Bayesian framework of GPR provides substantial benefits [25,26].
However, traditional GPR relies solely on experimental data and struggles to fully capture the intrinsic influence of physical mechanisms on system responses. To address this, this study proposes a PI-GRP. By integrating PI extracted from FEM with experimental data, the model’s prediction accuracy and generalization capability are significantly improved.
The target function
where
To incorporate physical information into the GPR model, this study constructs a PIK function based on key process parameters extracted from FEM. Let
where
The base kernel function for the data-driven part is chosen as the anisotropic Radial Basis Function (RBF) kernel:
where
The PIK function is defined by introducing internal physical features closely related to optical power loss, such as residual stress. The PIK construction involves processing steps are as follows:
Spatial Dimensionality Reduction: For each sample’s stress field
where
Standardization: Perform z-score normalization on
where
The PIK function is then formulated as:
where
For
where
For a new point
The mean
where
3.4 Bayesian Process Parameter Optimization Based on Adaptive Acquisition Strategy
Building on the PI-GPR model, this study employs BO to efficiently search for optimal welding process parameters, aiming to minimize optical power loss. BO accelerates the optimization process by constructing a surrogate model and designing an acquisition function, intelligently selecting the next experimental point under limited experimental trials [27,28]. The optimization objective is defined as:
where
The core of BO lies in the acquisition function, which determines the selection of the next experimental point. To efficiently search for the optimal solution under limited experimental trials, this study introduces Expected Improvement (EI) and Upper Confidence Bound (UCB) and designs an adaptive acquisition strategy to dynamically balance exploration and exploitation.
The EI acquisition function aims to maximize the expected improvement value, i.e., identifying experimental points that significantly reduce optical power loss. Its expression is:
where
The EI can be derived through Gaussian integral:
where
The UCB acquisition function selects experimental points with the highest potential improvement by calculating the upper confidence bound of the objective function:
where
To dynamically balance exploration and exploitation during the optimization process, an adaptive acquisition strategy is designed:
where
where
To improve simulation efficiency, this study focuses on simulating the welding process of a single weld point. This approach is based on the following considerations: First, the research aims to reveal the influence of welding process parameters on residual stress, and the simulation of a single weld point can effectively characterize the distribution trend of residual stress. Second, single-point simulation significantly reduces computational resource consumption, providing an efficient foundation for subsequent multi-parameter combination analysis.
As shown in Fig. 4, the molten pool morphology obtained from the thermal-fluid-solid coupled model is compared with experimental results. The results demonstrate a high degree of consistency in molten pool size, shape, and distribution characteristics, indicating that the constructed finite element model accurately simulates the thermal effects and structural behavior in the device packaging process.

Figure 4: Comparison between simulation and experiment
To further validate the accuracy of the finite element model, we conduct an in-depth analysis of the molten pool morphology evolution. As shown in Fig. 5, the dynamic changes in the molten pool’s surface and depth profiles clearly illustrate the physical mechanisms of the welding process. In the initial stage of heat source loading, thermal energy primarily concentrates on the material surface, and the molten pool, dominated by heat conduction, forms a narrow and shallow fusion zone. As the heat source continues to act, thermal energy gradually diffuses deeper, leading to a significant increase in both the width and depth of the molten pool. The weld gap is eventually fully filled with liquid metal, forming a continuous and uniform welded joint. The simulation results exhibit excellent agreement with the experimentally observed molten pool evolution, further confirming the reliability of the numerical model.
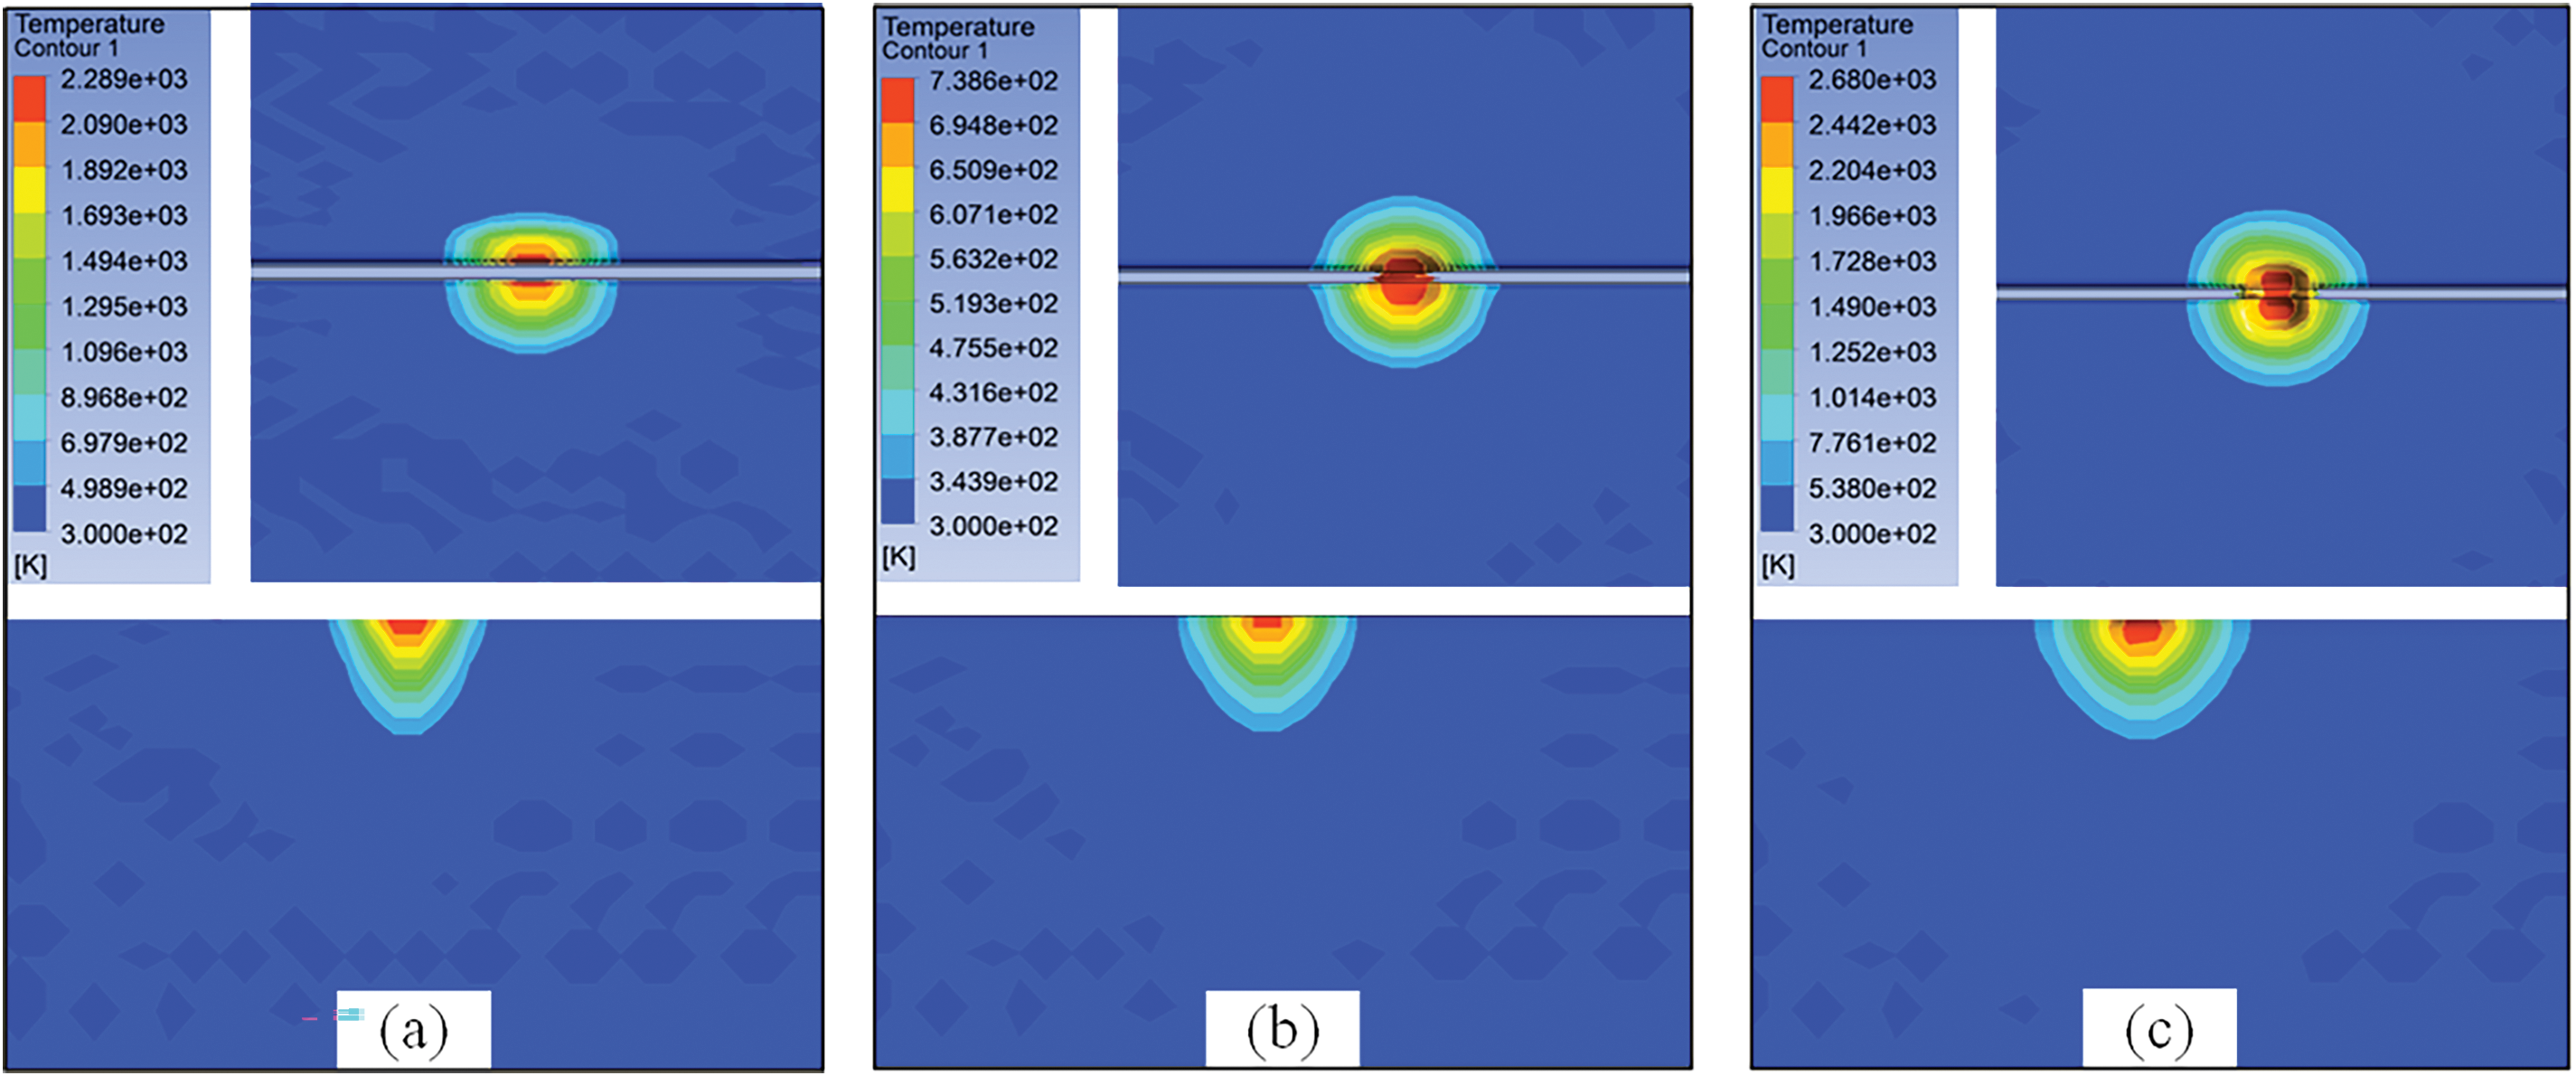
Figure 5: Evolution of molten pool morphology. (a) 1 ms, (b) 5 ms, (c) 10 ms
To analyze the influence of welding process parameters on post-weld residual stress, this study selects laser power, defocus distance, laser loading time, laser incident angle, and pre-weld module gap as key variables. The residual stress and its local sensitivity are calculated using the thermal-fluid-solid coupled model, as shown in Fig. 6.

Figure 6: Influence of process parameters on residual stress and local sensitivity analysis. (a) laser power, (b) loading time, (c) incident angle, (d) defocus distance, (e) module gap, and (f) local sensitivity
From the figure, it is evident that laser power, incident angle, and defocus distance have a significant impact on welding residual stress. Among them, laser power has the most pronounced effect, causing substantial fluctuations in the stress distribution. Specifically, when laser power varies within the range of 0.25–1.75 kW (single welding gun), the residual stress can change by up to 1000 MPa. The normalized local sensitivity analysis provides further validation, revealing that laser power, incident angle, and defocus distance exhibit significantly higher sensitivity indices compared to other parameters. In contrast, laser loading time and pre-weld module gap have a minor influence on residual stress, with local sensitivities below 0.1 and corresponding stress changes being negligible. This indicates that laser loading time and module gap have a limited impact on welding residual stress. Therefore, in the subsequent GPR model, laser power, incident angle, and defocus distance are selected as input features.
Based on the features selected through finite element analysis, 100 sets of welding experiments were conducted by adjusting different combinations of welding parameters, and the corresponding optical power loss was recorded to train the PI-GPR model. To evaluate the model’s accuracy in predicting welding quality, a 5-fold cross-validation method was employed. Specifically, the experimental dataset was evenly divided into 5 subsets. In each iteration, 4 subsets were used as the training set, and the remaining subset was used as the test set. This process was repeated 5 times, and the prediction error for each iteration was calculated. The evaluation metrics used were Mean Squared Error (MSE) and Coefficient of Determination (R2). MSE reflects the average squared deviation between predicted and actual values, with lower values indicating smaller model errors. R2 measures the model’s ability to explain data variance, ranging from 0 to 1, with values closer to 1 indicating better model fit.
Table 2 presents the error results of the 5-fold cross-validation. It can be observed that the PI-GPR model maintains an MSE between 0.0258 and 0.1596 across different folds, with an average MSE of 0.1274, demonstrating high stability across different datasets. Additionally, the model’s average R2 is as high as 0.9336, indicating its strong ability to explain the variation trend of optical power loss and its robust regression capability.

To validate the model’s generalization ability on unseen data, 10 additional experiments were randomly conducted, and both absolute and relative errors were calculated, as shown in Fig. 7. The results indicate that the absolute errors of the predictions are all controlled within 0.06 dB, with 70% of the prediction points having absolute errors below 0.03 dB, demonstrating the model’s high accuracy in predicting optical power loss values. Furthermore, the relative errors remain below 10.5%, further proving the model’s stability.
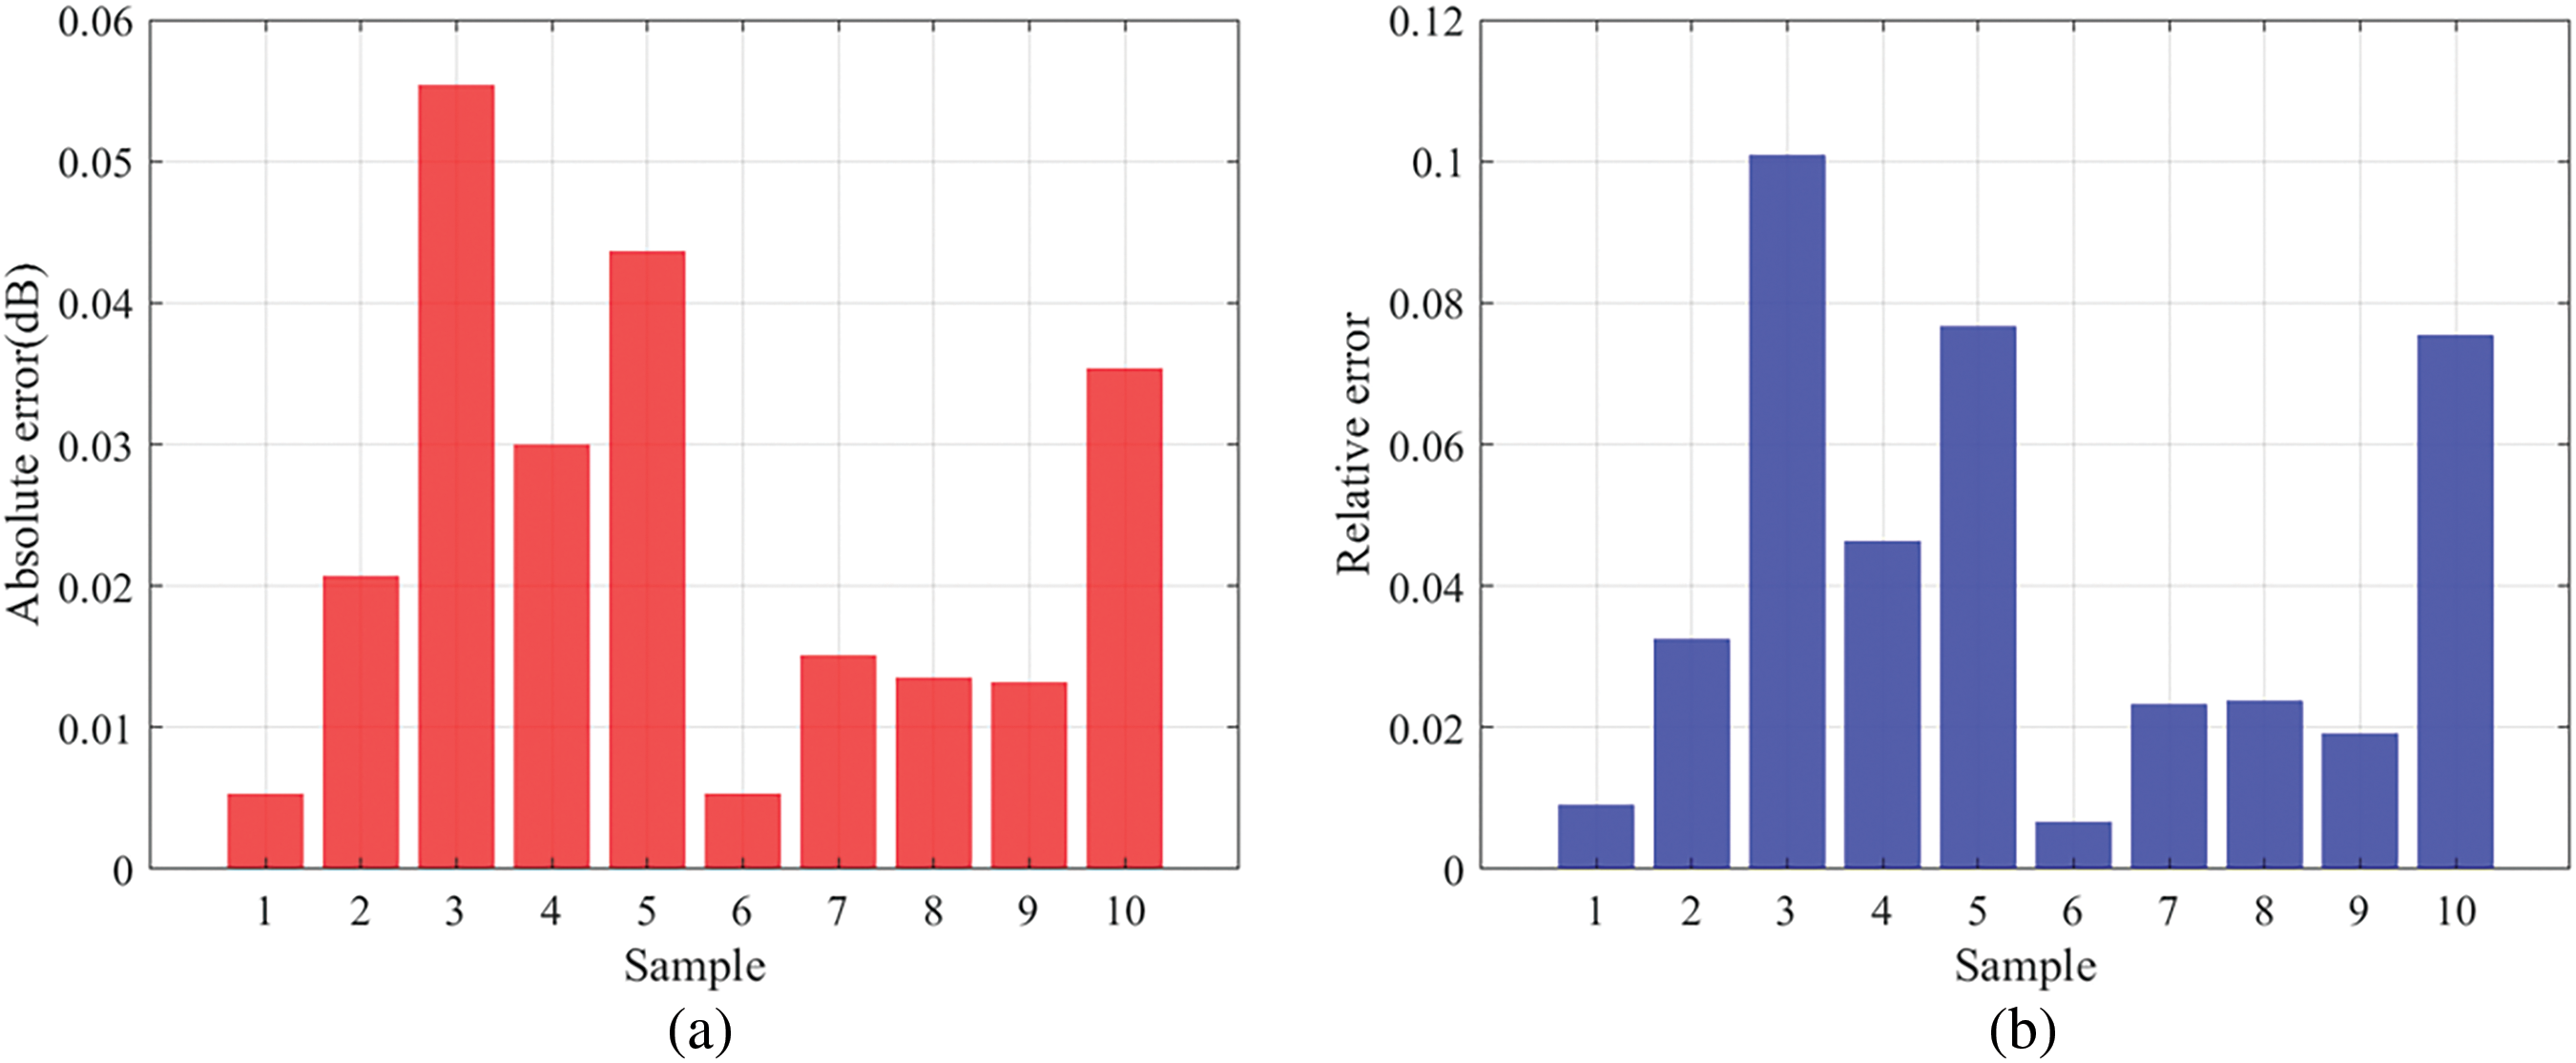
Figure 7: Prediction error of PI-GPR. (a) absolute error, (b) relative error
To quantify the contribution of the PIK, a comparison was made with a GPR model using only the RBF kernel. MSE and R2 were evaluated using 5-fold cross-validation, as shown in Fig. 8. The results reveal that the GPR model using only the RBF kernel exhibits poorer performance across different folds, with a higher average MSE of 0.1732. Additionally, its R2 results are also suboptimal, with an average R2 of only 0.9104, indicating weaker fitting capability. Compared to the proposed method, the traditional RBF kernel’s average MSE more than doubled, and the R2 value decreased by 2.48%, demonstrating that the prediction capability of the traditional RBF kernel is far inferior to the proposed PIK. This is further supported by the prediction error results on the new experimental data, as shown in Fig. 9. Among the 10 datasets, the maximum absolute error of the traditional RBF kernel GPR reaches 0.0704 dB, and the relative error is as high as 13%, significantly higher than the prediction results of the PIK-GPR. This highlights that our model not only achieves high prediction accuracy but also exhibits strong generalization capability.

Figure 8: Cross-validation results of RBF-GPR. (a) MSE, (b) R2

Figure 9: Prediction error of RBF-GPR. (a) absolute error, (b) relative error
To systematically evaluate the robustness of the PI-GPR method under data-constrained conditions, we conducted a controlled variable experiment to analyze model performance across the 50–100 sample size range. As shown in Table 3, PI-GPR demonstrates remarkable performance advantages with increasing sample size: its mean absolute error decreases significantly from 0.068 dB at 50 samples to 0.025 dB at 100 samples, representing a 63.2% reduction and demonstrating excellent convergence characteristics. Notably, PI-GPR always maintains a narrower confidence interval, and PI-GPR achieves an 80% confidence interval coverage rate with only 70 samples, matching the performance level of conventional RBF-GPR at 100 samples. These findings conclusively demonstrate that the effective integration of PI not only enhances prediction accuracy but also significantly improves model reliability under limited data conditions, providing an effective solution for engineering optimization problems in small-sample scenarios.

To validate the effectiveness of the parameter optimization strategy, the BO method with an adaptive acquisition strategy was employed to optimize welding process parameters. Specifically, optical power loss was used as the optimization objective, and the search was conducted within the three-dimensional parameter space of laser power, defocus distance, and laser incident angle. The performance of different acquisition functions was compared, and the convergence curves of the optimization process are shown in Fig. 10a.

Figure 10: Convergence performance comparison of different optimization methods. (a) different acquisition functions, (b) comparison with PSO and RSM
From the figure, it can be observed that the EI method converges quickly within the first 40 iterations, indicating high search efficiency. However, its final convergence accuracy is lower than that of the UCB and the proposed method, suggesting that EI may overly focus on local optima in the early stages and fail to fully explore the parameter space. The UCB method maintains a relatively good balance between exploration and exploitation during the search, achieving better final optimization accuracy than EI but with slower convergence speed. In contrast, the proposed optimization strategy achieves the best balance between convergence speed and final accuracy, stabilizing and converging to the global optimal process parameters after the 60th iteration. Its accuracy is significantly better than that of EI and UCB, demonstrating that this method can find better parameter combinations at a reasonable computational cost.
Fig. 10b compares the convergence performance of the proposed method with two widely used optimization approaches in process parameter optimization: PSO and RSM. The experimental results demonstrate that RSM exhibits slow convergence, stabilizing only after around 80 iterations, and its final optimized power loss is significantly higher than that of the BO framework. This limitation primarily stems from RSM’s difficulty in accurately modeling complex nonlinear relationships in the three-dimensional parameter space. Additionally, it is susceptible to experimental noise, which further reduces convergence accuracy. PSO demonstrates strong global search capability in the early optimization stages, rapidly approaching the optimal solution region. However, due to the gradual decline in population diversity with increasing iterations, the algorithm tends to stagnate in local optima after 40 iterations, resulting in limited final convergence precision.
To further quantify the optimization effect, we conducted 10 repeated experiments for both initial and optimized welding process parameters, recording the optical power loss (results distribution shown in Fig. 11). As presented in Table 4, the optimized parameters reduced the average optical power loss from 0.615 dB to 0.405 dB, representing a 34.1% relative improvement that significantly enhances CLD packaging quality. Statistical calculation of the improvement rate revealed a 95% confidence interval of [31.2%, 37.0%], confirming the statistical significance of the optimization effect. Furthermore, the standard deviation of the optimized decreased by 27.3% (from 0.022 dB to 0.016 dB), demonstrating that the proposed optimization strategy not only effectively improves welding parameters but also enhances process stability.

Figure 11: Experimental result. (a) initial parameter, (b) optimized parameter

4.4 Computational Efficiency Analysis
The proposed method’s computational cost involves two key phases: initial physics-based FEM analysis for interpretable feature selection, and data-driven Bayesian optimization. Crucially, the FEM simulations are one-time upfront studies to establish fundamental physical correlations, while subsequent parameter tuning for individual production systems uses purely experimental Bayesian optimization (100 trials/machine). This offline calibration strategy decouples computational analysis from manufacturing workflows, enabling direct application of optimized parameters in mass production without real-time computations. Device-specific variations are addressed through systematic experimental calibration rather than repeated simulations, ensuring practical feasibility.
This study proposes a laser welding parameter optimization framework based on GPR and BO. By integrating feature extraction driven by thermal-fluid-solid coupled FEM, PI constrained GPR modeling, and an adaptive parameter search strategy, the framework successfully achieves accurate prediction and efficient optimization of optical power loss in CLD packaging. Experimental results demonstrate that the optimized welding parameters reduce the average optical power loss by 34.1%, significantly improving the packaging yield and long-term reliability of the devices. However, the current work primarily focuses on optimizing welding process parameters under the assumption of uniform stress distribution in single-spot welds, while the dynamic thermo-mechanical coupling effects between multiple weld spots and the impact of material batch variations on model generalizability remain unaddressed. Future research will explore synergistic optimization methodologies integrating material properties with process parameters and develop multi-spot coupling models to enhance applicability in complex packaging scenarios.
Acknowledgement: The authors would like to express their sincere gratitude to all those who contributed to this research. Their support and efforts were key factors in the success of this study. Additionally, special thanks to the editors and reviewers for their critical and constructive comments and suggestions.
Funding Statement: This research was funded by the National Key R&D Program of China, Grant No. 2024YFF0504904.
Author Contributions: Conceptualization, Ziyang Wang and Lian Duan; methodology, Ziyang Wang and Lian Duan; software, Ziyang Wang and Lei Kuang; validation, Ziyang Wang, Lian Duan and Haibo Zhou; formal analysis, Ziyang Wang; investigation, Lian Duan; resources, Ji’an Duan; data curation, Lian Duan; writing—original draft preparation, Ziyang Wang; writing—review and editing, Lian Duan; visualization, Lei Kuang; supervision, Haibo Zhou; project administration, Ji’an Duan; funding acquisition, Haibo Zhou. All authors reviewed the results and approved the final version of the manuscript.
Availability of Data and Materials: The data that support the findings of this study are available from the corresponding author, Lian Duan, upon reasonable request.
Ethics Approval: Not applicable.
Conflicts of Interest: The authors declare no conflicts of interest to report regarding the present study.
References
1. Zhao Y, Li Y, Ma L, Wang J, Hao L, Wang L, et al. Microstructure evolution and crack prevention in TiC nanoparticles-enhanced 2195 AlLi alloy joint fabricated by coaxial fiber-diode hybrid laser wire-feeding welding. J Manuf Process. 2024;124(56):566–80. doi:10.1016/j.jmapro.2024.06.026. [Google Scholar] [CrossRef]
2. Hsu Y-C, Lin S-H, Tsai H-H, Hong S-P. Experiment and simulation on reduction of postweld shift on butterfly-type laser module by Nd: yAG laser welding and separated dual clips. Fiber Integr Opt. 2014;33(4):315–24. doi:10.1080/01468030.2014.924042. [Google Scholar] [CrossRef]
3. Nawi IN, Saktioto, Fadhali M, Hussain MS, Ali J, Yupapin PP. Nd: YAG laser welding of stainless steel 304 for photonics device packaging. Procedia Eng. 2011;8:374–9. doi:10.1016/j.proeng.2011.03.069. [Google Scholar] [CrossRef]
4. Song JH, Roycroft B, Corbett B, Peters FH. Experimental investigation of laser welding assembling sequences for butterfly laser module packages. Opt Eng. 2010;49(1):014301. doi:10.1117/1.3286539. [Google Scholar] [CrossRef]
5. Wang Z, Zhou H, Zhou W, Li Z, Ju X, Peng Y, et al. Experimental and numerical investigation of residual stress and post-weld-shift of coaxial laser diodes during the optoelectronic packaging process. Weld World. 2023;67(1):63–76. doi:10.1007/s40194-022-01404-3. [Google Scholar] [CrossRef]
6. Yan T, Zhan X, Gao Q, Wang F, Ling W. Influence of laser power on molten pool flow field of laser-MIG hybrid welded Invar alloy. Opt Laser Technol. 2021;133:106539. doi:10.1016/j.optlastec.2020.106539. [Google Scholar] [CrossRef]
7. Liu R, Sun Y, Ni J. Geometric deformation prediction of a centrifugal impeller considering welding distortion and fluid-structure interaction. J Manuf Process. 2023;96:80–98. doi:10.1016/j.jmapro.2023.04.023. [Google Scholar] [CrossRef]
8. Derakhshan ED, Yazdian N, Craft B, Smith S, Kovacevic R. Numerical simulation and experimental validation of residual stress and welding distortion induced by laser-based welding processes of thin structural steel plates in butt joint configuration. Opt Laser Technol. 2018;104(2):170–82. doi:10.1016/j.optlastec.2018.02.026. [Google Scholar] [CrossRef]
9. Xu G, Pan H, Liu P, Li P, Hu Q, Du B. Finite element analysis of residual stress in hybrid laser-arc welding for butt joint of 12 mm-thick steel plate. Weld World. 2018;62(2):289–300. doi:10.1007/s40194-017-0545-7. [Google Scholar] [CrossRef]
10. Sun GF, Wang ZD, Lu Y, Zhou R, Ni ZH, Gu X, et al. Numerical and experimental investigation of thermal field and residual stress in laser-MIG hybrid welded NV E690 steel plates. J Manuf Process. 2018;34:106–20. doi:10.1016/j.jmapro.2018.05.023. [Google Scholar] [CrossRef]
11. Li M, Wen L, Wang S, Liang J, Hou X. Multifactor optimization for induction welding of carbon fiber reinforced thermoplastic composites based on response surface methodology. Polym Compos. 2024;45(5):4307–18. doi:10.1002/pc.28060. [Google Scholar] [CrossRef]
12. Jiao H, Jin H. An automated optimization procedure for geometry parameters calibration of two-curvature conical heat source model. Int J Therm Sci. 2024;197(2):108788. doi:10.1016/j.ijthermalsci.2023.108788. [Google Scholar] [CrossRef]
13. Chuang T-C, Lo Y-L, Tran H-C, Tsai Y-A, Chen C-Y, Chiu C-P. Optimization of Butt-joint laser welding parameters for elimination of angular distortion using High-fidelity simulations and Machine learning. Opt Laser Technol. 2023;167:109566. doi:10.1016/j.optlastec.2023.109566. [Google Scholar] [CrossRef]
14. Escribano-García R, Rodriguez N, Zubiri O, Piccini J, Setien I. 3D numerical simulation of GMAW cold metal transfer using response surface methodology. J Manuf Process. 2022;76:656–65. doi:10.1016/j.jmapro.2022.02.043. [Google Scholar] [CrossRef]
15. Lu X, Li X, Teng L, Luan Y, Zhang H, Zhang Y, et al. Simulation of temperature field and optimization of welding parameters in friction stir welding thick large circular storage tank. Int J Adv Manuf Technol. 2024;132(5–6):2807–21. doi:10.1007/s00170-024-13509-8. [Google Scholar] [CrossRef]
16. Tan Y, Zhu G, Tian F, Zhao Z, Chai B. Multi-objective optimization of T-shaped bilateral laser welding parameters based on NSGA-II and MOPSO. J Mater Sci. 2024;59(21):9547–73. doi:10.1007/s10853-024-09727-w. [Google Scholar] [CrossRef]
17. Liang H, Qi L, Liu X. Modeling and optimization of robot welding process parameters based on improved SVM-PSO. Int J Adv Manuf Technol. 2024;133(5–6):2595–605. doi:10.1007/s00170-024-13800-8. [Google Scholar] [CrossRef]
18. Li C, Li S, Xie Y, Wu J, Zhang C. Optimization of laser welding process parameters considering carbon emissions and weld quality based on DBO-BP and NSGA-II. Int J Precis Eng Manuf-Green Technol. 2025;2025:1–16. doi:10.1007/s40684-025-00707-2. [Google Scholar] [CrossRef]
19. Wang L, Qian X. Optimization-improved thermal-mechanical simulation of welding residual stresses in welded connections. Comput-Aided Civ Infrastruct Eng. 2024;39(9):1275–93. doi:10.1111/mice.13136. [Google Scholar] [CrossRef]
20. Costa PS, Altamirano-Guerrero G, Ochoa-Palacios RM, Reséndiz-Flores EO, Guía-Hernández LA, Ramírez-Luna LE. Optimization of welding parameters in underwater wet FCAW on a structural steel using support vector regression and sequential quadratic programming. Int J Adv Manuf Technol. 2022;121(5–6):4225–36. doi:10.1007/s00170-022-09584-4. [Google Scholar] [CrossRef]
21. Zhang X, Guo Y, Fan X, Zhao J, Yan B, Zhang L. Multi-objective optimization of laser welding process parameters of steel/Al based on BO-RF and MOJS. J Mech Sci Technol. 2024;38(2):861–71. doi:10.1007/s12206-024-0133-x. [Google Scholar] [CrossRef]
22. Wang J, Chen X, Yang L. Reliability-based multi-objective optimization incorporating process-property–performance relationship of double-pulse MIG welding using hybrid optimization strategy. Struct Multidiscip Optim. 2022;65(5):148. doi:10.1007/s00158-021-03103-x. [Google Scholar] [CrossRef]
23. Yadaiah N, Bag S. Development of egg-configuration heat source model in numerical simulation of autogenous fusion welding process. Int J Therm Sci. 2014;86(11):125–38. doi:10.1016/j.ijthermalsci.2014.06.032. [Google Scholar] [CrossRef]
24. Yang Y, Rao Z, Zhou T, Zhou P. Ray tracing heat source model for polymer powder bed fusion considering laser energy absorption and multiple reflection. Addit Manuf. 2024;91(4):104363. doi:10.1016/j.addma.2024.104363. [Google Scholar] [CrossRef]
25. Lu HM, Chen JS, Liao WC. Nonparametric regression via variance-adjusted gradient boosting Gaussian process regression. IEEE Trans Autom Control. 2021;33(6):2669–79. doi:10.1109/tkde.2019.2953728. [Google Scholar] [CrossRef]
26. Huber MF. Recursive Gaussian process: on-line regression and learning. Pattern Recognit Lett. 2014;45:85–91. doi:10.1016/j.patrec.2014.03.004. [Google Scholar] [CrossRef]
27. Lyu W, Xue P, Yang F, Yan C, Hong Z, Zeng X, et al. An efficient Bayesian optimization approach for automated optimization of analog circuits. IEEE Trans Circuits Syst I Regul Pap. 2017;65(6):1954–67. doi:10.1109/tcsi.2017.2768826. [Google Scholar] [CrossRef]
28. Wang X, Jin Y, Schmitt S, Olhofer M. Recent advances in Bayesian optimization. ACM Comput Surv. 2023;55(13s):1–36. doi:10.1145/3582078. [Google Scholar] [CrossRef]
Cite This Article
 Copyright © 2025 The Author(s). Published by Tech Science Press.
This work is licensed under a Creative Commons Attribution 4.0 International License , which permits unrestricted use, distribution, and reproduction in any medium, provided the original work is properly cited.
 Downloads
 Citation Tools