
 Submit a Paper
 Propose a Special lssue
 Open Access
ARTICLE

A Novel Attention-Augmented LSTM (AA-LSTM) Model for Optimized Energy Management in EV Charging Stations
1 School of Computer and Systems Sciences, Jawaharlal Nehru University, New Delhi, 110067, India
2 Department of Computer Science, Indraprastha College for Women, University of Delhi, Delhi, 110067, India
3 School of Computer Science and Engineering, IILM University, Greater Noida, 201306, India
4 Department of Computer Science, Faculty of Information Technology, Zarqa University, Zarqa, 13110, Jordan
5 Department of Computer Science, Nottingham Trent University, Nottingham, NG11 8NS, UK
* Corresponding Author: Omprakash Kaiwartya. Email:
Computers, Materials & Continua 2025, 84(3), 5577-5595. https://doi.org/10.32604/cmc.2025.065741
Received 20 March 2025; Accepted 16 June 2025; Issue published 30 July 2025
 View Full Text
 Download PDF
Abstract
Electric Vehicles (EVs) have emerged as a cleaner, low-carbon, and environmentally friendly alternative to traditional internal combustion engine (ICE) vehicles. With the increasing adoption of EVs, they are expected to eventually replace ICE vehicles entirely. However, the rapid growth of EVs has significantly increased energy demand, posing challenges for power grids and infrastructure. This surge in energy demand has driven advancements in developing efficient charging infrastructure and energy management solutions to mitigate the risks of power outages and disruptions caused by the rising number of EVs on the road. To address these challenges, various deep learning (DL) models, such as Recurrent Neural Networks (RNNs) and Long Short-Term Memory (LSTM) networks, have been employed for predicting energy demand at EV charging stations (EVCS). However, these models face certain limitations. They often lack interpretability, treating all input steps equally without assigning greater importance to critical patterns that are more relevant for prediction. Additionally, these models process data sequentially, which makes them computationally slower and less efficient when dealing with large datasets. In the context of these limitations, this paper introduces a novel Attention-Augmented Long Short-Term Memory (AA-LSTM) model. The proposed model integrates an attention mechanism to focus on the most relevant time steps, thereby enhancing its ability to capture long-term dependencies and improve prediction accuracy. By combining the strengths of LSTM networks in handling sequential data with the interpretability and efficiency of the attention mechanism, the AA-LSTM model delivers superior performance. The attention mechanism selectively prioritizes critical parts of the input sequence, reducing the computational burden and making the model faster and more effective. The AA-LSTM model achieves impressive results, demonstrating a Mean Absolute Percentage Error (MAPE) of 3.90% and a Mean Squared Error (MSE) of 0.40, highlighting its accuracy and reliability. These results suggest that the AA-LSTM model is a highly promising solution for predicting energy demand at EVCS, offering improved performance and efficiency compared to contemporary approaches.Keywords
Transport is crucial in any country’s economic development and daily activities. However, it also significantly contributes to energy consumption, relying heavily on non-renewable energy sources. This extensive use of non-renewable energy adversely impacts the environment and substantially contributes to global carbon dioxide emissions. Since 2016, transportation has accounted for over 25% of global CO2 emissions [1]. Electric Vehicles (EVs) have emerged as a cleaner, low-carbon, and environmentally friendly alternative to traditional transportation. These vehicles are expected to replace internal combustion engine (ICE) cars soon. According to the Sustainable Development Scenario (SDS) for 2020–2030, the share of EVs is projected to grow exponentially, reaching 13.4% by 2030 [2]. To address environmental pollution, energy crisis, and climate change, there has been increasing societal focus on developing distributed energy resources (DERs), including electric vehicles (EVs), photovoltaics (PVs), and other renewable technologies [3,4]. With the rise of DERs on the demand side, more power users are transitioning from traditional consumers to prosumers, who consume power and generate it [3].
According to projections by the United Nations, nearly two-thirds of the global population is expected to live in urban areas by 2050 [3]. This rapid urbanization will substantially increase demand for efficient urban transportation, increasing energy consumption and contributing to higher greenhouse gas emissions. Initially, EVs faced challenges such as limited battery range and concerns over reliability, but technological advancements in recent years have addressed these issues, leading to a surge in their popularity [5]. As a result, consumer confidence in EVs has grown significantly, with owners expressing higher satisfaction levels [6]. Additionally, expanding charging infrastructure worldwide, often supported by government initiatives promoting EV adoption, has made these vehicles more practical and accessible. These combined factors have positioned EVs as a key solution for sustainable and environmentally friendly transportation in the coming decades.
Despite the promising potential of electric vehicles (EVs), several challenges persist, particularly regarding charging times and the reliance on public charging infrastructure. Although EV charging times have improved significantly over the years, they remain considerably longer than the refueling times of ICE vehicles. Emerging technologies such as extreme fast charging [7] and wireless charging [8] offer hope for the future, but they face various technical hurdles and are likely years away from widespread adoption. The limitations of the current charging infrastructure mean that most EV owners depend on public charging stations, which places a significant strain on power distribution grids due to the high energy demands of EVs [9]. To prevent grid degradation and potential failures, it is crucial to avoid uncoordinated charging practices. A practical solution lies in optimizing the scheduling of charging stations. Research in this area has explored data-driven approaches, including optimization techniques [10] and metaheuristic methods [11]. Additionally, studies have examined psychological factors influencing charging behaviour [12], transactional data, and interviews with EV drivers [13], to better understand and predict charging patterns.
A comprehensive review of charging behaviour analysis using machine learning and data-driven approaches is presented in [14]; this study highlights that machine learning-based methods are particularly well-suited for scheduling. These approaches offer the advantage of providing quantifiable insights and more realistic representations of charging behaviour, making them a valuable tool for improving the efficiency and reliability of EV charging systems.
Although EVs offer numerous benefits over ICE vehicles, their widespread adoption poses challenges for the power grid. The unpredictable and fluctuating nature of EV charging demand can lead to higher peak loads, voltage and frequency instability, and increased overall energy consumption. Given these challenges, accurately predicting EV charging loads is crucial for assessing their impact on the grid and ensuring the efficient operation of a power system with high EV penetration. Additionally, estimating charging demand helps anticipate the strain on grid infrastructure, enabling better forecasting of potential constraints. Effective EV demand forecasting supports grid stability and resilience while facilitating long-term investments and strategic resource planning for charging infrastructure. Several studies have explored these aspects to develop strategies for integrating EVs into the power grid more efficiently. Given the unique nature of EV charging power demand patterns, which exhibit significant fluctuations due to the unpredictable behaviour of EV users and their sequential dependencies, employing an LSTM neural network for forecasting this demand is a logical approach. In light of this, the study [15] introduces an LSTM-based model to predict aggregated EV fast-charging power demand. To evaluate the effectiveness of the proposed model, real-world data collected from 244 fast-charging stations is utilized. Additionally, to enhance the accuracy of the forecasts, the study recommends using window sliding min-max normalization and a specialized weights initialization technique tailored for improved performance.
Among the diverse range of approaches, Artificial Neural Networks (ANNs), Recurrent Neural Networks (RNNs), and their popular variant, LSTM, are widely utilized by researchers. The LSTM model, developed by Hochreiter and Schmidhuber addresses the vanishing gradient problem inherent in traditional RNNs, offering an enhanced version of RNNs [16]. Chang et al. employed the LSTM approach to predict aggregated charging power demand across multiple fast-charging stations and compared its performance with other models. The LSTM model demonstrated high accuracy and outperformed other deep learning models [17]. Similarly, Marino et al. utilized an LSTM model to predict building energy loads by optimizing the number of neuron nodes, achieving notable results [18]. In another study, Kong et al. applied LSTM to residential load forecasting, which exhibited superior performance compared to other methods [19]. Lu et al. also explored various neural network models for hourly aggregated EV load forecasting, with LSTM emerging as the top-performing model based on back-testing results [20].
The literature review highlights that LSTM, RNN, and ANN methods have been successfully applied to EV load forecasting. However, these methods face certain limitations, particularly due to their sequential processing of input data, which can be challenging when handling datasets with long-term dependencies [21]. Despite these constraints, LSTM remains a powerful tool in load forecasting. In addition to these limitations, traditional LSTM models treat all time steps equally, failing to prioritize or assign importance to specific steps or patterns that may be more critical for accurate predictions, such as sudden spikes in energy demand. Furthermore, LSTMs lack interpretability, as they operate as black-box models, making it challenging to understand which specific parts of the input sequence contribute most significantly to the output. Another drawback is their sequential data processing nature, which results in slower performance and inefficiencies when handling large datasets.
We propose a novel attention-augmented LSTM model incorporating an attention mechanism to address these challenges. This mechanism enables the model to dynamically focus on the most relevant time steps, enhancing its ability to capture long-term dependencies and improving overall prediction accuracy. These advancements position the AA-LSTM model as a robust and interpretable solution for complex time-series forecasting tasks, particularly in scenarios involving dynamic and critical data patterns. The key contributions of this study are as follows:
(1) We introduce a novel AA-LSTM model that leverages the LSTM model’s strengths in processing sequential data while integrating an attention mechanism to improve performance by focusing on the most relevant parts of the input data.
(2) The model assigns adaptive weights to each time step, allowing it to prioritize critical periods in charging data, such as sudden spikes and anomalies.
(3) The AA-LSTM model provides insights into which features, and time steps contribute most significantly to the prediction process by analyzing attention weights. This addresses the black-box nature of conventional LSTMs, offering greater transparency and interpretability.
(4) The model reduces the computational burden by focusing on only essential parts of the sequence, making the model faster and more effective.
2.1 EV Load Forecasting Approaches
EV load forecasting techniques can be broadly categorized into two main approaches: traditional statistical time series methods and machine learning (ML) algorithms. In one study [6], the Autoregressive Integrated Moving Average (ARIMA) model was utilized to predict the daily charging demand of EV parking lots. ARIMA, a widely used statistical time series model for load forecasting, was fine-tuned by optimizing its integrated and autoregressive order parameters to enhance accuracy and reduce the mean square error (MSE). Another research effort [7] evaluated various time series and ML models for predicting daily EV charging demand over a 28-day period in the Netherlands. The findings revealed that the Seasonal Autoregressive Integrated Moving Average (SARIMA) model delivered superior performance compared to Random Forest (RF) and Gradient Boosting Regression Tree (GBRT) algorithms. A study [8] by Louie analyzed two years of aggregated power consumption data from 2400 Washington State and San Diego charging stations. They introduced a time-series SARIMA model to forecast the load at EV charging stations. While statistical time series models are advantageous due to their simple structure and low training requirements, they are limited in their ability to model the nonlinear characteristics of load data.
Neural networks offer a robust solution to the limitations of traditional time series models by effectively capturing complex features and establishing nonlinear mapping relationships. Deep learning models, particularly artificial neural networks (ANNs), have seen significant advancements in EV load forecasting in recent years. These models excel at automatic feature extraction from large datasets and demonstrate strong adaptability [9]. For instance, research [10] utilizes ANN-based forecasting algorithms within Building Energy Management Systems (BEMS) to predict EV charging profiles. Another study [11] compares the performance of ANN, Rough Artificial Neural Network (R-NN), and Recurrent Rough Artificial Neural Network (RR-ANN) in forecasting 24-h EV loads on distribution systems based on travel behaviour. The results indicate that the RR-ANN model outperforms the others, delivering the highest prediction accuracy.
Numerous studies, such as [12,13], have explored the broader impact of EVs on energy consumption (kWh). These studys show that widespread EV adoption could significantly influence national power generation and residential distribution systems. Conversely, a study [14] estimates the effect of EV charging loads on the U.K. national grid, revealing that a substantial increase in EV numbers would have a lesser impact on the grid than previously anticipated. This is attributed to the U.K.’s ample power generation capacity, which can accommodate the additional charging demand. Gómez and Morcos [22] developed a model to assess the harmonic distortion caused by EV charging loads on distribution systems. Their model determines optimal charging times based on existing load (excluding EVs), ambient temperature, and time of day. However, the study [22] made certain simplifications, such as assuming all chargers start simultaneously and that batteries begin charging from a fully discharged state. In reality, EV charging demand depends on factors like the number of EVs, charging start and end times, and the initial state of charge.
Orr et al. [23] investigated the harmonic currents generated by clusters of EV chargers connected to a common distribution bus using Monte Carlo simulations. Their analysis considered daily recharge cycles, accounting for variations in start times and the number of chargers. Similarly, a study [24] proposes a methodology for modelling and analyzing EV charging loads in distribution systems. The approach provides an analytical solution to predict EV charging demand, incorporating stochastic elements such as the randomness of charging start times and initial battery states-of-charge. The findings reveal that a 10% EV market penetration could increase daily peak demand by up to 17.9%, while a 20% penetration could lead to a 35.8% rise in peak load under uncontrolled domestic charging scenarios, representing the “worst-case” situation.
2.2 Advances in Energy-Aware Optimization and Deep Learning for Time-Series Forecasting in Smart EV Infrastructure
The study [25] presents a novel framework, AES2S-EAORL, that integrates attention-based sequence modelling with Reinforcement Learning for smart grid demand purposes. The study discusses the significance of deep learning techniques for non-intrusive load monitoring and adaptive optimizaiton. The study [26] introduces a context-aware EV smart charging system that leverages deep reinforcement learning for energy-aware optimization and dynamic decision-making in smart infrastructure. The model addresses real-time grid load management and user-centric efficiency by combining contextual factors and deep reinforcement learning. The study [27] leverages the Bi-layer Coordinated Charging Navigation Model (Bi-CCNM) to improve EV routing and grid interaction. The model is designed to minimize charging costs while effectively incorporating vehicle-to-grid capabilities to handle the variability of renewable energy sources. By combining the JO-GBLB algorithm, the accuracy of the EV consumption is increased by approximately 6.7%. Additionally, it helps significantly reduce power exchange with the primary grid, enhancing safety and efficiency. The study [28] introduces a framework that integrates LSTM with transformer models for EV energy consumption prediction, effectively capturing long-term dependencies and driving patterns. The model incorporates individual driving styles and varying driving conditions and records a remarkable MAPE of 4.63% for SOC prediction, outperforming traditional approaches and demonstrating strong potential for long-distance range estimation. The study [29] proposes a hybrid of the Graph Convolutional Neural Network (GCNN) and LSTM model that captures spatio-temporal dependencies in power and transportation systems to forecast EV charging demand. The model extracts spatial features with GCNN and temporal features with LSTM, enabling accurate load forecasting. Comparative results demonstrated superior prediction performance over existing state-of-the-art models.
These studies have effectively employed deep learning, sequence modelling based on attention, reinforcement learning, and hybrid LSTM to optimize EV charging load prediction and improve the interaction in the grid [30]. The models are good at performance, spatio-temporal, and SOC prediction. Unlike these studies, our proposed AA-LSTM model integrates multi-layer LSTM with attention augmentation to weight temporal features dynamically, achieving superior short-term forecasting accuracy and adaptive responsiveness for EV charging in highly volatile environments.
3 AA-LSTM Model for EV Charging
In this section, we present the proposed AA-LSTM model, which consists of data collection from EVs, raw feature extraction, attention module, and LSTM model for forecasting. These modules are discussed one by one in detail as follows.
3.1 Data Collection and Storage
The data collection and storage module of the proposed AA-LSTM model is designed to gather real-time data from various EVs and charging stations. This data enables accurate predictions and efficient decision-making in EV charging scenarios. The data collected are battery state-of-charge, charging rates, energy consumption patterns, etc. The data is stored securely from the vehicles to the nearest charging station using communication protocols such as Wi-Fi or Vehicle-to-Grid (V2G). The charging stations collect data such as the availability of charging slots, power delivered to EVs, power capacity, etc. After the data collection, it is transmitted to a centralized cloud-based storage system for further processing. The cloud infrastructure is a scalable and centralized repository capable of handling large volumes of heterogeneous data from multiple sources.
3.2 Data Preprocessing and Feature Engineering
Identifying, selecting and then isolating essential features from the data collected is one of the critical stages in feature extraction. Different statistical techniques are performed to analyze the data and filter the unnecessary information, null values and redundant data to obtain a meaningful representation. This stage helps ensure that only relevant and informative features are passed on to the subsequent model, improving their efficiency and accuracy. The study utilizes the ACN dataset, which contains rich temporal and session-level information about EV charging activities. To prepare the data, we adopted a domain-aware feature extraction strategy that transforms the raw records into a format suitable for temporal modelling.
The Start_Date___Time and End_Date___Time fields were parsed into standardized date time formats during preprocessing. This enabled the extraction of meaningful temporal attributes such as the hour_of_the day, charging_duration, total_session_duration, day_of_the_week, and month factors crucial for capturing daily, weekly, and seasonal charging patterns. Key numerical features such as Energy (kWh), GHG Savings (kg), Gasoline Savings (gallons), and Charging Time were retained. Charging duration values were converted into float representations (in minutes) to reflect active usage better. Features with very low variance were excluded, as they offered little contribution to model performance. Inconsistent and incomplete records were removed to improve data quality. Additionally, all timestamps were normalized across time zones to ensure temporal alignment throughout the dataset. To support sequential learning, the dataset was structured into sliding windows, each comprising a fixed number of consecutive sessions. These windows were used to construct input samples for the AA-LSTM model, allowing it to learn patterns over time rather than from isolated events.
While traditional statistical feature engineering was deliberately minimized, the sequence-aware architecture of the AA-LSTM model enabled it to learn and extract relevant temporal features automatically. Its integrated attention mechanism enhanced it by dynamically focusing on each sequence’s most informative time steps.
The attention module, shown in Fig. 1, is designed to assign dynamic weight vectors to input feature vectors based on their contribution to the prediction task. Let
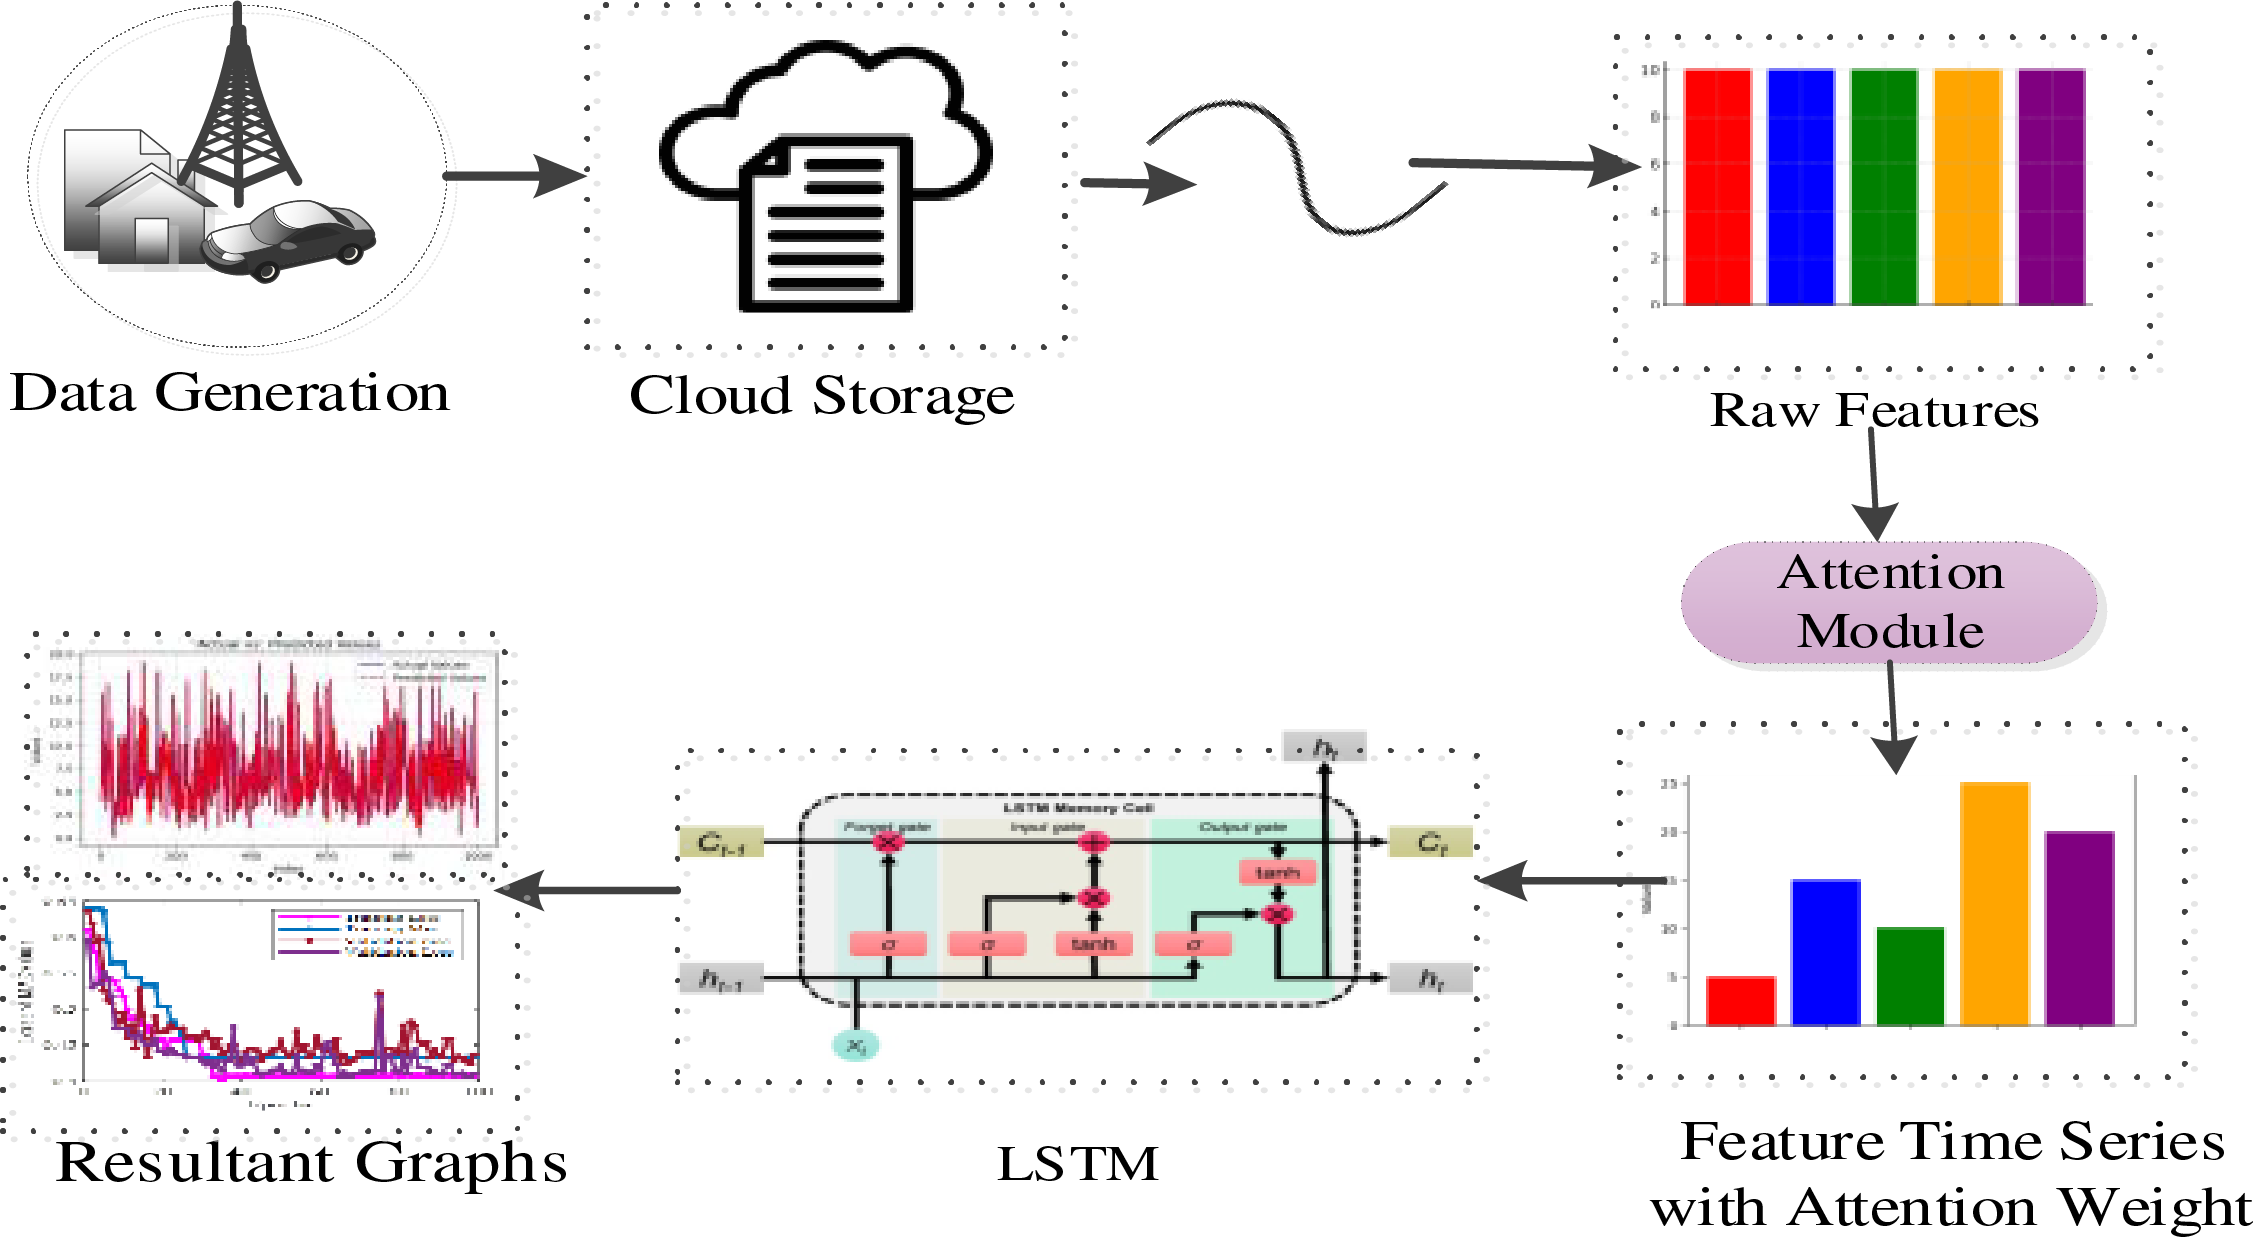
Figure 1: Architecture of the proposed AA-LSTM model
3.4 AA-LSTM Model for Forecasting
The model consists of four layers of stacked LSTM as shown in Fig. 2, each progressively reducing the feature dimensionality while preserving sequential information. The first layer of the LSTM consists of 256 units, followed by batch normalization and dropout layers to stabilize training and prevent overfitting. A second LSTM layer consists of 128 units. The second layer is integrated with a self-attention mechanism, allowing the network to focus on critical time steps and improve feature selection. The third and fourth layers further reduce the representations learned by the model. The layers consist of 64 and 16 units, respectively, compressing the learned representation and thus optimize the feature extraction process for prediction. The model’s last output layer consists of a fully connected dense layer with a ReLU activation function. The Adam optimizer with a learning rate of
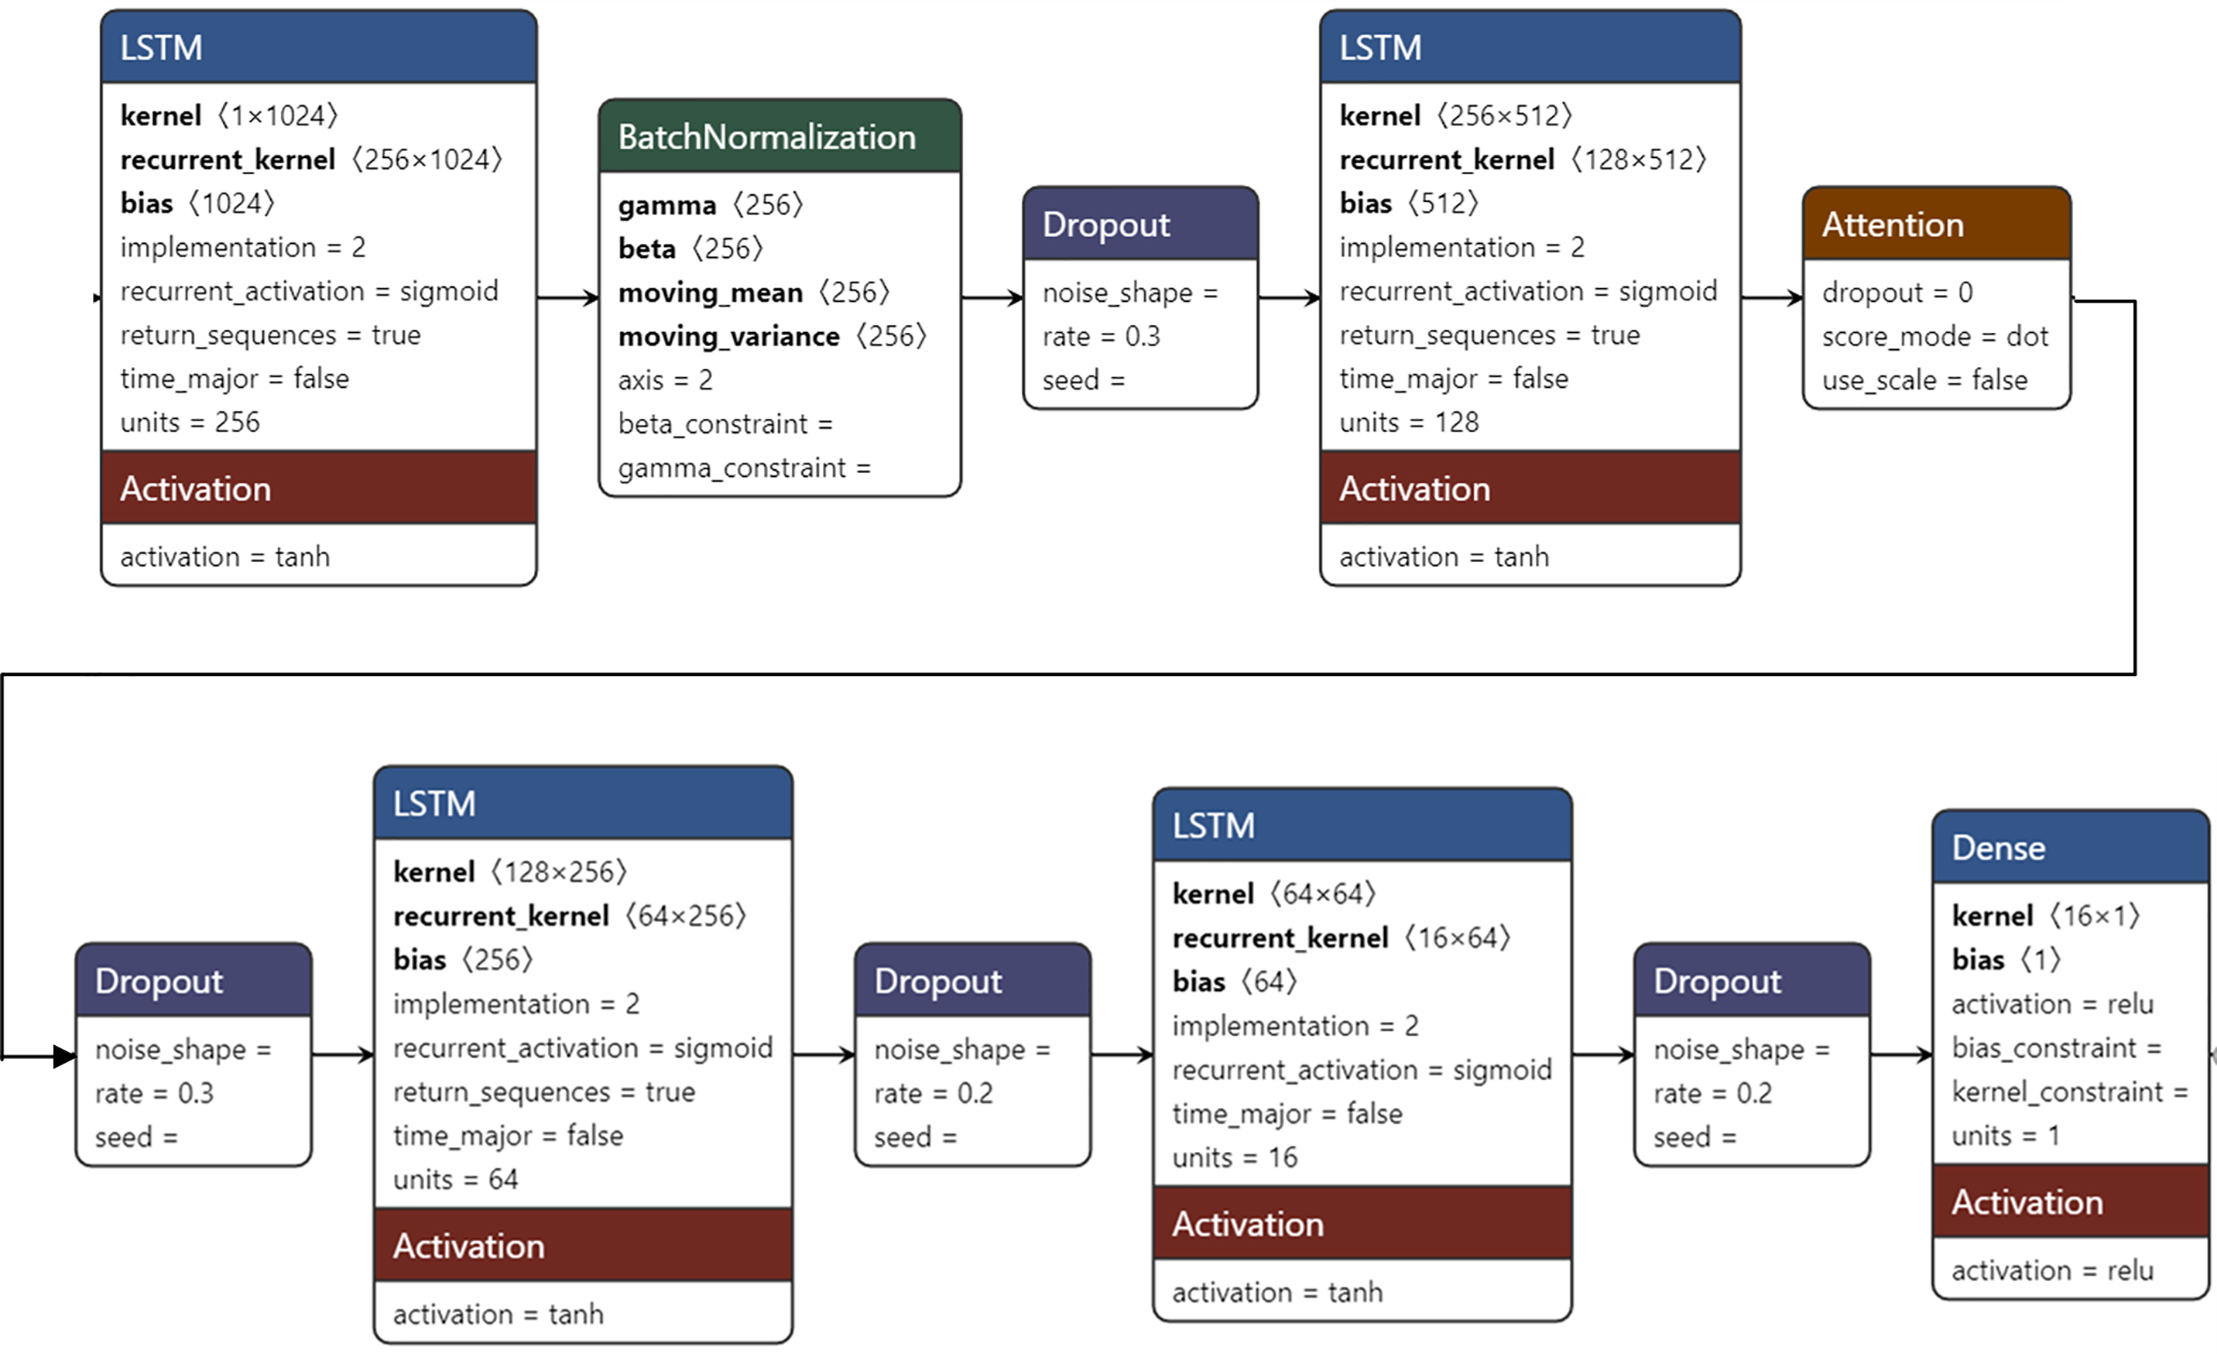
Figure 2: Summary of the AA-LSTM model
The selection of four layers in the proposed AA-LSTM model is based on the hypothesis that the energy demand and load balancing patterns show hierarchical temporal dependencies in EV charging stations. The lower layers of the proposed model capture immediate EV arrivals and fast fluctuations in grid capacity. The higher layers capture prolonged high-demand periods and scheduling inefficiencies. The selection of the four stacked LSTM layers along with the attention module in the proposed AA-LSTM model is based on the theoretical work of study [31], which addressed the problem of vanishing gradient and model long-term dependence on data. Furthermore, the study [32] argued that deeper RNNs can increasingly extract abstract temporal features with appropriate training strategies such as gradient clipping. In our proposed model, each layer in the LSTM captures a different temporal abstraction, such as short-term user behaviour and long-term demand trends in the deeper layers. Integrating the attention module in the AA-LSTM model allows it to assign weights dynamically to past time steps, making it select features dynamically rather than uniformly based on all historical inputs. The proposed model focuses on the most relevant segments of the time series data, such as sudden demand peaks, which are significant in non-stationary EV charging environments. The model provides a comparable prediction accuracy and interpretability, consistent with state-of-the-art models.
In time-series prediction, complex temporal and long-range dependence on historical data, specifically in energy management scenarios, makes capturing appropriate contextual information critical [33]. Traditional LSTM models perform well in sequential data modelling due to their gating mechanisms regulating information flow. However, there are several challenges, such as retaining long-term dependencies, particularly when the input sequences are lengthy or have variable importance across different time steps. The proposed AA-LSTM model integrates an attention mechanism into the LSTM framework to address these challenges. The incorporated attention layer dynamically assigns weights to each hidden state in the input sequence. The AA-LSTM model does not rely solely on the final hidden state, as does the LSTM model. The proposed model computes a context vector as a weighted sum of all hidden states, where the weights are learned during training. This helps the model select the most discriminant past-time steps, significantly contributing to the model’s final classification. The proposed AA-LSTM model also improves interpretability by providing insights into which time steps influence the model’s decision, making the prediction process more transparent and explainable. Another feature in the proposed model is the dynamic temporal selection of features to learn the moments in the input sequence that are very informative for the current prediction. This adaptivity is crucial for energy management in EV charging stations, where irregular factors such as time of day, user schedules, and load on the grid affect demand. AA-LSTM model is also resilient to fluctuations and outliers in the data.
The Adaptive Charging Network Dataset (ACN-Data) was utilized in the study, and this dataset was gathered from two Adaptive Charging Networks based in California. The first site is in a parking garage on the Caltech campus and features 54 Electric Vehicle Supply Equipment (EVSE) units and a 50 kW DC fast charger. This charging network is accessible to the public and frequently used by non-Caltech individuals. Due to the proximity of the parking facility to the campus gym, many users charge their vehicles during morning or evening workouts.
The second site is at the JPL, where 52 EVSE units are available in a parking garage. Unlike the Caltech network, the JPL site is restricted to employees, making it a prime example of workplace charging. JPL’s high adoption rate of electric vehicles significantly utilizes the charging stations. An informal system has also emerged, where drivers move their vehicles after charging is complete to make room for others. Infrastructure costs have been minimized at both locations by oversubscribing shared components such as transformers. While the Caltech network represents a mix of workplace and public charging, the JPL site is focused exclusively on workplace use.
The proposed model is developed with a core i5 processor of intel and a Graphics Processing Unit (GPU) from NVIDIA GetForce GTX 1650Ti with 4 GB memory. All the experiments were carried out on Python 3.6, cuda toolkit 10.0, and the version of cudnn 7.4, utilizing the TensorFlow library. The following sections present a detailed description of the experiment settings, evaluation metrics, and model performance.
Several metrics can be used to evaluate the model, such as the ones mentioned in the study [34]. However, the proposed model considers four widely used performance metrics employed on similar problems in the literature. These metrics are shown in Eqs. (2)–(4): Mean Square Error (MSE), Mean Absolute Error (MAE), and Mean Absolute Percentage Error (MAPE).
where
4.4 Temporal Pattern of Energy Consumption
Fig. 3 shows the temporal patterns of energy consumption for EV charging. The rise in the energy demand can be observed between 6–10 a.m. and peaks at 8–10 a.m. A significant peak occurs during the 10 p.m. to midnight interval. This likely corresponds to EV owners charging their vehicles overnight at home or late-night public charging. The energy demand is consistently lower during early afternoon and midnight. This pattern might indicate fewer charging events during work hours as vehicles are parked and not actively charging. The pattern demand suggests two main charging behaviours. The morning charging is possibly at the workplace or public charging, and the charging in the evening is mainly dominated by home charging or late-night convenience charging. The significant drop in demand during midday could indicate limited midday charging availability or behavioural preferences to charge outside working hours. The energy demand during evening time may stress grid infrastructure if the chargers are not evenly distributed. It is necessary to plan for additional capacity during these peak intervals. The low mid-day demand offers an opportunity for demand response programs or shifting charging loads to reduce grid stress.
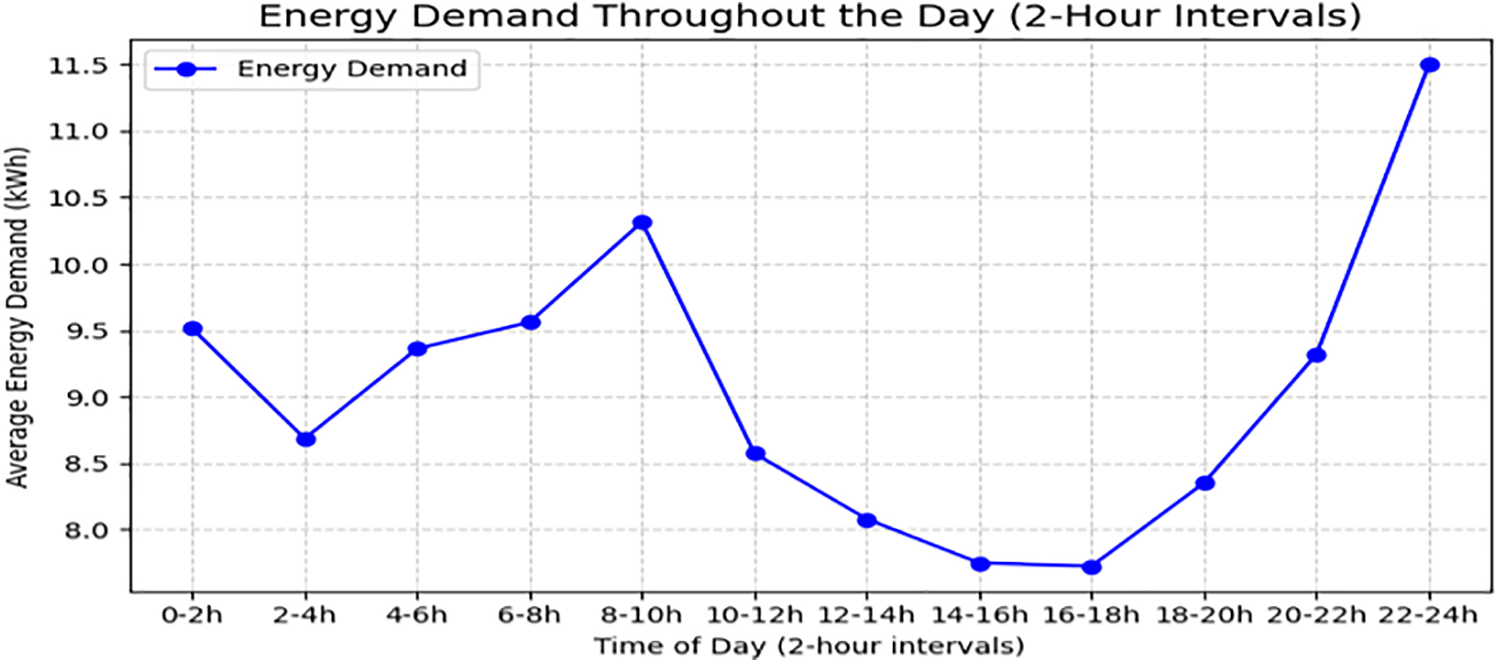
Figure 3: The energy demand in (kWh) through 2-h interval on SVN dataset
Fig. 4 shows the correlation matrix to visualize the relationships between various features in the data. The matrix shows a high correlation between Energy, GHG, and Gasoline savings. These features are closely related, likely due to their environmental interdependence. The low correlation is shown by the zip_postal_code feature with other features, suggesting that it does not significantly influence or relate to different variables.
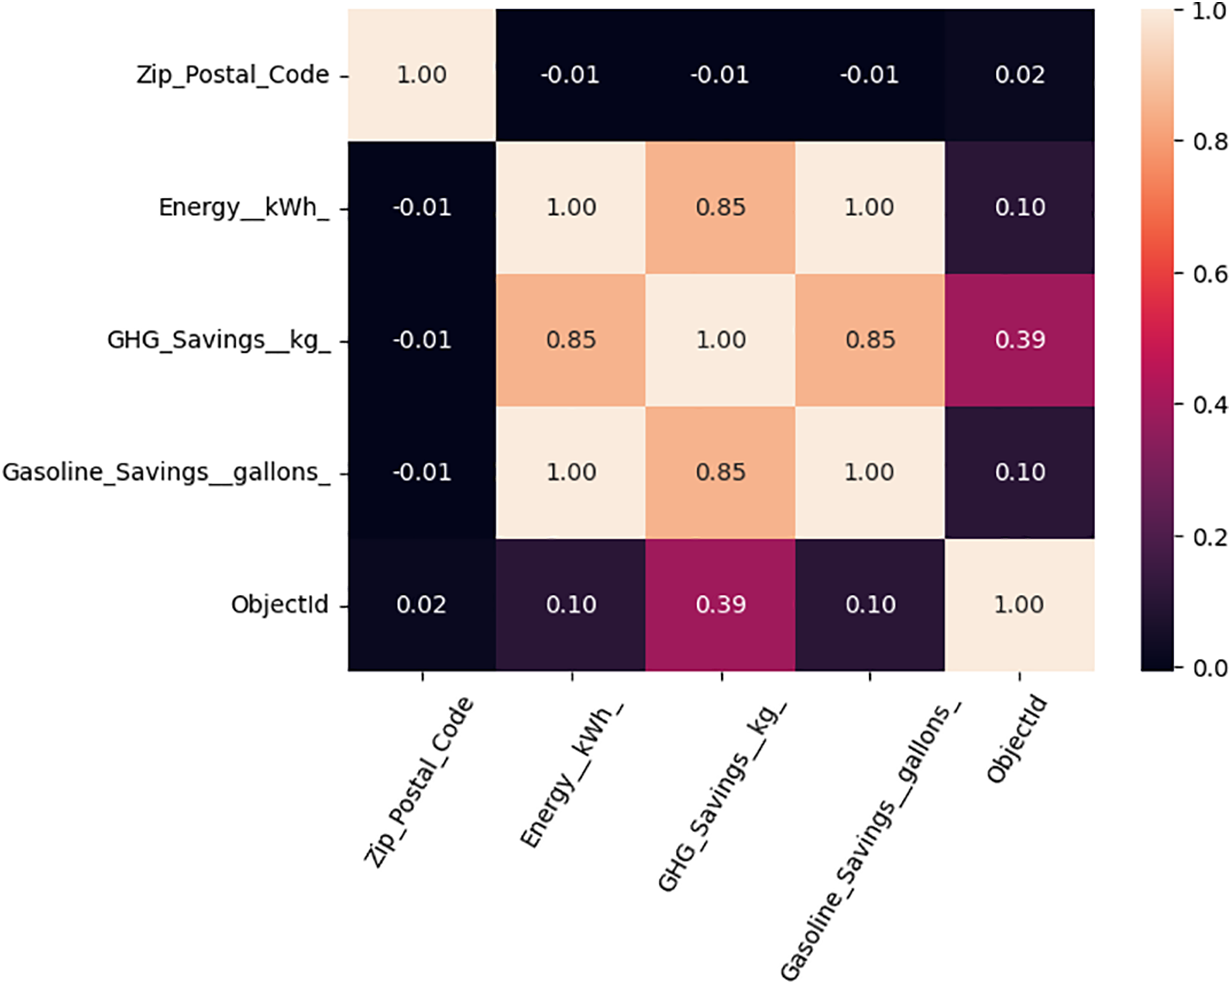
Figure 4: The correlation matrix visualizes the relationships between various features in the dataset
4.5 Performance of the Evolution
We measure the performance of AA-LSTM and compare it with the original LSTM model, conventional ARIMA and SARIMA models. Four metrics show the performance training loss, validation loss, training MAE and validation MAE. The training and validation losses decline as the number of epochs increases. This indicates that the model is learning and performance prediction is improving. The model reaches its optimal and stabilizes around epoch 40. The validation loss is slightly higher than the training loss, showing that the model generalizes reasonably well without significant overfitting. It can be seen from the graph that the training MAE and validation MAE follow a similar trend of steady decline over epochs. The final MAE values stabilize, indicating that the model is becoming more accurate. The validation MAE shows occasional spikes, for instance, at epoch 80, indicating slight instability in the model generalization during the training process. This could also be due to noisy data or a suboptimal learning rate. The consistent reduction and stabilization of MAE and loss metrics suggest the LSTM model is effective for the dataset, with no severe overfitting or underfitting. Although the model shows good convergence with increasing epochs, it struggles to retain long-term dependencies in complex sequences. In addition, the ACN dataset involves short-term trends and long-term behaviours, and a model like LSTM is likely to fail to capture these efficiently.
Next, the AA-LSTM model is trained with the same dataset and under similar conditions, and it was observed that the model shows better performance than the original LSTM. Fig. 5a shows the model’s performance with training loss, validation loss, training MAE and validation MAE. The convergence of the training and the validation loss of the AA-LSTM model is better and faster. The training loss stabilizes at 80 epochs, and the training MAE stabilizes at 20. The Fig. 5b also shows the spikes; however, the spikes are smaller than the original LSTM.
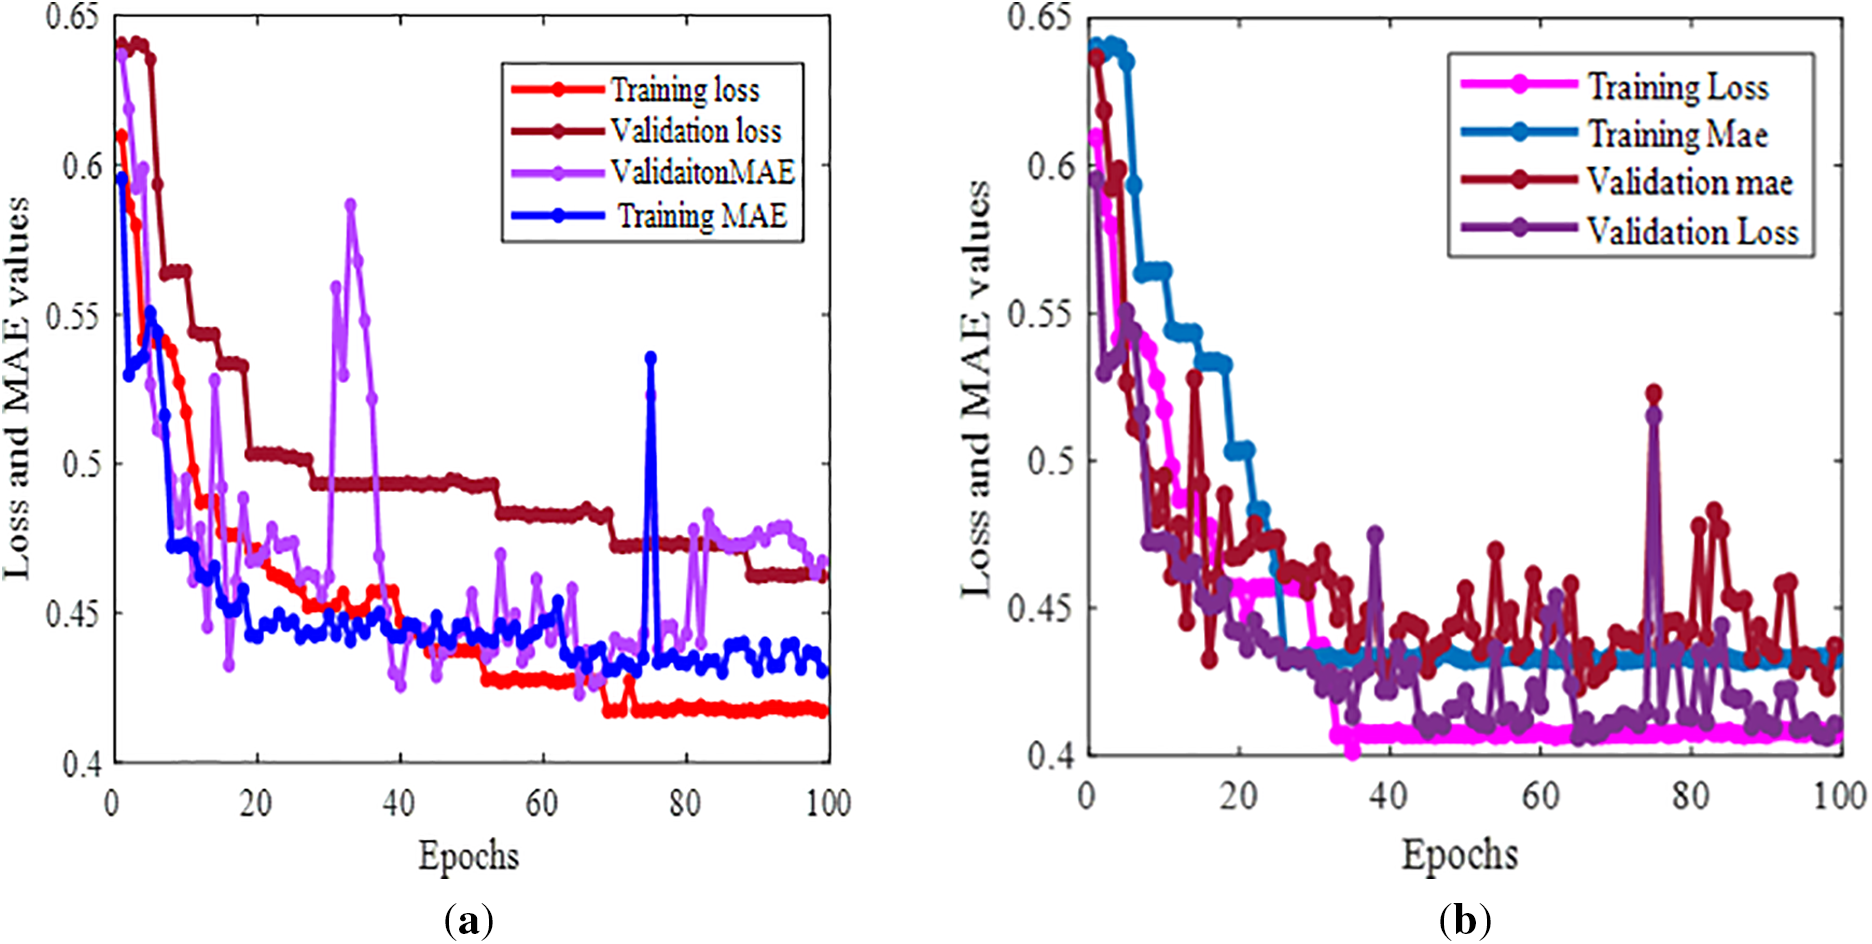
Figure 5: (a) Original LSTM; (b) AA-LSTM model over the ACN dataset
Table 1 shows the performance comparison of the proposed AA-LSTM model with the base LSTM and conventional ARIMA and SARIMA models. The ARIMA and SARIMA achieved a MAPE of 17.36% and 15.64%, respectively. The LSTM achieved a MAPE of 4.98%, and the proposed AA-LSTM showed a better MAPE of 3.90%. The performance of ARIMA and SARIMA is consistent with the prior studies on time series forecasting. These models were also evaluated using MSE and R2 to provide holistic performance comparisons of these models. The proposed model achieves a lower MSE of 0.40%, followed by SARIMA and ARIMA, which has a higher MSE of 5.23% and 6.32%. The AA-LSTM model with lower MSE shows better and more consistent predictions. The R2 value of 95.88% is higher than the other three models. LSTM is at 93.60%, followed by ARIMA at 76.79% and the SARIMA model at 71.24%. The SARIMA and ARIMA with lower R2 values show the data’s limited capacity and nonlinear dependence. The AA-LSTM model, with an R2 of 95.88%, confirms that the model generalizes well and demonstrates the effectiveness of AA-LSTM for EV charging load forecasting tasks. The parameters indicate that AA-LSTM is more accurate and precise when estimating energy demand. We can see how well the model predicts the energy demand using these metrics.
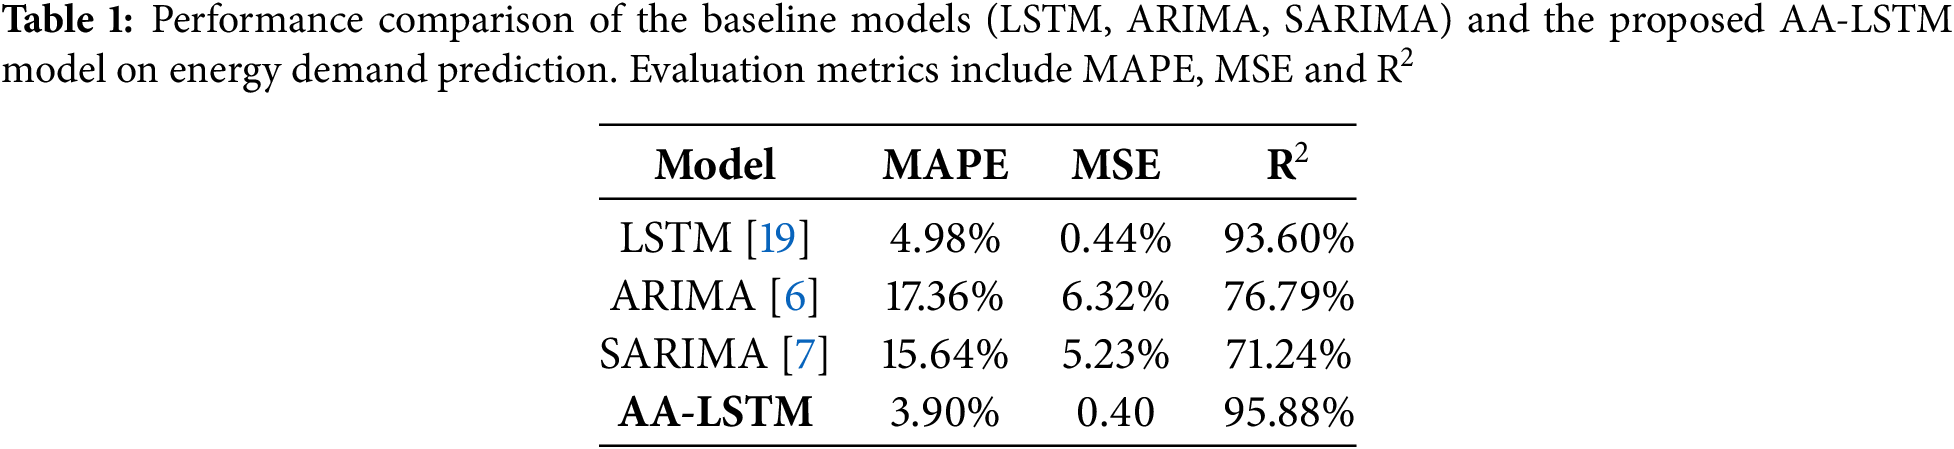
Performance comparison of the original LSTM, ARIMA, SARIMA and the proposed AA-LSTM model on energy demand prediction.
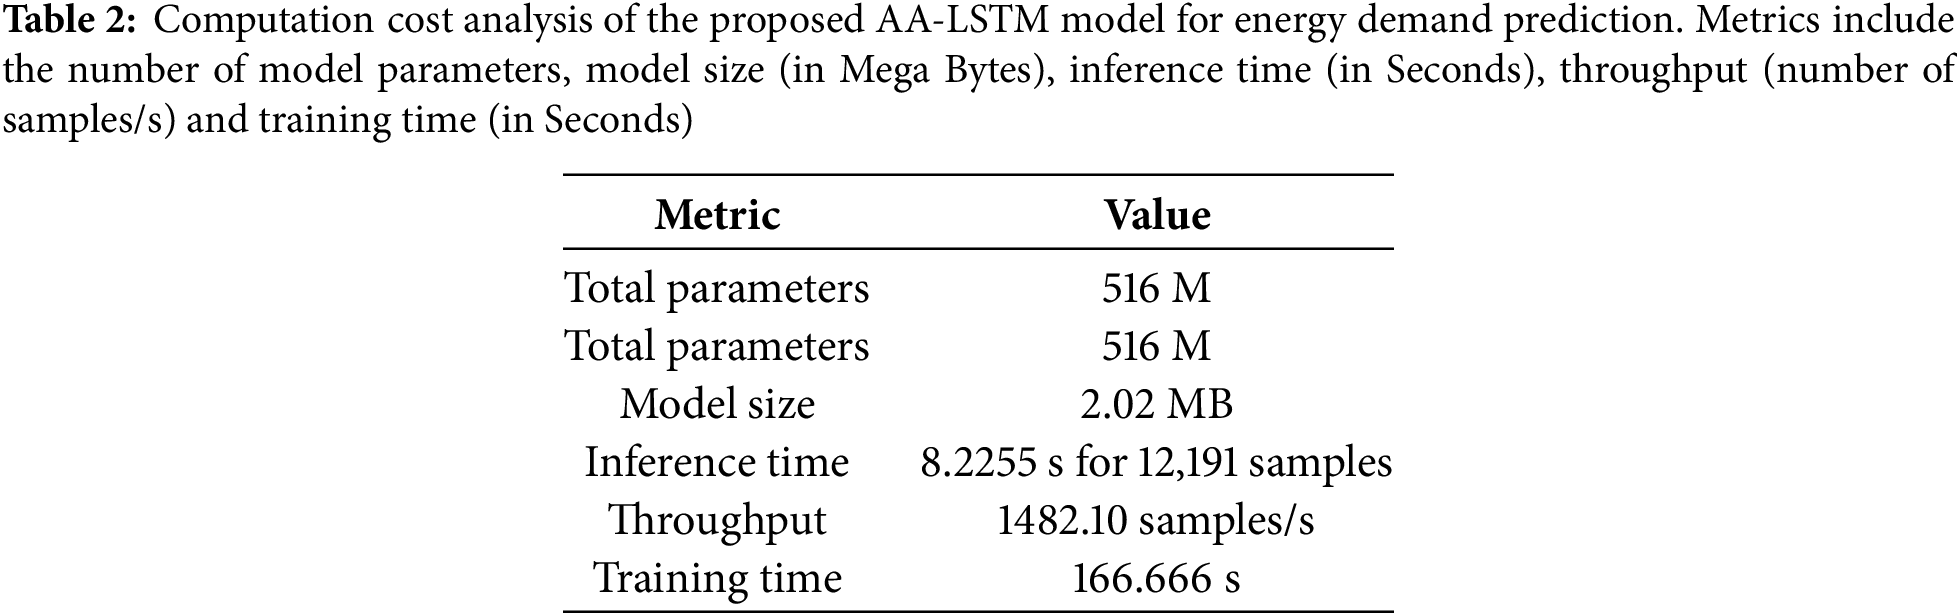
In this section, we discuss the computational cost shown in Table 2. The table consists of Metrics such as total parameters, model size, inference time, throughput and training time. The proposed AA-LSTM model takes approximately 166.66 min for training. This training time is within the acceptable range for a model which consists of four stacked LSTM layers and the sequential nature of the time series data. The model shows an inference time of 0.00067 s/sample, making the model suitable for real-time applications. The inference throughput of the model is approximately 1482 samples/s. The saved model size is 2.02 MB, making it ideal for deployment in edge or embedded systems, and the total parameters are approximately 0.516 million. Although the proposed model leverages advanced deep learning architectures for efficient representation of the temporal features, it is computationally efficient and scalable for deployment.
In the experimentation process, the data were changed to CSV format, and outliers and irrelevant features were removed and normalized. The preprocessed data is used to train the models, LSTM, and our proposed AA-LSTM was trained and tested using preprocessed data. The prediction plots for LSTM and AA-LSTM are shown in Figs. 6 and 7. These charts visually compare the expected energy demand generated by the models and the actual energy demand data. The samples are shown on the x-axis, and the energy or energy is shown on the y-axis. Fig. 6 shows the performance of the AA-LSTM model on training data with 1000 samples only, and Fig. 7 shows the model’s performance on the test dataset with 500 samples only.
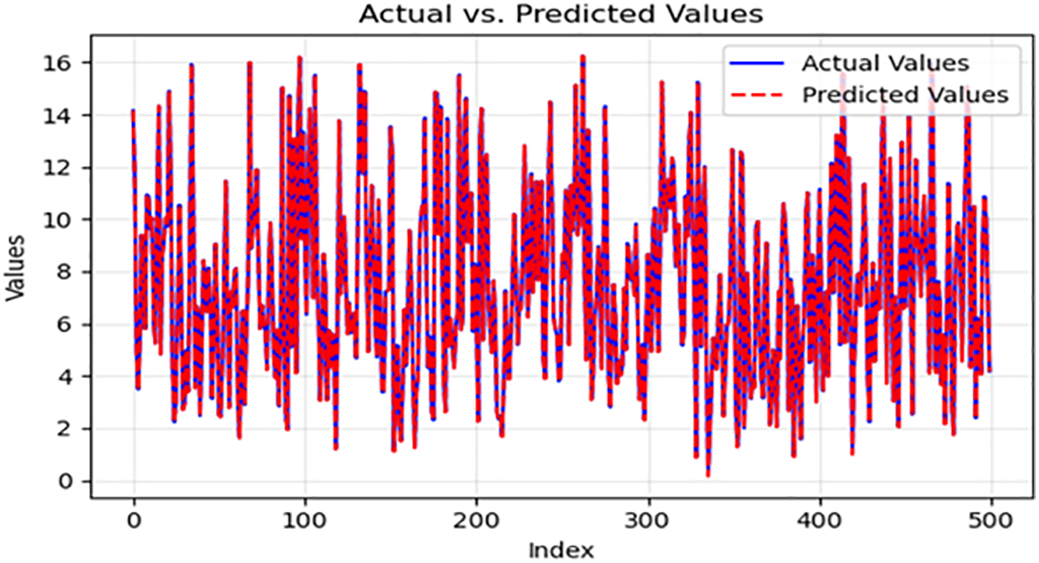
Figure 6: The prediction plot of the AA-LSTM training dataset on energy demand forecasting in EVCS Original LSTM
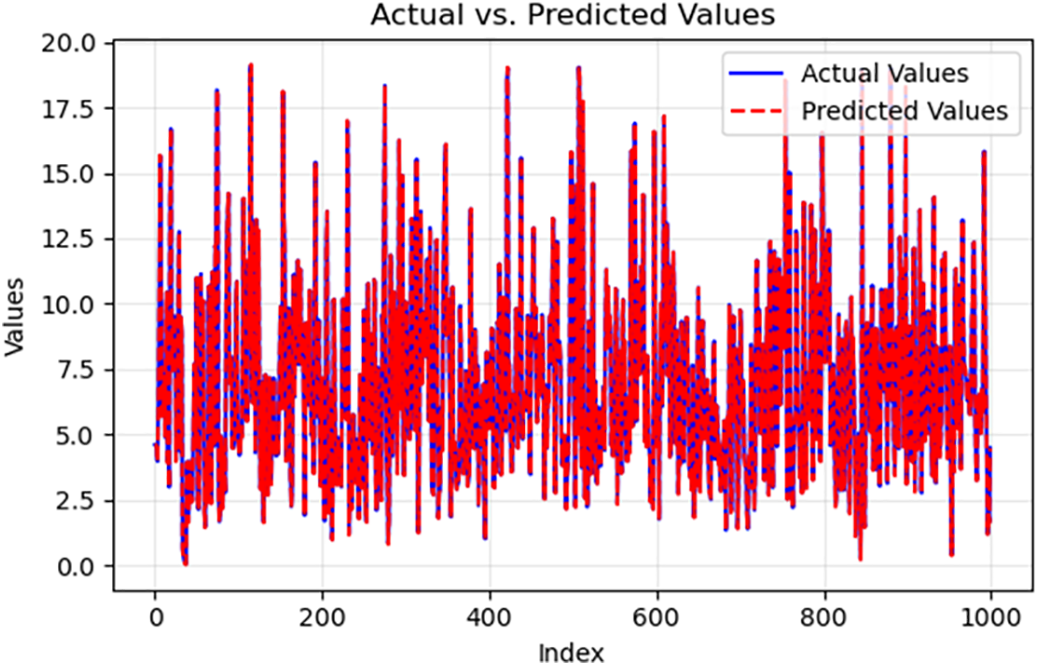
Figure 7: The prediction plot of the AA-LSTM training dataset on energy demand forecasting in EVCS
4.7 Deployment Scenarios for AA-LSTM in Energy-Aware EV Charging
This section illustrates how the proposed AA-LSTM model can be effectively integrated into smart EV charging management systems across different real-world environments. We present two practical use cases: (i) University Campus Charging Management and (ii) Corporate EV Fleet Optimization. In the first use case, historical charging behaviour data from the ACN dataset is utilized to forecast daily energy demand and identify peak load periods. Based on these predictions, the proposed model can assist facility managers in dynamically allocating power to available charging stations. By identifying non-critical charging sessions, the system can defer them to off-peak hours, thus preventing grid congestion and improving overall energy efficiency. This proactive scheduling enables better resource utilization and cost-effective energy management in academic or institutional settings.
The second use case focuses on corporate environments managing dedicated EV fleets for employees. In such settings, the proposed model can support intelligent scheduling of vehicle charging based on forecasted demand patterns. This enables optimized energy distribution and timely alerts for infrastructure scaling, ensuring that charging capacity evolves with demand.
Both predicted and actual values follow a similar trend, indicating that the model has learned the patterns effectively on the ACN dataset for the test data. Thus, the model generalizes from the training data to unseen test data. The model predictions are consistent throughout the data range provided there are no significant fluctuations or drifts where the predictions diverge significantly from the actual values, which indicates stability in the model’s performance.
4.8 Visualizing Attention across Time: Insights into AA-LSTM Interpretability
We employ a three-fold visualization strategy focused on the attention mechanism’s evolution to better understand how the proposed AA-LSTM model captures temporal dependencies during training. These visualizations offer valuable insights into how the model learns to prioritize different time steps when encoding sequences, shedding light on its internal reasoning. Fig. 8 presents a heatmap of attention weights across 100 training epochs for a representative sample. This dense, epoch-wise view reveals how the model’s temporal focus shifts as it learns. In the early stages of training, attention weights fluctuate significantly, reflecting the model’s exploratory search for functional temporal patterns.
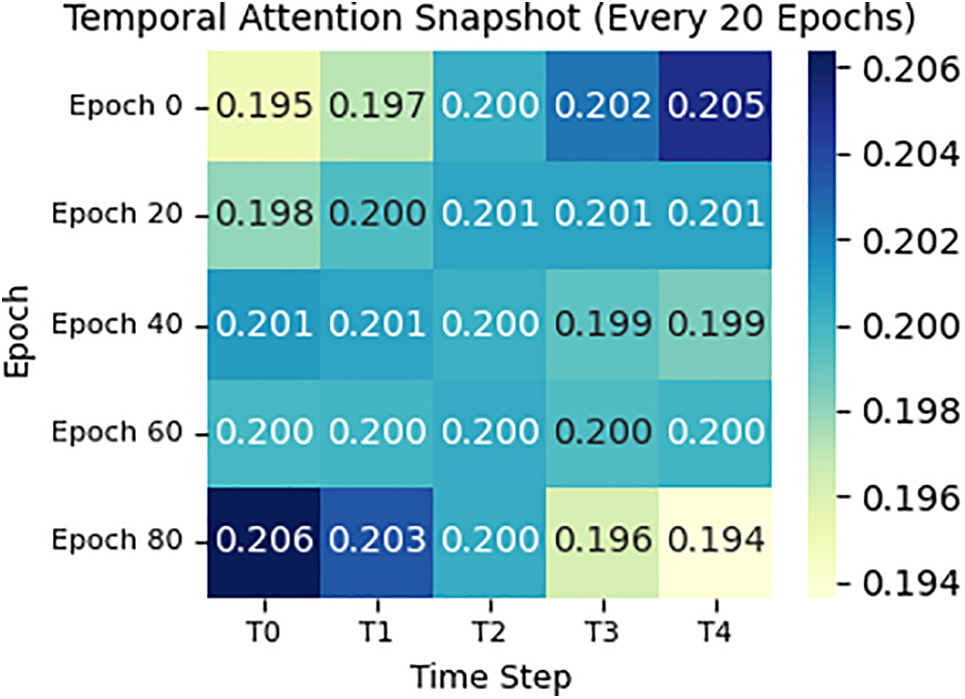
Figure 8: Temporal attention snapshot after every 20 epochs of the proposed AA-LSTM model
Over time, however, the attention distribution becomes more stable, with certain time steps consistently receiving higher weights. This progression suggests the model is converging on a more structured temporal understanding, focusing on the segments of the input that are most predictive for the task. Fig. 9 complements this by showing attention distributions at every 20th epoch. This spaced-out perspective makes spotting broader trends and inflection points in the learning process easier. Attention initially oscillates between time steps but gradually consolidates around key positions as training continues. These shifts often align with noticeable performance improvements, underscoring the relationship between attention refinement and model optimization. Fig. 10 takes a statistical approach by plotting attention weights’ mean and standard deviation across all samples for each time step. This graph provides a holistic view of how reliably each time step contributes to predictions. Time steps with consistently high mean weights and low variance by later epochs indicate strong, confident learning. On the other hand, those with low or volatile weights are likely less informative, which aligns well with expectations from the EV energy prediction domain.
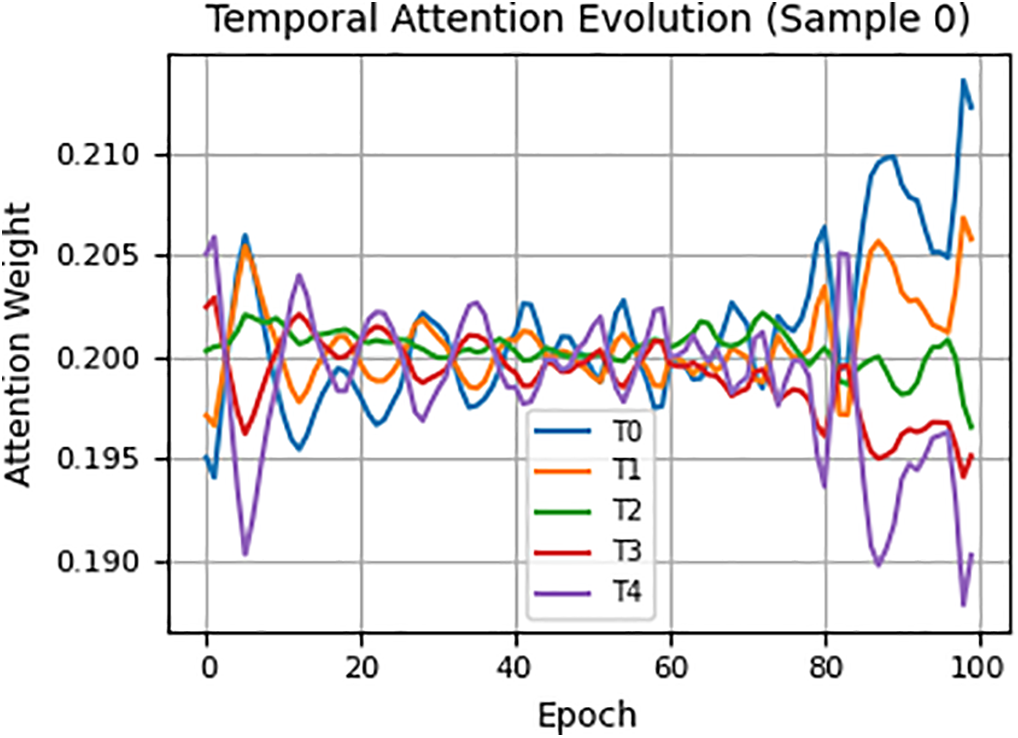
Figure 9: The temporal attention weight evolution with epochs
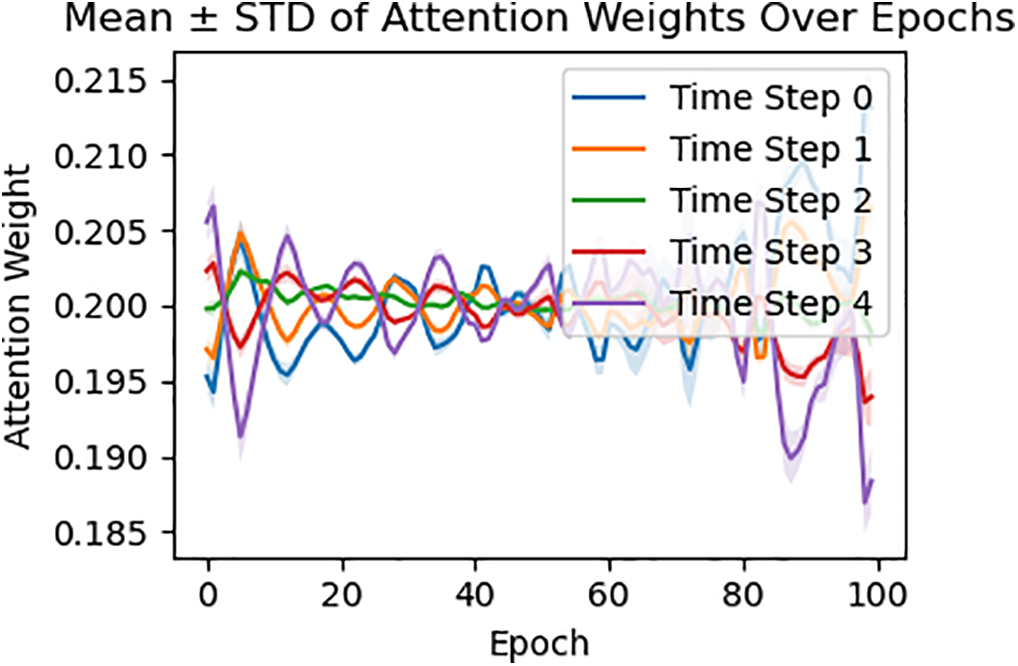
Figure 10: The Mean and Standard Deviation (STD) of the attention weight evolution with epochs
Together, these visualizations illustrate that AA-LSTM is not merely a black-box enhancement but a transparent and interpretable architecture. Its attention mechanism evolves meaningfully during training, allowing us to trace how and when the model learns to focus on critical temporal features. Such interpretability is essential in high-stakes applications, where understanding model behaviour aids in trust, debugging, and even the design of future models.
The proposed AA-LSTM model can manage real-time energy for smart EV charging infrastructure. By estimating short-term demand with high accuracy, operators can implement demand-side management strategies such as reduction in energy cost, load balancing and peak hours. The simulation results reflect that our model can guide charging decisions in fixed fleet and open network settings.
4.9 Comparative Performance Analysis
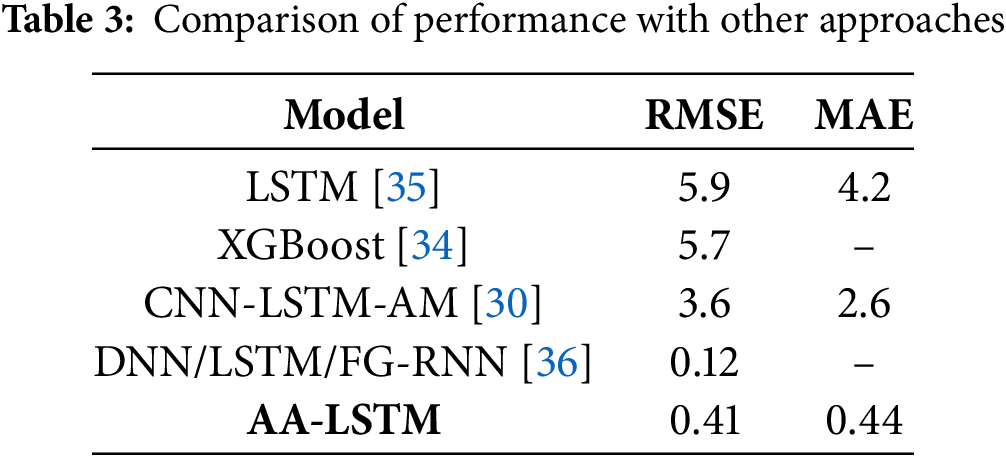
In Table 3, the comparative performance of the proposed AA-LSTM model is compared against state-of-the-art models. Deep learning models that are state-of-the-art employ different machine learning and deep learning architectures or hybrid architectures. These models have shown an excellent performance on the unseen datasets. LSTM [35] and LSTM-CNN hybrid have shown very good RMSEs of 5.9 and 3.6, respectively. Similarly, an XGBoost model exhibited a performance score in terms of RMSE of 5.7. Although these models have shown good performance, they are still not on par with state-of-the-art ones. Our approach has beaten the performance of these models in terms of RMSE and MAE. The proposed AA-LSTM model has shown an RMSE of 0.41 and MAE of 0.44, which is much less than the other models. However, the performance of our model is less than the DNN/LSTM model in terms of RMSE.
This paper presents a novel Attention-Augmented Long Short-Term Memory (AA-LSTM) model designed to focus on the most relevant time steps, thereby improving its ability to capture long-term dependencies and enhance prediction accuracy. By integrating the strengths of LSTM networks in processing sequential data with the interpretability and efficiency of the attention mechanism, the AA-LSTM model demonstrates superior performance. Furthermore, the model achieves results comparable to state-of-the-art approaches, establishing its potential as a highly effective solution for predicting energy demand at EV charging stations (EVCS). The findings highlight the model’s ability to deliver improved accuracy and computational efficiency over traditional methods. While the proposed AA-LSTM model shows a remarkable performance on clean data. However, its robustness is not evaluated on noisy input, missing data, or other perturbations present in the real-world data. In the future, we will focus on conducting sensitivity analyses of the stability and robustness of the AA-LSTM model in the presence of noisy, uncertain, or incomplete data, which is common in real-time energy monitoring systems. In addition to this, there are several research directions for future exploration of the model. The first research direction is to incorporate attention explainability tools to offer an in-depth analysis of the importance of features for the prediction process and enhance the transparency of the model. Second is incorporating the proposed model within smart grid infrastructure and IoT environments that can provide real-time, decentralized predictions for adaptive energy management. Lastly, the model can be tested for generalizability across several real-world scenarios, such as predicting traffic flow and forecasting water consumption, to assess the broader applicability and robustness of the model. Addressing these areas will strengthen the model’s applicability and contribute to the growing demands of explainable AI in real-world environments. In future, we also plan to evaluate the AA-LSTM model on more complex and diverse datasets to test its robustness and scalability further. Additionally, efforts will be directed towards optimizing the model to reduce its computational requirements and improve its applicability to real-world scenarios.
Acknowledgement: The authors extend their appreciation to the Deanship of Scientific Research at Zarqa University, Zarqa, Jordan, for funding this research work.
Funding Statement: This work is supported by the SC & SS, Jawaharlal Nehru University, New Delhi, India.
Author Contributions: Conceptualization, Harendra Pratap Singh; Formal Analysis, Ishfaq Hussain Rather; Investigation, Sushil Kumar; Methodology, Harendra Pratap Singh, Ishfaq Hussain Rather; Supervision, Sushil Kumar, Omprakash Kaiwartya; Validation, Harendra Pratap Singh, Ishfaq Hussain Rather; Writing, Harendra Pratap Singh; Review & Editing, Sushil Kumar, Mohammad Aljaidi, Omprakash Kaiwartya. All authors reviewed the results and approved the final version of the manuscript.
Availability of Data and Materials: Data openly available in a public repository. The data that support the findings of this study are openly available in ACN-Data at https://ev.caltech.edu/dataset (accessed on 01 June 2025).
Ethics Approval: Not applicable.
Conflicts of Interest: The authors declare no conflicts of interest to report regarding the present study.
References
1. Zheng X, Streimikiene D, Balezentis T, Mardani A, Cavallaro F, Liao H. A review of greenhouse gas emission profiles, dynamics, and climate change mitigation efforts across the key climate change players. J Clean Prod. 2019;234(5):1113–33. doi:10.1016/j.jclepro.2019.06.140. [Google Scholar] [CrossRef]
2. Outlook EV. Outlook 2021. [cited 2022 Jan 22]. Available from: https://www.iea.org/reports/global-ev-outlook-2021. [Google Scholar]
3. Aljaidi M, Aslam N, Kaiwartya O, Chen X, Sadiq AS, Kumar S, et al. QoE-based assignment of EVs to charging stations in metropolitan environments. IEEE Trans Intell Veh. 2024:1–16. doi:10.1109/TIV.2024.3412372. [Google Scholar] [CrossRef]
4. Hamdare S, Brown DJ, Cao Y, Aljaidi M, Kumar S, Alanazi R, et al. A novel charging management and security framework for the electric vehicle (EV) ecosystem. World Electr Veh J. 2024;15(9):392. doi:10.3390/wevj15090392. [Google Scholar] [CrossRef]
5. Lee ZJ, Li T, Low SH. ACN-data: analysis and applications of an open EV charging dataset. In: Proceedings of the Tenth ACM International Conference on Future Energy Systems; 2019 Jun 25–28; Phoenix, AZ, USA. p. 139–49. doi:10.1145/3307772.3328313. [Google Scholar] [CrossRef]
6. Amini MH, Kargarian A, Karabasoglu O. ARIMA-based decoupled time series forecasting of electric vehicle charging demand for stochastic power system operation. Electr Power Syst Res. 2016;140:378–90. doi:10.1016/j.epsr.2016.06.003. [Google Scholar] [CrossRef]
7. Buzna L, De Falco P, Khormali S, Proto D, Straka M. Electric vehicle load forecasting: a comparison between time series and machine learning approaches. In: 2019 1st International Conference on Energy Transition in the Mediterranean Area (SyNERGY MED); 2019 May 28–30; Cagliari, Italy. doi:10.1109/synergy-med.2019.8764110. [Google Scholar] [CrossRef]
8. Louie HM. Time-series modeling of aggregated electric vehicle charging station load. Electr Power Compon Syst. 2017;45(14):1498–511. doi:10.1080/15325008.2017.1336583. [Google Scholar] [CrossRef]
9. LeCun Y, Bengio Y, Hinton G. Deep learning. Nature. 2015;521(7553):436–44. doi:10.1038/nature14539. [Google Scholar] [PubMed] [CrossRef]
10. Kumar KN, Cheah PH, Sivaneasan B, So PL, Wang DZW. Electric vehicle charging profile prediction for efficient energy management in buildings. In: 2012 10th International Power & Energy Conference (IPEC); 2012 Dec 12–14; Ho Chi Minh City, Vietnam. p. 480–5. doi:10.1109/ASSCC.2012.6523315. [Google Scholar] [CrossRef]
11. Jahangir H, Tayarani H, Ahmadian A, Golkar MA, Miret J, Tayarani M, et al. Charging demand of plug-in electric vehicles: forecasting travel behavior based on a novel rough artificial neural network approach. J Clean Prod. 2019;229:1029–44. doi:10.1016/j.jclepro.2019.04.345. [Google Scholar] [CrossRef]
12. Salihi JT. Energy requirements for electric cars and their impact on electric power generation and distribution systems. IEEE Trans Ind Appl. 1973;IA-9(5):516–32. doi:10.1109/TIA.1973.349925. [Google Scholar] [CrossRef]
13. Rahman S, Shrestha GB. An investigation into the impact of electric vehicle load on the electric utility distribution system. IEEE Trans Power Deliv. 1993;8(2):591–7. doi:10.1109/61.216865. [Google Scholar] [CrossRef]
14. Jui JJ, Ahmad MA, Imran Molla MM, Rashid MIM. Optimal energy management strategies for hybrid electric vehicles: a recent survey of machine learning approaches. J Eng Res. 2024;12(3):454–67. doi:10.1016/j.jer.2024.01.016. [Google Scholar] [CrossRef]
15. Orzechowski A, Lugosch L, Shu H, Yang R, Li W, Meyer BH. A data-driven framework for medium-term electric vehicle charging demand forecasting. Energy AI. 2023;14(12):100267. doi:10.1016/j.egyai.2023.100267. [Google Scholar] [CrossRef]
16. Hochreiter S, Schmidhuber J. Long short-term memory. Neural Comput. 1997;9(8):1735–80. doi:10.1162/neco.1997.9.8.1735. [Google Scholar] [PubMed] [CrossRef]
17. Chang M, Bae S, Cha G, Yoo J. Aggregated electric vehicle fast-charging power demand analysis and forecast based on LSTM neural network. Sustainability. 2021;13(24):13783. doi:10.3390/su132413783. [Google Scholar] [CrossRef]
18. Marino DL, Amarasinghe K, Manic M. Building energy load forecasting using deep neural networks. In: IECON 2016—42nd Annual Conference of the IEEE Industrial Electronics Society; 2016 Oct 23–26; Florence, Italy. p. 7046–51. doi:10.1109/IECON.2016.7793413. [Google Scholar] [CrossRef]
19. Kong W, Dong ZY, Jia Y, Hill DJ, Xu Y, Zhang Y. Short-term residential load forecasting based on LSTM recurrent neural network. IEEE Trans Smart Grid. 2019;10(1):841–51. doi:10.1109/TSG.2017.2753802. [Google Scholar] [CrossRef]
20. Lu F, Lv J, Zhang Y, Liu H, Zheng S, Li Y, et al. Ultra-short-term prediction of EV aggregator’s demond response flexibility using ARIMA, Gaussian-ARIMA, LSTM and Gaussian-LSTM. In: 2021 3rd International Academic Exchange Conference on Science and Technology Innovation (IAECST); 2021 Dec 10–12; Guangzhou, China. p. 1775–81. doi:10.1109/IAECST54258.2021.9695933. [Google Scholar] [CrossRef]
21. Ahmed S, Nielsen IE, Tripathi A, Siddiqui S, Ramachandran RP, Rasool G. Transformers in time-series analysis: a tutorial. Circuits Syst Signal Process. 2023;42(12):7433–66. doi:10.1007/s00034-023-02454-8. [Google Scholar] [CrossRef]
22. Gomez JC, Morcos MM. Impact of EV battery chargers on the power quality of distribution systems. IEEE Trans Power Deliv. 2003;18(3):975–81. doi:10.1109/TPWRD.2003.813873. [Google Scholar] [CrossRef]
23. Orr JA, Emanuel AE, Oberg KW. Current harmonics generated by a cluster of electric vehicle battery chargers. IEEE Trans Power Apparatus Syst. 1982;PAS-101(3):691–700. doi:10.1109/TPAS.1982.317284. [Google Scholar] [CrossRef]
24. Qian K, Zhou C, Allan M, Yuan Y. Modeling of load demand due to EV battery charging in distribution systems. IEEE Trans Power Syst. 2011;26(2):802–10. doi:10.1109/TPWRS.2010.2057456. [Google Scholar] [CrossRef]
25. Deepa KR, Thillaiarasu N. Integrated architecture for smart grid energy management: deep attention-enhanced sequence-to-sequence model with energy-aware optimized reinforcement learning for demand response. SN Comput Sci. 2024;5(8):1017. doi:10.1007/s42979-024-03305-2. [Google Scholar] [CrossRef]
26. Sharif M, Seker H. Smart EV charging with context-awareness: enhancing resource utilization via deep reinforcement learning. IEEE Access. 2024;12:7009–27. doi:10.1109/access.2024.3351360. [Google Scholar] [CrossRef]
27. Zhang Y, Guo Z, Jiao F, Zhang X, Lu N, Zhou Y. Dynamic energy-aware EV charging navigation in interacting transportation and distribution networks. IEEE Trans Intell Transp Syst. 2025;26(4):4908–22. doi:10.1109/TITS.2025.3526367. [Google Scholar] [CrossRef]
28. Feng Z, Zhang J, Jiang H, Yao X, Qian Y, Zhang H. Energy consumption prediction strategy for electric vehicle based on LSTM-transformer framework. Energy. 2024;302(30):131780. doi:10.1016/j.energy.2024.131780. [Google Scholar] [CrossRef]
29. Fahim SR, Atat R, Kececi C, Takiddin A, Ismail M, Davis KR, et al. Forecasting EV charging demand: a graph convolutional neural network-based approach. In: 2024 4th International Conference on Smart Grid and Renewable Energy (SGRE); 2024 Jan 8–10; Doha, Qatar. doi:10.1109/SGRE59715.2024.10428726. [Google Scholar] [CrossRef]
30. Ran J, Gong Y, Hu Y, Cai J. EV load forecasting using a refined CNN-LSTM-AM. Electr Power Syst Res. 2025;238(1):111091. doi:10.1016/j.epsr.2024.111091. [Google Scholar] [CrossRef]
31. Graves A. Long short-term memory. In: Supervised sequence labelling with recurrent neural networks. Berlin/Heidelberg, Germany: Springer; 2012. p. 37–45. doi:10.1007/978-3-642-24797-2_4. [Google Scholar] [CrossRef]
32. Pascanu R, Mikolov T, Bengio Y. On the difficulty of training recurrent neural networks. Proc Mach Learn Res. 2013;28(3):1310–8. [Google Scholar]
33. Duan C, Chen K, Wang R, Utiyama M, Sumita E, Zhu C, et al. Modeling future cost for neural machine translation. IEEE/ACM Trans Audio Speech Lang Process. 2021;29:770–81. doi:10.1109/taslp.2020.3042006. [Google Scholar] [CrossRef]
34. Rather IH, Minz S, Kumar S. Hybrid texture-based feature extraction model for brain tumour classification using machine learning. In: Emerging technologies in data mining and information security. Singapore: Springer Nature; 2022. p. 445–55. doi:10.1007/978-981-19-4676-9_38. [Google Scholar] [CrossRef]
35. Vishnu G, Kaliyaperumal D, Pati PB, Karthick A, Subbanna N, Ghosh A. Short-term forecasting of electric vehicle load using time series, machine learning, and deep learning techniques. World Electr Veh J. 2023;14(9):266. doi:10.3390/wevj14090266. [Google Scholar] [CrossRef]
36. Rathore H, Meena HK, Jain P. Prediction of EV energy consumption using random forest and XGBoost. In: 2023 International Conference on Power Electronics and Energy (ICPEE); 2023 Jan 3–5; Bhubaneswar, India. doi:10.1109/ICPEE54198.2023.10060798. [Google Scholar] [CrossRef]
Cite This Article
 Copyright © 2025 The Author(s). Published by Tech Science Press.
This work is licensed under a Creative Commons Attribution 4.0 International License , which permits unrestricted use, distribution, and reproduction in any medium, provided the original work is properly cited.
 Downloads
 Citation Tools