
 Submit a Paper
 Propose a Special lssue
 Open Access
ARTICLE

Comparative Analysis of Deep Learning Models for Banana Plant Detection in UAV RGB and Grayscale Imagery
1 Department of Civil Engineering, Republic of China Military Academy, Kaohsiung, 830, Taiwan
2 Department of Marine Science, Republic of China Naval Academy, Kaohsiung, 813, Taiwan
3 Department of Civil Engineering, National Kaohsiung University of Science and Technology, Kaohsiung, 807, Taiwan
* Corresponding Author: Ching-Lung Fan. Email:
Computers, Materials & Continua 2025, 84(3), 4627-4653. https://doi.org/10.32604/cmc.2025.066856
Received 18 April 2025; Accepted 03 July 2025; Issue published 30 July 2025
 View Full Text
 Download PDF
Abstract
Efficient banana crop detection is crucial for precision agriculture; however, traditional remote sensing methods often lack the spatial resolution required for accurate identification. This study utilizes low-altitude Unmanned Aerial Vehicle (UAV) images and deep learning-based object detection models to enhance banana plant detection. A comparative analysis of Faster Region-Based Convolutional Neural Network (Faster R-CNN), You Only Look Once Version 3 (YOLOv3), Retina Network (RetinaNet), and Single Shot MultiBox Detector (SSD) was conducted to evaluate their effectiveness. Results show that RetinaNet achieved the highest detection accuracy, with a precision of 96.67%, a recall of 71.67%, and an F1 score of 81.33%. The study further highlights the impact of scale variation, occlusion, and vegetation density on detection performance. Unlike previous studies, this research systematically evaluates multi-scale object detection models for banana plant identification, offering insights into the advantages of UAV-based deep learning applications in agriculture. In addition, this study compares five evaluation metrics across the four detection models using both RGB and grayscale images. Specifically, RetinaNet exhibited the best overall performance with grayscale images, achieving the highest values across all five metrics. Compared to its performance with RGB images, these results represent a marked improvement, confirming the potential of grayscale preprocessing to enhance detection capability.Keywords
Remote sensing imagery can effectively provide relevant information regarding crops and their surroundings, facilitating the analysis of crop growth and health. In particular, satellite imagery enables the monitoring of the type, quantity, and productivity of crops. Recent studies have focused on precise crop classification with satellite remote sensing imagery [1–3]. Precision agriculture increasingly relies on high-resolution remote sensing to optimize farm management. Though widely used, traditional satellite imagery often lacks the spatial resolution needed to detect individual plants, particularly in complex agricultural environments with mixed cropping systems. Satellite images have low resolution, potentially compromising algorithm performance and resulting in errors in crop classification [4]. Moreover, satellite images cannot be used to detect small crops due to its low spatial resolution and susceptibility to atmospheric disturbance.
Compared with satellite platforms, Unmanned Aerial Vehicles (UAVs) enable real-time, low-altitude image acquisition unaffected by clouds and fog, thereby presenting unprecedented opportunities for agricultural applications. UAV imagery provides on-demand, high-resolution data, overcoming the limitations of satellite-based monitoring. Deep learning-based object detection has significantly improved crop monitoring, enabling the identification and classification of plants from aerial images. In recent years, the rapid advancement of artificial intelligence (AI) and machine vision, along with other related technologies, has spurred a demand for heightened intelligence capabilities in UAV [5]. UAVs are lightweight aerial vehicles equipped with observation sensors and can be operated through various ground-based control systems [6]. UAVs comprise three main systems: the aircraft, a payload system, and a ground control station. Without the payload system, the aircraft is a complete aerial vehicle system capable of flying, takeoff, and landing. The payload system encompasses various equipment such as cameras, observation sensors, light detection and ranging (LiDAR) [7], multispectral, hyperspectral, and thermal infrared sensors, tailored for specific missions. The ground control station, situated on the ground, receives real-time information transmitted by the UAV and its payload system, providing the operator with UAV-related information for operational purposes.
UAVs can comprehensively capture the morphological and physiological characteristics of crops, providing valuable support for crop planning, analysis, growth and health assessment, as well as agricultural monitoring and management. Small UAVs, in particular, serve as an economically practical solution for capturing high-quality images throughout the growth stages of crops with centimeter-level spatial resolution, unaffected by stringent weather conditions, facilitating more effective crop management or monitoring [8]. While UAVs inherently cover smaller areas per flight compared to satellites or manned aircraft, their unique flexibility enables multiple coordinated flights to achieve comprehensive coverage of localized study areas at a fraction of the operational cost of manned aircraft, which still lag behind UAVs in spatial resolution (typically 10–30 cm/pixel vs. 2–3 cm/pixel). Crucially, UAVs offer unparalleled advantages for precision agriculture: they operate below cloud cover to ensure weather-resilient data acquisition, execute on-demand flights timed to critical crop growth stages, and maintain cost-effectiveness—thereby overcoming inherent satellite limitations such as rigid revisit cycles and susceptibility to atmospheric interference. This combination of high resolution, adaptability, and operational efficiency makes UAVs uniquely suited for fine-grained agricultural monitoring. Therefore, high-resolution UAV imagery is extensively employed in precision agriculture tasks. For example, UAV multispectral images were used to calculate NDVI, creating crop vigor maps, while bivariate LISA cluster analysis revealed significant positive spatial autocorrelation between cover crops and vineyards [9]. UAV multispectral images were also utilized in deep learning for canopy delineation, linking NDVI and canopy area to agronomic data [10].
Deep learning has become a critical technology for processing UAV imagery in precision agriculture, providing robust solutions for tasks such as crop classification, yield estimation, growth stage monitoring, and disease detection. Unlike traditional machine learning, deep learning can automatically extract complex spatial and spectral features from high-resolution UAV images, capturing fine-scale variations in crop health and development [11]. For example, deep learning models like Convolutional Neural Networks (CNNs) and their advanced variants (e.g., Mask R-CNN, U-Net) have been widely used to identify and map different crop types, leveraging their ability to recognize intricate patterns in aerial imagery [10]. The deep learning models can process multispectral, hyperspectral, and thermal UAV data to distinguish between healthy and stressed plants, classify growth stages, or even detect specific diseases at the leaf or canopy level [12]. In recent studies, deep learning has been successfully applied to classify complex agricultural landscapes, improve weed detection, and enhance crop yield estimation by integrating UAV data with agronomic information [13]. Moreover, the combination of deep learning and UAVs enables real-time crop monitoring and automated decision-making, significantly improving agricultural productivity and sustainability. For instance, CNN-based models have been shown to outperform traditional vegetation indices in detecting early crop stress, while Transformer-based models are emerging as powerful tools for large-scale crop mapping [14]. This synergy between UAV imagery and deep learning not only reduces the need for manual field inspections but also provides more precise and timely insights into crop health, supporting precision farming practices at scale [15].
Banana orchards in Taiwan are often intercropped with tall betel nut to lessen typhoon damage. This practice creates dense, overlapping canopies whose leaves are nearly identical in colour, texture, and shape, leading to severe occlusion and background confusion in UAV images. Year-round cultivation introduces plants at multiple growth stages, resulting in a wide range of crown sizes and high intra-class diversity. Seedlings, in particular, are easily mistaken for surrounding weeds because of their small stature and morphological similarity. These factors together undermine the accuracy of crop-detection algorithms. Although deep learning is widely adopted in agricultural monitoring, few studies have systematically compared object detection models for bananas within mixed banana–betel nut systems. This highlights the need for a comprehensive and comparative assessment of detection methods that can handle scale variation and occlusion in real-world scenarios.
The integration of deep learning with UAV imagery can further facilitate the extraction of contextual or semantic information, proving feasible for image classification problems and for detecting banana growth stages and mixed-cultivation crops with high accuracy. UAVs equipped with cameras have emerged as effective tools for rapidly surveying large agricultural areas and capturing high-resolution imagery. These images can be analyzed using deep learning-based object detection methods to automatically identify and count individual banana plants, offering significant labor and time savings. Although recent advancements in CNNs have produced powerful object detection models, their applicability to domain-specific scenarios such as banana plant detection, especially under conditions of scale variation, occlusion, and dense canopy, has not been systematically studied. The objective of this study is to evaluate and compare the performance of four widely adopted object detection models—Faster R-CNN, YOLOv3, RetinaNet, and SSD—in detecting banana plants under real-world UAV imagery conditions. This comparison is highly relevant because banana plants, depending on the UAV’s altitude, camera angle, and growth stage, exhibit significant variation in their apparent size, shape, and visibility. Such multi-scale and occluded appearances pose substantial challenges to current detectors, directly impacting the reliability of UAV-based monitoring systems. While prior research has applied individual models to banana detection tasks [16], a research gap remains in conducting a structured, side-by-side evaluation of detection algorithms under consistent environmental and data conditions. This study addresses the existing gap by systematically evaluating the strengths and limitations of each model in handling scale variation under varying levels of spatial complexity, factors that are critical for practical deployment in agricultural environments. The selected models represent diverse architectural paradigms: Faster R-CNN (a two-stage detector known for high accuracy), YOLOv3 and SSD (single-stage detectors optimized for real-time performance), and RetinaNet (a single-stage model with enhanced capability for small-object detection). Furthermore, considering the practical constraints of UAV-based operations in real-world agricultural fields, such as limited onboard computational resources and the need for near real-time inference, these models offer a practical balance between detection accuracy and computational efficiency. Ultimately, this study aims to provide actionable insights into model selection for UAV-based banana crop monitoring, with broader implications for applications in precision agriculture.
This study aims to fill that gap by comprehensively evaluating CNN-based object detection models on a new dataset of low-altitude UAV images of banana plantations. We focus on standard RGB imagery captured from a UAV flying at low altitude, where banana plants are visible in varying sizes. The novelty of this work lies in assessing multiple detection algorithms under consistent conditions to identify their strengths and weaknesses for banana crop monitoring. This is a comparative study of deep learning models for multi-scale banana plant detection in UAV imagery. Its main contributions are:
• First systematic comparison of CNN-based object detection models for banana crop detection using UAV imagery in an intercropped environment, analyzing their performance in terms of detection accuracy, scalability, and computational efficiency.
• Evaluation of multi-scale detection challenges, particularly assessing how different models perform when detecting banana crops at different growth stages, from small seedlings to fully mature plants.
• Assessment of occlusion effects and mixed cropping environments, focusing on detecting banana plants in zones where they are interspersed with betel nut trees, leading to complex canopy overlaps.
• Analysis of UAV imaging advantages over satellite-based remote sensing, explaining why UAV imagery is essential for detecting individual banana plants and overcoming the resolution limitations of satellite platforms.
The remainder of this paper is organized as follows: Section 2 (Related Work) provides a literature review on deep learning techniques for crop detection. Section 3 (Materials and Methods) details the UAV data acquisition process, dataset preparation, and model implementation. Section 4 (Results and Discussion) presents the experimental findings, analyzes the performance of four deep learning models across Zones A, B, and C, and interprets the results with respect to three banana canopy levels. Finally, Section 5 (Conclusions) summarizes the study’s main contributions and suggests potential directions for future research.
There are many pixels with the same luminance but significantly different chrominance in a color image [17]. Hence, high-quality and abundant image data are crucial for developing and evaluating deep learning’s detection performance. UAVs are low-cost and highly flexible tools that can effectively capture images of the various growth stages of crops and can be utilized to realize deep learning–based crop detection. Low-altitude UAVs yield high-spatial-resolution images with high classification and detection accuracy [18].
In recent years, the integration of deep learning into UAV remote sensing has yielded efficient methods for crop detection and crop health assessment. For example, Yang et al. [19] proposed a deep CNN architecture for low-altitude UAV imagery to estimate rice yield. Chen et al. [20] utilized UAVs and Faster R-CNN to detect and count mature and immature strawberries. Feng et al. [21] employed a pre-trained deep learning model (Resnet18) to estimate cotton stand count and canopy size using the data in each UAV image. Maimaitijiang et al. [22] assessed the capability of UAV-based multimodal data fusion to estimate soybean yield using deep neural networks.
Computer vision–based precision agriculture tasks typically involve detecting objects of interest (e.g., crops, weeds, and fruits) and distinguishing them from their surroundings [23]. Object detection algorithms in deep learning frameworks have rapidly emerged as a method for processing images captured by UAVs [24]. Therefore, incorporating UAV imagery for object detection in computer vision applications may facilitate the automation of crop detection. For example, Neupane et al. [25] employed a Faster R-CNN based on Inception-V2 to detect and count banana plants in high-resolution UAV RGB images, achieving excellent detection performance (F1 score) ranging from 85.67% to 97.82% at different altitudes. Santos et al. [26] employed three object detection algorithms (RetinaNet, YOLOv3, and Faster R-CNN) to detect individual trees in high-resolution RGB images captured by UAVs and evaluated their detection performance. He et al. [27] used the YOLOv4 algorithm to detect wheat spikes in densely populated areas in UAV aerial images, achieving an F1 score and average precision (AP) of 96.71% and 77.81%, respectively. Osco et al. [28] proposed another CNN-based approach (Faster R-CNN and RetinaNet) to identify and estimate the quantity of citrus trees in dense fields from multispectral UAV imagery. Tian et al. [29] compared YOLOv3 against Faster R-CNN in detecting apples at different growth stages in orchards.
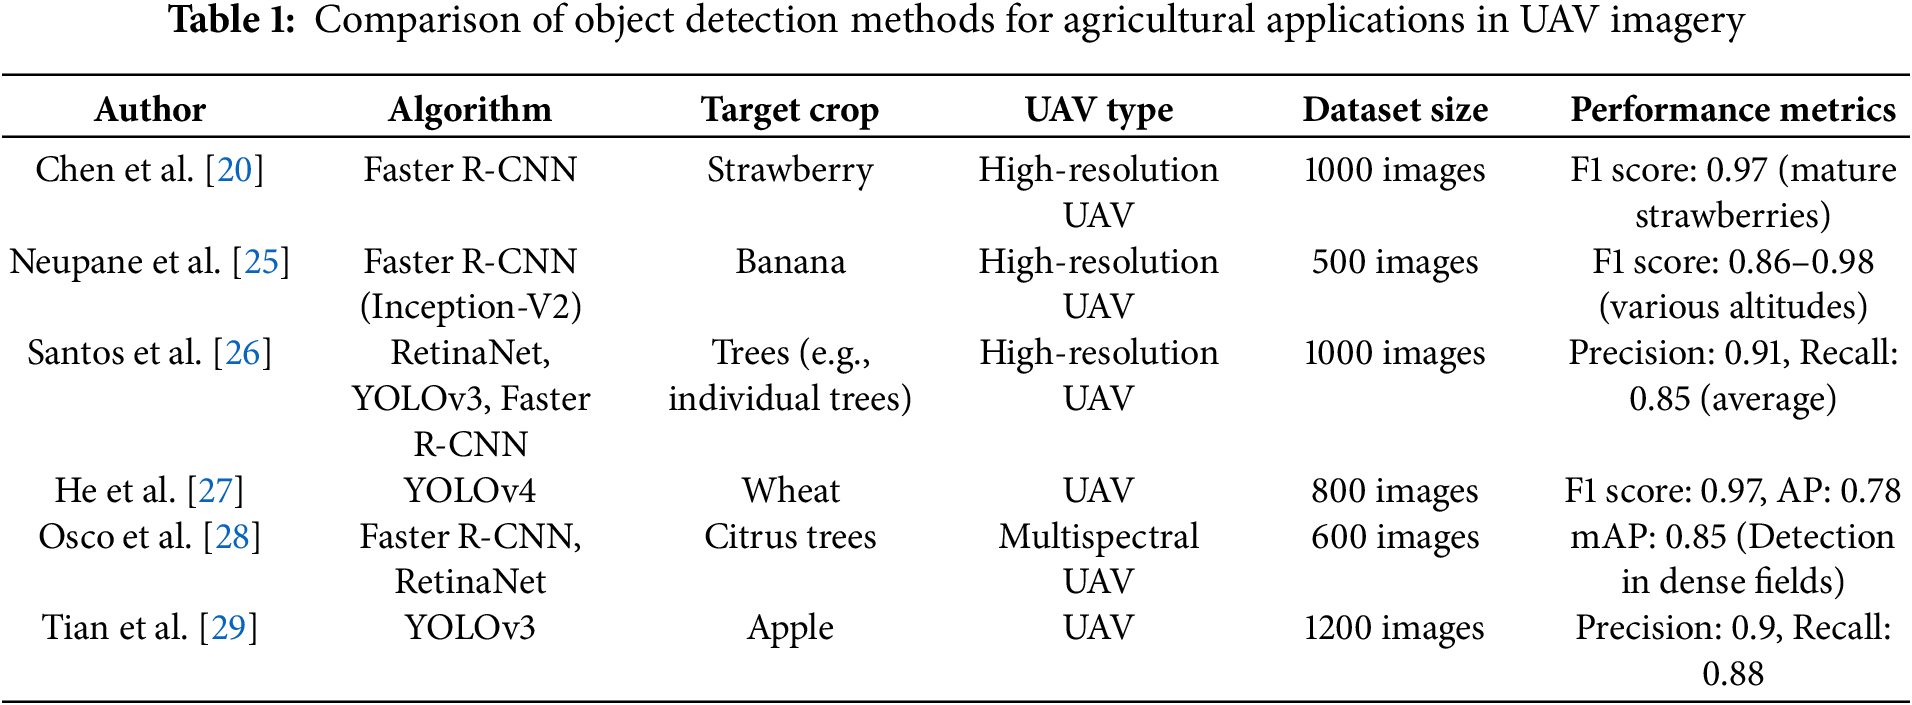
Table 1 provides a comprehensive comparison of object detection methods used in UAV imagery for agricultural applications. It highlights various detection algorithms, target crops, UAV types, dataset sizes, and performance metrics from different studies, offering valuable insights into crop detection. These studies employ deep learning methods to identify a wide range of crops, including bananas, strawberries, trees, wheat, citrus, and apples. The evaluations utilize different types of UAV imagery, including high-resolution RGB and multispectral images, each providing unique advantages depending on the target crop and detection requirements. Multispectral images, in particular, capture data beyond the visible spectrum, including near-infrared (NIR) light, which can be especially useful for assessing plant health, monitoring stress, and distinguishing between different crop types. In terms of model performance, Faster R-CNN has demonstrated strong stability across various crops and environmental conditions. For instance, Chen et al. [20] achieved an F1 score of 0.97 in detecting mature strawberries using high-resolution UAV images, while Neupane et al. [25] reported F1 scores ranging from 0.86 to 0.98 for banana detection across different altitudes, highlighting the model’s robustness in diverse flight conditions. Similarly, Osco et al. [28] achieved a mean Average Precision (mAP) of 0.85 for detecting citrus trees in dense field settings using multispectral UAV data, demonstrating the model’s effectiveness in complex agricultural environments.
Accurate crop detection relies heavily on the detailed features of the objects, making high-resolution images essential for capturing fine-grained characteristics. The dimensions and shape of banana leaves differ between growth stages, necessitating high-spatial-resolution images for accurate recognition. Specifically, distinguishing between different growth stages and environmental conditions requires the highest possible image quality. With their ability to capture high-resolution imagery at low altitudes, UAVs are well-suited for this task, as they enable detailed, real-time monitoring of crop conditions.
The main processes of this study include UAV data collection, image preprocessing and orthomosaic generation, dataset annotation, dataset splitting, deep learning model training, object detection, model evaluation, and banana crop health monitoring (Fig. 1).

Figure 1: Workflow of the study’s main processes
3.1 Image Processing in the Study Area
The study area is situated in Pingtung, Taiwan, with latitude ranging from 22°38′12.2′′N to 22°38′11.8′′N and longitude from 120°33′14.5′′E to 120°33′20.3′′E. Banana and betel nut are the primary crops in this region. The UAV conducted aerial operations under clear sky conditions on 16 July 2024, from 14:30 to 14:50 local time. UAV mapping involved meticulously designed low-altitude flight missions and utilized Structure from Motion technology to generate RGB band orthomosaics of the flight area [30]. In this study, a DJI-FC3411 UAV was flown at an altitude of 132 m above ground level, with a flight speed of 10 km/h, a front overlap of 85%, and a side overlap of 80%. These overlap percentages were selected based on best practices in UAV photogrammetry to ensure high-quality image stitching and orthomosaic generation. To ensure accurate spatial referencing of UAV imagery, this study utilized GPS-based geotagging and performed photogrammetric processing using DroneDeploy’s proprietary cloud-based engine. Although no external Ground Control Points (GCPs) were manually deployed, the system relied on high-resolution UAV metadata and internal camera calibration parameters for geolocation. The root mean square error (RMSE) of the camera GPS location was approximately 0.59 m (X-axis), 0.69 m (Y-axis), and 0.32 m (Z-axis), resulting in an overall planimetric RMSE of 0.55 m. The image alignment rate was 99%, and camera optimization showed only a 0.02% deviation from reference intrinsics, indicating stable calibration. The ground sampling distance (GSD) of the orthomosaic was approximately 1.73 cm/pixel, and the point cloud achieved a density of 738 points/m2. Given these metrics, the spatial accuracy was sufficient for the object detection tasks in this study, including the identification of individual banana plants and small seedlings.
In the aerial mission, 470 images were captured, each with dimensions of 5472 × 3648 pixels. In aerial photogrammetry, the first step in processing UAV images is the mosaic stitching of overlapping images. DroneDeploy was used to make geometric and radiometric adjustments. The pixels with a common perspective were extracted from the images to generate a 3D point cloud and orthomosaic. A series of quality control and validation measures was implemented to ensure the accuracy of the orthomosaic generated by DroneDeploy. These measures, including relative distance validation, overlap assessment, seam line inspections, and DSM cross-validation, ensured that the orthomosaic was highly accurate and reliable. The final orthomosaic maintained a spatial accuracy within ±5 cm, making it suitable for high-resolution object detection tasks. These validation steps were designed to verify both spatial accuracy and geometric consistency, ensuring that the UAV-derived imagery provided a reliable basis for detecting banana crops.
The banana crop dataset used in this study was created using 470 high-resolution UAV images, each with manually annotated bounding boxes of banana plants captured at various growth stages and under diverse environmental conditions. To ensure the quality and reliability of the training dataset, this study utilized the Imagery—Label Object for Deep Learning tool in ArcGIS Pro to annotate UAV imagery manually. The annotation workflow consisted of the following three steps: (1) Image Cropping: The original UAV images were first cropped to focus on regions of interest, including banana seedlings, mature banana plants, and intercropping scenes of bananas and betel nut trees. Cropping helped eliminate irrelevant background information, allowing the model to learn banana-specific features more effectively. (2) Image Resizing: To maintain consistency in input dimensions, all cropped images were resized to a fixed size of 64 × 64 pixels for banana seedlings, and 128 × 128 pixels for mature banana plants and banana–betel nut intercropping. This preprocessing step ensured uniform input for both training and inference stages, thereby enhancing computational efficiency and training stability. (3) Image Annotation: All banana plants were manually delineated with tight bounding boxes and assigned a single class label—“banana,” irrespective of growth stage. This unified scheme streamlines the training pipeline and alleviates class imbalance arising from the limited number of samples at specific growth stages and canopy conditions, such as banana seedlings, mature banana plants, and bananas intercropped with betel nut trees (Fig. 2). However, the trade-off is reduced phenological granularity: stage variability is only implicitly encoded, rather than explicitly represented by subclasses. While this choice enhances detection robustness across heterogeneous field scenes, it restricts quantitative analysis of canopy development. The present annotations intentionally retain intra-class diversity, yet future work targeting phenological monitoring would benefit from stage-specific labels.
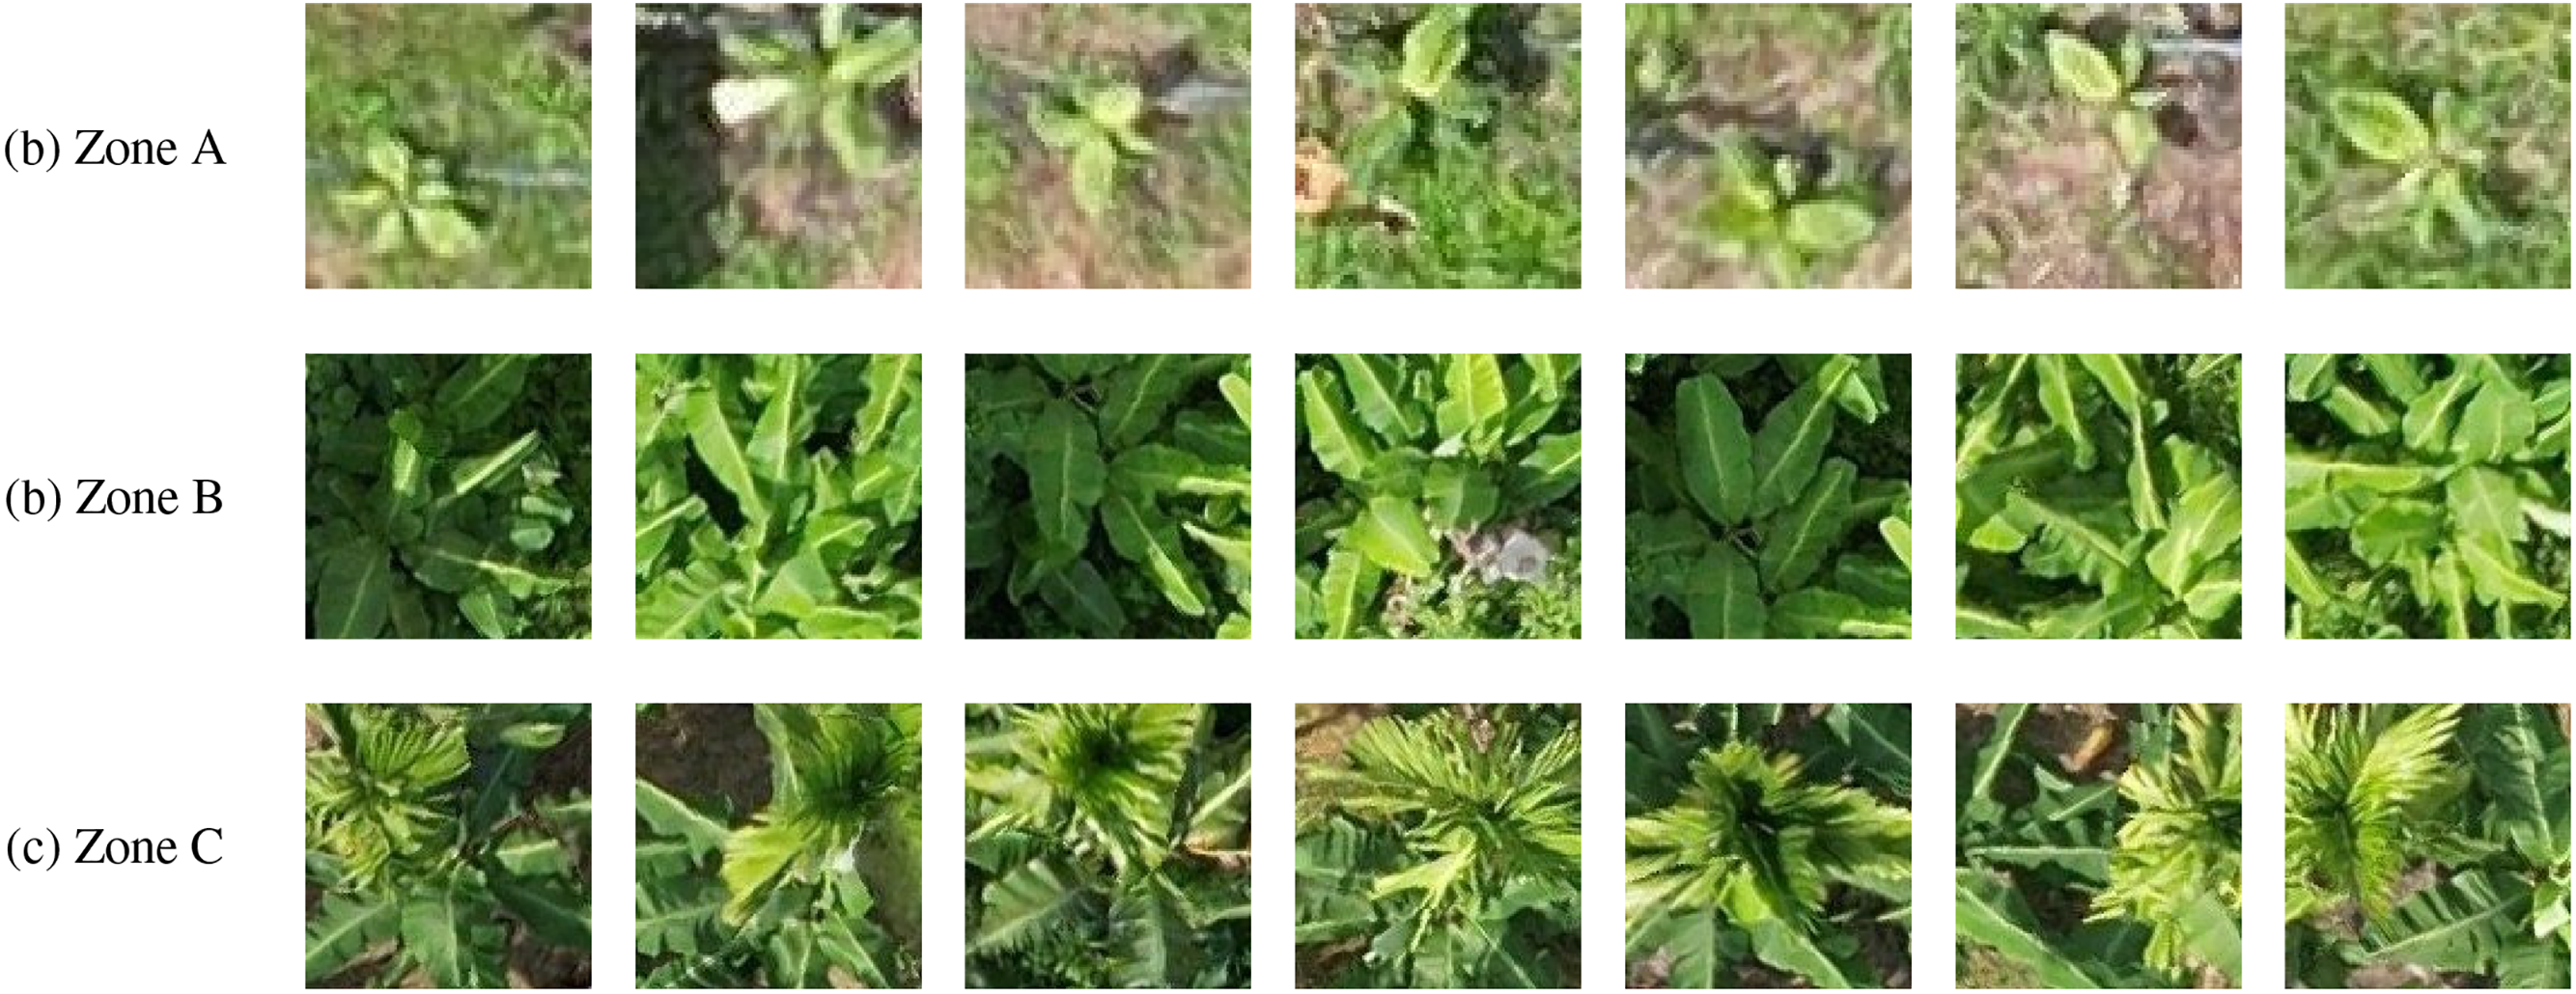
Figure 2: The dataset in this study consists of: (a) banana seedlings, (b) mature banana plants, and (c) banana and betel nut mix
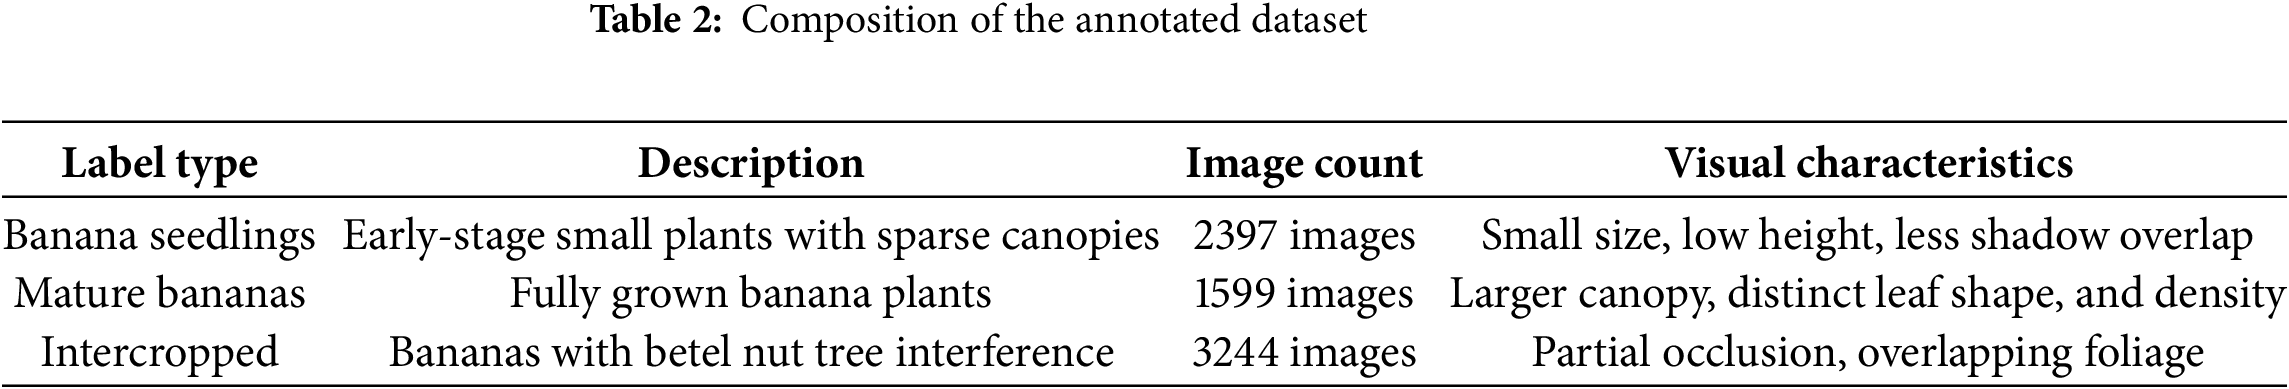
To prepare the dataset for model training and evaluation, all annotated banana images were divided into three subsets: training set (80%), validation set (10%), and test set (10%). The division was performed using a random sampling strategy to ensure that each subset contained a representative mix of banana instances across different growth stages, lighting conditions, and canopy densities. To reduce potential sampling bias, the random splitting process was repeated several times, and the configuration with the most even distribution of object counts across subsets was selected. Specifically, the training set comprised 5792 objects, the validation set contained 724 objects, and the test set consisted of 724 objects, ensuring proportionality with the total of 7240 annotated instances (Table 2). This sampling strategy was designed to maximize the diversity within each subset while preserving consistency in object distribution, thereby supporting robust model training and fair performance evaluation.
Regarding the potential risk of overfitting due to the relatively small size of the validation and test sets—a common concern when applying CNNs to moderately sized datasets—we implemented several strategies to mitigate this issue. During model training, early stopping was applied based on validation loss: training was terminated if the validation loss did not improve over 15 consecutive epochs, effectively preventing the model from overfitting to the training data. In addition, a series of data augmentation techniques—including random flipping, rotation, scaling, and brightness adjustment—were applied to the training set to increase data diversity and enhance the model’s generalization capability.
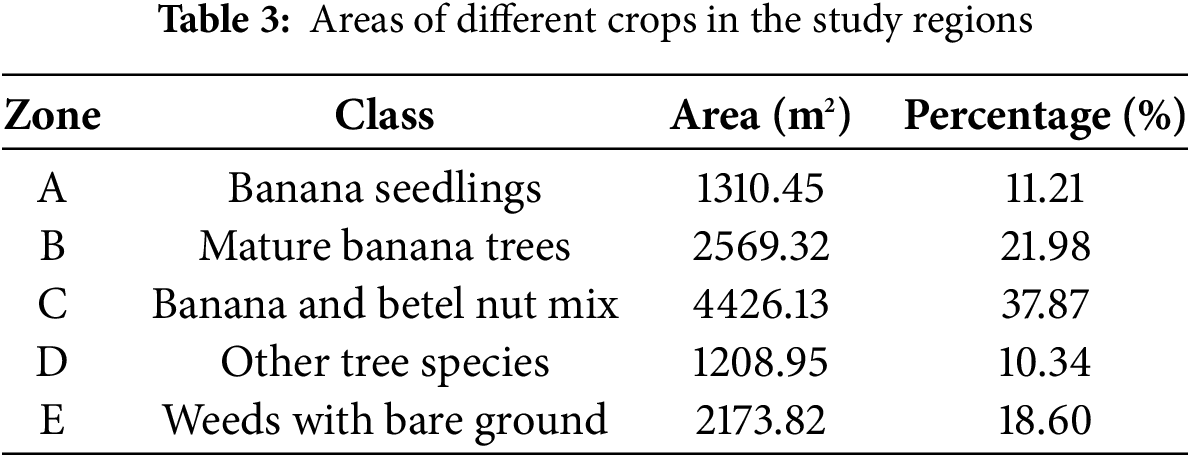
The orthomosaic image was segmented into five zones: banana seedlings (Zone A), mature banana trees (Zone B), banana and betel nut mix (Zone C), other tree species (Zone D), and weeds with bare ground (Zone E) (Fig. 3). Santos et al. [26] highlighted several challenges in object detection; first, detecting smaller objects requires the extraction of more contextual semantic information; second, objects of the same category may exhibit scale variations; third, objects are often occluded by other objects or background obstacles. Thus, banana crops with different characteristics in regions A, B, and C were examined through deep learning–based object detection. Specifically, Zone A comprises banana seedlings (small objects) with a planting area of 1310.45 m2; Zone B encompasses mature banana plants (scale variations within the same category) covering an area of 2569.32 m2; and Zone C involves mixed cultivation of bananas and betel nuts, covering an area of 4426.13 m2 with occlusion (Table 3).
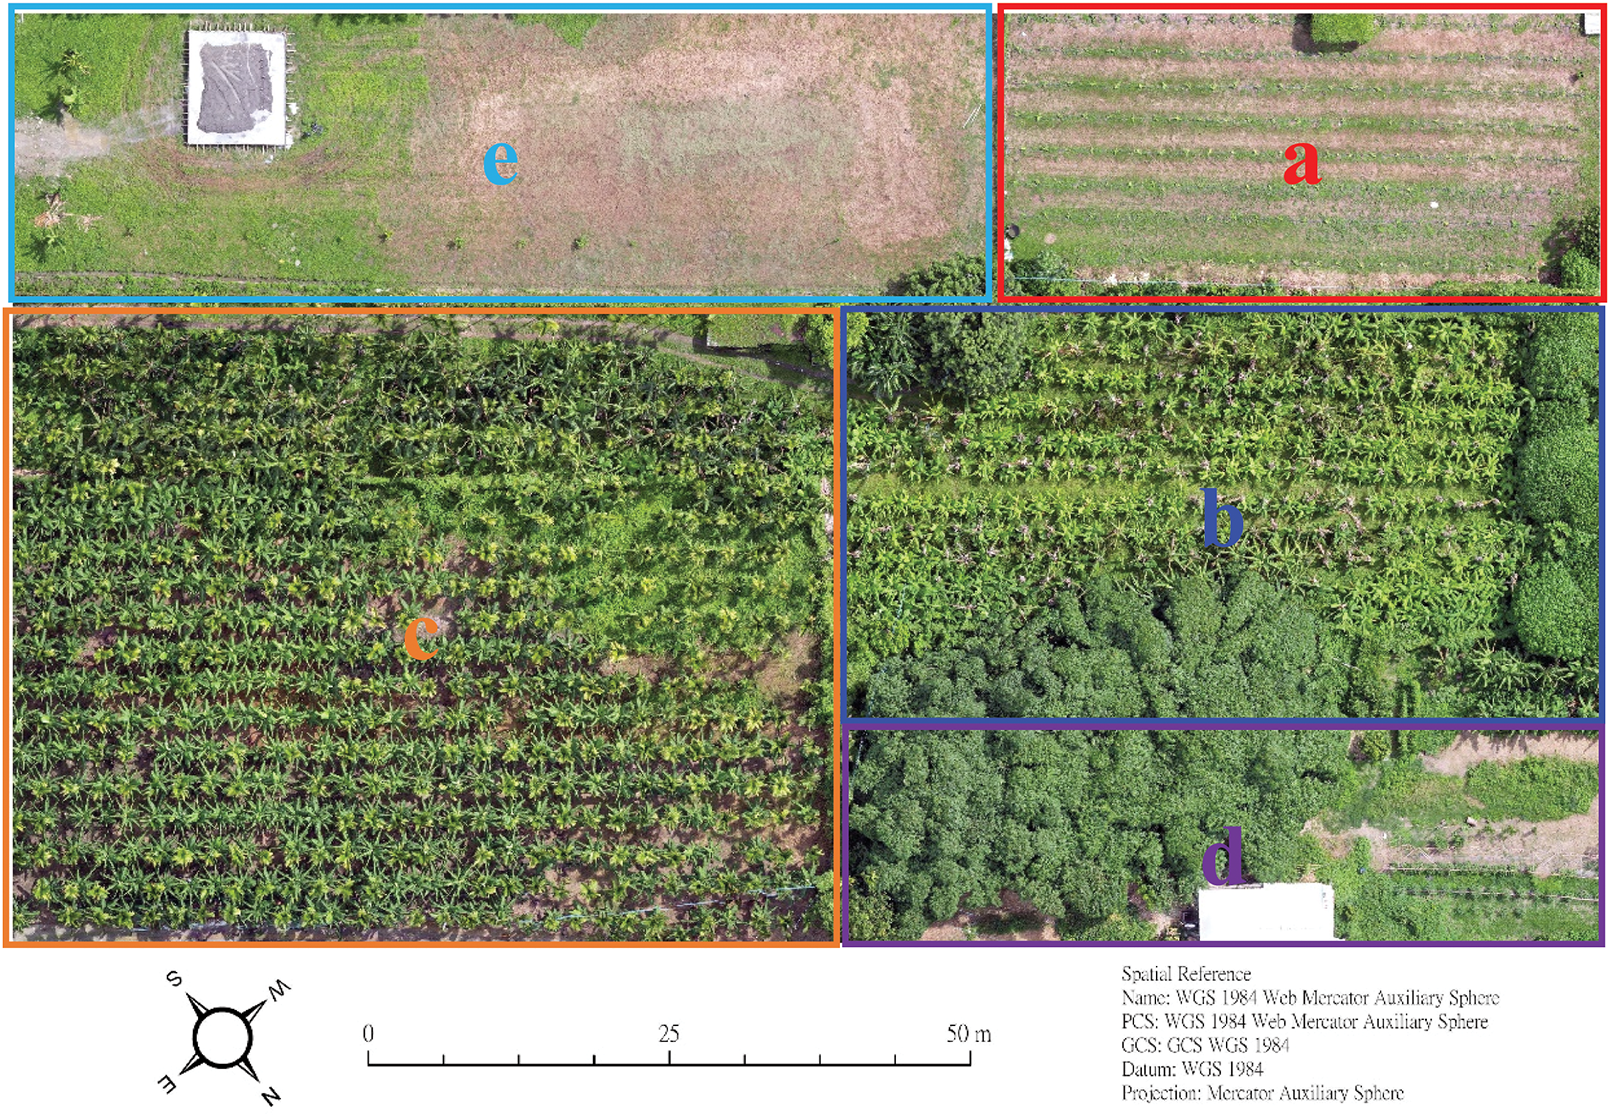
Figure 3: Orthomosaic of the study area showing banana seedlings (a), mature banana trees (b), intercropped banana and betel nut (c), other tree species (d), and weeds with bare ground (e)
Pingtung County is Taiwan’s largest banana-producing region, accounting for approximately 40% of the national cultivation area. This study selected a representative banana plantation intercropped with betel nut palms and defined three distinct zones to capture varying levels of complexity relevant for image-based detection: Zone A (newly planted banana seedlings), Zone B (maturing banana plants), and Zone C (bananas intercropped with taller betel nut trees). These zones were specifically chosen to evaluate object detection models under realistic agricultural scenarios, ranging from straightforward identification tasks with clearly visible seedlings to challenging cases involving complex canopy structures and intercropping conditions.
In recent years, deep learning has significantly advanced object detection in UAV-based agricultural monitoring, enabling precise and efficient analysis of high-resolution aerial imagery. Faster R-CNN employs a two-stage pipeline that combines a Region Proposal Network (RPN) with subsequent classification, achieving high accuracy at the expense of increased computational load and inference time [31]. Conversely, one-stage models such as YOLO, RetinaNet, and SSD perform direct predictions of bounding boxes and class probabilities in a single pass, substantially enhancing inference speed and suitability for real-time UAV applications. YOLO excels in real-time tasks through multi-scale feature extraction, although its accuracy diminishes for very small or heavily occluded objects [32,33]. RetinaNet addresses class imbalance via Focal Loss and improves detection accuracy for smaller targets using Feature Pyramid Networks, but at increased computational complexity [34]. SSD leverages multi-scale feature maps and default anchor boxes for varying object sizes; however, the resolution of deeper layers limits its precision for extremely small objects [35].
In this study, Faster R-CNN, YOLOv3, RetinaNet, and SSD were selected for comparison based on their widespread use in object detection and their demonstrated effectiveness in agricultural applications. However, each of these models presents distinct advantages and limitations, which influenced their inclusion in this study. As a region-based convolutional network, Faster R-CNN offers high detection accuracy and precise localization, making it well-suited for complex agricultural scenes with dense foliage and overlapping crops. However, it suffers from high computational costs and longer inference times, which can be impractical for real-time UAV applications. Known for its speed and efficiency, YOLOv3 is a single-stage detector that simultaneously predicts object bounding boxes and class probabilities. It achieves real-time processing speeds but often sacrifices detection accuracy for smaller or partially occluded objects, which can be a challenge in dense crop fields. Newer versions, like YOLOv11, have improved accuracy but at the cost of increased model complexity and computational requirements, which may not always be feasible for real-time UAV applications in remote environments. RetinaNet addresses the class imbalance issue common in UAV crop datasets through its Focal Loss function, making it particularly effective in detecting smaller objects or rare crop types. Unlike two-stage detectors, it adopts a single-stage architecture, allowing it to perform both object classification and bounding box regression in a single forward pass. SSD accelerates inference by predicting class scores and bounding boxes on a pyramid of feature maps at multiple depths, which helps it cope with objects of different sizes. However, the progressively coarser resolution of the deeper feature maps—and the use of preset anchor boxes—reduces localisation precision for very small targets, limiting SSD’s effectiveness for early-stage crops or other fine-scale features in UAV images.
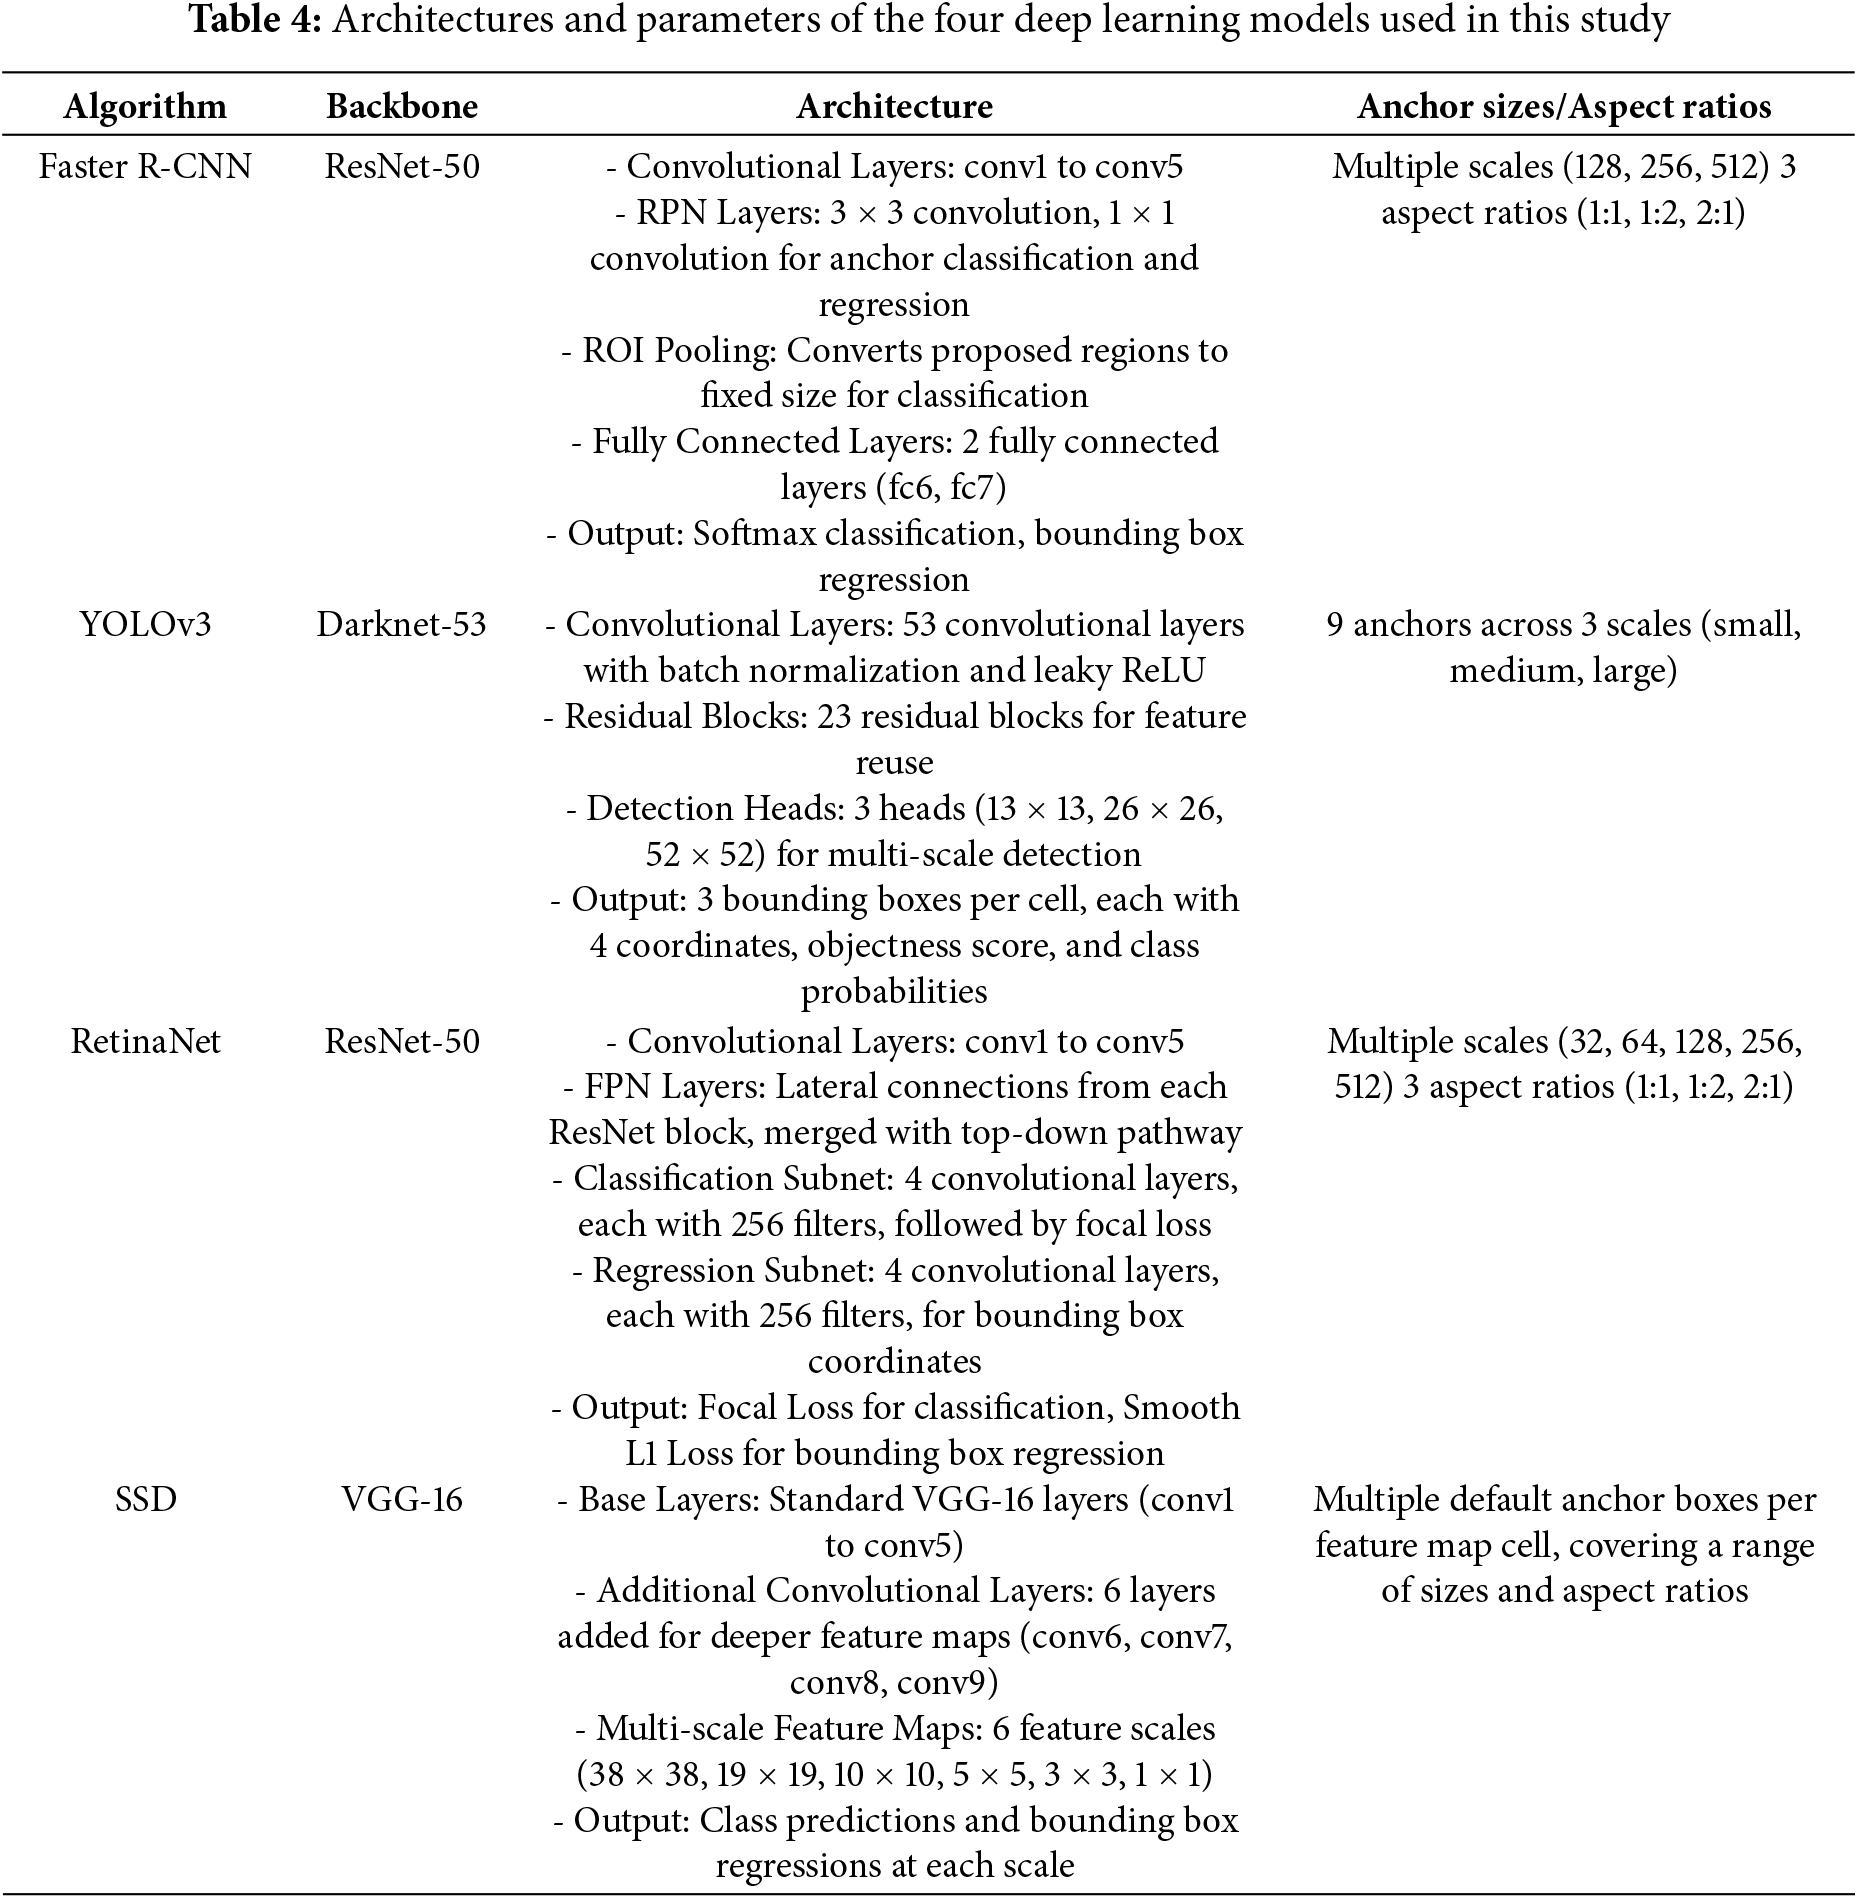
The deep learning-based object detection models employed in this study were configured with specific backbone architectures to optimize feature extraction and enhance detection performance in UAV-acquired banana crop imagery (Table 4). Faster R-CNN utilized a ResNet-50 backbone with a FPN to improve multi-scale feature representation, while YOLOv3 was implemented with the Darknet-53 architecture, which provides a balance between computational efficiency and detection accuracy. RetinaNet, similar to Faster R-CNN, incorporated ResNet-50 with FPN to facilitate robust object localization across varying scales, whereas SSD was equipped with a VGG-16 backbone, a widely adopted architecture known for its efficiency in single-stage object detection. To ensure a fair comparison among these models, a standardized training protocol was employed. The learning rate was set to 0.001 for YOLOv3 and SSD, whereas a lower learning rate of 0.0001 was applied to Faster R-CNN and RetinaNet to accommodate their more complex architectures. Adam optimization was used for YOLOv3 and RetinaNet to enhance convergence stability, while Stochastic Gradient Descent (SGD) was adopted for Faster R-CNN and SSD to maintain training consistency with prior research. All models were trained using a batch size of 16 over 50 epochs to ensure sufficient parameter updates without excessive computational overhead. Furthermore, a set of data augmentation techniques, including random horizontal flipping, rotation within a range of ±5°, and brightness adjustment of ±10%, was applied to improve model generalization and robustness against variations in illumination and perspective distortions inherent in UAV imagery. These configurations were carefully selected based on empirical tuning and prior literature to maximize the models’ effectiveness in detecting banana crops under diverse environmental conditions.
In this study, four deep learning techniques (Faster R-CNN, YOLOv3, RetinaNet, and SSD) are employed to detect banana crops in low-altitude UAV imagery, assessing their respective capabilities in crop detection. Evaluation metrics encompass Precision, Recall, F1 score, Intersection over Union (IoU), and average precision (AP), which are based on true positive (TP), false negative (FN), and false positive (FP) classifications. Predictions for banana detection are based on the spatial location of objects in images, with each detected bounding box aligned to a ground truth object. If a crop is labeled as class A and is classified as class A, it is considered a TP. If a crop is labeled as class A but remains unclassified (assigned to another class), it is categorized as a FN. In the case where a crop is not present but is classified, it is treated as a FP. We anticipate higher TP, lower FN, and lower FP to achieve increased accuracy.
Precision is calculated as the percentage of TPs among detected bounding boxes, gauges the model’s efficacy in identifying actual bananas (Eq. (1)). Recall is defined as the percentage of TPs, representing the proportion of successfully detected actual bananas (Eq. (2)). F1 score, the harmonic mean of Precision and Recall, is calculated per Eq. (3). IoU (Eq. (4)) is defined as TP/(TP + FN + FP). AP is defined as the mean precision across recalls at various IoU thresholds from 0 to 1 (Eq. (5)), interpreted as the area under the precision-recall curve.
Faster R-CNN, YOLOv3, RetinaNet, and SSD were compared with each other for the detection of banana seedlings, mature banana trees, and mixed cultivation of bananas and betel nuts. The red, yellow, blue, and purple boxes indicate banana plants detected by Faster R-CNN, YOLOv3, RetinaNet, and SSD, respectively. Table 5 demonstrates RetinaNet’s superior banana seedling detection performance in Zone A, with all metrics exceeding 0.9 and an IoU of 0.87. Faster R-CNN delivered the second-best results, achieving the highest true positives (TP = 188) and lowest omission rate (FN = 19). Conversely, YOLOv3 and SSD showed markedly inferior performance, registering only 2 and 13 TPs, respectively. YOLOv3 exhibited the highest omission rate (FN = 227), while SSD produced the highest commission errors (FP = 17). YOLOv3’s spatial constraints on bounding box predictions (Fig. 4) further explain its difficulty in detecting small objects, such as banana seedlings.
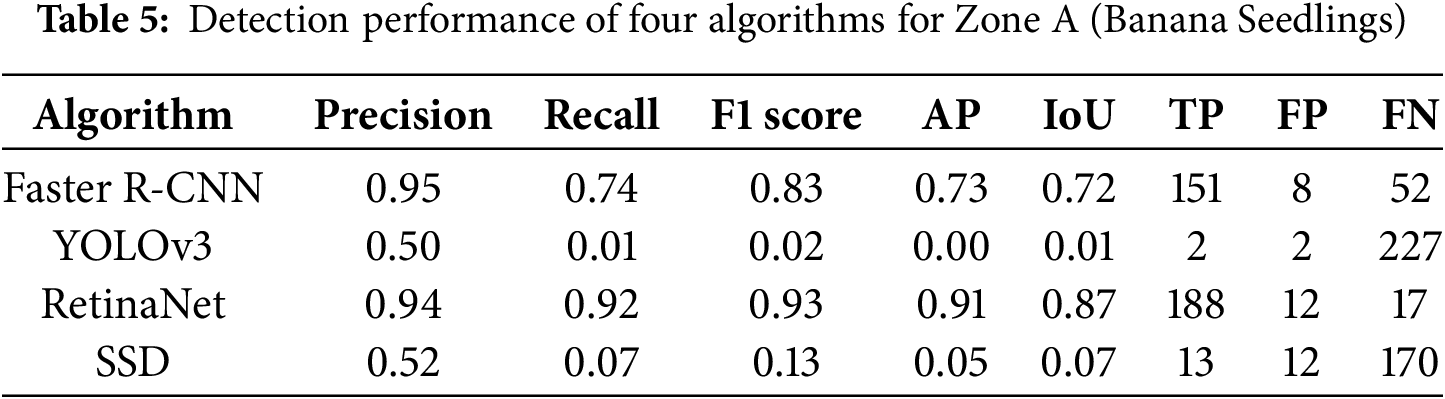
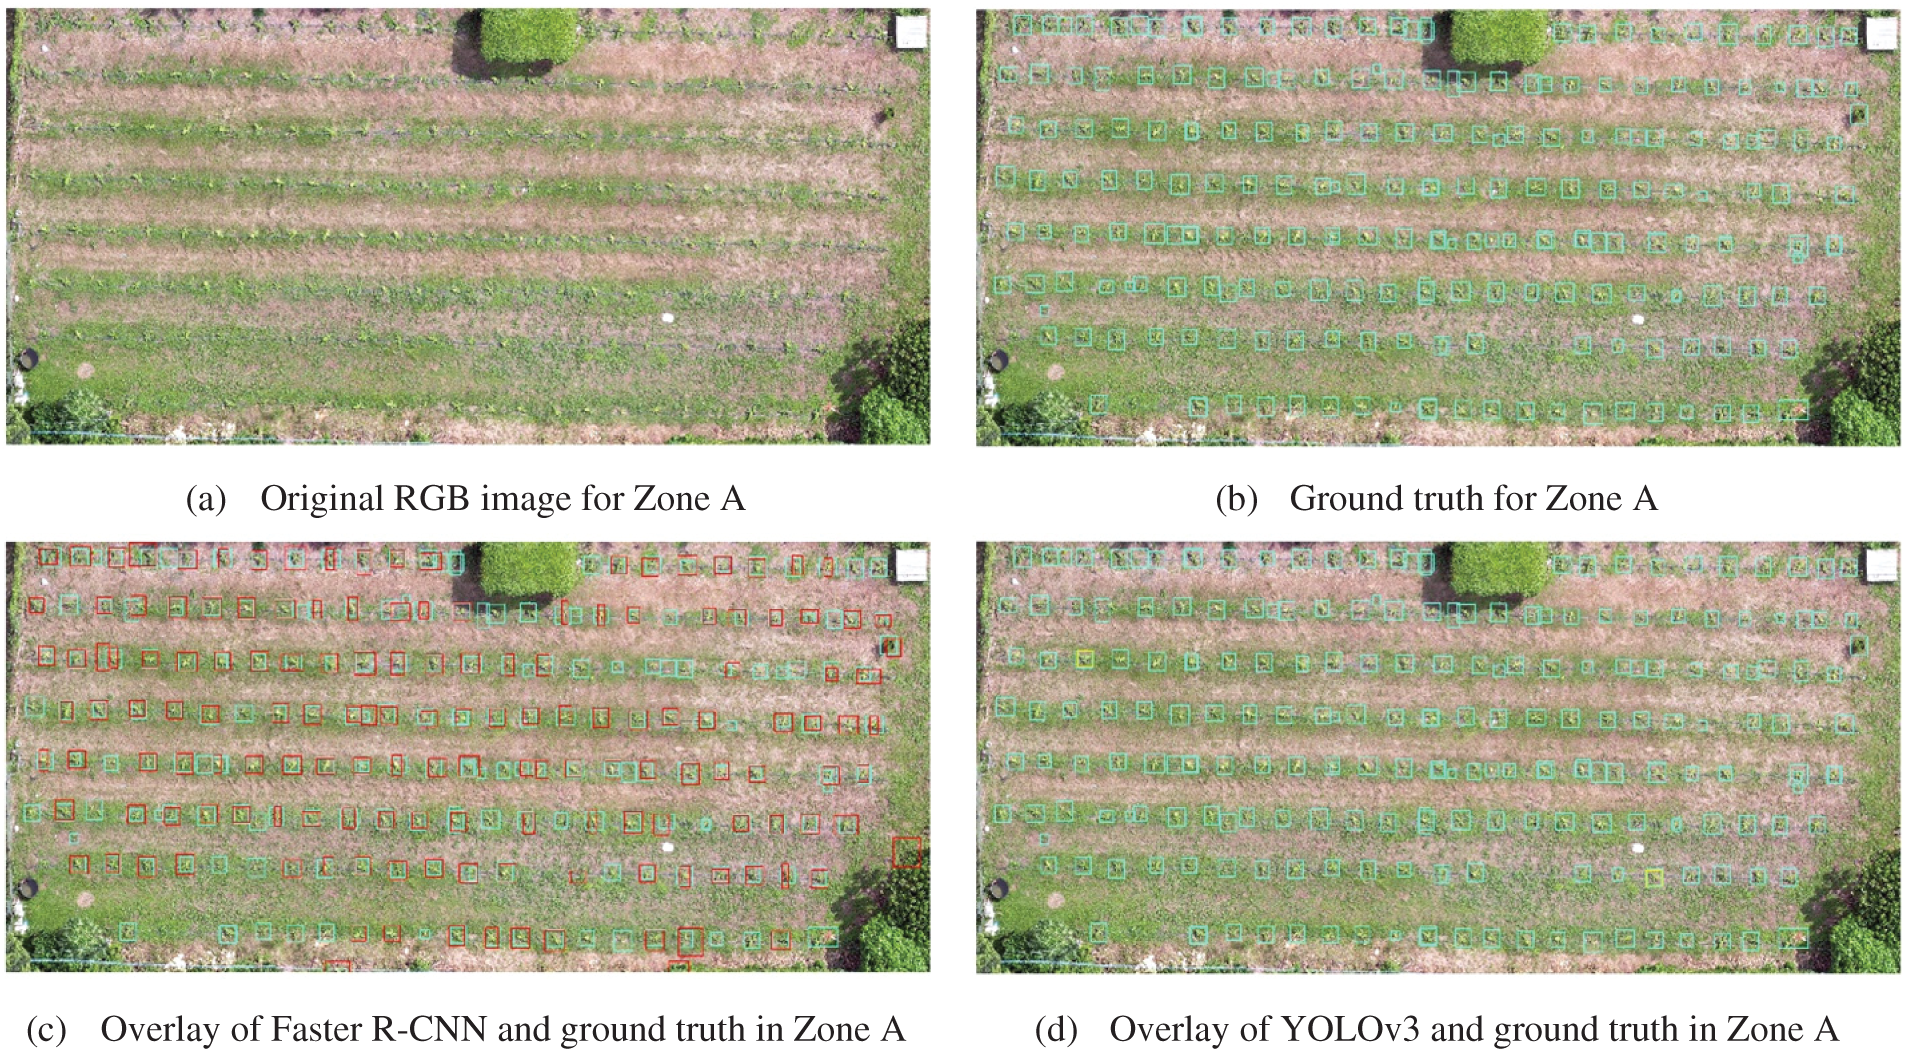
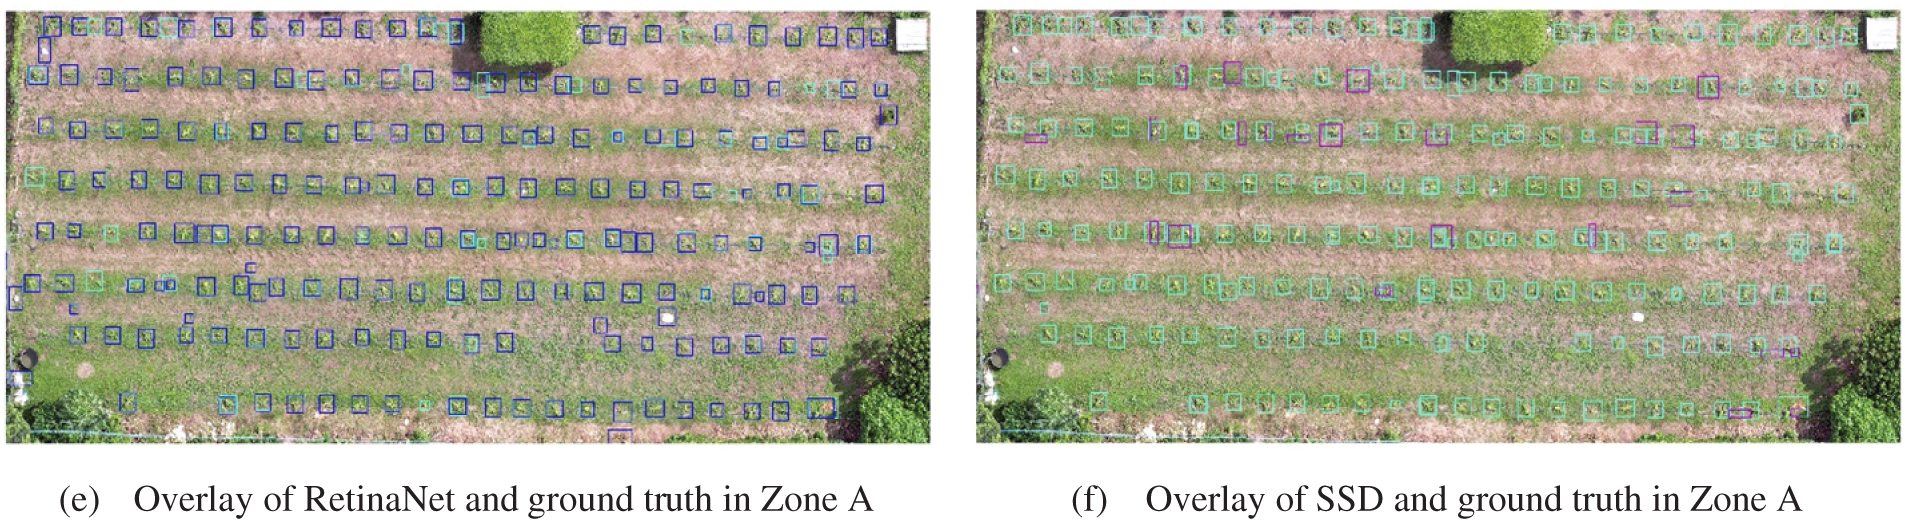
Figure 4: Detection results of four deep learning techniques and ground truth for Zone A
As illustrated in Table 6, RetinaNet accurately identified 214 bananas (TP) in Zone B, with the lowest FP at 5 and the lowest omission rate, indicated by an FN of 117. Furthermore, RetinaNet achieved the highest Precision at 0.98, with YOLOv3 exhibiting the second-highest Precision at 0.84. Compared with banana seedlings, YOLOv3 demonstrated a notable improvement in detecting mature banana trees. By contrast, SSD exhibited suboptimal detection performance for both banana seedlings and mature banana trees. As depicted in Fig. 5, all four deep learning techniques demonstrated considerably improved detection of mature banana trees.
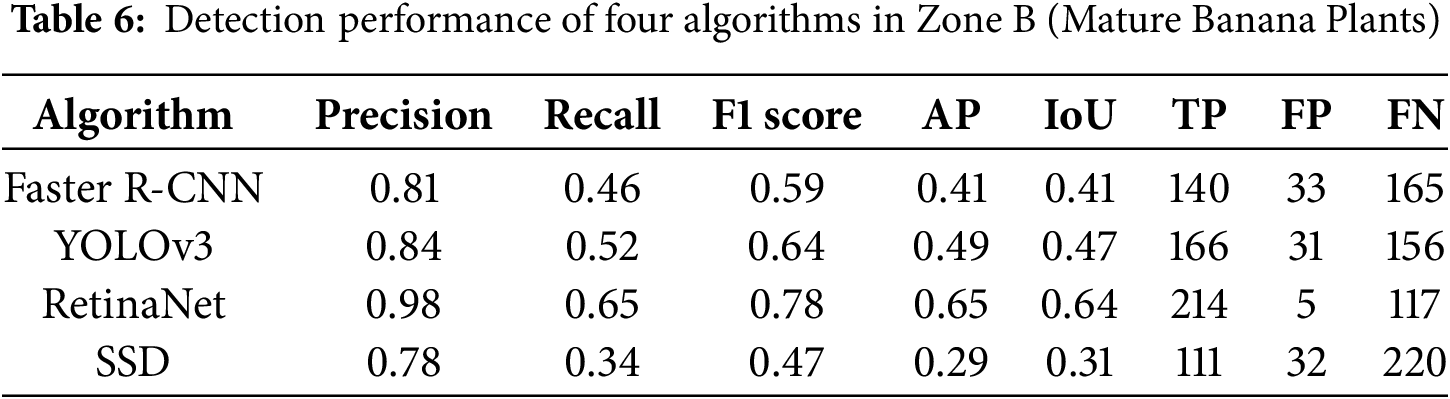
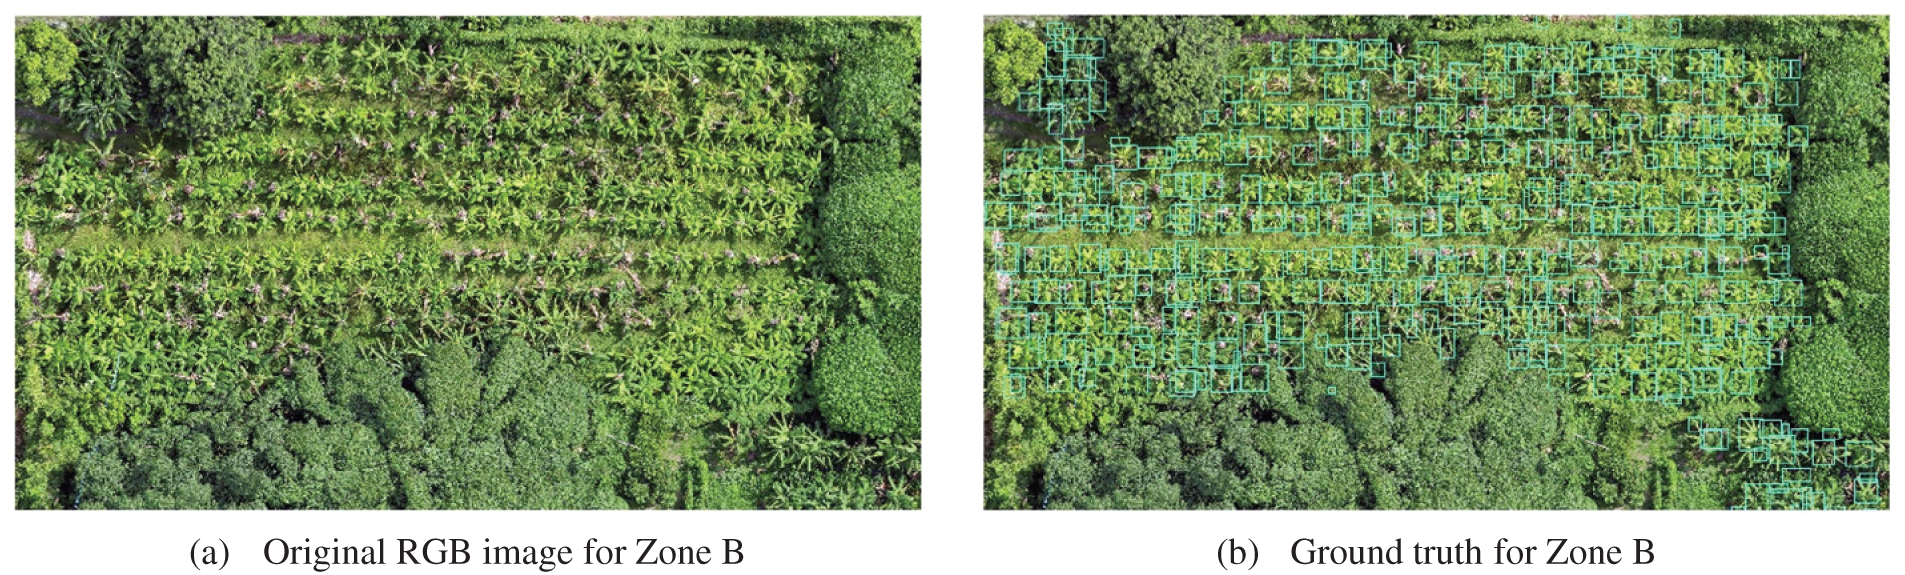
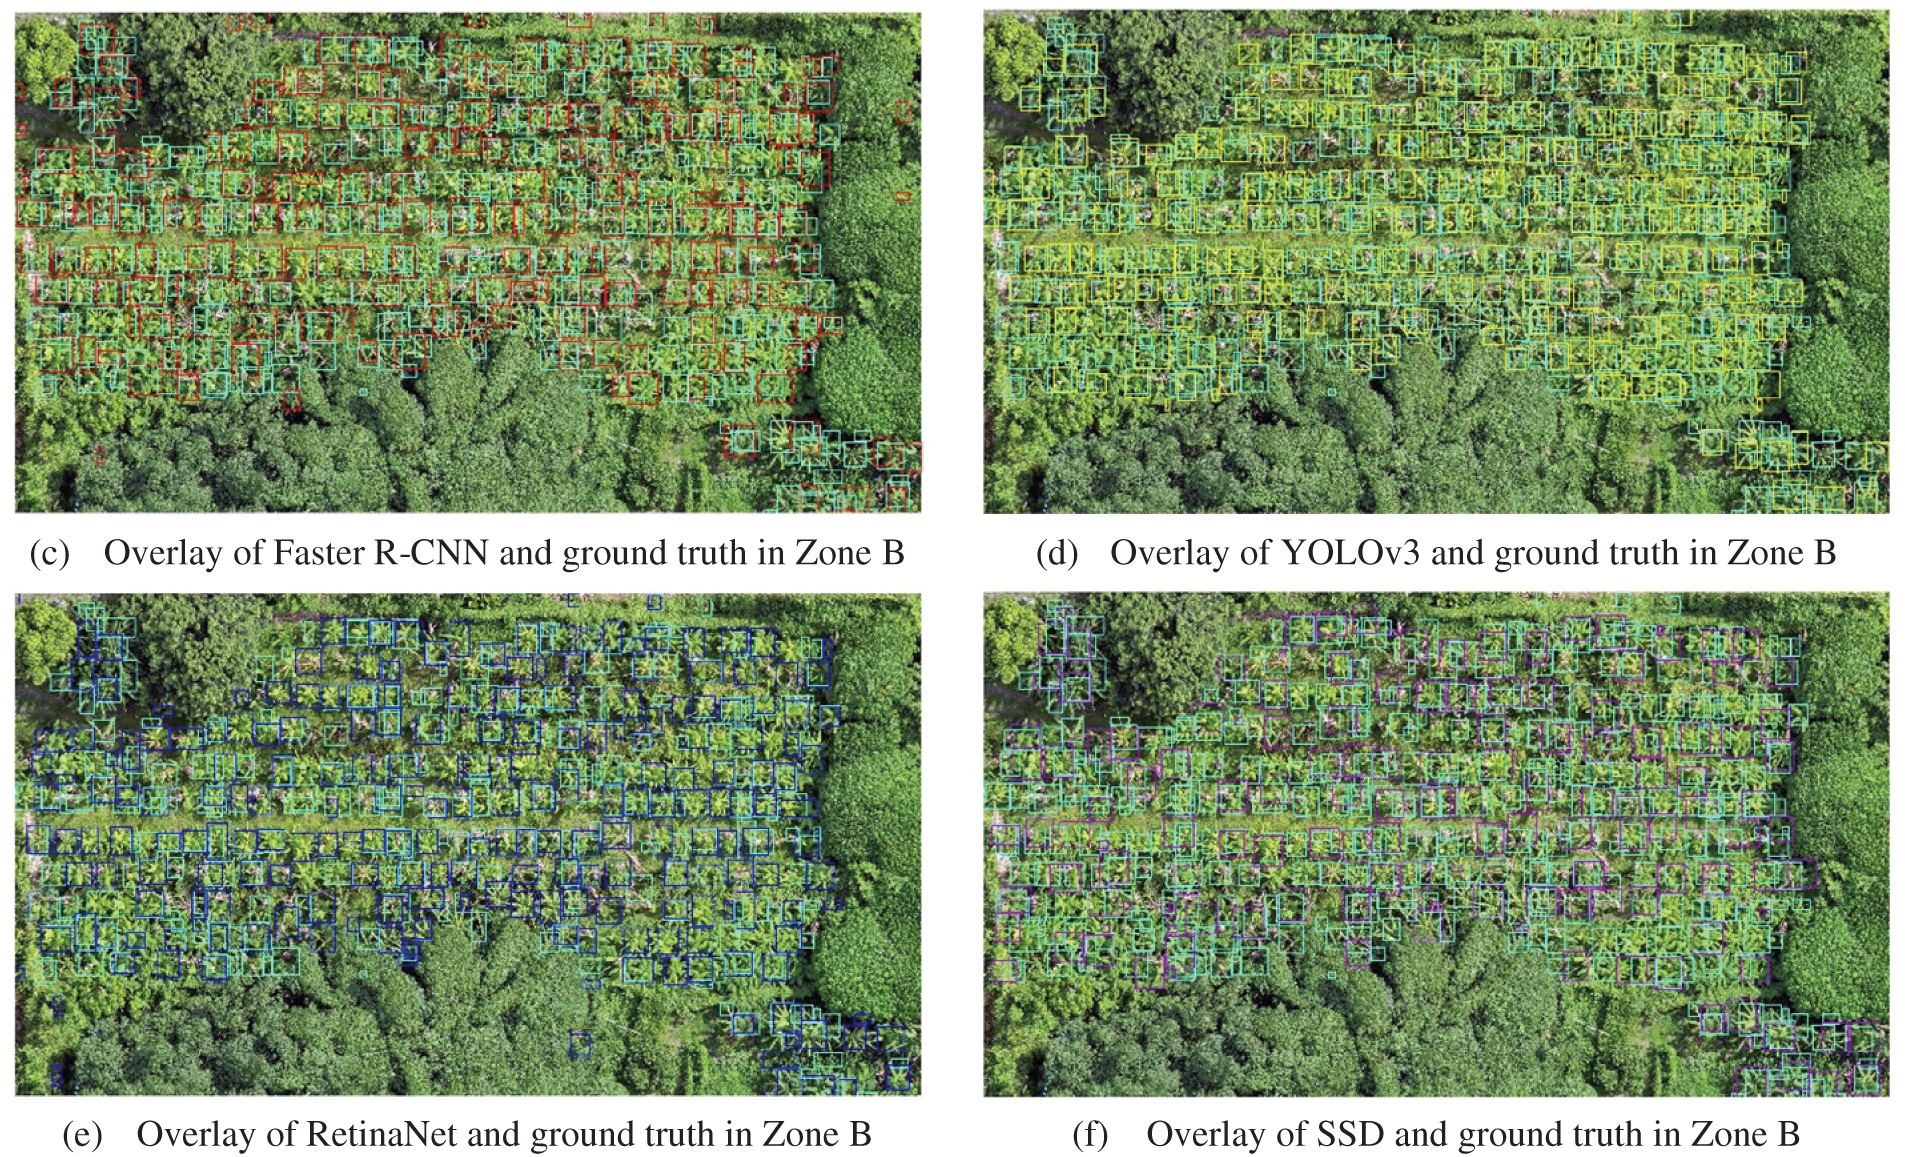
Figure 5: Detection results of four deep learning techniques and ground truth for Zone B
In some parts of Zone C, the canopy of betel nut palms cast shadows or partially occluded the banana plants underneath. This led to a few missed detections (false negatives) where banana plants under heavy shadow were not detected. Moreover, due to the intermixing of banana and betel nut crowns in the imagery, the model occasionally produced a slightly imprecise bounding box that covered a cluster of leaves from both a banana and an adjacent betel nut sapling. We emphasize that we did not explicitly train the model to recognize betel nut trees as a separate class; they were effectively part of the background clutter. The presence of another crop species (betel nut) in the scene is thus a test of the model’s robustness to non-target objects. For the most part, the model focused on the banana plant features and ignored betel nut crowns, but the few errors indicate that there is room for improving how context is handled by the detector in mixed cropping environments.
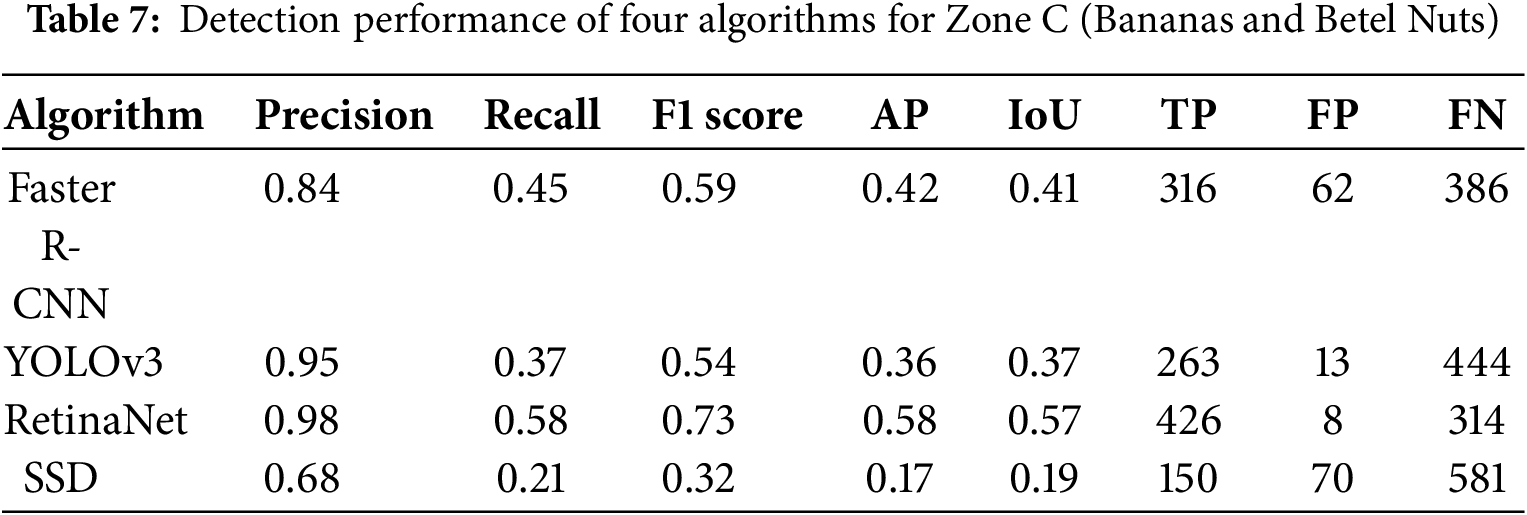
Fig. 6 illustrates the detection performance of four deep learning techniques for bananas in Zone C, where taller betel nut plants partially obscured the bananas. Particularly, RetinaNet accurately detected 426 banana trees in Zone C, exhibiting the lowest FP and FN rates of 8 and 314, respectively. RetinaNet’s IoU was the only one exceeding 0.5 (Table 7). Although SSD typically achieves higher real-time detection speed, it is more sensitive to changes in object position and size. Thus, its detection performance was relatively poor in scenarios involving object occlusion and deformation.
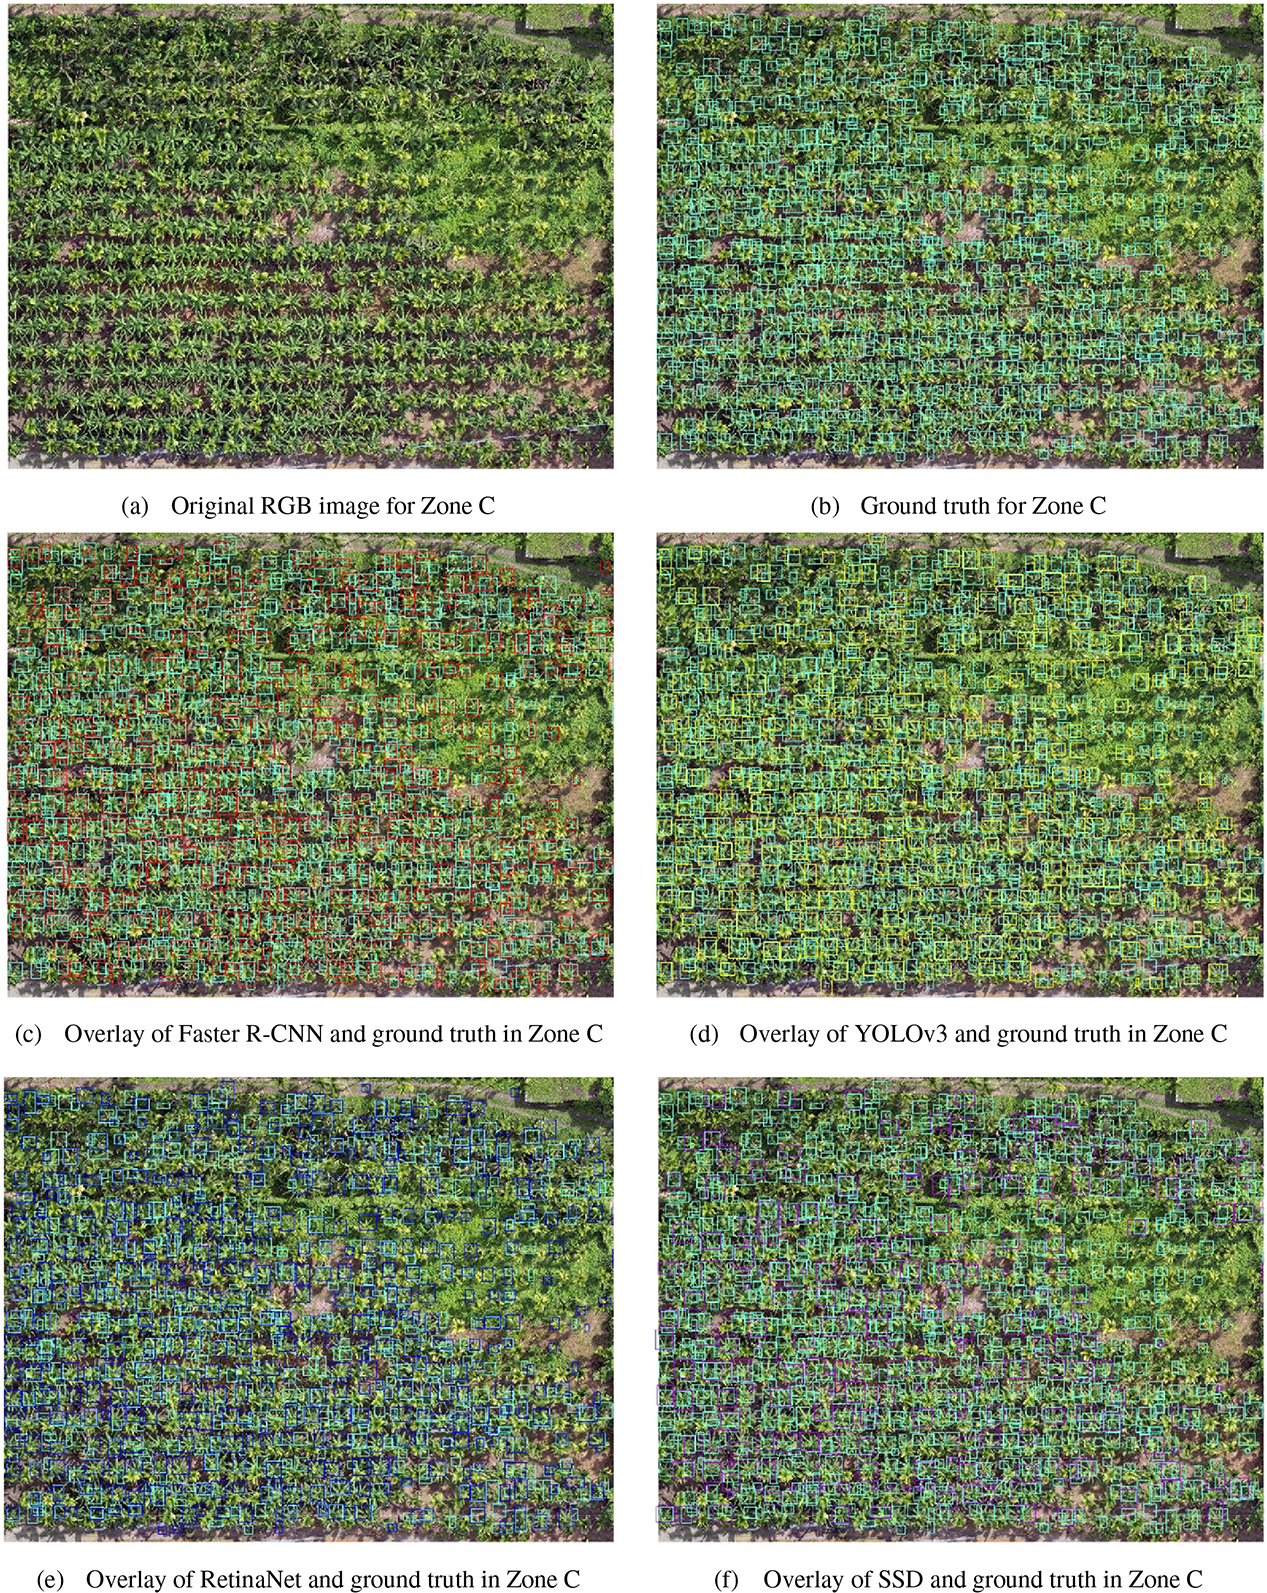
Figure 6: Detection results of four deep learning techniques and ground truth for Zone C
The red, yellow, blue, and purple bounding boxes represent the three types of banana scenes detected by Faster R-CNN, YOLOv3, RetinaNet, and SSD, respectively (Fig. 7). The results indicate that Faster R-CNN and RetinaNet performed well in banana crop detection. In this study, RetinaNet demonstrated outstanding performance, achieving a Precision of 0.91, Recall of 0.66, F1 score of 0.76, AP of 0.64, and IoU of 0.62 (Table 8). Among all models, RetinaNet recorded the highest number of true positives (TP = 838) and the lowest number of false negatives (FN = 435). Notably, it showed superior capability in detecting smaller banana crops during their early growth stages.
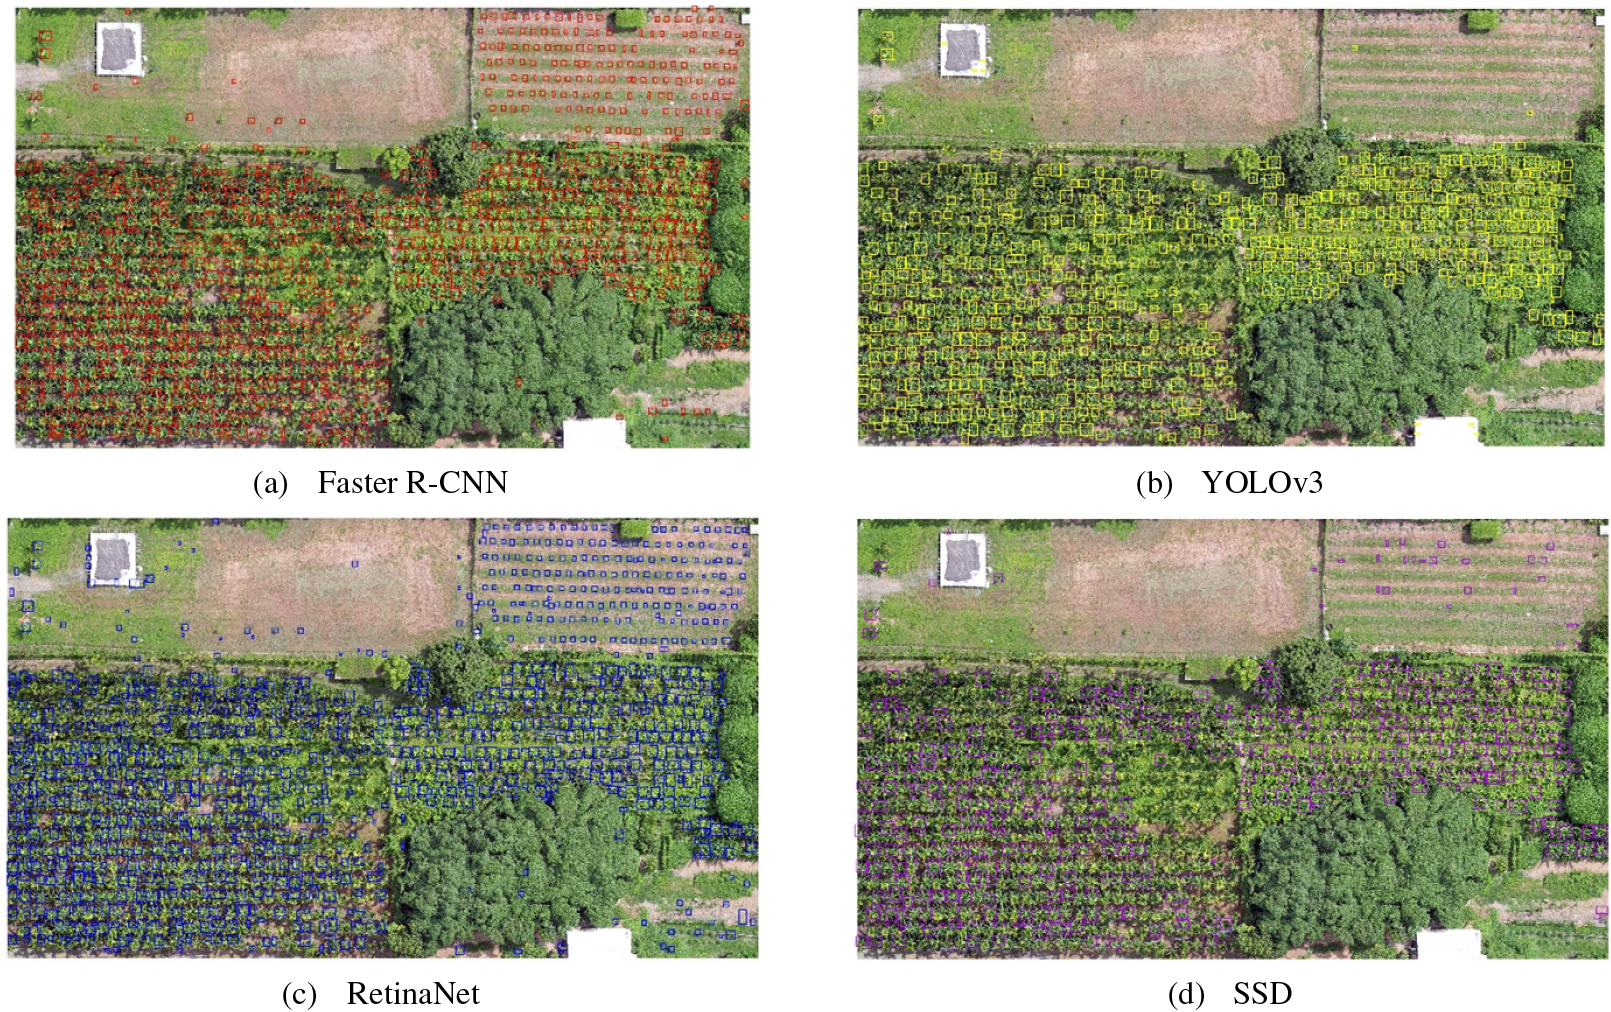
Figure 7: Banana crop detection using four deep learning techniques
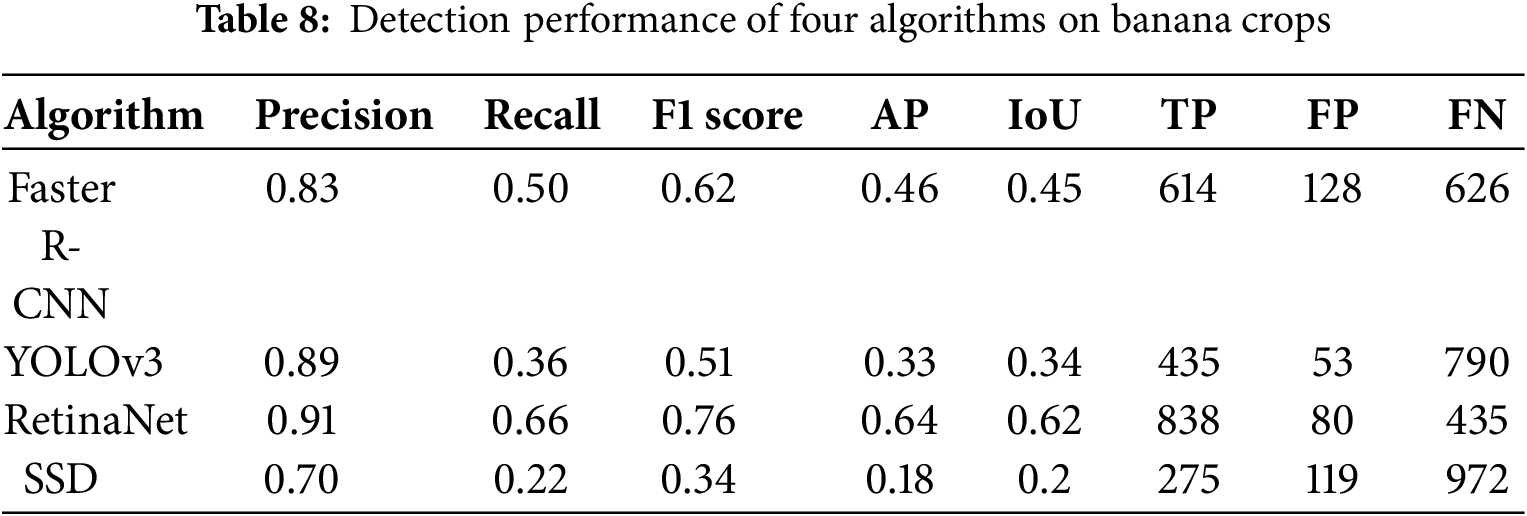
Fig. 8 compares the performance of four detection models (Faster R-CNN, YOLOv3, RetinaNet, and SSD) across three cultivation zones using Precision, Recall, F1 score, and AP metrics. RetinaNet demonstrates consistent superiority in all zones, achieving near-perfect scores (≈1.0) in Zone A. Although performance slightly declines in Zones B and C, it remains the highest-performing model. Faster R-CNN ranks second overall, with competitive Precision but marginally lower Recall and F1 scores than RetinaNet. YOLOv3 demonstrates moderate capability, showing localized improvement in Zone C, yet underperforming relative to the leading models. SSD consistently yields the weakest results across all evaluation zones and metrics.
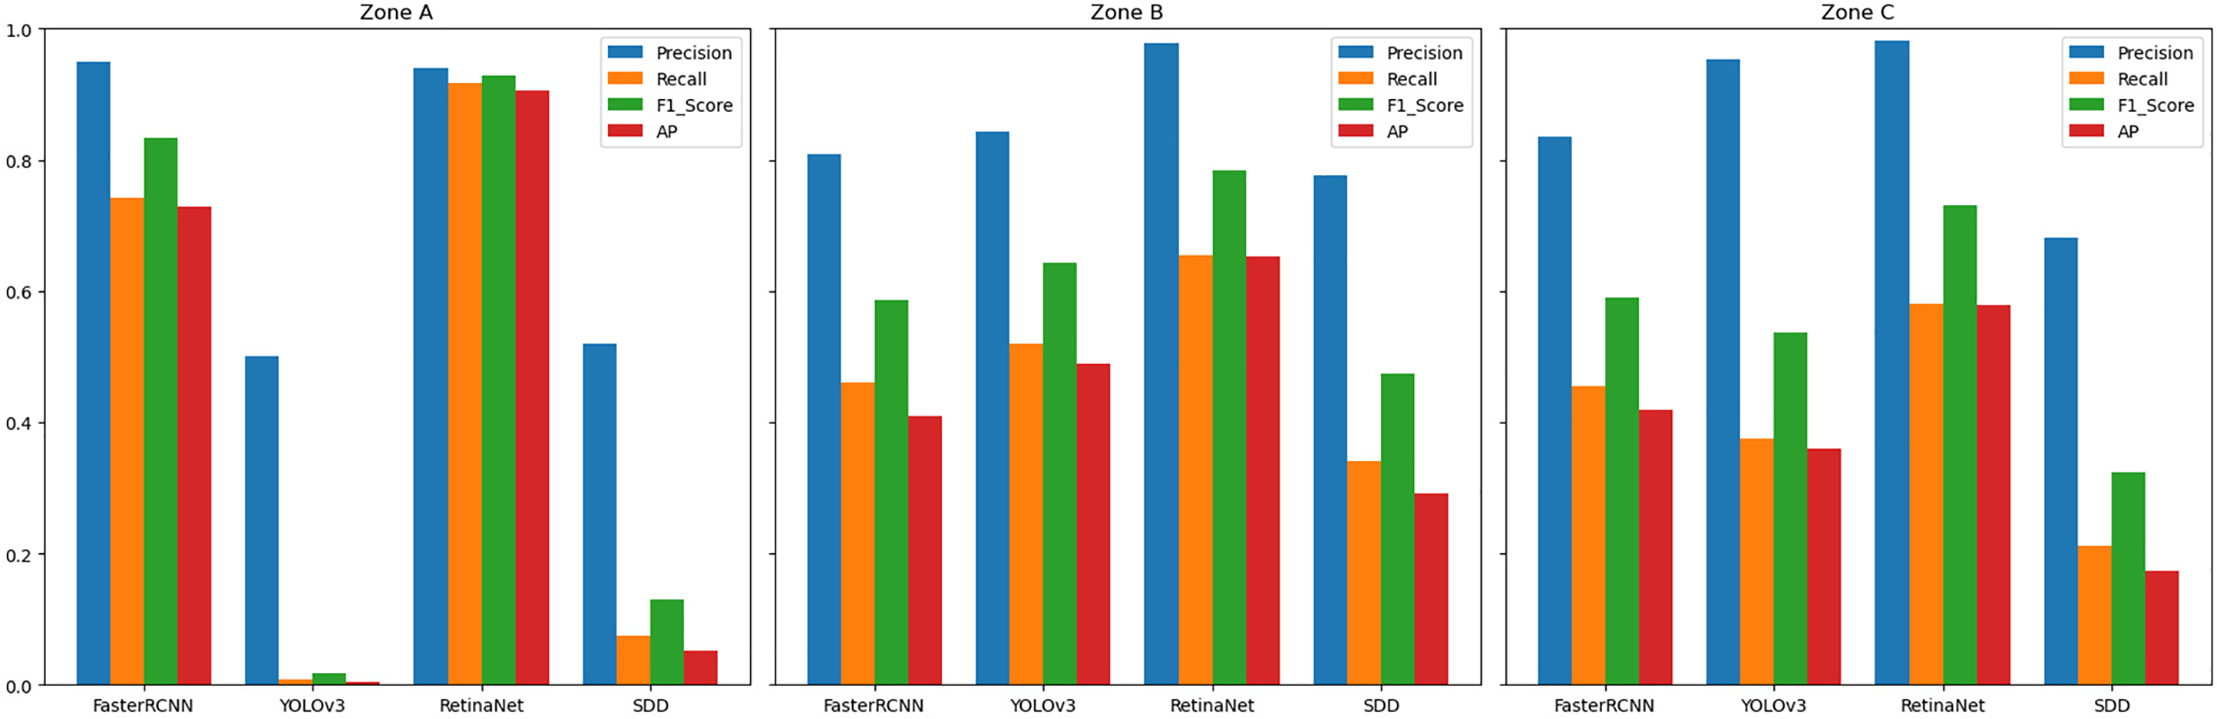
Figure 8: Performance of four deep learning models in three zones
Fig. 9a,b compares Precision and AP across four deep learning models in three cultivation zones. RetinaNet demonstrates superior performance, maintaining Precision > 0.94 across all zones (peaking at 0.98 in Zones B-C) and achieving the highest AP values (0.91 in Zone A, 0.65 in B, 0.58 in C). Though its AP shows a modest decline in Zones B-C, it consistently outperforms competitors. Faster R-CNN exhibits stable Precision (0.81–0.95) but significant AP variability: second-highest in Zone A (0.73) vs. substantially lower values in Zones B (0.41) and C (0.42). YOLOv3 shows marked zonal divergence, with severely compromised performance in Zone A (Precision = 0.50, AP = 0.0044) despite improvement in Zones B-C (Precision = 0.84/0.95, AP = 0.49/0.36). SSD delivers the weakest overall results, demonstrating both instability and poor capability (e.g., Zone A Precision = 0.52, AP = 0.051). The consistently lower metrics in Zone A across models indicate inherent challenges in detecting small objects.
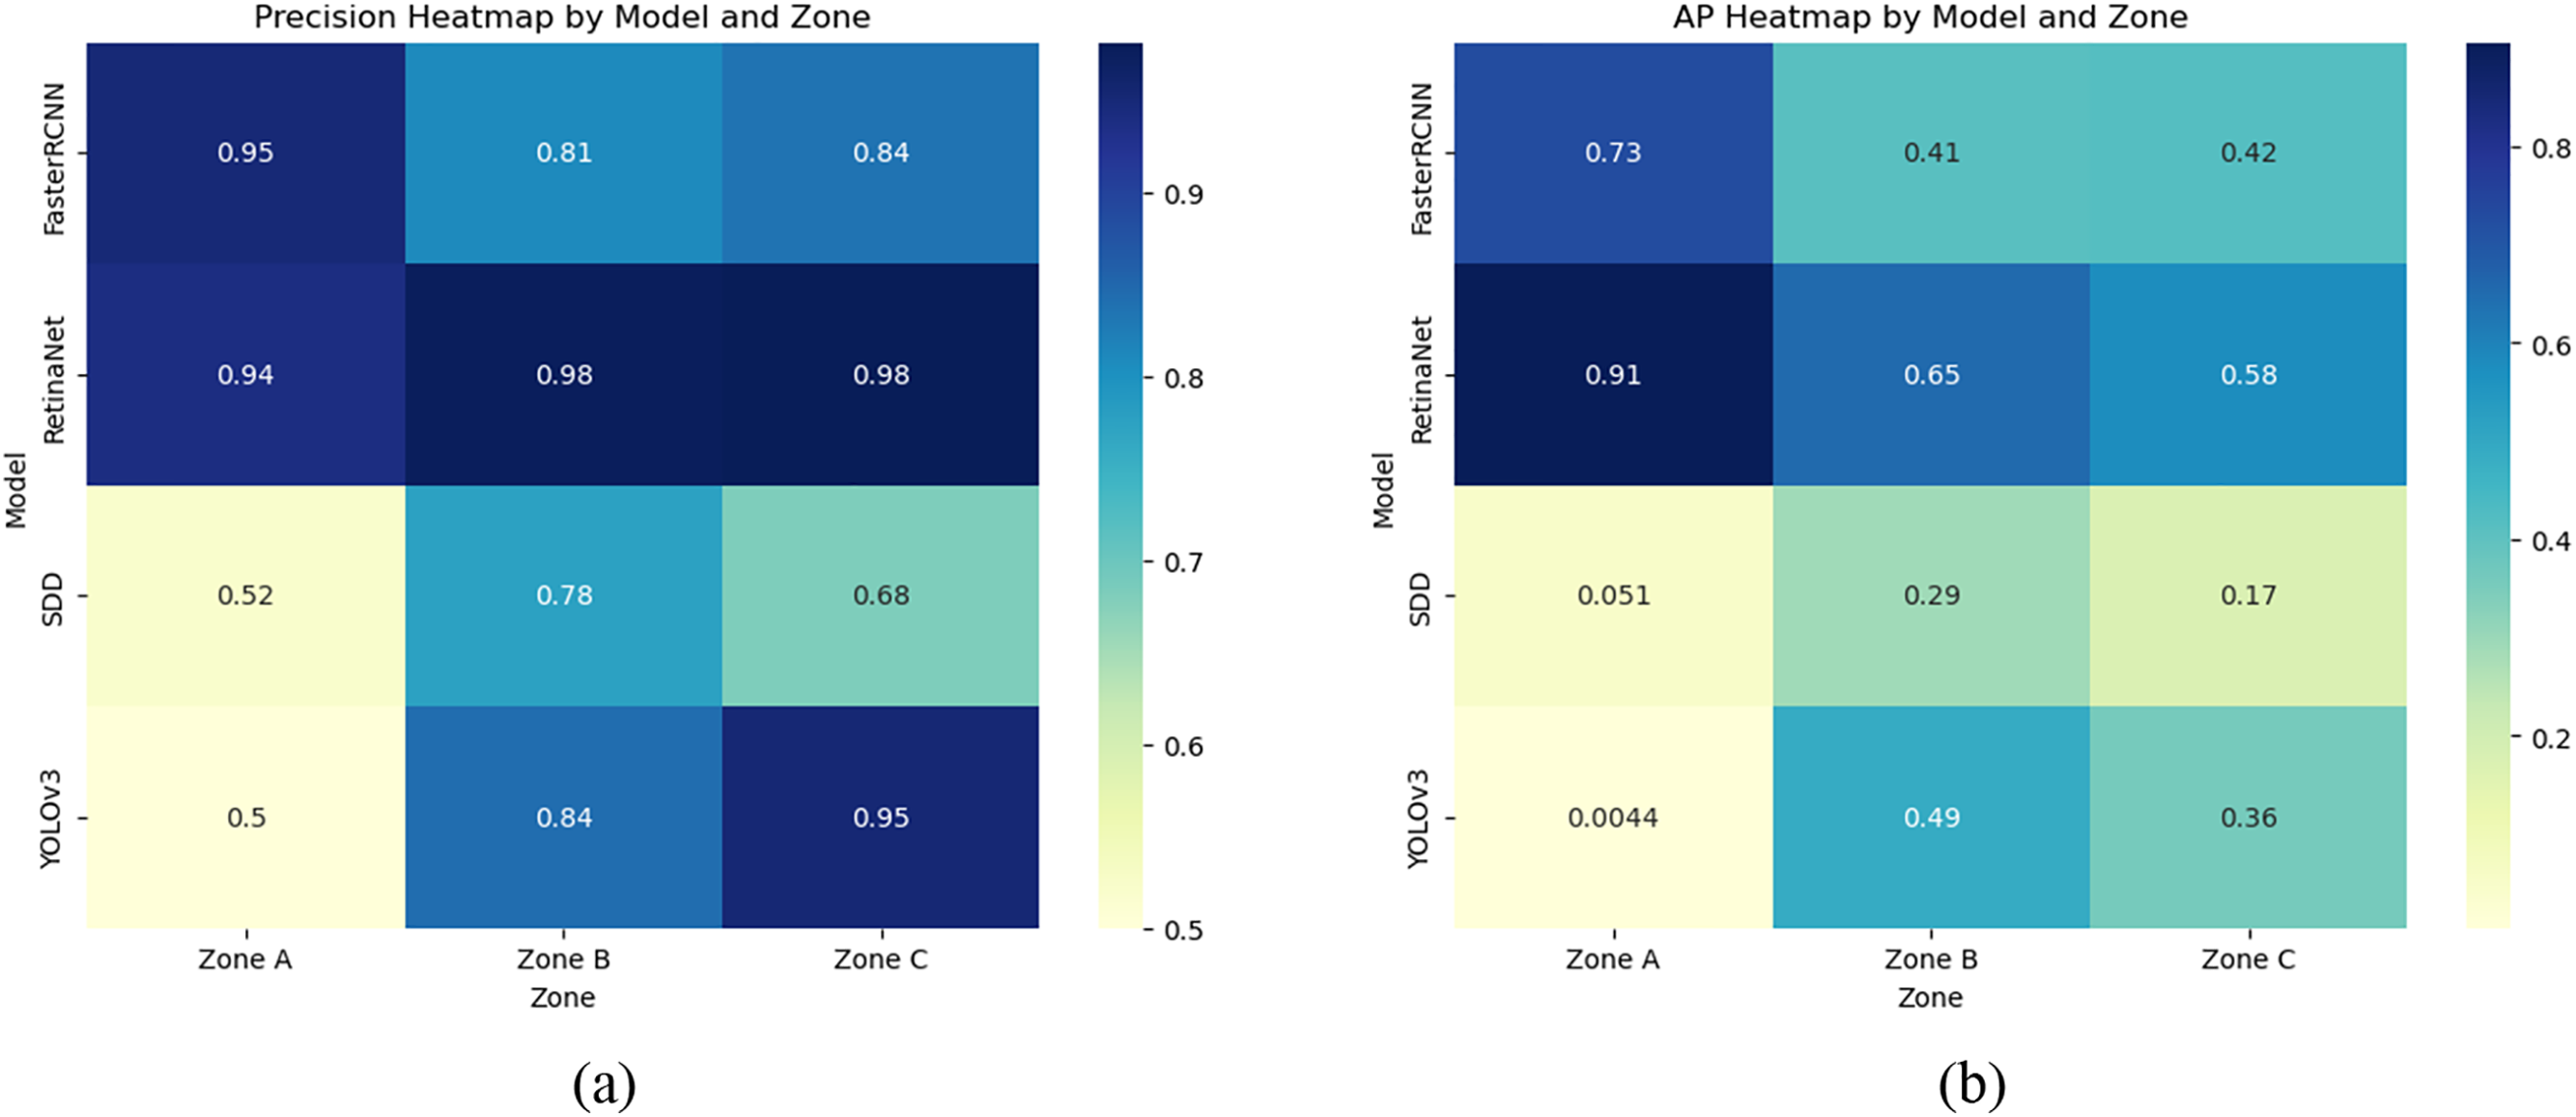
Figure 9: Heatmaps of Precision and AP for four deep learning models
Overall, RetinaNet exhibited superior performance in detecting the three characteristics of banana crops. The mean values for Precision, Recall, F1 score, AP, and IoU were 96.66%, 71.67%, 81.33%, 71.33%, and 66.67%, respectively. Furthermore, the maximum values and upper quartiles of each evaluation metric almost exceeded 90% and 75%, respectively. RetinaNet’s validation results were promising, indicating better detection integrity and accuracy relative to the other three deep learning techniques (Fig. 10). Faster R-CNN exhibited the second-best detection performance, with maximum values and upper quartiles of each evaluation metric surpassing 70% and 60%, respectively. The various evaluation metrics for YOLOv3 had minimum values close to 0, with lower quartiles not exceeding 15%. Moreover, YOLOv3 yielded the largest interquartile range (IQR) among the four deep learning techniques, indicating variability in detection performance across different characteristics of banana crops. SSD demonstrated the poorest performance in detecting the three characteristics of banana crops. Although the median for Precision was 66.9%, the medians for other evaluation metrics did not exceed 35%.
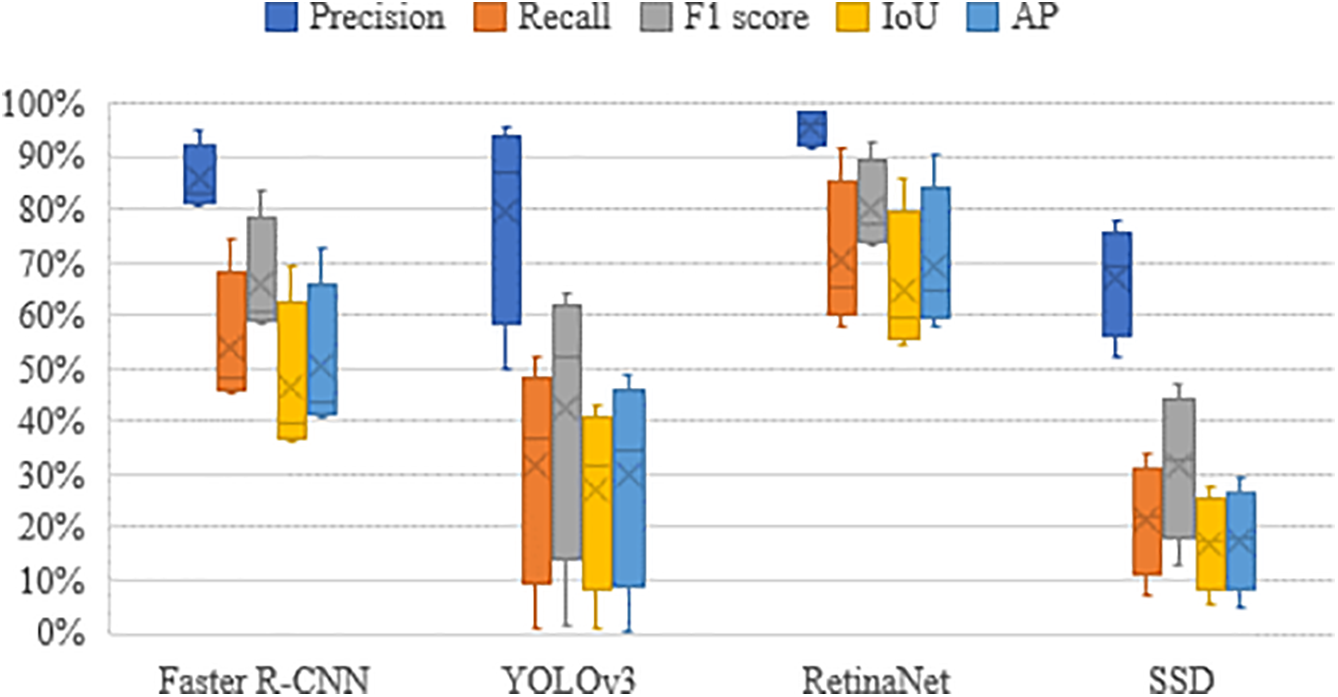
Figure 10: Evaluation metric values for banana crop detection through four deep learning
Fig. 10 presents the computed metric values for the evaluation dataset, stratified into three geographic zones (A–C). Each zone was analysed using train/validation/test splits obtained from repeated stratified random sampling of the whole dataset (80%, 10%, and 10%). Consequently, the dispersion captures stochastic variation across folds arising from (a) Dataset heterogeneity: Zone A is dominated by seedlings, Zone B by mature banana trees, and Zone C by banana–betel-nut intercropping with heavy shadowing and occlusion. This spectrum of object sizes and visual clutter yields markedly different TP/FN patterns, especially for single-stage detectors with fixed anchors. (b) Environmental factors: Uneven illumination and shadows cast by taller betel-nut palms in Zone C, together with subtle leaf-colour shifts between sunlit and shaded crowns, generate fold-to-fold fluctuations even after augmentation. (c) Occlusion and overlap: The mixed canopy in Zone C often obscures banana leaves, inflating false-negative counts for all four deep-learning models and widening their performance spread across folds.
This study incorporates crown detection by classifying canopy areas into three categories: <1.8 m2, 1.8–3.5 m2, and >3.5 m2. These categories represent different growth stages and spatial extents of the crop canopy, which directly influence the visual features captured in UAV imagery, such as texture and shape. This classification aids the detection process by enabling deep learning models to distinguish between small, medium, and large canopy structures, thereby improving detection accuracy under multi-scale conditions. Four deep learning models were applied to detect banana plants across these canopy classes.
Fig. 11 illustrates the ground truth for the canopy classification of banana crops, alongside the detection results of Faster R-CNN, YOLOv3, RetinaNet, and SSD for different canopy levels. Additionally, the capabilities of the four deep learning techniques were quantified by counting TP, FP, and FN. As shown in Fig. 12, RetinaNet detected the most number of banana canopies (TP = 490), and the quantities were similar across the three levels. The second-most optimal algorithm was Faster R-CNN (TP = 397). YOLOv3 and SSD exhibited poorer detection capabilities for canopies smaller than 1.8 m2, although both had lower FP counts. YOLOv3 had the lowest FP count (FP = 20) for canopies larger than 3.5 m2, while SSD also had a relatively small FP count (FP = 23) for canopies between 1.8 and 3.5 m2. RetinaNet had a lower FN count (FN = 49) for canopies smaller than 1.8 m2, while SSD had the highest FN count (FN = 335) for canopies between 1.8 and 3.5 m2.
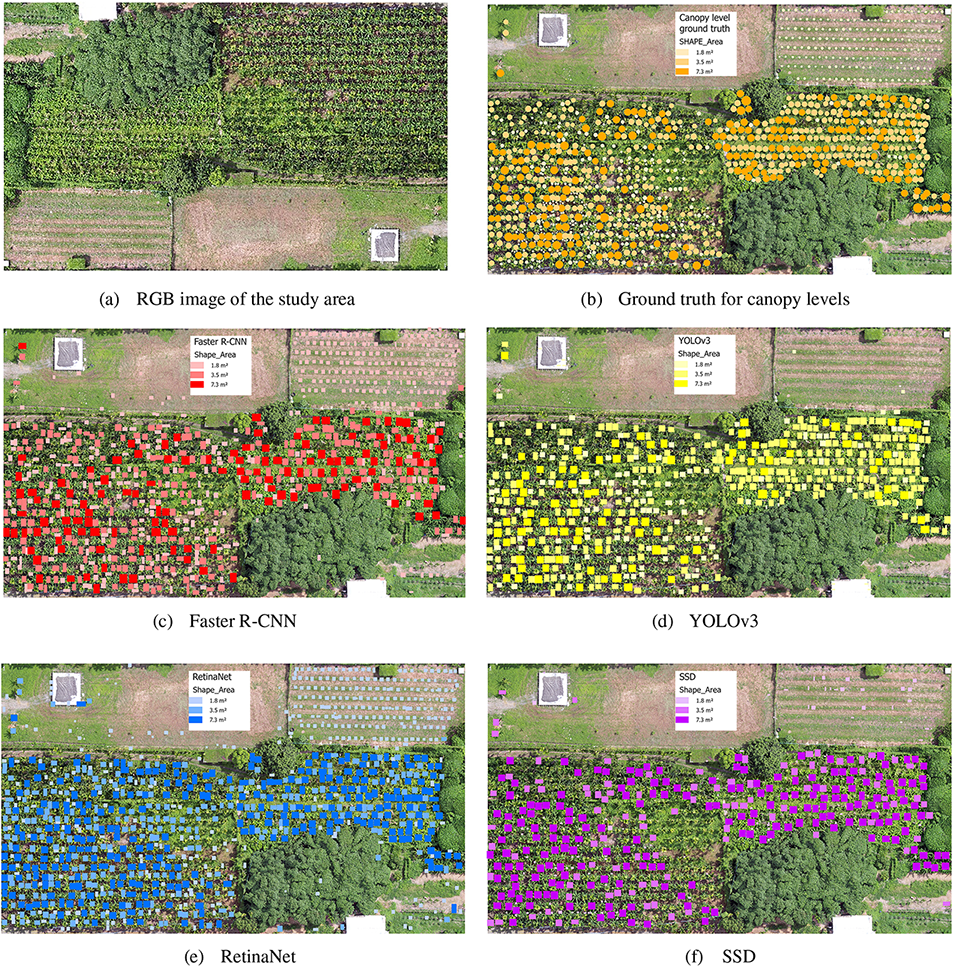
Figure 11: Detection of banana crops by four deep learning in three canopy levels
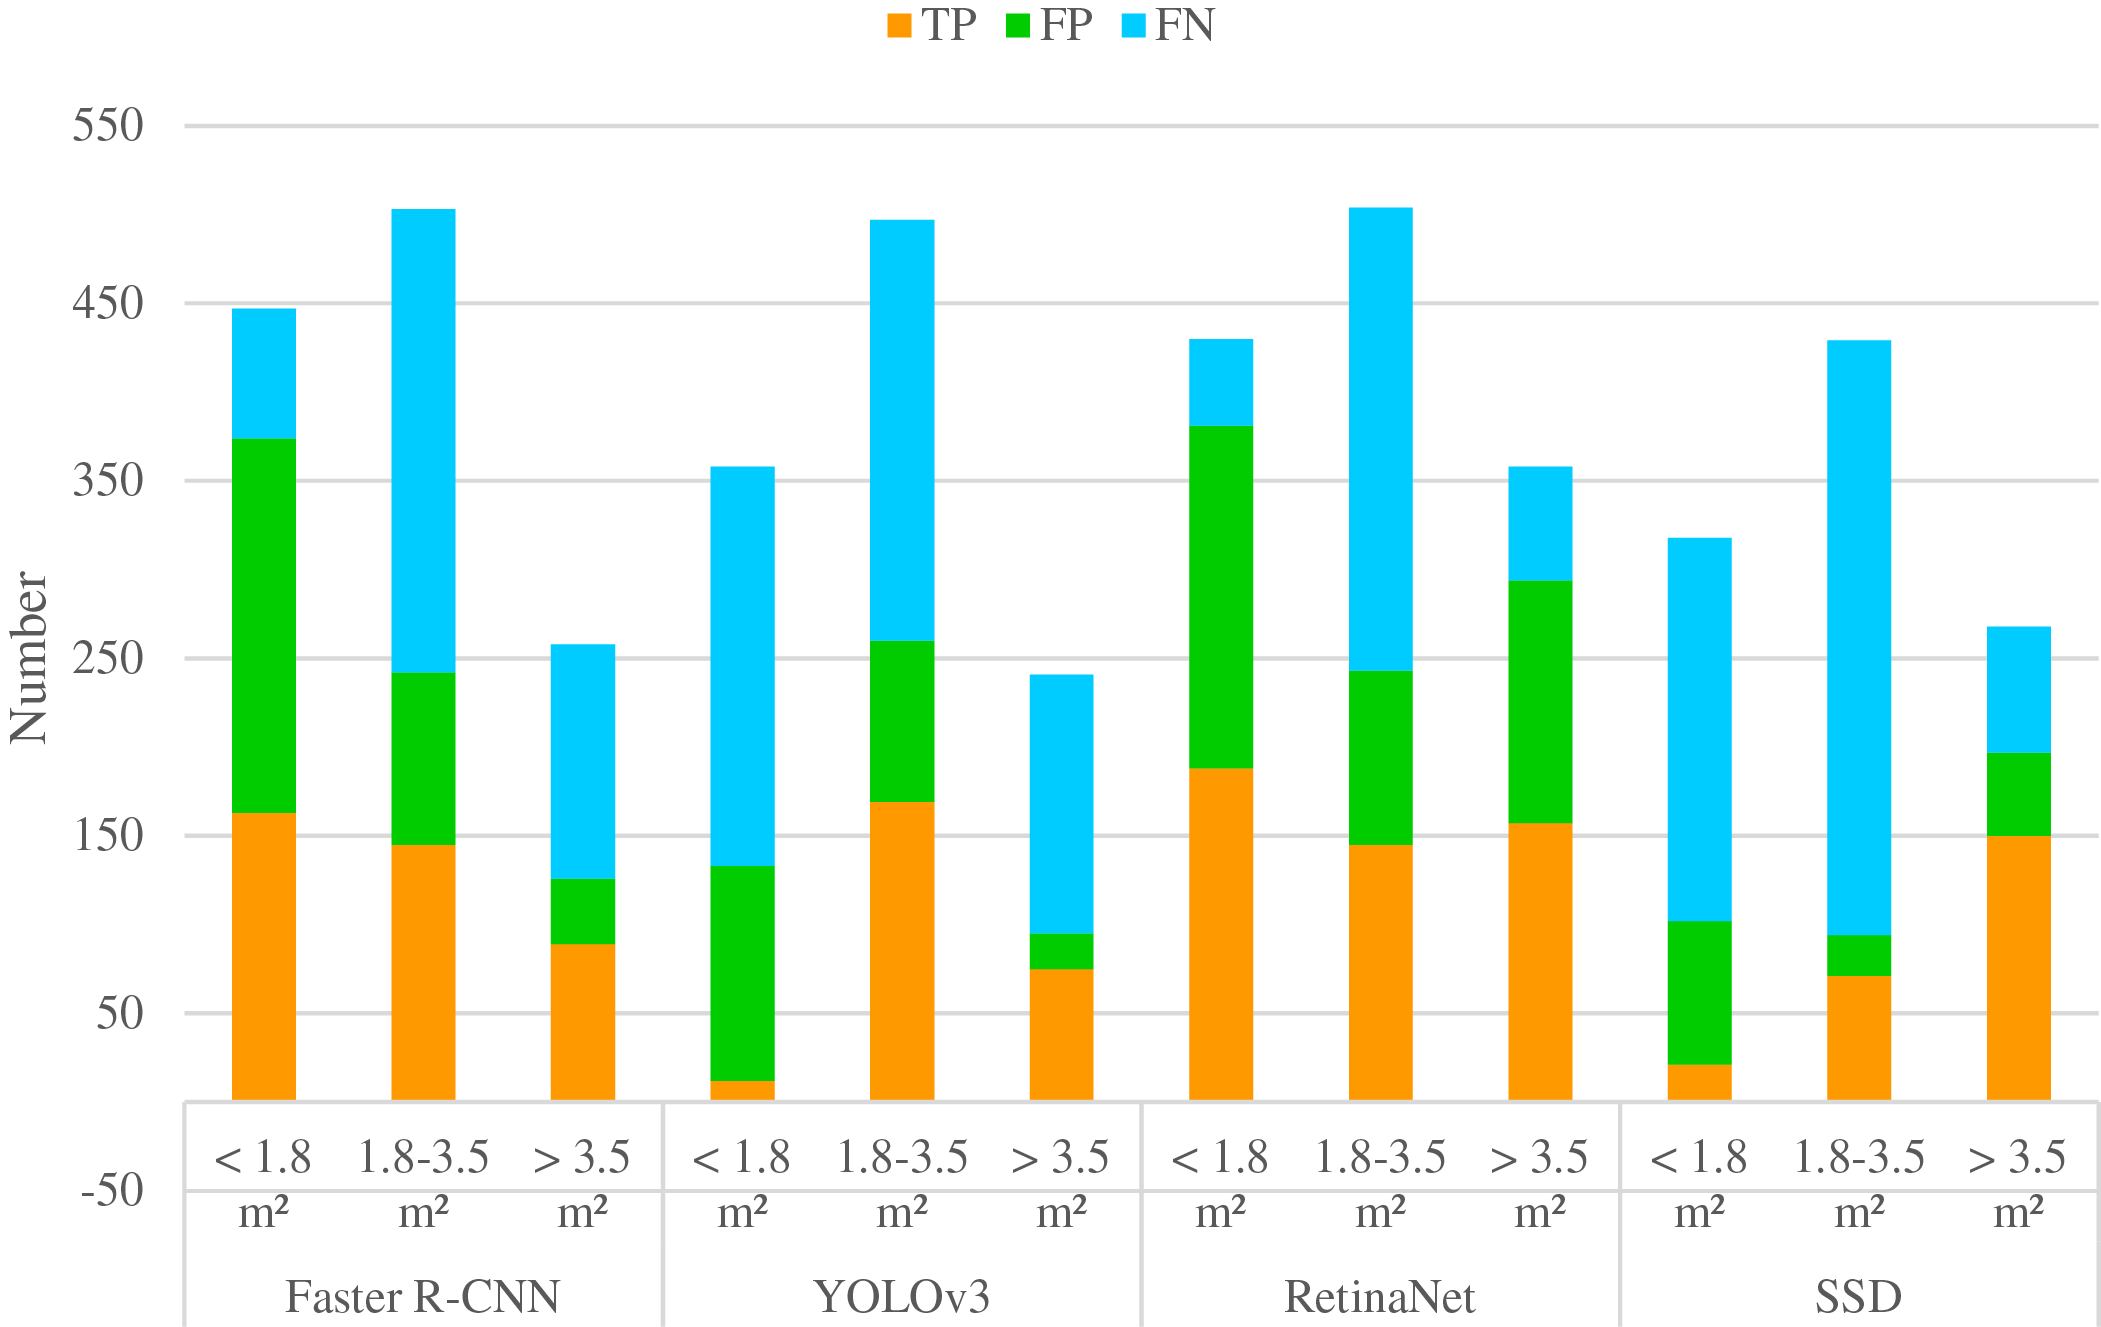
Figure 12: Number of detected positive and negative examples for different banana canopy levels using the four machine learning
In-depth evaluation of the detection performance of the four deep learning techniques for the three canopy levels was conducted using metrics such as Precision, Recall, F1 score, and IoU. As depicted in Fig. 13, RetinaNet and Faster R-CNN exhibited relatively minor differences in detection performance across the three canopy levels. Specifically, RetinaNet excelled in detecting canopies smaller than 1.8 m2. By contrast, YOLOv3 and SSD exhibited notable variations in detection capabilities across the three canopy levels. These two deep learning techniques demonstrated superior detection capabilities for larger canopies. Notably, SSD excelled in detecting canopies larger than 3.5 m2, while YOLOv3 exhibited the worst performance in detecting canopies smaller than 1.8 m2.
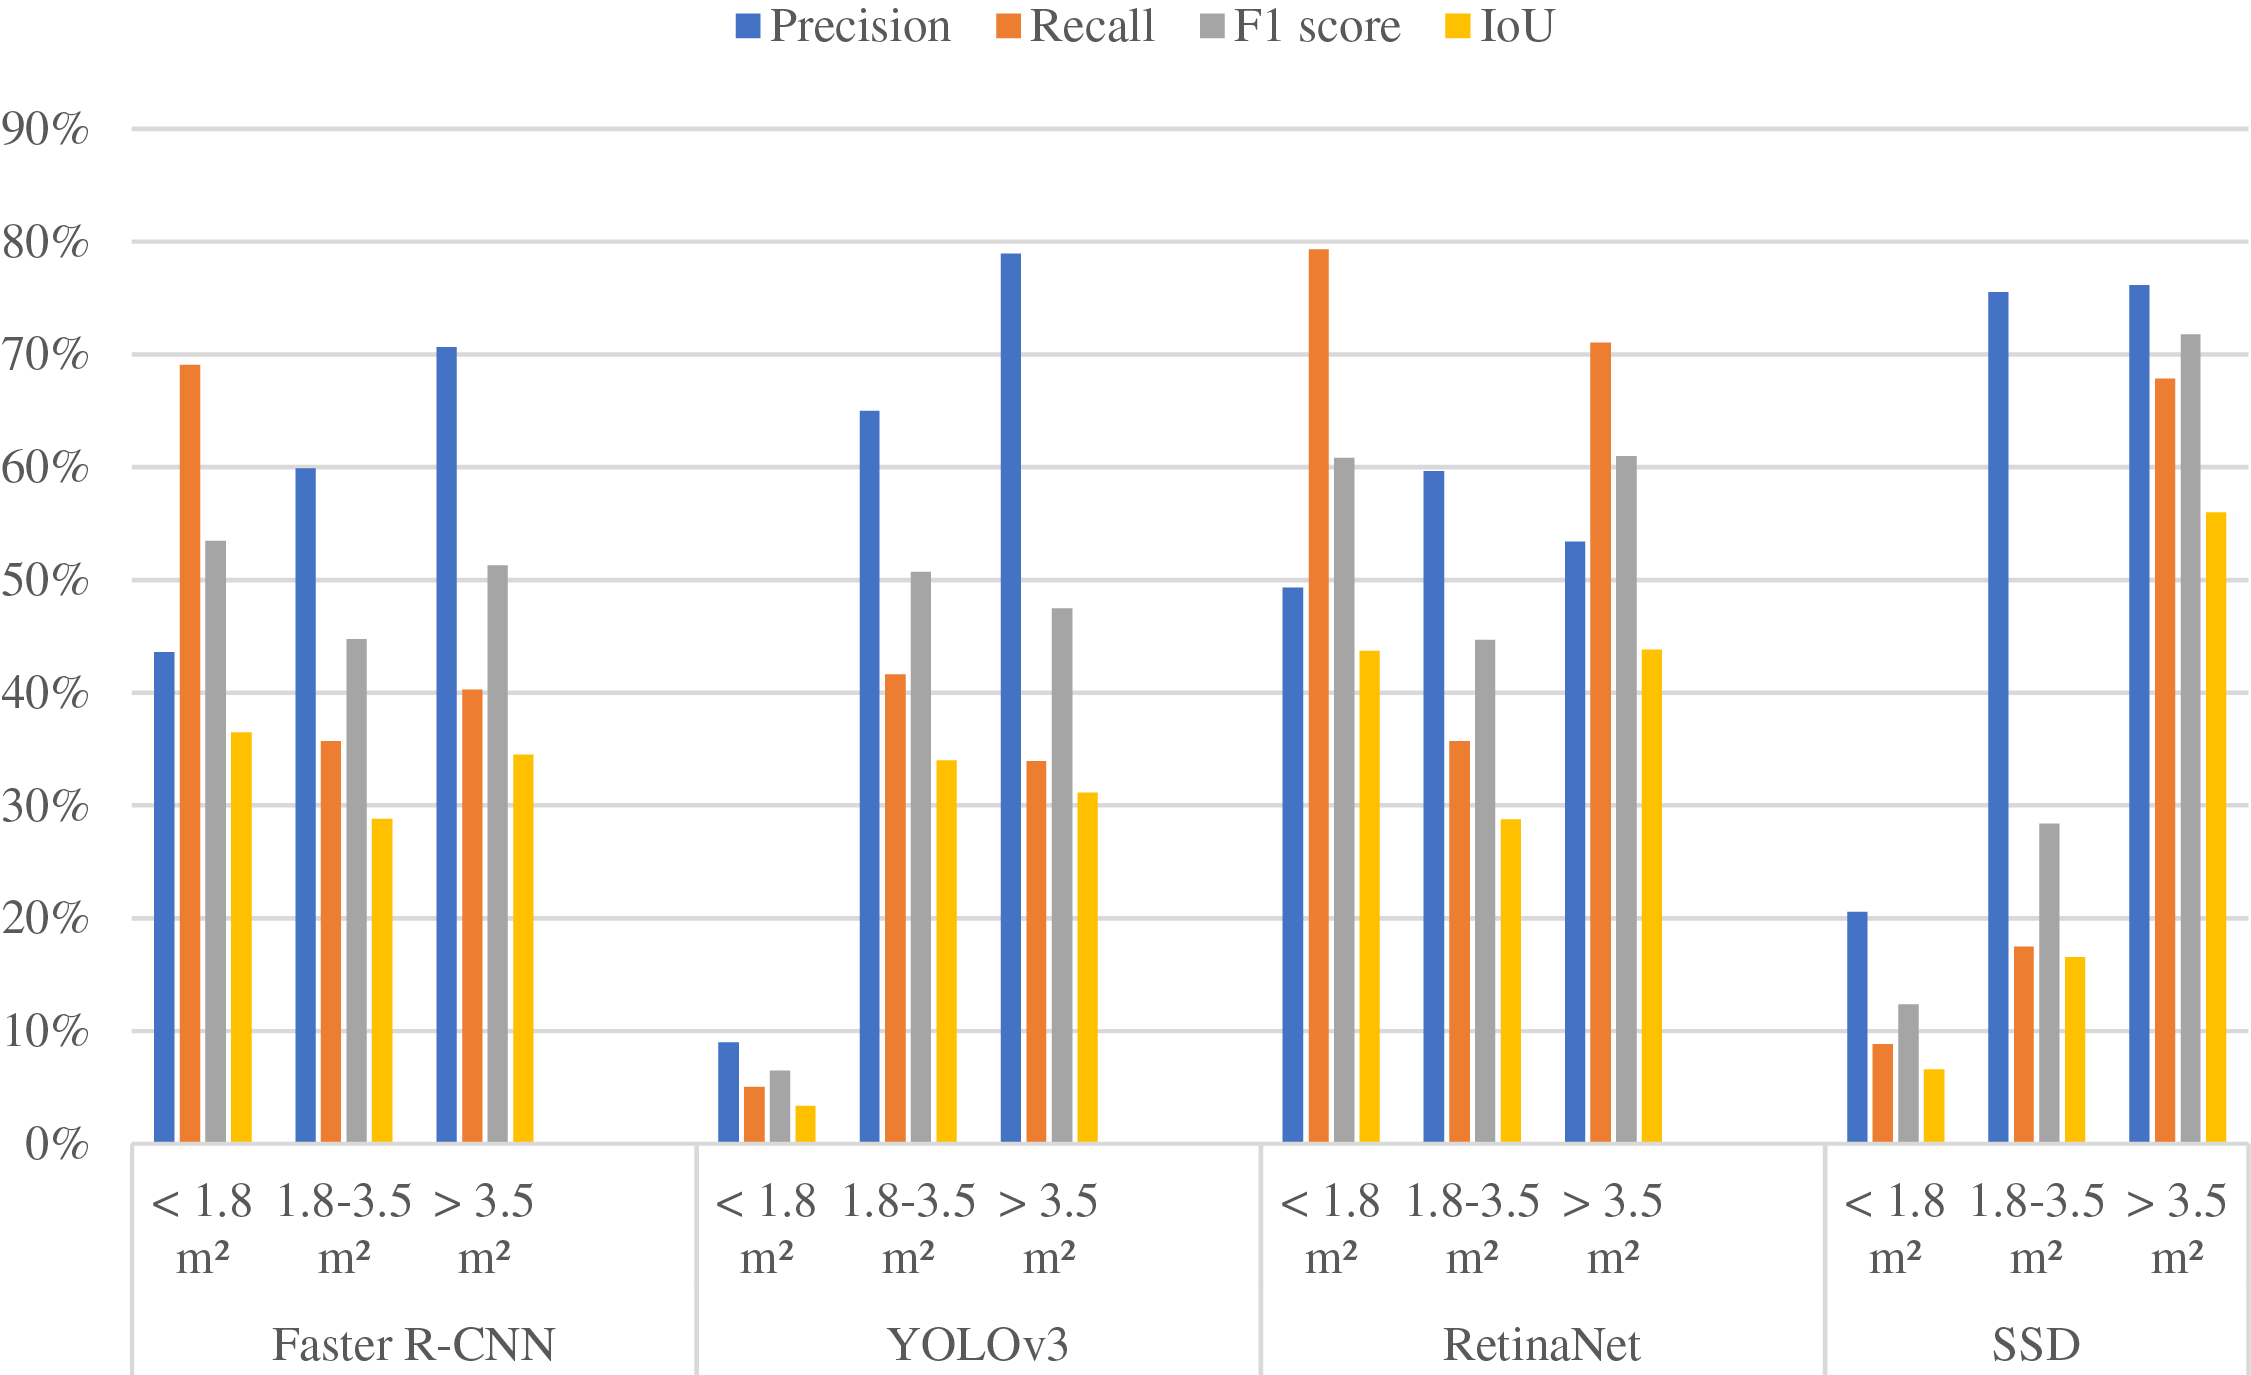
Figure 13: Evaluation metric values for different banana canopy levels using the four machine learning
4.3 Grayscale Image for Improved Banana Detection
Deep learning has significantly advanced object detection and become an essential tool for crop monitoring. However, the intercropping of banana and betel nut trees, along with the visual similarity between banana seedlings and surrounding weeds, presents notable challenges for accurate detection. To address these issues, this study implemented grayscale conversion as an additional preprocessing step. This transformation reduces spectral complexity by converting RGB images into single-channel luminance representations, thereby mitigating chromatic inconsistencies that may interfere with feature extraction and classification. Grayscale values were computed using the standard luminance-preserving formula: Gray = 0.299 × R + 0.587 × G + 0.114 × B. This preprocessing method serves two main purposes: (1) it reduces computational complexity by lowering input dimensionality, thus improving training efficiency on hardware-constrained UAV platforms; and (2) it suppresses colour-based noise, enabling detection models to exploit better structural and textural cues essential for identifying small, partially occluded banana plants.
Since the detection models selected for evaluation (YOLOv3, Faster R-CNN, RetinaNet, and SSD) require three-channel inputs, each single-channel grayscale image was replicated across the RGB channels, producing a three-channel grayscale image compatible with the models’ pretrained CNN backbones (Darknet-53, ResNet-50, and VGG-16). This replication preserves network architecture, maintains pretrained weights, and supports efficient training. Consequently, the models can effectively learn luminance-based structural and textural features, crucial for accurate detection in visually complex agricultural environments.
To compare the performance differences of deep learning methods in banana detection using RGB and grayscale images, this study evaluates the convergence of the cost function for each model by examining the loss. As shown in Fig. 14, RetinaNet begins to converge around the 300th batch, with the final training loss and validation loss remaining close to each other. This indicates a stable learning process, with the training and validation loss curves aligning well and no evident signs of overfitting. In contrast, Faster R-CNN and SSD exhibit overfitting, as evidenced by significant discrepancies between training and validation loss curves, suggesting notable learning errors and instability between the training and validation datasets. When the training and validation loss curves are inconsistent, it often implies insufficient generalization capability of the model on unseen images, thereby reducing its reliability in real-world applications. Specifically, the validation loss curve of Faster R-CNN shows considerable fluctuations, reflecting instability during training. SSD, on the other hand, demonstrates an incomplete convergence of the loss curve, indicating a potential risk of overfitting as well. Although YOLOv3 does not exhibit severe overfitting, a slight difference still exists between its training and validation losses, suggesting that the model’s performance is not entirely consistent across datasets. Moreover, YOLOv3 has the highest loss among the four models, possibly indicating its limited capability in detecting certain banana features. Overall, all four detection models show better training and validation performance when using grayscale images compared to RGB images. This is attributed to the reduction of color interference and the enhancement of shape and texture features in grayscale imagery. Notably, RetinaNet not only achieves the lowest loss value on grayscale images but also successfully avoids overfitting. It effectively balances the detection of bananas of various sizes, demonstrating the robustness of single-stage models combined with Focal Loss in addressing class imbalance and small object detection tasks.
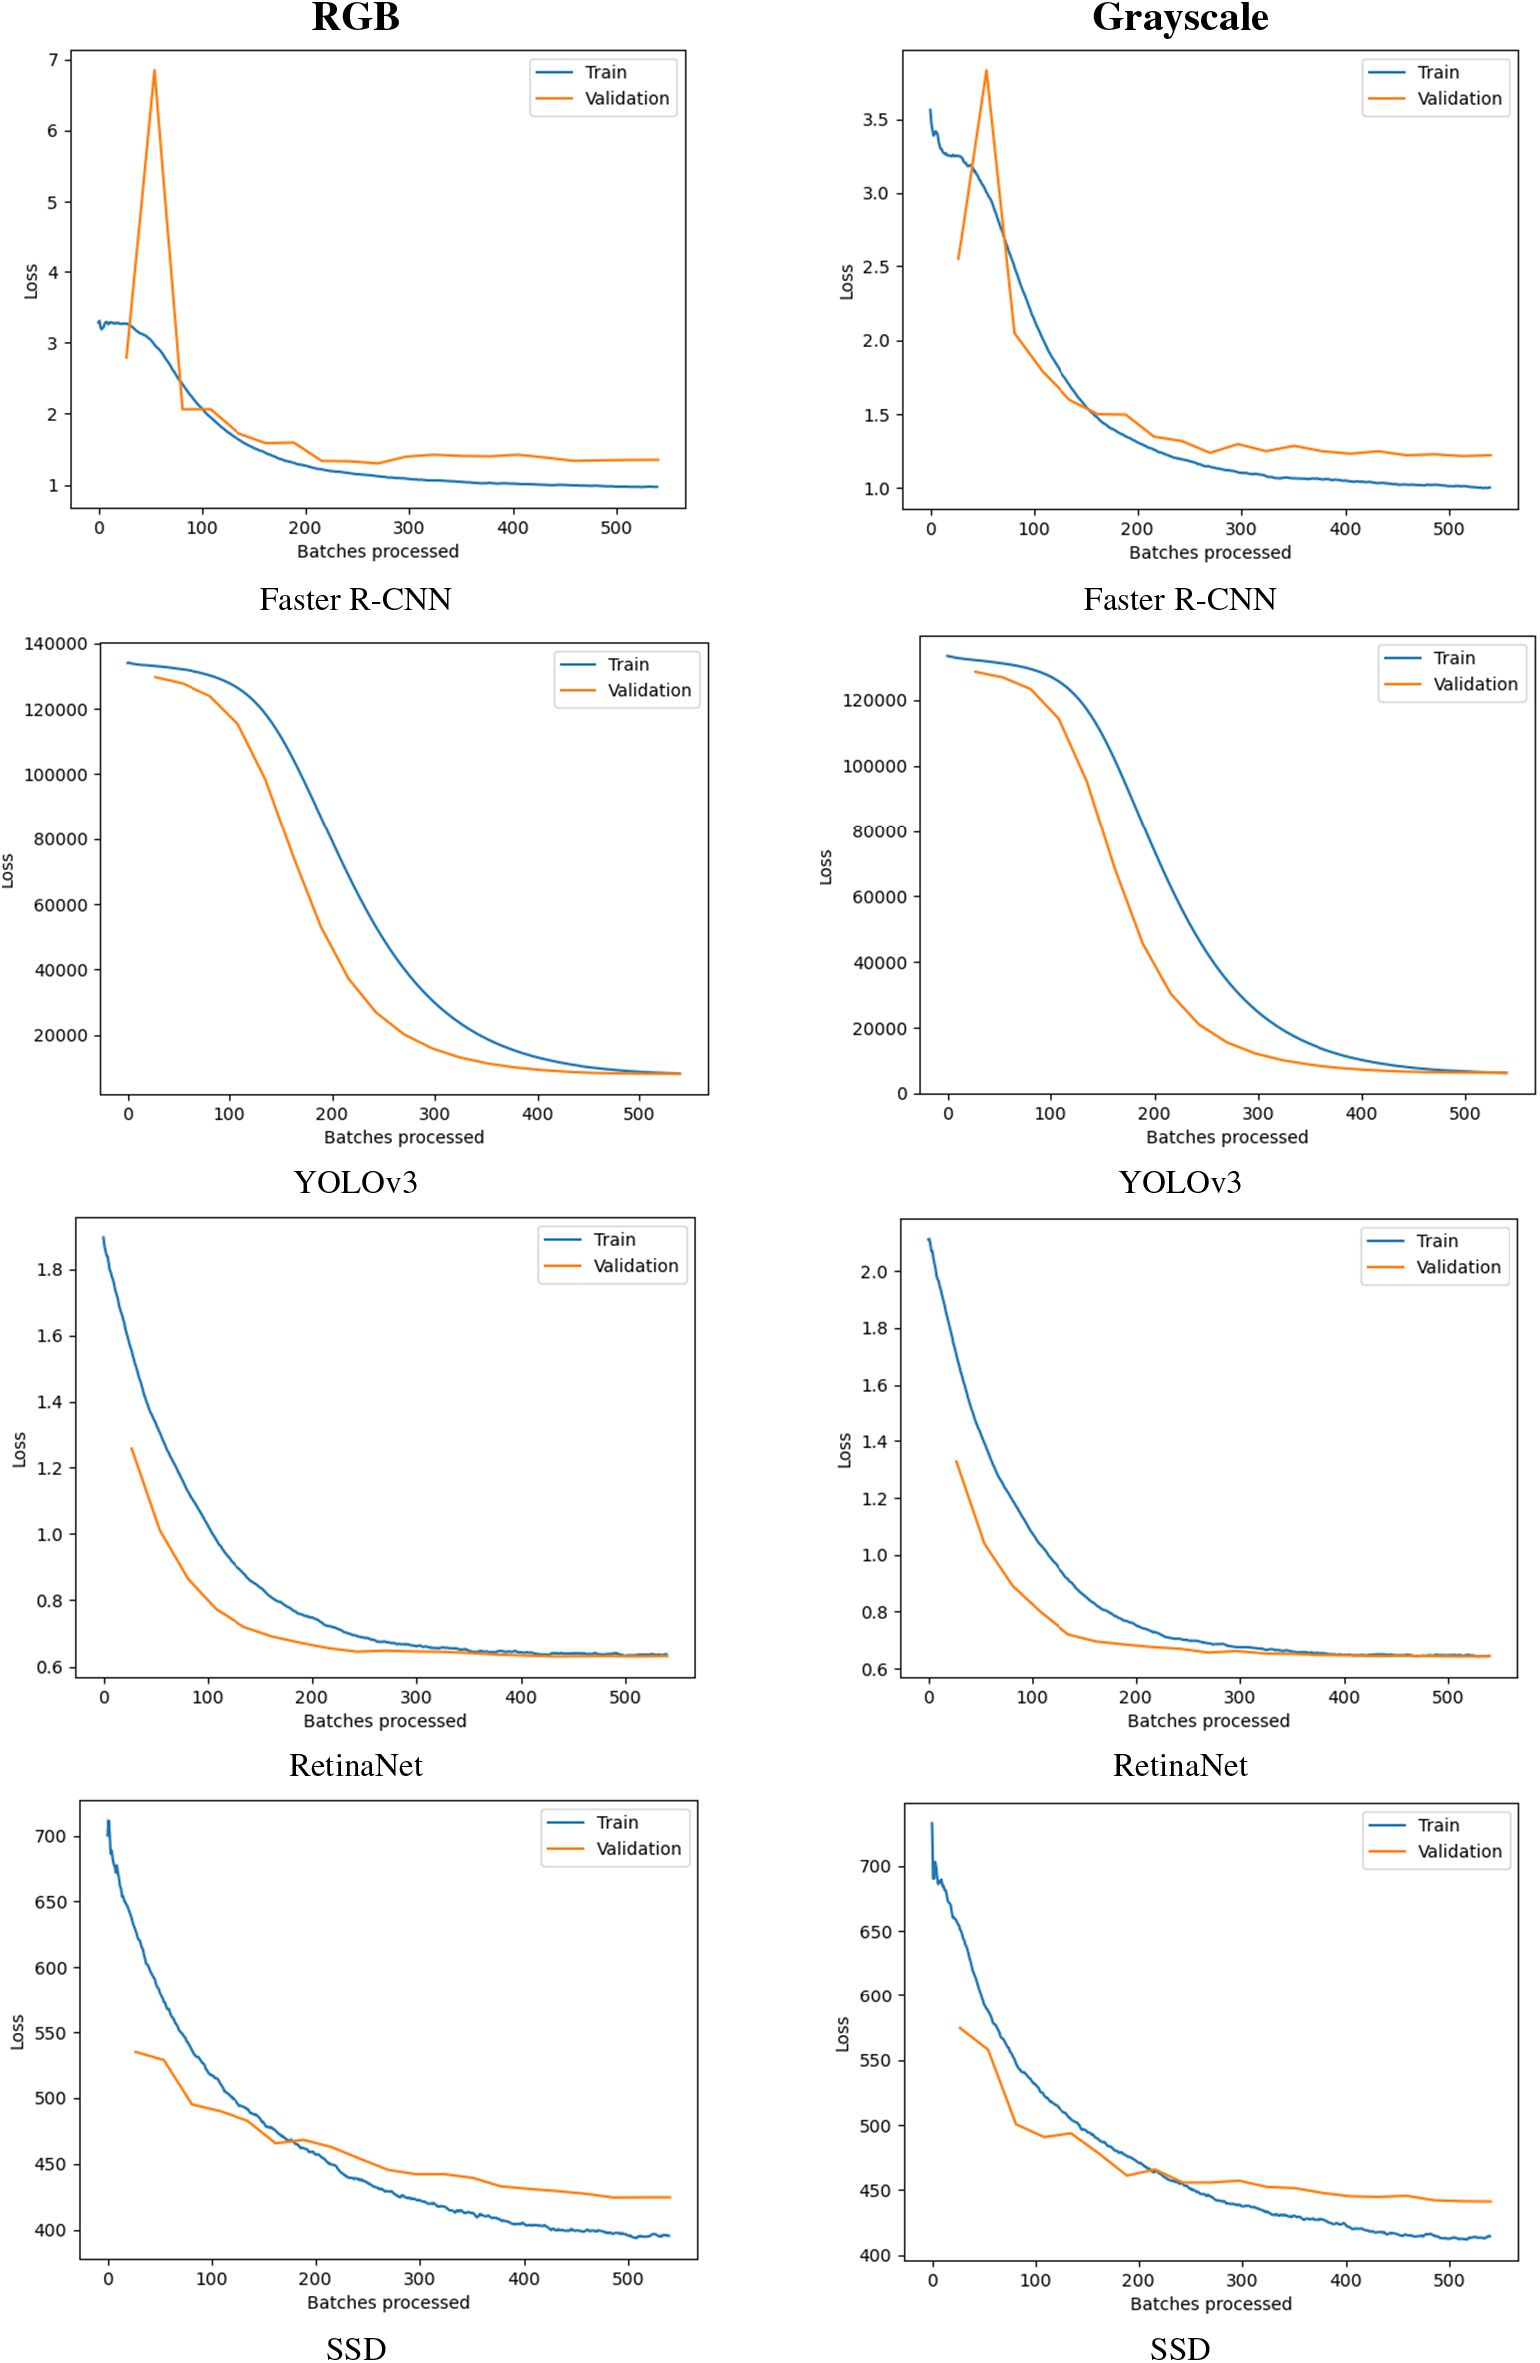
Figure 14: Training and validation loss of the four models on RGB and grayscale image
Fig. 15 presents the results of banana detection using grayscale images across the four models examined in this study. Overall, the experimental findings indicate that detection performance with grayscale images generally surpasses that with RGB images, particularly in identifying banana seedlings, where notable improvements were observed. Among the models, RetinaNet demonstrated the most significant enhancement under grayscale input. Specifically, the number of true positives (TP) increased by 120, while false positives (FP) decreased by 20. Although false negatives (FN) slightly increased by 18, the overall detection performance still showed an upward trend.
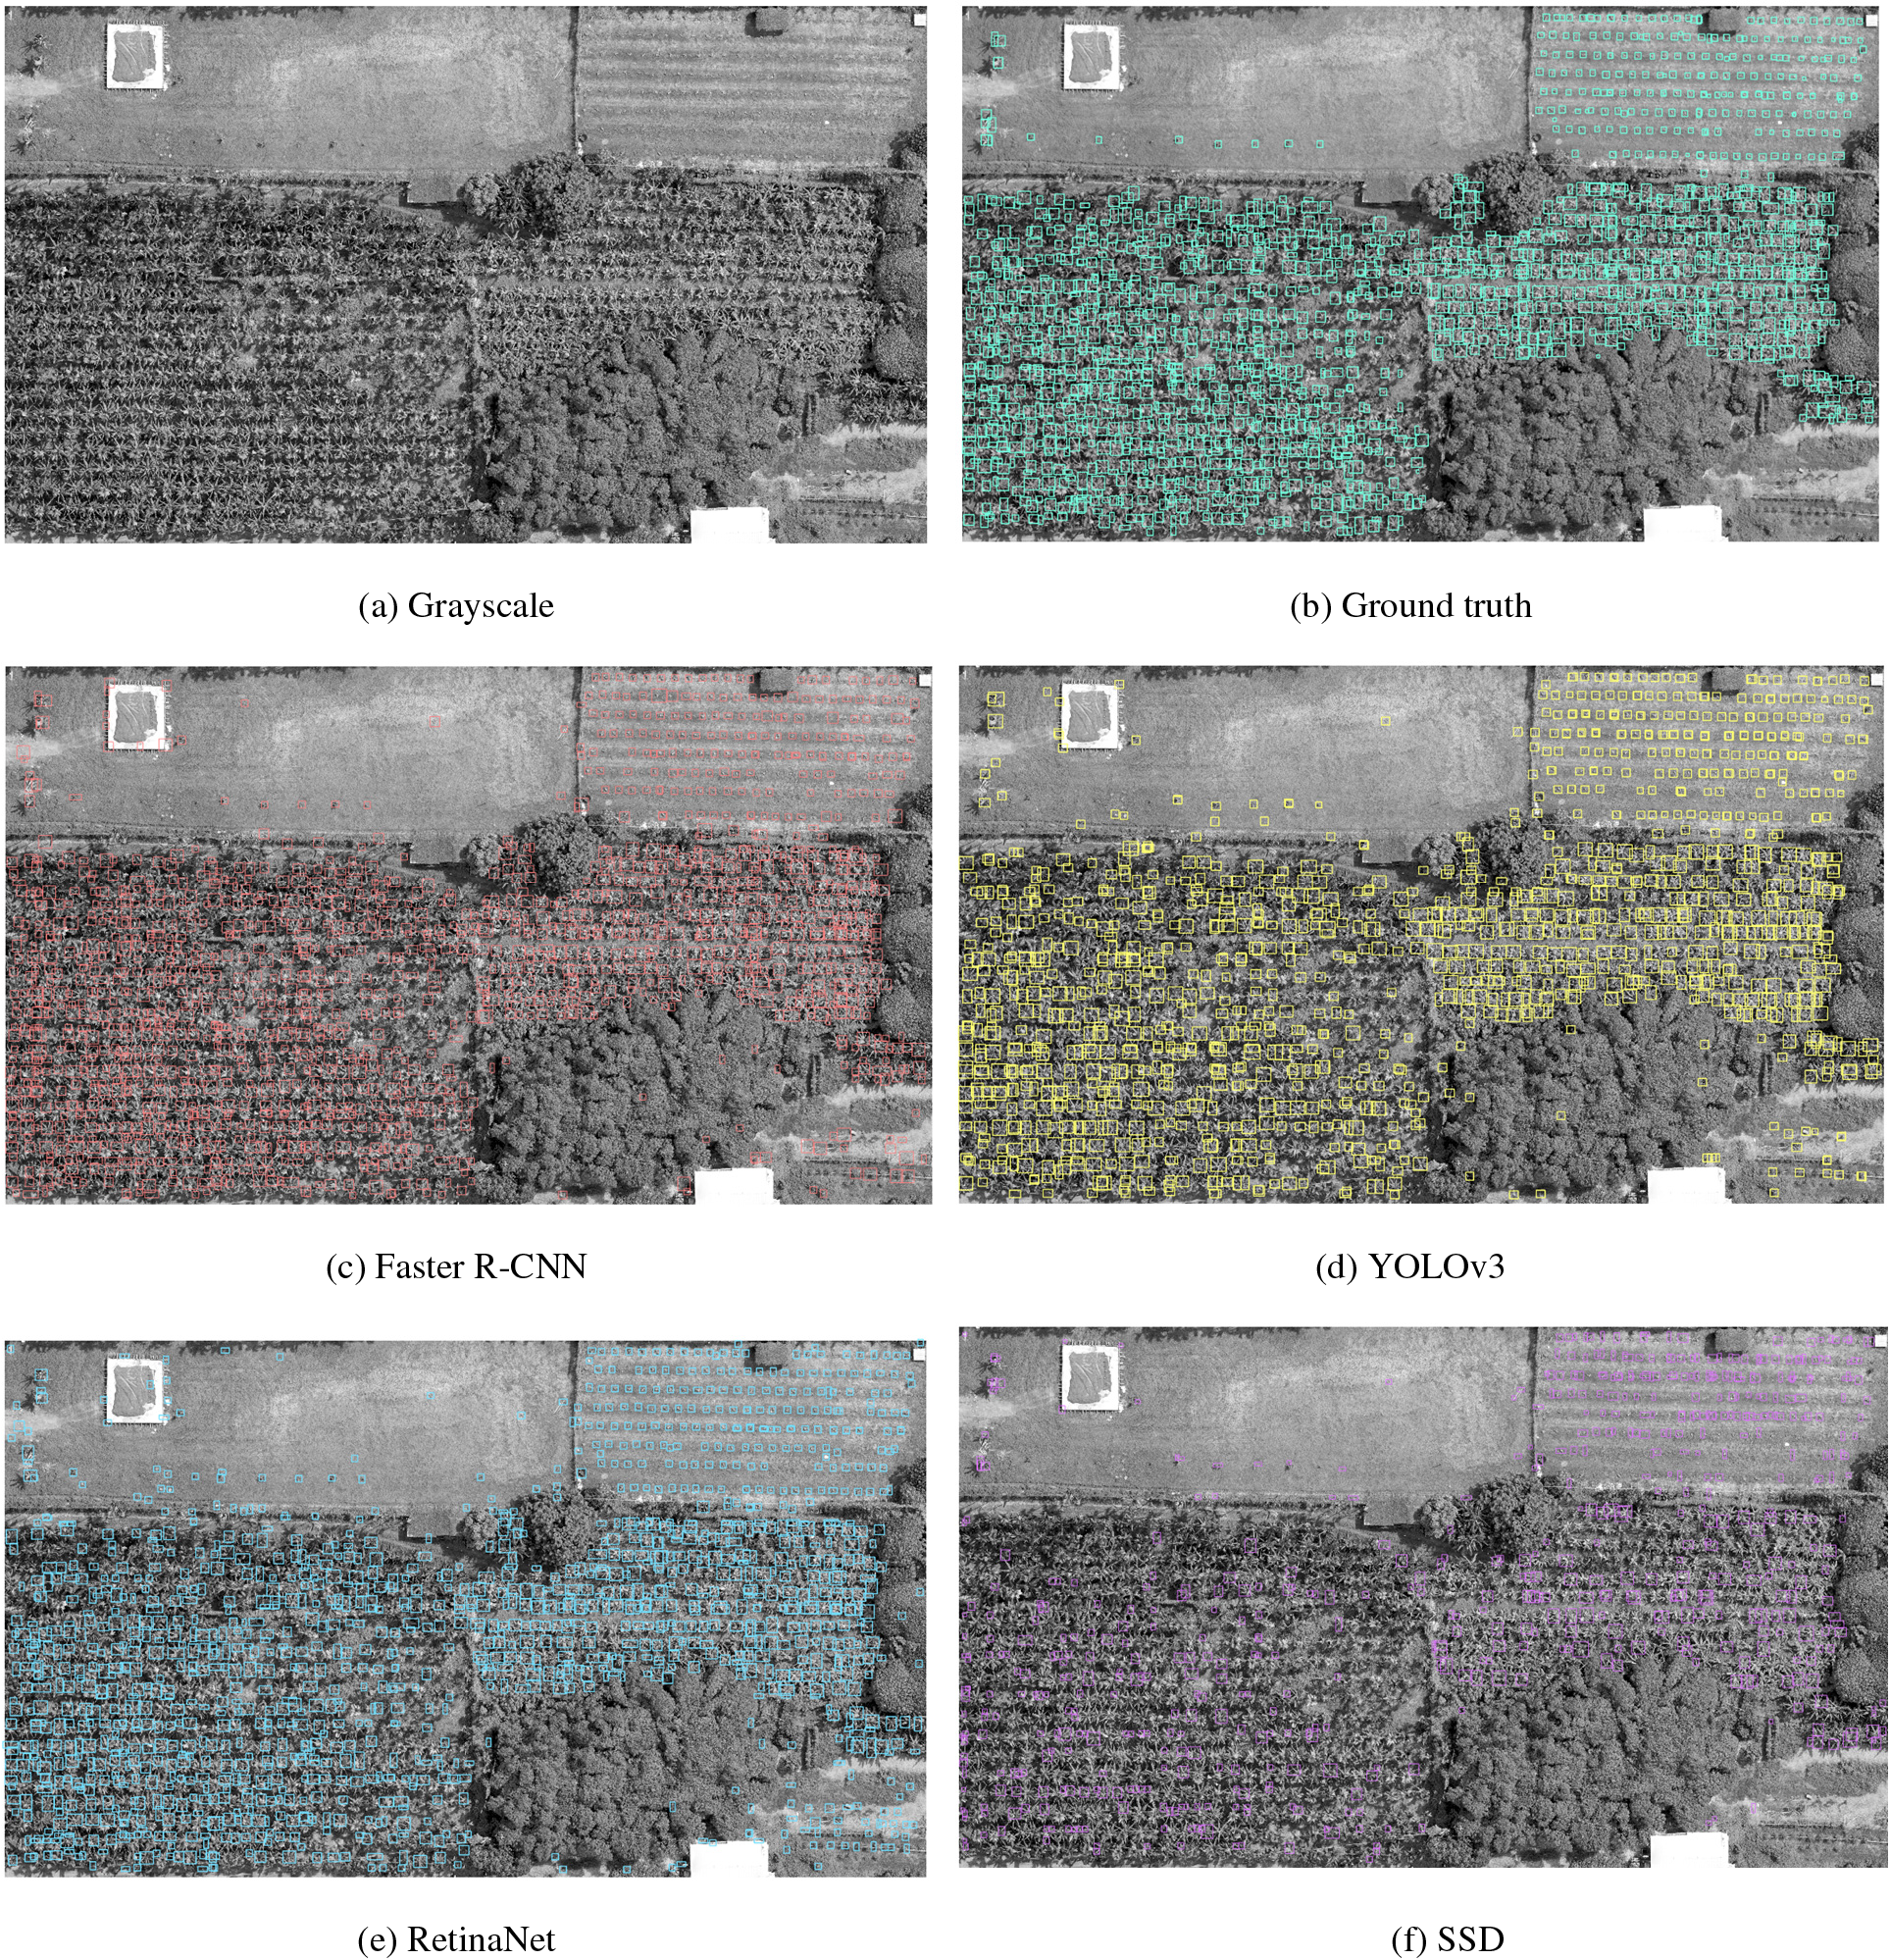
Figure 15: Banana detection results using four models on grayscale images
To further evaluate the impact of image type on banana detection performance, this study compared five standard metrics: Precision, Recall, F1 score, AP, and IoU, across four object detection models using both RGB and grayscale images (Table 9). The results demonstrate that all models exhibited superior performance with grayscale images, indicating enhanced detection stability and accuracy when color information was minimized. Among the models, RetinaNet achieved the highest performance across all metrics under grayscale input, with a Precision of 94%, Recall of 68%, F1 score of 0.79, and AP of 0.66. These results represent a significant improvement over its performance on RGB images, highlighting the efficacy of grayscale preprocessing for enhancing object detection. Faster R-CNN and YOLOv3 also showed noticeable performance gains with grayscale inputs, particularly in Recall, reflecting improved sensitivity to banana targets. In contrast, SSD consistently yielded the lowest detection performance among the four models across both image types. Nevertheless, SSD exhibited marginal performance improvements when utilizing grayscale images, suggesting that grayscale preprocessing can benefit even less robust architectures.

The observed performance enhancement with grayscale images is particularly relevant given the high visual similarity in both color and shape between banana and betel nut leaves in the study context. This similarity makes object discrimination using RGB images more challenging. By retaining luminance while removing color information, grayscale images enabled the models to distinguish shape and texture features of the target crops more effectively. As a result, all four models achieved their highest overall performance with grayscale inputs, yielding a mean Average Precision (AP) of 0.78 and an average F1 score of 0.72. These results indicate that incorporating grayscale conversion improved classification performance under high-noise conditions, with higher AP, F1 score, and precision compared to using RGB inputs alone.
4.4 Practical Implications and Limitations
The findings of this study offer several valuable implications for precision agriculture and UAV-based crop monitoring in real-world agricultural settings. The demonstrated advantage of grayscale preprocessing in enhancing detection performance, especially for small and visually similar objects such as banana seedlings, highlights a promising direction for improving object recognition accuracy in complex planting environments, including densely vegetated or intercropped systems. Therefore, in combination with lightweight preprocessing techniques such as grayscale conversion, the proposed approach presents a cost-effective and scalable solution for crop surveillance, particularly in resource-constrained rural areas. By reducing computational complexity and enhancing model convergence, this strategy enables on-site or near-real-time monitoring, which supports timely decisions in farm management, pest control, and yield estimation.
While the results of this study provide valuable insights into the performance of deep learning-based object detection models for banana crop detection, several limitations must be acknowledged. First, the entire dataset was collected from a single site located in Pingtung County, Taiwan, under homogeneous environmental conditions. Although this controlled setting enabled consistent image quality and reliable evaluation, it also limits the generalizability of the findings to other regions or cropping systems with different climatic, topographic, or agronomic characteristics. Second, the banana varieties, cultivation practices, and intercropping patterns (with betel nut trees) analyzed in this study are representative of southern Taiwan’s agricultural context but may differ significantly from those in other banana-producing regions. Third, the UAV imagery was collected during a single flight under clear-sky conditions and consistent lighting. Variations in lighting, weather, or seasonal conditions, which are common in real-world agricultural monitoring, were not explicitly evaluated. Additionally, model training and evaluation were based on standard RGB images, with grayscale conversion applied as a preprocessing strategy. While this showed performance benefits in the current setting, its effectiveness in broader contexts remains to be validated. Finally, due to resource limitations, we did not explore domain adaptation techniques or transfer learning strategies that could help generalize the models across different environmental or geographic conditions. Future work should include multi-site data collection, varying agro-climatic conditions, and more diverse crop management scenarios to validate and extend the applicability of the proposed approach.
This study investigated the effectiveness of deep learning-based object detection models for banana crop identification using UAV-acquired imagery. By systematically evaluating Faster R-CNN, YOLOv3, RetinaNet, and SSD, we assessed their performance in detecting banana plants across different growth stages and under complex intercropping conditions with betel nuts. The results demonstrated that RetinaNet achieved the highest detection accuracy across all zones, particularly in identifying smaller and partially occluded banana plants. While this study successfully demonstrates the use of low-altitude UAV imagery and deep learning for banana crop detection, several limitations should be noted. The models struggled with small banana seedlings, particularly in Zone A, due to their small size and visual similarity to weeds, indicating that higher-resolution imaging or specialized detection techniques may be necessary. In Zone C, occlusions from betel nut trees and shadows reduced detection accuracy, which could potentially be improved through grayscale image processing technology. Lastly, since the model was trained specifically for banana plantations in Taiwan, expanding its application to other crops or regions would require additional training data and model adaptation.
Insights gained from this study may serve as a foundation for developing more advanced hybrid models that combine the strengths of both CNN-based and Transformer-based architectures. Recent advancements in object detection, particularly the emergence of YOLOv10/YOLOv11 and Transformer-based models such as DEtection TRansformer (DETR) and Swin Transformer, have demonstrated superior performance in complex scenes and small-object detection. These newer architectures will be incorporated into future work to further expand upon the findings of this study. In addition, multispectral imaging holds significant potential for improving the differentiation between banana and betel nut crops, particularly in intercropped environments. By capturing key vegetation indices and infrared reflectance characteristics, multispectral data enables more accurate and robust classification of crops with similar visual features. Therefore, integrating multispectral data into deep learning workflows could further enhance model performance in complex agricultural landscapes. Future research should explore hybrid approaches that combine UAV-based multispectral imaging with deep learning–based spectral analysis, aiming to improve classification accuracy under heterogeneous cropping conditions.
Acknowledgement: The authors would like to express their sincere gratitude to the Republic of China Naval Academy for providing the GPU (NVIDIA Quadro RTX 6000, 24 GB) and to the Republic of China Military Academy for providing the drone (DJI-FC3411) used in this research.
Funding Statement: The authors received no specific funding for this study.
Author Contributions: The authors confirm their contribution to the paper as follows: Ching-Lung Fan: study design and supervision, drafted the manuscript, and revised the manuscript. Yu-Jen Chung: performed data analysis and interpretation. Shan-Min Yen: data collection and investigation. All authors reviewed the results and approved the final version of the manuscript.
Availability of Data and Materials: Data is available on request from the authors.
Ethics Approval: This study did not involve human or animal subjects; therefore, ethical approval was not required.
Conflicts of Interest: The authors declare no conflicts of interest to report regarding the present study.
References
1. Kussul N, Lemoine G, Gallego FJ, Skakun SV, Lavreniuk M, Shelestov AY. Parcel-based crop classification in Ukraine using Landsat-8 data and Sentinel-1A data. IEEE J Sel Top Appl Earth Obs Remote Sens. 2016;9:2500–8. doi:10.1109/JSTARS.2016.2560141. [Google Scholar] [CrossRef]
2. Adrian J, Sagan V, Maimaitijiang M. Sentinel SAR-optical fusion for crop type mapping using deep learning and Google Earth Engine. ISPRS J Photogramm Remote Sens. 2021;175:215–35. doi:10.1016/j.isprsjprs.2021.02.018. [Google Scholar] [CrossRef]
3. Yan Y, Ryu Y. Exploring google street view with deep learning for crop type mapping. ISPRS J Photogramm Remote Sens. 2021;171:278–96. doi:10.1016/j.isprsjprs.2020.11.022. [Google Scholar] [CrossRef]
4. Bouguettaya A, Zarzour H, Kechida A, Taberkit AM. Deep learning techniques to classify agricultural crops through UAV imagery: a review. Neural Comput Appl. 2022;34:9511–36. doi:10.1007/s00521-022-07104-9. [Google Scholar] [PubMed] [CrossRef]
5. Zhou L, Kong M, Liu Z, Li L. Vision sensor-based SLAM problem for small UAVs in dynamic indoor environments. Comput Animat Virtual Worlds. 2022;33:e2088. doi:10.1002/cav.2088. [Google Scholar] [CrossRef]
6. Nex F, Remondino F. UAV for 3D mapping applications: a review. Appl Geomat. 2014;6:1–15. doi:10.1007/s12518-013-0120-x. [Google Scholar] [CrossRef]
7. Lin Y, Hyyppä J, Jaakkola A. Mini-UAV-borne LIDAR for fine-scale mapping. IEEE Geosci Remote Sens Lett. 2010;8:426–30. doi:10.1109/LGRS.2010.2079913. [Google Scholar] [CrossRef]
8. Mulla DJ. Twenty-five years of remote sensing in precision agriculture: key advances and remaining knowledge gaps. Biosyst Eng. 2013;114:358–71. doi:10.1016/j.biosystemseng.2012.08.009. [Google Scholar] [CrossRef]
9. Catania P, Ferro MV, Orlando S, Vallone M. Grapevine and cover crop spectral response to evaluate vineyard spatio-temporal variability. Sci Hortic. 2025;339:113844. doi:10.1016/j.scienta.2024.113844. [Google Scholar] [CrossRef]
10. Ferro MV, Sørensen CG, Catania P. Comparison of different computer vision methods for vineyard canopy detection using UAV multispectral images. Comput Electron Agric. 2024;225:109277. doi:10.1016/j.compag.2024.109277. [Google Scholar] [CrossRef]
11. Zhang D, Ding Y, Chen P, Zhang X, Pan Z, Liang D. Automatic extraction of wheat lodging area based on transfer learning method and deeplabv3+ network. Comput Electron Agric. 2020;179:105845. doi:10.1016/j.compag.2020.105845. [Google Scholar] [CrossRef]
12. Hassan MA, Yang M, Rasheed A, Yang G, Reynolds M, Xia X, et al. A rapid monitoring of NDVI across the wheat growth cycle for grain yield prediction using a multi-spectral UAV platform. Plant Sci. 2019;282:95–103. doi:10.1016/j.plantsci.2018.10.022. [Google Scholar] [PubMed] [CrossRef]
13. Wang F, Yi Q, Hu J, Xie L, Yao X, Xu T, et al. Combining spectral and textural information in UAV hyperspectral images to estimate rice grain yield. Int J Appl Earth Obs Geoinf. 2021;102:102397. doi:10.1016/j.jag.2021.102397. [Google Scholar] [CrossRef]
14. Guo X, Feng Q, Guo F. CMTNet: a hybrid CNN-transformer network for UAV-based hyperspectral crop classification in precision agriculture. Sci Rep. 2025;15(1):12383. doi:10.1038/s41598-025-97052-w. [Google Scholar] [PubMed] [CrossRef]
15. Martins RN, de Carvalho Pinto FDA, de Queiroz DM, Valente DSM, Rosas JTF, Portes MF, et al. Digital mapping of coffee ripeness using UAV-based multispectral imagery. Comput Electron Agric. 2023;204:107499. doi:10.1016/j.compag.2022.107499. [Google Scholar] [CrossRef]
16. Fan CL, Chung YJ. Integrating image processing technology and deep learning to identify crops in UAV orthoimages. Comput Mater Contin. 2025;82(2):1925–45. doi:10.32604/cmc.2025.059245. [Google Scholar] [CrossRef]
17. Cheng Z, Yang Q, Sheng B. Deep colorization. In: Proceedings of the IEEE International Conference on Computer Vision. Santiago, Chile: IEEE; 2015. p. 415–23. [Google Scholar]
18. Pang Y, Shi Y, Gao S, Jiang F, Veeranampalayam-Sivakumar AN, Thompson L, et al. Improved crop row detection with deep neural network for early-season maize stand count in UAV imagery. Comput Electron Agric. 2020;178:105766. doi:10.1016/j.compag.2020.105766. [Google Scholar] [CrossRef]
19. Yang Q, Shi L, Han J, Zha Y, Zhu P. Deep convolutional neural networks for rice grain yield estimation at the ripening stage using UAV-based remotely sensed images. Field Crops Res. 2019;235:142–53. doi:10.1016/j.fcr.2019.02.022. [Google Scholar] [CrossRef]
20. Chen Y, Lee WS, Gan H, Peres N, Fraisse C, Zhang Y, et al. Strawberry yield prediction based on a deep neural network using high-resolution aerial orthoimages. Remote Sens. 2019;11(13):1584. doi:10.3390/rs11131584. [Google Scholar] [CrossRef]
21. Feng A, Zhou J, Vories E, Sudduth KA. Evaluation of cotton emergence using UAV-based imagery and deep learning. Comput Electron Agric. 2020;177:105711. doi:10.1016/j.compag.2020.105711. [Google Scholar] [CrossRef]
22. Maimaitijiang M, Sagan V, Sidike P, Hartling S, Esposito F, Fritschi FB. Soybean yield prediction from UAV using multimodal data fusion and deep learning. Remote Sens Environ. 2020;237:111599. doi:10.1016/j.rse.2019.111599. [Google Scholar] [CrossRef]
23. Lu Y, Young S. A survey of public datasets for computer vision tasks in precision agriculture. Comput Electron Agric. 2020;178:105760. doi:10.1016/j.compag.2020.105760. [Google Scholar] [CrossRef]
24. Mittal P, Singh R, Sharma A. Deep learning-based object detection in low-altitude UAV datasets: a survey. Image Vis Comput. 2020;104:104046. doi:10.1016/j.imavis.2020.104046. [Google Scholar] [CrossRef]
25. Neupane B, Horanont T, Hung ND. Deep learning based banana plant detection and counting using high-resolution red-green-blue (RGB) images collected from unmanned aerial vehicle (UAV). PLoS One. 2019;14(10):e0223906. doi:10.1371/journal.pone.0223906. [Google Scholar] [PubMed] [CrossRef]
26. Santos AAD, Marcato Junior J, Araújo MS, Di Martini DR, Tetila EC, Siqueira HL, et al. Assessment of CNN-based methods for individual tree detection on images captured by RGB cameras attached to UAVs. Sensors. 2019;19(16):3595. doi:10.3390/s19163595. [Google Scholar] [PubMed] [CrossRef]
27. He MX, Hao P, Xin YZ. A robust method for wheatear detection using UAV in natural scenes. IEEE Access. 2020;8:189043–53. doi:10.1109/ACCESS.2020.3031896. [Google Scholar] [CrossRef]
28. Osco LP, De Arruda MDS, Junior JM, Da Silva NB, Ramos APM, Moryia ÉAS, et al. A convolutional neural network approach for counting and geolocating citrus-trees in UAV multispectral imagery. ISPRS J Photogramm Remote Sens. 2020;160:97–106. doi:10.1016/j.isprsjprs.2019.12.010. [Google Scholar] [CrossRef]
29. Tian Y, Yang G, Wang Z, Wang H, Li E, Liang Z. Apple detection during different growth stages in orchards using the improved YOLO-V3 model. Comput Electron Agric. 2019;157:417–26. doi:10.1016/j.compag.2019.01.012. [Google Scholar] [CrossRef]
30. Gonzalez-Perez A, Abd-Elrahman A, Wilkinson B, Johnson DJ, Carthy RR. Deep and machine learning image classification of coastal wetlands using unpiloted aircraft system multispectral images and lidar datasets. Remote Sens. 2022;14(16):3937. doi:10.3390/rs14163937. [Google Scholar] [CrossRef]
31. Ren S, He K, Girshick R, Sun J. Faster R-CNN: towards real-time object detection with region proposal networks. IEEE Trans Pattern Anal Mach Intell. 2016;39(6):1137–49. doi:10.1109/TPAMI.2016.2577031. [Google Scholar] [PubMed] [CrossRef]
32. Redmon J, Divvala S, Girshick R, Farhadi A. You only look once: unified, real-time object detection. In: Proceedings of the IEEE Conference on Computer Vision and Pattern Recognition. Las Vegas, NV, USA: IEEE; 2016. p. 779–88. [Google Scholar]
33. Redmon J, Farhadi A. Yolov3: an incremental improvement. arXiv:1804.02767. 2018. [Google Scholar]
34. Lin TY, Goyal P, Girshick R, He K, Dollár P. Focal loss for dense object detection. In: Proceedings of the IEEE International Conference on Computer Vision. Venice, Italy: IEEE; 2017. p. 2980–8. [Google Scholar]
35. Liu W, Anguelov D, Erhan D, Szegedy C, Reed S, Fu CY, et al. SSD: single shot multibox detector. In: Proceedings of the 14th European Conference on Computer Vision (ECCV 2016). Amsterdam, Netherlands; 2016. p. 21–37. [Google Scholar]
Cite This Article
 Copyright © 2025 The Author(s). Published by Tech Science Press.
This work is licensed under a Creative Commons Attribution 4.0 International License , which permits unrestricted use, distribution, and reproduction in any medium, provided the original work is properly cited.
 Downloads
 Citation Tools