
 Submit a Paper
 Propose a Special lssue
 Open Access
REVIEW

Exploring the Effectiveness of Machine Learning and Deep Learning Algorithms for Sentiment Analysis: A Systematic Literature Review
1 School of Computer Science and Engineering, The University of Aizu, Aizuwakamatsu, 965-8580, Japan
2 Department of Computer Science and Engineering, Uttara University, Dhaka, 1230, Bangladesh
3 Department of Computer Engineering, Chosun University, Gwangju, 61452, Republic of Korea
* Corresponding Authors: Jungpil Shin. Email: ; Pankoo Kim. Email:
Computers, Materials & Continua 2025, 84(3), 4105-4153. https://doi.org/10.32604/cmc.2025.066910
Received 20 April 2025; Accepted 20 June 2025; Issue published 30 July 2025
 View Full Text
 Download PDF
Abstract
Sentiment Analysis, a significant domain within Natural Language Processing (NLP), focuses on extracting and interpreting subjective information—such as emotions, opinions, and attitudes—from textual data. With the increasing volume of user-generated content on social media and digital platforms, sentiment analysis has become essential for deriving actionable insights across various sectors. This study presents a systematic literature review of sentiment analysis methodologies, encompassing traditional machine learning algorithms, lexicon-based approaches, and recent advancements in deep learning techniques. The review follows a structured protocol comprising three phases: planning, execution, and analysis/reporting. During the execution phase, 67 peer-reviewed articles were initially retrieved, with 25 meeting predefined inclusion and exclusion criteria. The analysis phase involved a detailed examination of each study’s methodology, experimental setup, and key contributions. Among the deep learning models evaluated, Long Short-Term Memory (LSTM) networks were identified as the most frequently adopted architecture for sentiment classification tasks. This review highlights current trends, technical challenges, and emerging opportunities in the field, providing valuable guidance for future research and development in applications such as market analysis, public health monitoring, financial forecasting, and crisis management.Keywords
Supplementary Material
Supplementary Material FileSentiment Analysis, a powerful technique within the field of NLP, is dedicated to understanding and analyzing the emotions and opinions expressed in textual data. NLP utilizes a range of approaches, such as Machine Learning Algorithms such as Support Vector Machine (SVM), Naive Bayes [1], Latent Dirichlet Allocation (LDA) [2], Deep Learning Models e.g., Long Short-Term Memory (LSTM) [3], Bidirectional Encoder Representations from Transformers (BERT) [4], Recursive Neural Tensor Network (RNTN) [5], and lexicon-based methods, to effectively process and analyze text and classify sentiments accurately [6,7]. At the beginning of 2000, sentiment analysis emerged as a prominent and actively researched field within NLP. It grew and encompassed fields other than computer science, e.g., management science, social science, etc. [8]. The integration of computing and electronic documents facilitated the rapid adoption of content analysis. Computers automated the laborious counting process, giving a list of keywords or dictionaries, leading to significant speed enhancements. By the late 1960s, the research community had developed software and dictionaries, such as the General Inquirer, enabling systematic content analysis across various domains like politics, health, and marketing [9]. A study found that 81% of Internet users have done online research on a product at least once [10]. This research habit of users provides a huge amount of data that can be used to track what they want in a certain product. At the present time, the sheer volume of text data has increased by several folds due to the use of social media, especially through short message chat and microblogging [11]. A different study shows that the number of research articles having ‘sentiment analysis in social networks’ in their title increased by 34% every year from 2008 to 2022 [12]. Most of the social media data consists of informal and short text, analyzing these texts has become a challenge due to the lack of context [13–15]. However, current sentiment analysis techniques go beyond traditional text analysis by delving into the underlying emotions, attitudes, and opinions people express in their words [16] after tackling the previously mentioned challenges. Sentiment analysis can be performed on three different levels, document level, sentence level, and aspect level. Document level and sentence level analyses classify the sentiment as positive, negative, or neutral whereas the aspect level delves even deeper into the document or sentence and analyzes it more thoroughly to provide an aspect-based opinion [17]. Text in languages other than English is also being actively researched and shows promising results [18], Public sentiment exhibits a significant correlation with stock price movements, and incorporating public sentiment into forecasting models enhances the accuracy of future stock price predictions [19]. As the volume of data continues to grow exponentially, the demand for automated sentiment analysis tools and techniques continues to surge [20]. Sentiment Analysis has a wide range of applications across industries and domains. It can be utilized to understand the emotional state of people after a major natural disaster or accident. The governing body can use this data to take necessary action for the well-being of people. During the Covid-19 pandemic, the country Croatia faced 2 earthquakes in their densely populated region. This caused property damage and the death of its citizens. The scar left by this disaster can still be felt by analyzing the social media posts of the citizens [21]. In a survey conducted in 2020, more than half of the companies (54%) reported implementing sentiment analysis technologies to analyze customer feedback from reviews and social media [22]. Market researchers utilize Sentiment Analysis to analyze public opinion and identify emerging trends. Social media platforms use it to monitor user sentiment and provide personalized content [12,23]. These are just a few examples of how Sentiment Analysis using NLP transforms how we understand and interact with text. As the field of NLP continues to advance and develop rapidly, it holds immense potential for transforming various domains, from customer service and market research to social media analytics and public opinion monitoring [24]. By unlocking the sentiments hidden within the plain text, we gain a deeper understanding of human experiences, emotions, and preferences, ultimately leading to more informed decision-making and improved user experiences [25]. According to a recent report, a noticeable disparity exists between the perception of customer satisfaction held by companies and the actual reality. While over 50% of businesses have the belief that their customers are content with their service and hold a favorable sentiment towards their brand, merely 15% of customers concur with this viewpoint [22]. The future of Sentiment Analysis using NLP promises to make technology more accessible and enable machines to communicate and collaborate with humans more intuitively and seamlessly [26]. The faster analysis speed of a model can make this collaboration even smoother. Reference [27] focuses on making a model that is able to provide 97% accuracy on the Twitter LLM dataset while also being fast. This paper represents a systematic review of sentiment analysis. Using this concept in AI applications can help us include brand monitoring, social media analysis, customer feedback analysis, market research, reputation management, and automated customer support. This can provide various valuable insights for businesses and organizations to understand public opinion, make data-driven decisions, and improve products and services based on customer sentiment. Each section and subsection of this study will present different types of aspects. In “Methodology,” research questions have been discussed, such as quality assessment, selection and search strategy, and other important processes that can help us conduct the research in an organized manner. “Results and Discussion” discusses the search results and observations. “Conclusion” provides a summary of this work, and finally “Limitations and Future Work” briefly presents the limitations of this study and the future possibilities for further research.
The research questions and project theme, as shown in Fig. 1, presented a base on this research’s project methodologies. The study’s methodology, which consisted of three stages: planning, conducting, and analysis/reporting, was influenced by the project’s goals and context [28]. The literature is searched during the conduction stage, and articles are identified or chosen following the inclusion and exclusion criteria. All selected papers are reviewed and analyzed during the analysis and reporting phase.
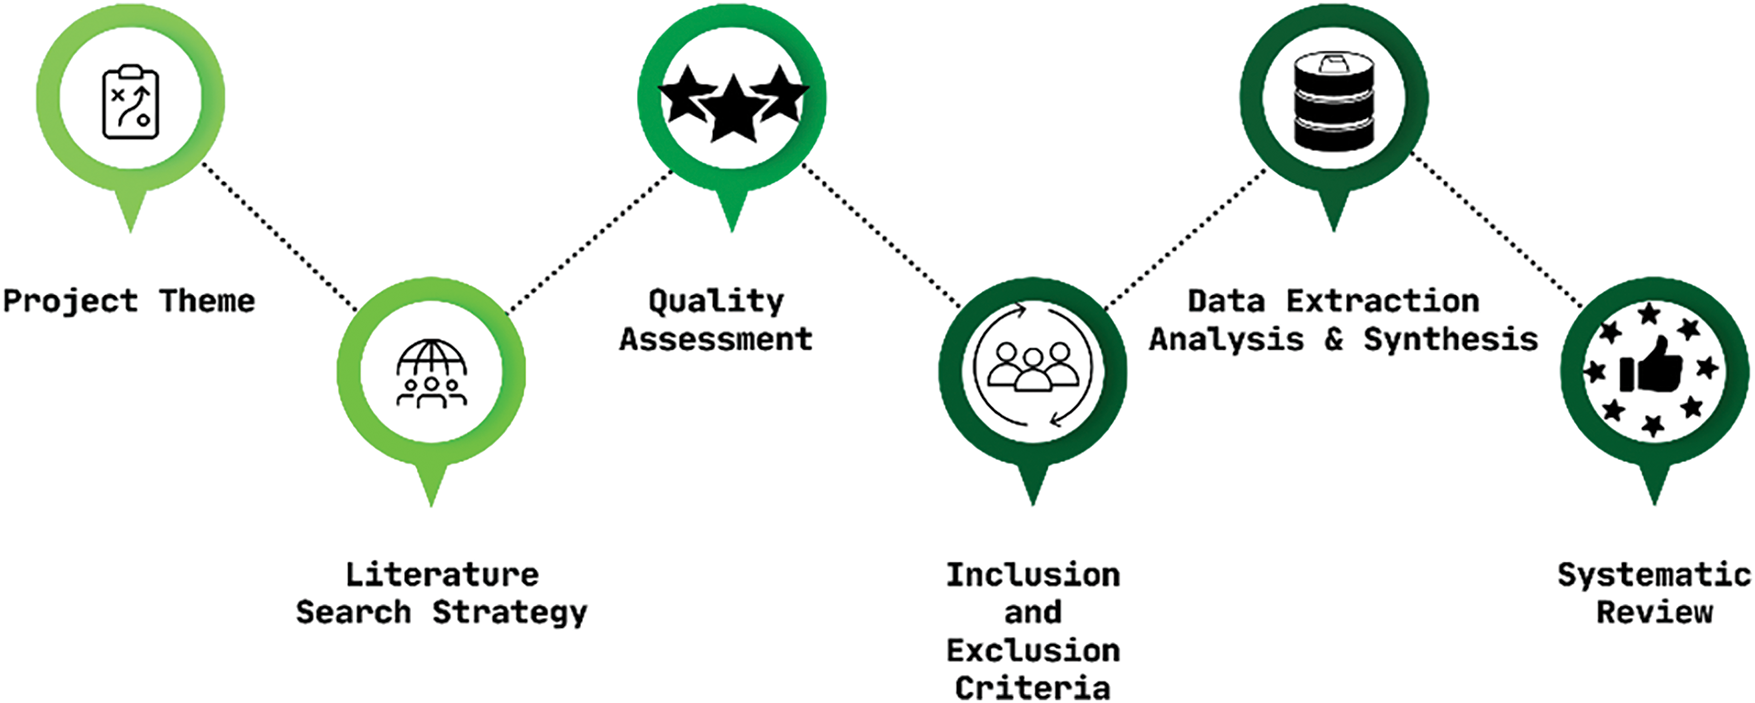
Figure 1: Overall project methodology
Planning Stage
• Clearly define the research questions and objectives of the systematic review.
• Determine the scope and inclusion/exclusion criteria for selecting relevant articles.
• Develop a comprehensive search strategy and identify relevant databases or sources to search.
• Create a protocol outlining the steps and methods to be followed during the review process.
Conduction Stage
• Execute the literature search using the defined search strategy and identified sources.
• Retrieve articles that potentially meet the inclusion criteria.
• Retrieve the full texts of selected articles for further evaluation.
• Assess the methodological quality and risk of bias of the selected articles using appropriate tools or checklists.
• Extract relevant data from the selected articles using a standardized data extraction form.
• Document the search process, selection criteria, and reasons for excluding articles.
Analysis/Reporting Stage
• Review and analyze the selected papers to identify common themes, patterns, or trends.
• Summarize the characteristics and findings of the included studies.
• Conduct a qualitative or quantitative data synthesis, depending on the nature of the studies and research questions.
• Consider conducting a meta-analysis if appropriate and feasible.
• Interpret the results and draw conclusions based on the synthesized evidence.
• Discuss the implications, limitations, and potential future research directions.
In our current time, we are noticing a sudden spike in the use of AI compared to the past. One of the applications of AI is analyzing sentiment from text which can further be enhanced to work on the human voice. There are many proposed methods to perform sentiment analysis, but we want to find effective ways to do it. To detect the problems of the present techniques, we set our research question: “How accurate are the currently proposed methods of sentiment analysis when it comes to text data?”
3.1 Search and Selection Strategy
The research papers were found using Google Scholar, which is a comprehensive database released in 2004 and used for research works. It indexes peer-reviewed online academic journals and other scholarly literature, including books. It is well-established and up-to-date. We followed “A Structured Approach to Documenting a Search Strategy for Publication” [29] and “Deep Learning Models for the Diagnosis and Screening of COVID-19: A Systematic Review” [28] to develop a well structured search strategy. While searching, we used the search keywords ‘Sentiment Analysis’ ‘NLP’, and ‘Machine Learning’, which were set based on our research questions. Also, participles like ‘using’ were used between these keywords. Initially, selected papers are filtered by assessing their quality to qualify for the review process (Fig. 2).
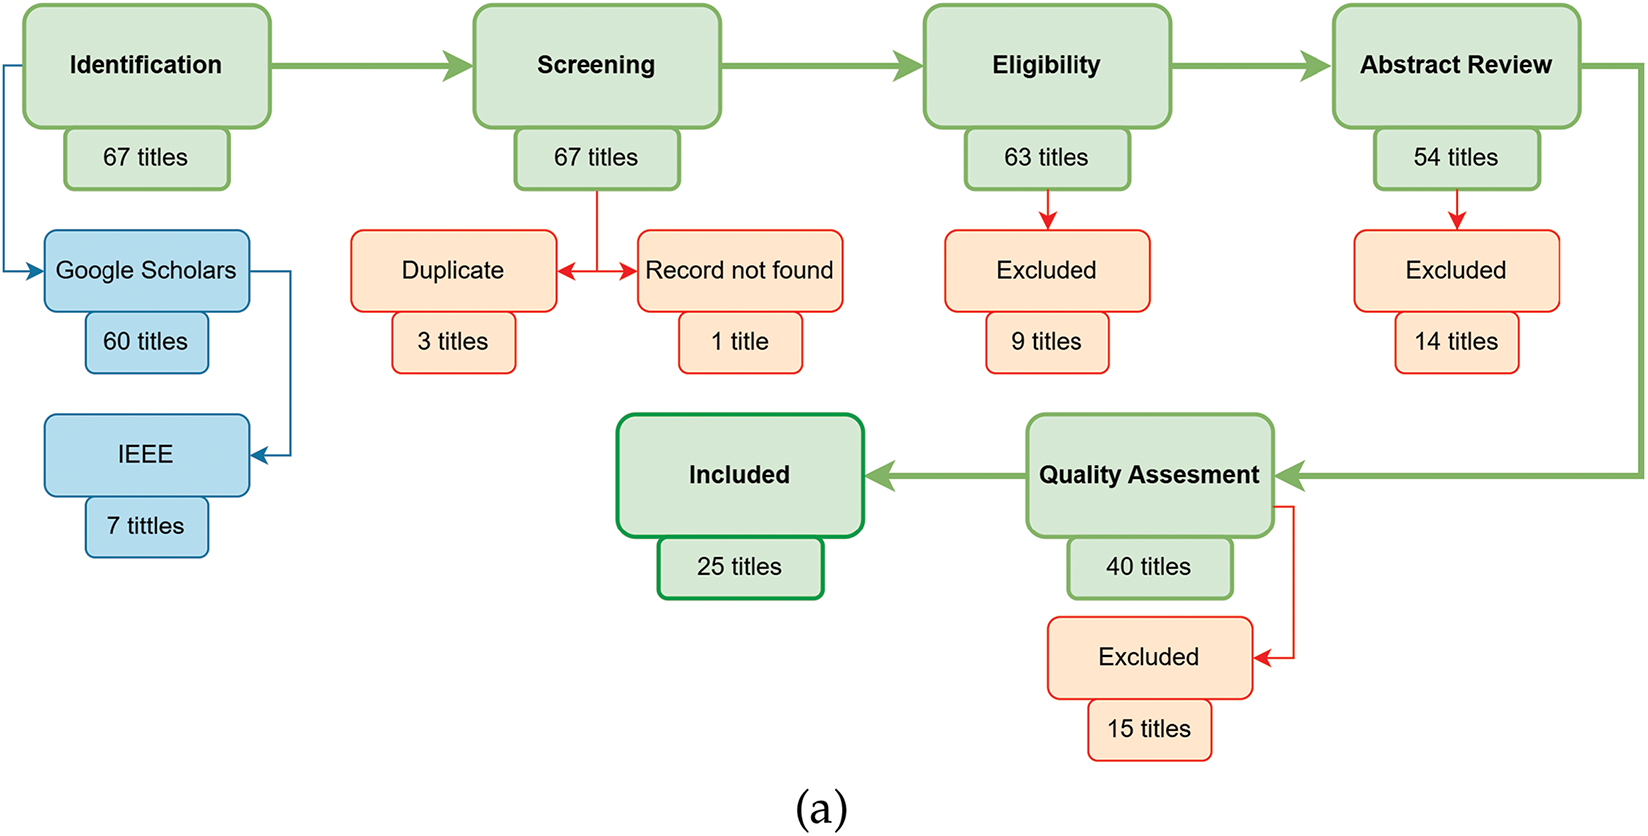
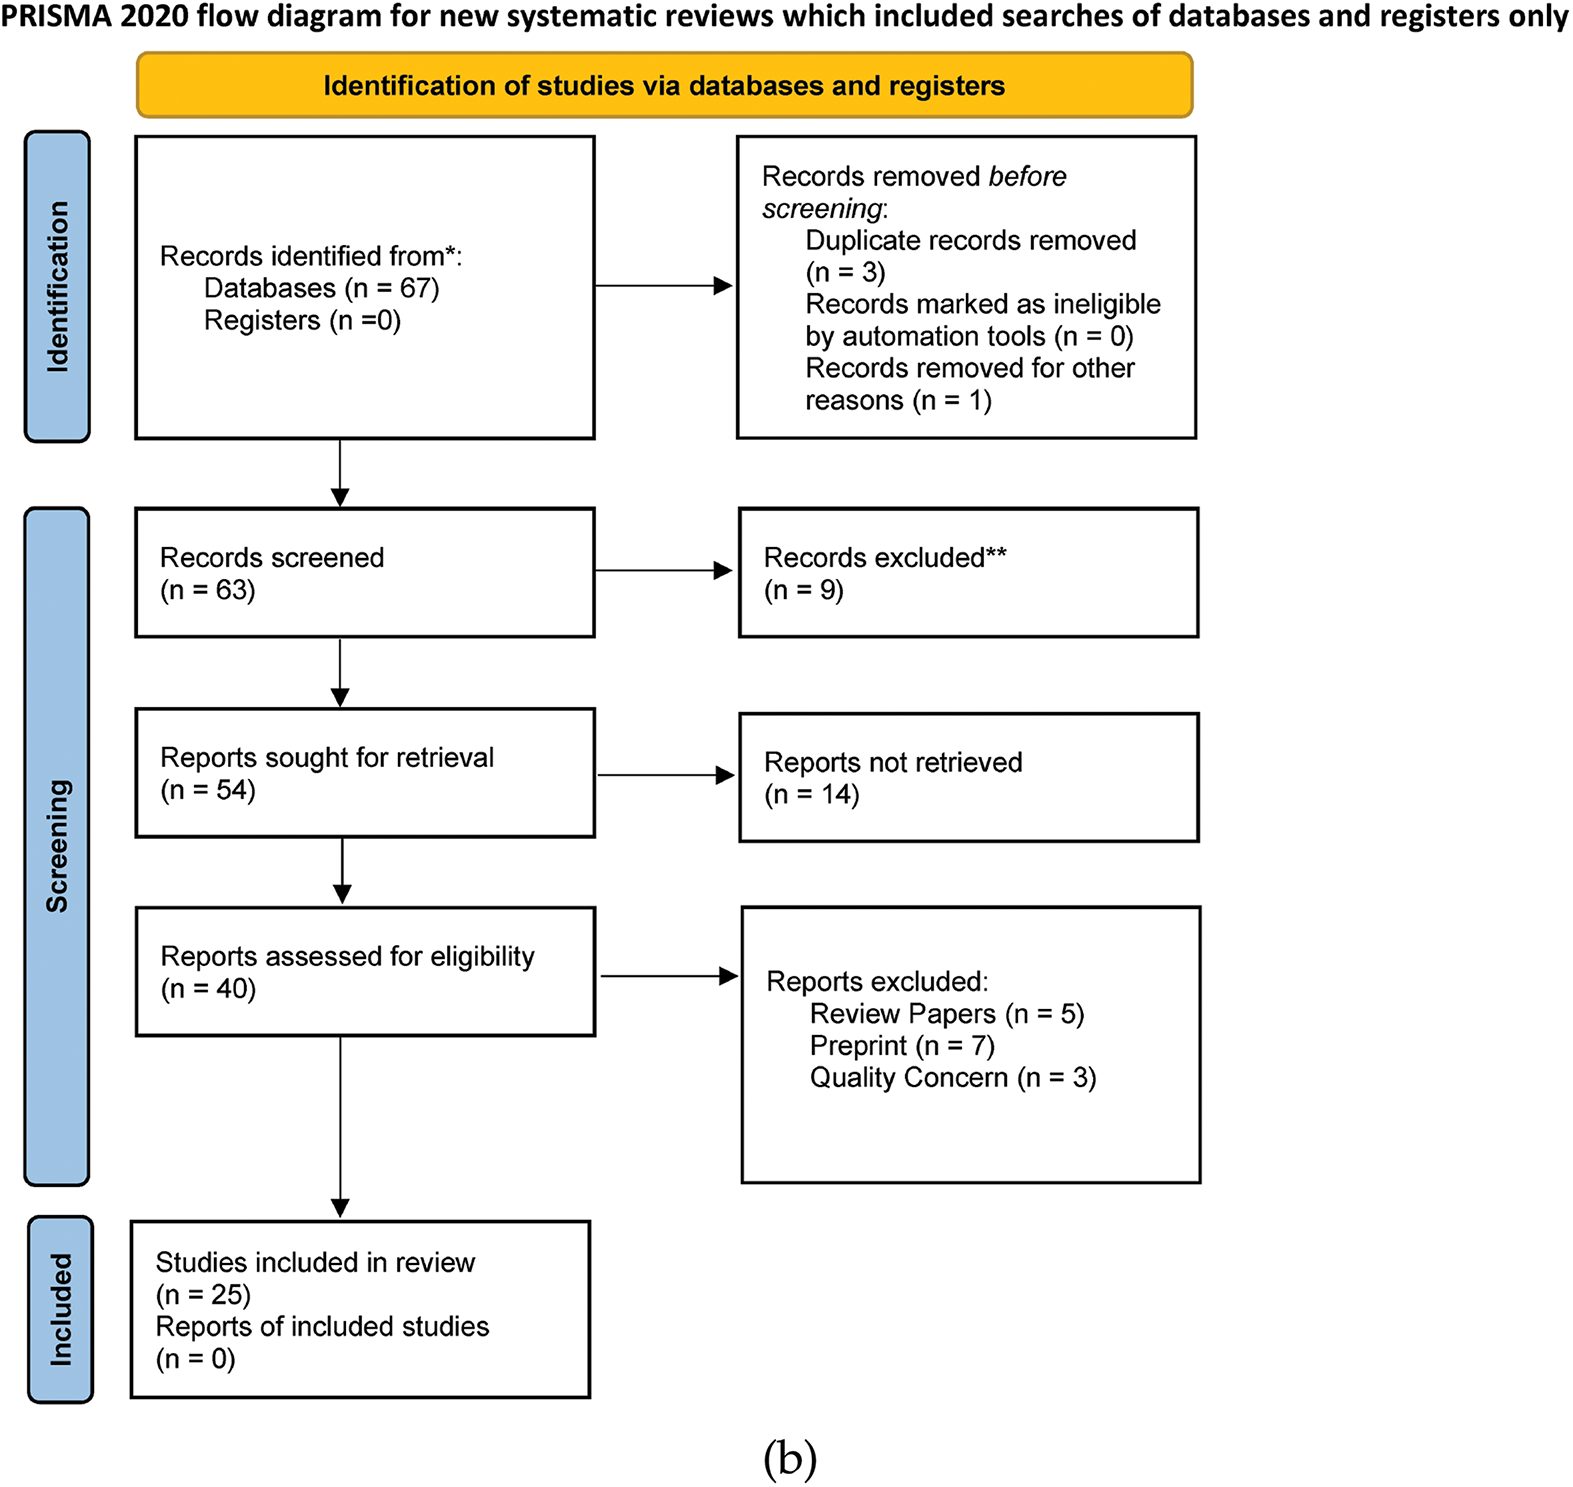
Figure 2: Literature search and selection process: (a) systematic literature search and selection flow diagram; (b) literature search process PRISMA flow diagram
Our chosen research papers were selected based on the following criteria. These criteria allowed us to filter out any article irrelevant to our work.
• The selected papers have to be from a journal article or conference paper.
• Papers must contain one or more algorithms to perform sentiment analysis.
• The objective of each study must focus on sentiment analysis from different languages, i.e., English, Bengali, etc.
• Research studies should be within the timeframe of January 2020 to May 2023.
• Suggested AI and ML models must be effective for sentiment analysis from the text.
• Editorials, review papers, or research letters.
• Early research works, research without peer-review or preprints.
• Comparison-based studies.
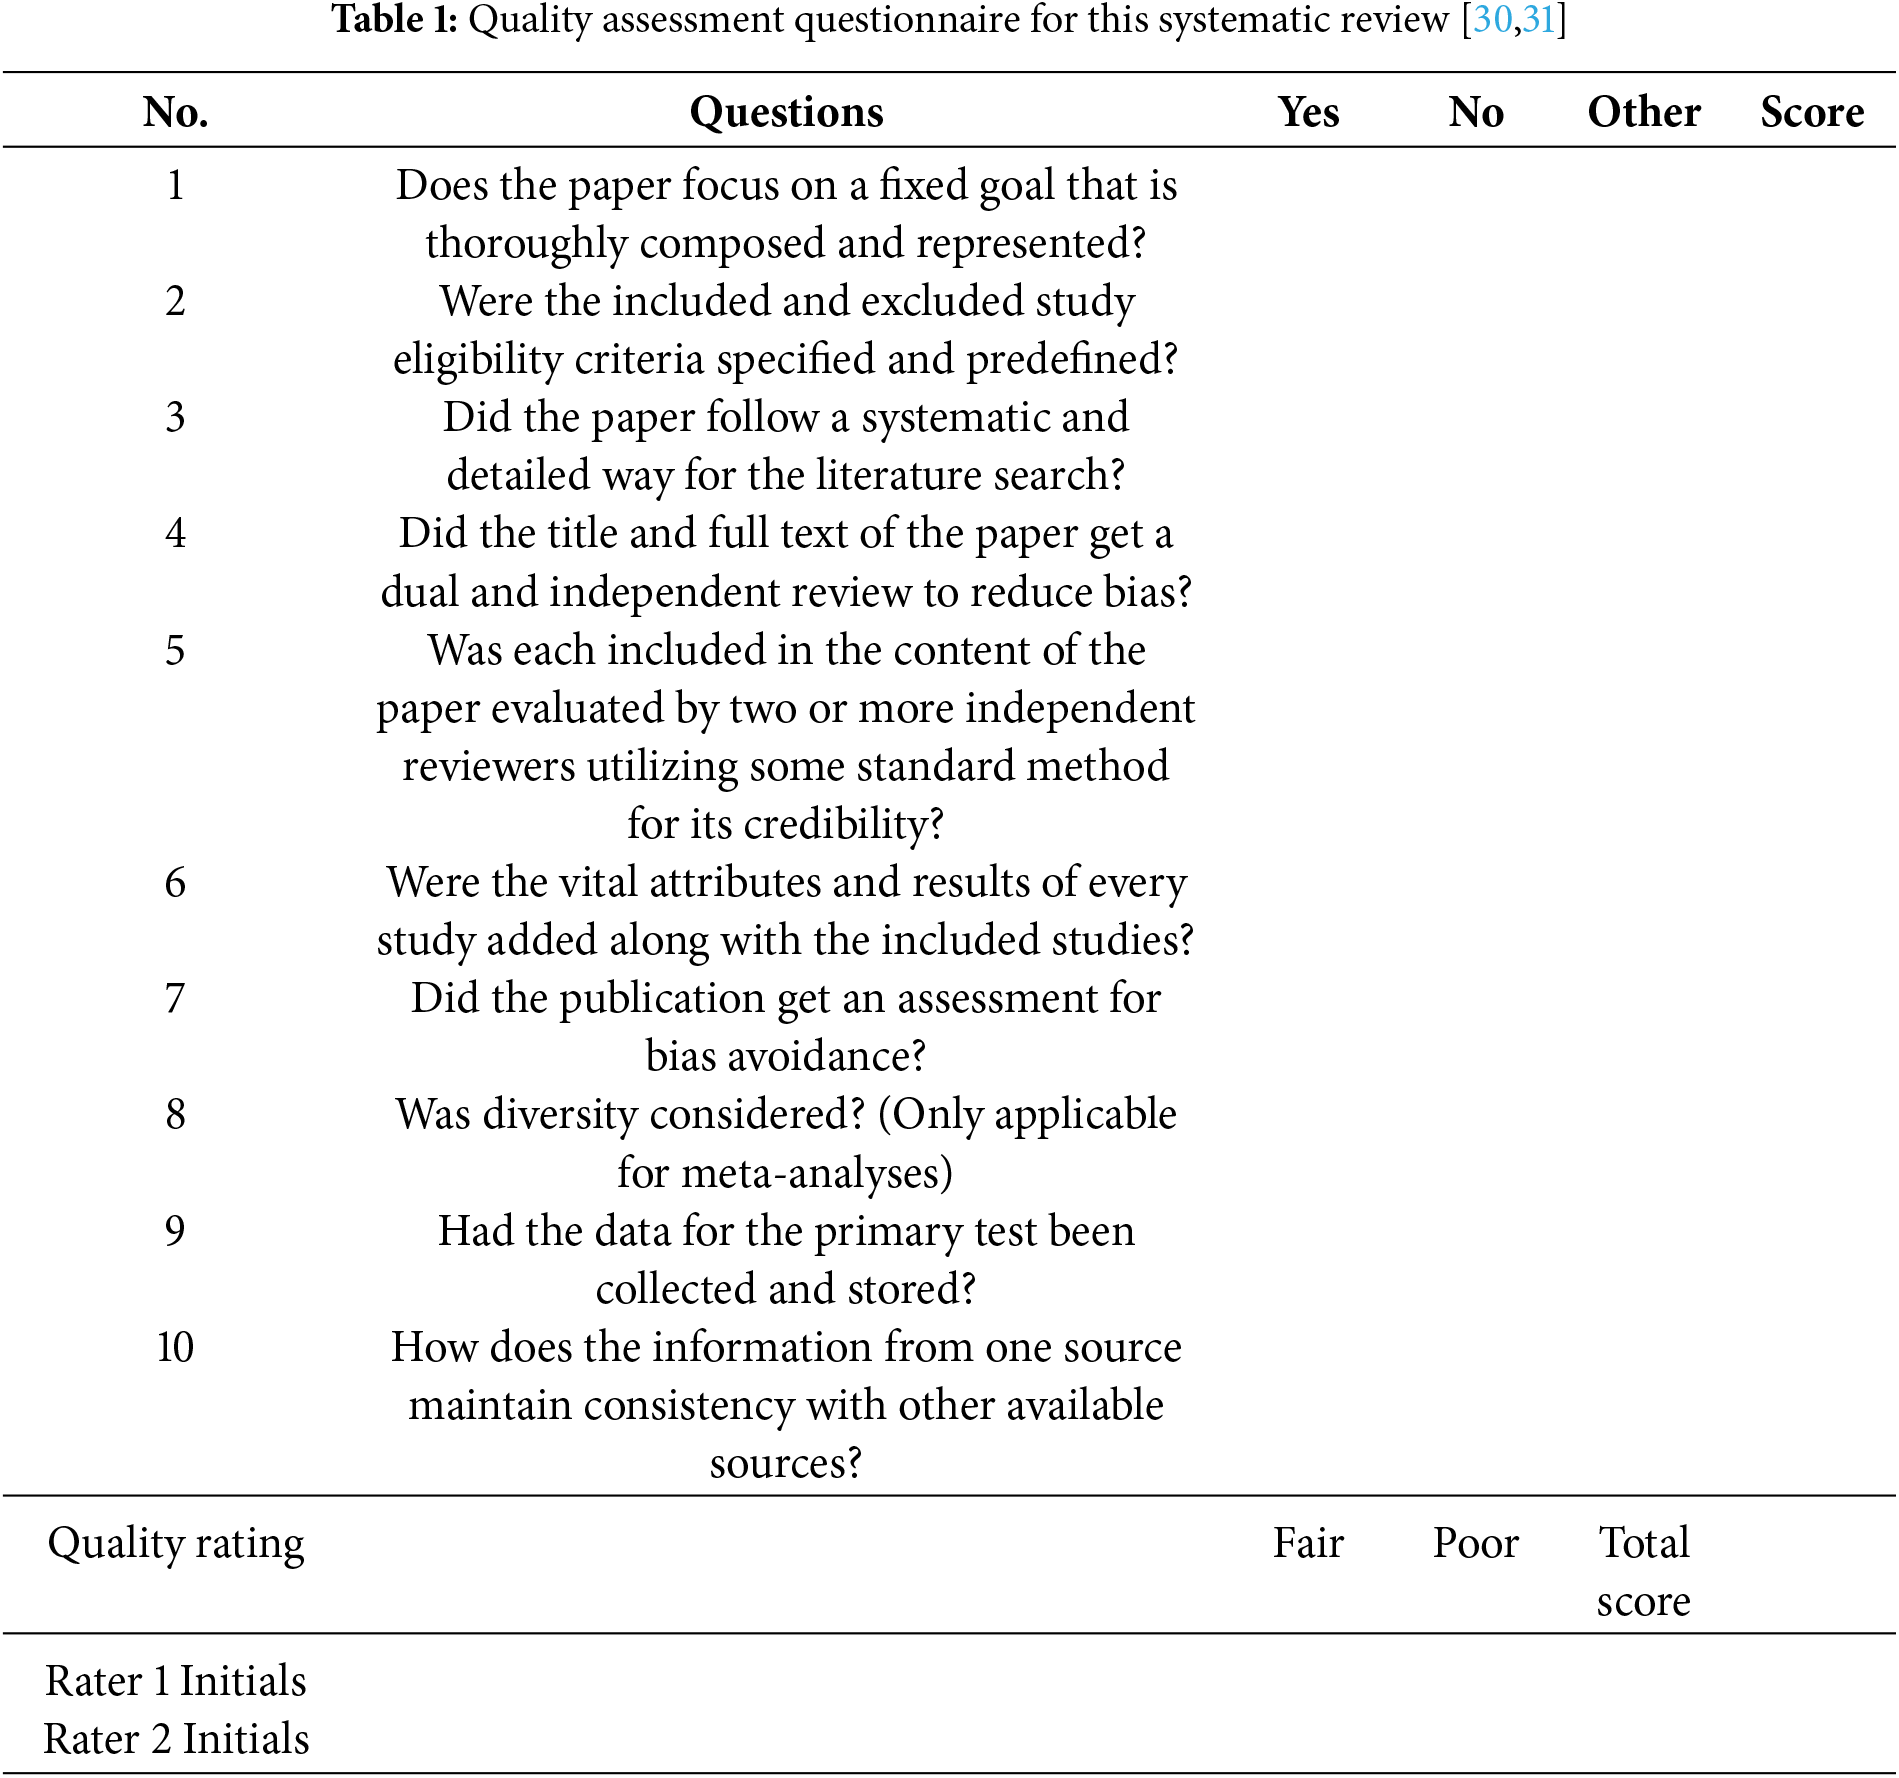
We have followed “The methodological quality assessment tools for preclinical and clinical studies, systematic review and meta-analysis, and clinical practice guideline: a systematic review” [30] and NIH “Quality Assessment of Systematic Reviews and Meta-Analyses” [31] paper for our quality assessment. We chose three of our fellow researchers to perform the quality assessment and achieved an effective result. The researchers evaluated the selected papers by rating them on a scale of 1 to 10 and using 10 questions from Table 1. Our acceptance score was 75; any paper scoring below this value was discarded from the review.
This section discusses the data extraction and observation based on the literature review. Thus, this section is divided into “Systematic Search Result”, “Observation” and “Discussion”.
In the initial preliminary study, 67 titles—including 60 from Google Scholar and 7 from IEEE—were retrieved and compiled for review. All recovered headers were subsequently examined for duplication and availability, and a total of three titles were found. One article was deleted for availability and another for the duplicate. 64 publications in total were loaded for evaluation after the first exclusion. The papers are next examined under the exclusion criteria. 55 paper abstracts were chosen for examination after 9 papers were eliminated. Twelve articles proposing new DL models were not discovered during the abstract review. A total of 40 papers were included for full-text examination after these 15 articles were removed. This evaluation comes after 40 articles and 15 papers employing quality assessment rules failed to meet quality assessment requirements. As a result, we have eventually included 25 papers for the comprehensive review. An NLP model that analyzes human sentiments and expresses emotions through certain texts is designed. Thus, for this study, we must consider its function and importance at the beginning. Now it can be seen that emotion is one of the many means of expressing human feelings in the world. An attempt has been made to find suitable articles based on this study of NLP and ML research in many countries worldwide. To create this working model, we have built on inclusion and exclusion criteria in different Asia continents and subcontinents. Fig. 3 depicts the number of papers we have taken to complete Our systematic review. Bangladesh is first and second, followed by India, Egypt, and the majority of papers compared to Bangladesh. Any article from China is worth evaluating for us.
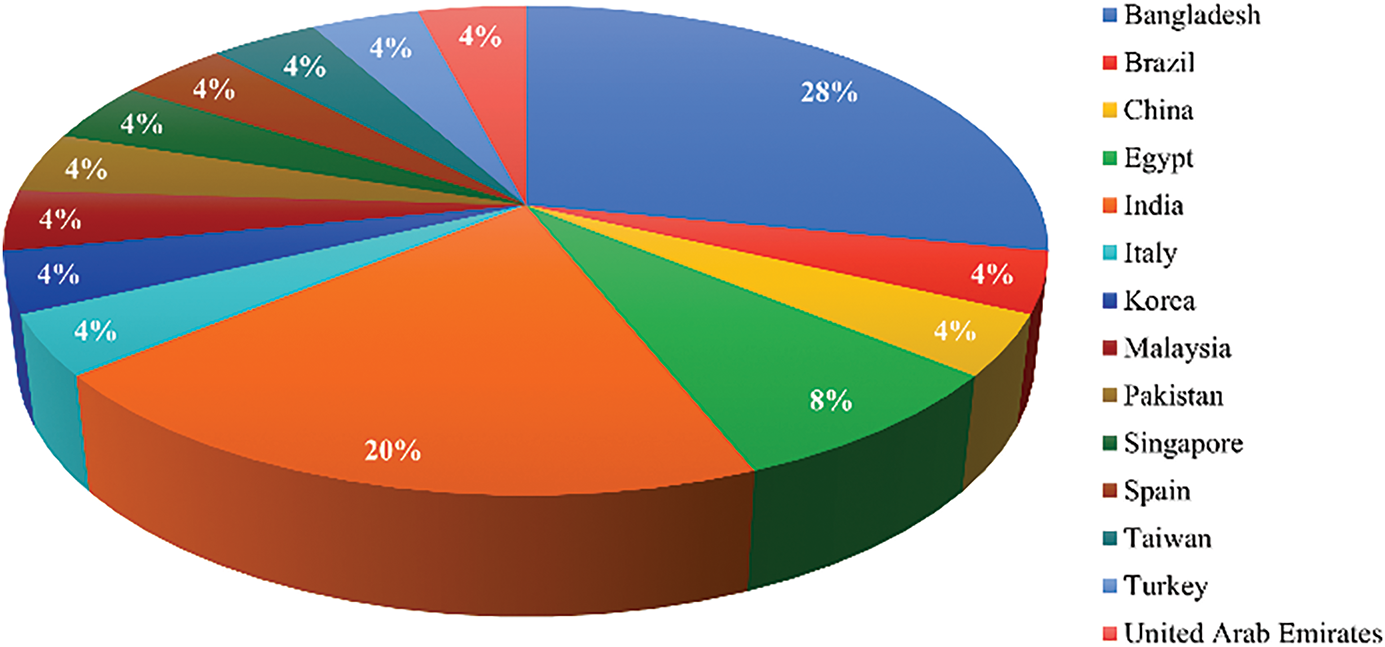
Figure 3: Research around the Globe
4.2 Observation with Theoretical Contributions of the Models
In this section, an in-depth examination and analysis of various models is conducted to unveil their underlying principles and theoretical frameworks. This systematic process facilitates the extraction of valuable insights and knowledge from the observed phenomena. By combining observations with theoretical foundations, it’s easy to build a deeper understanding of complex systems and their dynamics. These contributions often lead to the development of novel theories and methodologies that enhance the accuracy and applicability of the models in different contexts. Furthermore, the synergy between observation and theory fosters a cycle of iterative refinement, continuously improving the models’ predictive power and explanatory capabilities.
4.2.1 Most Significant Model with Mathematical Annotation
This section refers to highly impactful and influential models that have been extensively documented with detailed mathematical notations. These models are considered paramount in their field due to their profound insights and practical applications. These models’ mathematical annotations enable clear and precise communication of their concepts, making them accessible to a wide range of professionals in the field. Their systematic approach and rigor have garnered widespread recognition and validation from the scientific community. As a result, these models have significantly advanced the understanding of complex phenomena and revolutionized various industries, such as engineering, economics, and computer science.
Input Sequence:
X represents the input sequence of words or tokens, see Eq. (1).
Y represents the output sequence of entity labels, see Eq. (2).
Feature Extraction
Extract relevant features from the input sequence (X) that can help in identifying named entities. These features can include word embeddings, part-of-speech tags, character-level features, or any other contextual information.
Model Definition
Define the conditional probability distribution over the output sequence (Y) given the input sequence (X).
The CRF model defines this probability as in Eq. (3).
where,
Model Training
Train the CRF model by estimating the weight parameters (
The maximum likelihood estimation (MLE) or maximum a posteriori (MAP) estimation is typically used to optimize the model parameters.
Inference
Given an input sequence (X), perform inference to find the most likely sequence of labels (Y).
The Viterbi algorithm is commonly used for efficient inference in CRF models.
The Viterbi algorithm finds the sequence
Entity Recognition
Once the most likely label sequence (
ST-GCN Model [34]:
Edging
Start with the given expression for PMI (
The PMI for the keyword pair is calculated according to Eq. (5).
Eqs. (6) and (7) define
The Positional Encoding
The graph Laplacian matrix, see Eq. (8).
where, A is an
Feature Transform Operator
The input node features
where,
Message Computation Operator
The update equation for a layer
where,
Aggregation Operator
The aggregation function, see Eq. (13), is used to combine features from multiple neighbors to obtain the representation
Evaluation Criteria
The performance evaluation can be calculated by following Eqs. (14)–(17).
Calculate the F1 Measure
Calculate precision (
Calculate the F1 score
Substitute the formulas for precision (
Input:
X represents the input data set, consisting of text documents see Eq. (1), where n is the number of documents.
Y represents the target variable vector indicating positive or negative feedback for each document see Eq. (2).
Text Preprocessing:
Tokenization: Split each document into individual words or tokens (Eq. (18))
where,
Remove Stop Words:
Remove common and uninformative words (e.g., “the”, “is”, “and”) from the tokenized documents.
Feature Extraction:
For this step, a text vectorization approach based on the TF-IDF technique is used see Eqs. (19)–(21).
Calculate the Term Frequency (TF) for each term in a document:
For each term (word)
Calculate Inverse Document Frequency (IDF) for each term:
For each term
Calculate the inverse document frequency for term
where, N is the total number of documents in the corpus.
Compute the TF-IDF score for each term in each document:
For each term
The final result is a matrix or data structure representing the TF-IDF scores for each term in each document in the corpus. Random Forest Model: Train a Random Forest model using the preprocessed feature vectors X and corresponding target variable Y. The Random Forest algorithm combines multiple decision trees to make predictions. Each decision tree is trained on a bootstrap sample of the data with random subsets of features. At each node of the tree, the best split is determined based on a splitting criterion (e.g., Gini impurity or information gain).
Positive or Negative Feedback: Use the trained Random Forest model to predict the positive or negative feedback for new, unseen documents.
Input Sequence:X represents the input sequence of data in the Eq. (22).
where, T is the number of time steps. At time step
CNN Layer: Apply convolutional operations to the input sequence X using filters WCNN and non-linear activation function
Reshape: Reshape the output feature maps
LSTM Layer: At each time step t see Eqs. (24)–(29):
Input gate
Forget gate
Output gate
Candidate cell state
Update cell state
where, ‘
Update hidden state
Output Layer: The final hidden state
A visual representation of the CNN-LSTM model is illustrated in Fig. 4.
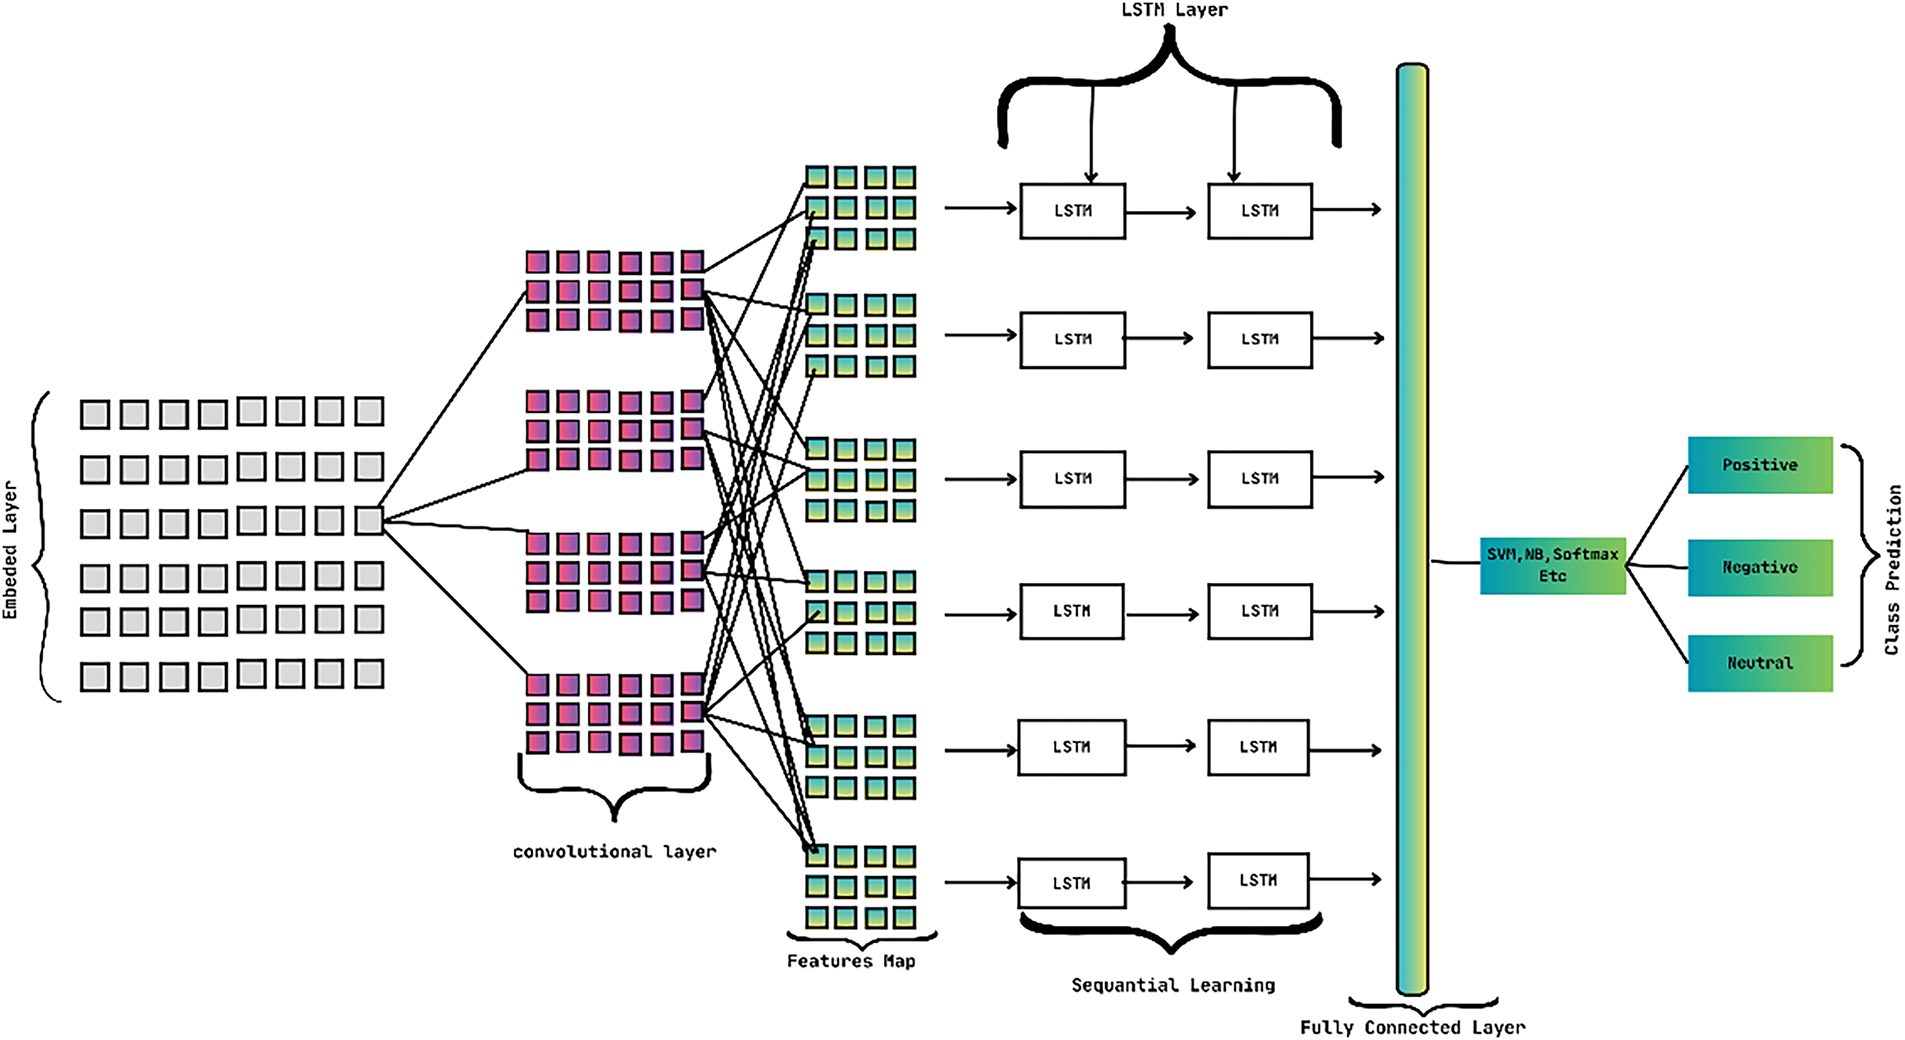
Figure 4: Architecture of CNN-LSTM model
LSTM Model [38]:
Initialization: Initialize the weights and biases of the LSTM model randomly or using a predefined distribution. Set the initial cell state,
Input Processing: Receive an input sequence, see Eq. (22) at each time step
Forget Gate Calculation: Compute the forget gate,
where,
Input Gate Calculation: Compute the input gate,
where,
Candidate Cell State Calculation: Compute obtain the candidate cell state,
where,
Cell State Update: Update the current cell state,
Output Gate Calculation: The sigmoid function from Eq. (33) is used to compute the output gate,
where,
Hidden State Update: Compute the current hidden state,
Repeat: Iterate through each time step t in the input sequence and perform steps 2 to 8 for each time step
Output: The final hidden state,
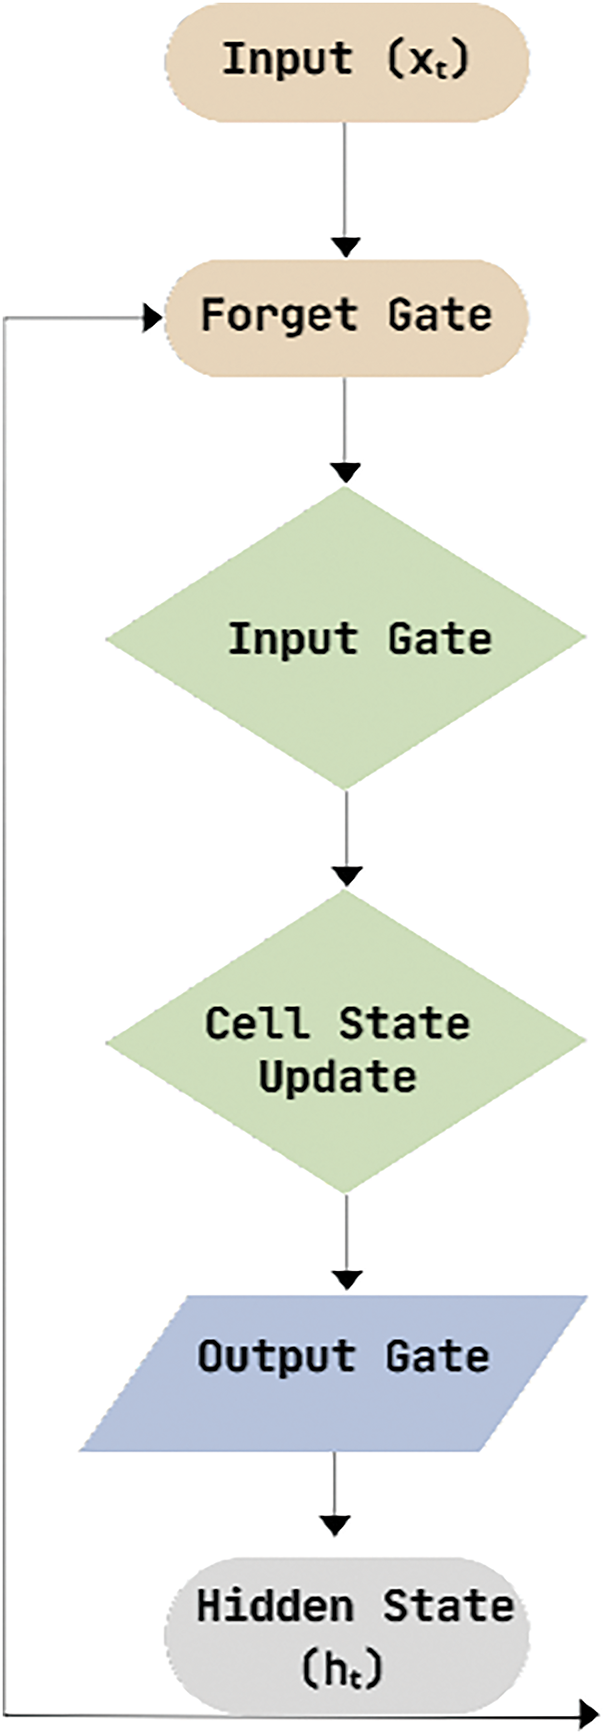
Figure 5: Basic architecture of single LSTM cell
For optimization, the “Adam” optimizer can be used with a learning rate of 0.0001. Binary cross-entropy can be used as the loss function. The binary cross-entropy loss function measures the dissimilarity between the true labels
Given: True labels
Algorithm: By using Eq. (34) the binary cross-entropy loss for each sample can be calculated.
Compute the average binary cross-entropy loss over all samples following Eq. (35).
where, N is the total number of samples.
This Model architecture [Fig. 5] consists of two LSTM layers, also known as a deep LSTM or stacked LSTM network. LSTM is a type of recurrent neural network (RNN) that is effective in capturing long-term dependencies in sequential data. It consists of several gates and memory cells that control the flow of information. The mathematical equations for an LSTM cell are shown in Eqs. (24)–(29).
The architecture includes an embedding layer, which is augmented with parameters such as vocabulary size, embedding vector length, and maximum review length. The embedding layer is used to convert input text into distributed representations (embeddings) that capture the semantic meaning of words. It can be represented as a lookup table where each word is mapped to a dense vector. Given an input sequence of words, the embedding layer computes the embeddings for each word. The specific details and equations depend on the implementation, but the general idea is to map each word to its corresponding embedding vector. A dense layer with a sigmoid activation function is incorporated into the model. The sigmoid activation function is commonly used in binary classification tasks to squash the output to a value between 0 and 1 [39]. It is defined in Eq. (36):
The binary entropy loss function was employed to construct the model, and an Adam Optimizer was utilized for training. Binary entropy loss is a loss function commonly used in binary classification tasks to measure the difference between predicted probabilities and true labels. It is defined in Eq. (34).
Adam (Adaptive Moment Estimation) is an optimization algorithm commonly used for training deep learning models. It combines the concepts of adaptive learning rates and momentum. The Adam optimizer updates the model parameters based on the gradients of the loss function with respect to the parameters. The specific details and equations for the Adam optimizer are as follows [41]:
Initialize the parameters:
Set hyperparameters:
For each parameter
Compute the gradients:
Update the first-moment estimate:
Update the second-moment estimate:
Compute bias-corrected first moment:
Compute bias-corrected second moment:
Update the parameter:
In addition to monitoring the loss, accuracy was evaluated as a complementary measure to assess the performance of the model’s output. Fig. 6 illustrates the architecture of a stacked LSTM model, also referred to as a deep LSTM network. The diagram represents the model’s structure, featuring multiple LSTM layers stacked on top of each other. Each LSTM layer includes its own set of memory cells, gates, and hidden states. The input sequences flow through the stacked LSTM layers, allowing the model to capture and process information across different time steps. This architecture enables the model to learn complex temporal dependencies and make more accurate predictions.
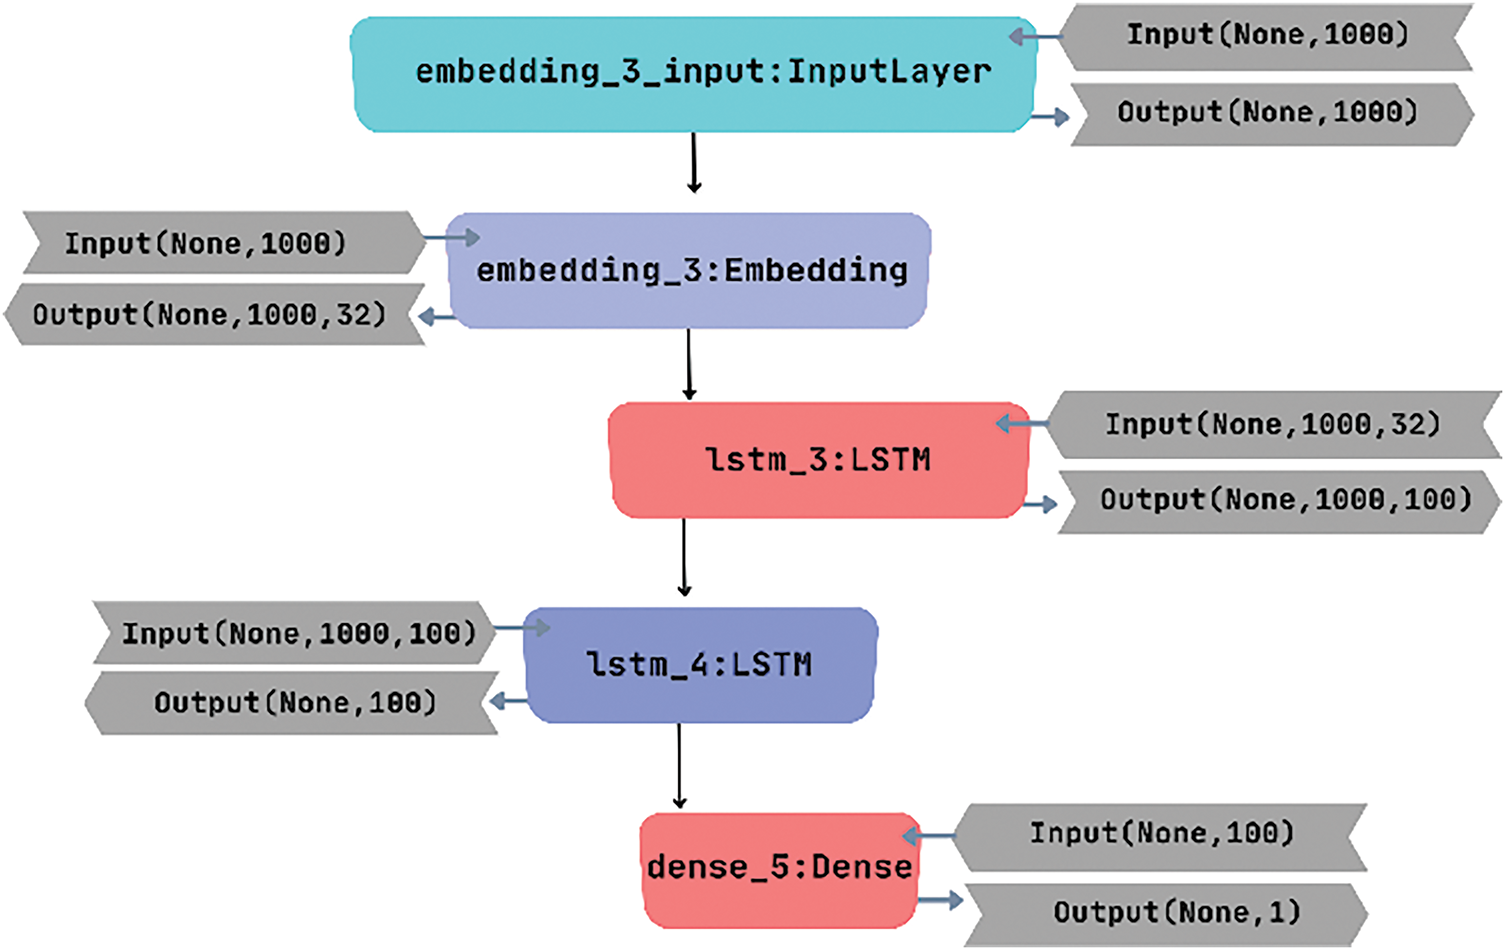
Figure 6: Network layout of stack LSTM
Soft Voting Ensemble Model [42–44]:
After the data collection, the next step is data preprocessing. In this stage, various preprocessing techniques are applied by the author, including URL and punctuation removal, tokenization, stop words removal, and stemming. These techniques help to clean and normalize the text data for further analysis.
Following data preprocessing, the author utilizes the TF-IDF vectorizer in the word-to-vector stage. TF-IDF (Term Frequency-Inverse Document Frequency) is a well-known technique widely used in machine learning and text mining shown in Eqs. (19)–(21). It quantifies the importance of each word in a document by evaluating its association with the document [43].
TF (Term Frequency) measures the occurrence of specific words within documents or reviews, while IDF (Inverse Document Frequency) assigns a higher weight to unique, important words that occur less frequently compared to common and less significant words [45]. The TF-IDF score is a product of both TF and IDF, providing a meaningful representation of word importance in the given context.
For the Given:
Base models:
Input sample:
Class labels:
Ensemble Prediction: Initialize an array of class votes, V, with zeros for each class label:
For each base model
Eq. (44) shows the way to obtain the predicted class label for the input sample
Increment the corresponding class vote in the array V for the predicted class label
Class Prediction:
The class label with the highest number of votes in the array V is selected as the predicted class for the input sample
The Soft Voting Ensemble method combines the individual predictions from multiple base models by counting the votes for each class label. It selects the class label with the highest number of votes as the final prediction. This approach allows the ensemble to make a decision based on the collective wisdom of the individual models, leveraging their diverse predictions to achieve better classification accuracy.
Note: The algorithm assumes that each base model
For individual classifiers and Ensemble classifiers, the equation for the performance measure computations is shown in Eqs. (14)–(17).
The CNN architecture depicted in Fig. 7 is based on the work of [46], with the inclusion of a dropout layer aimed at mitigating the issue of overfitting.
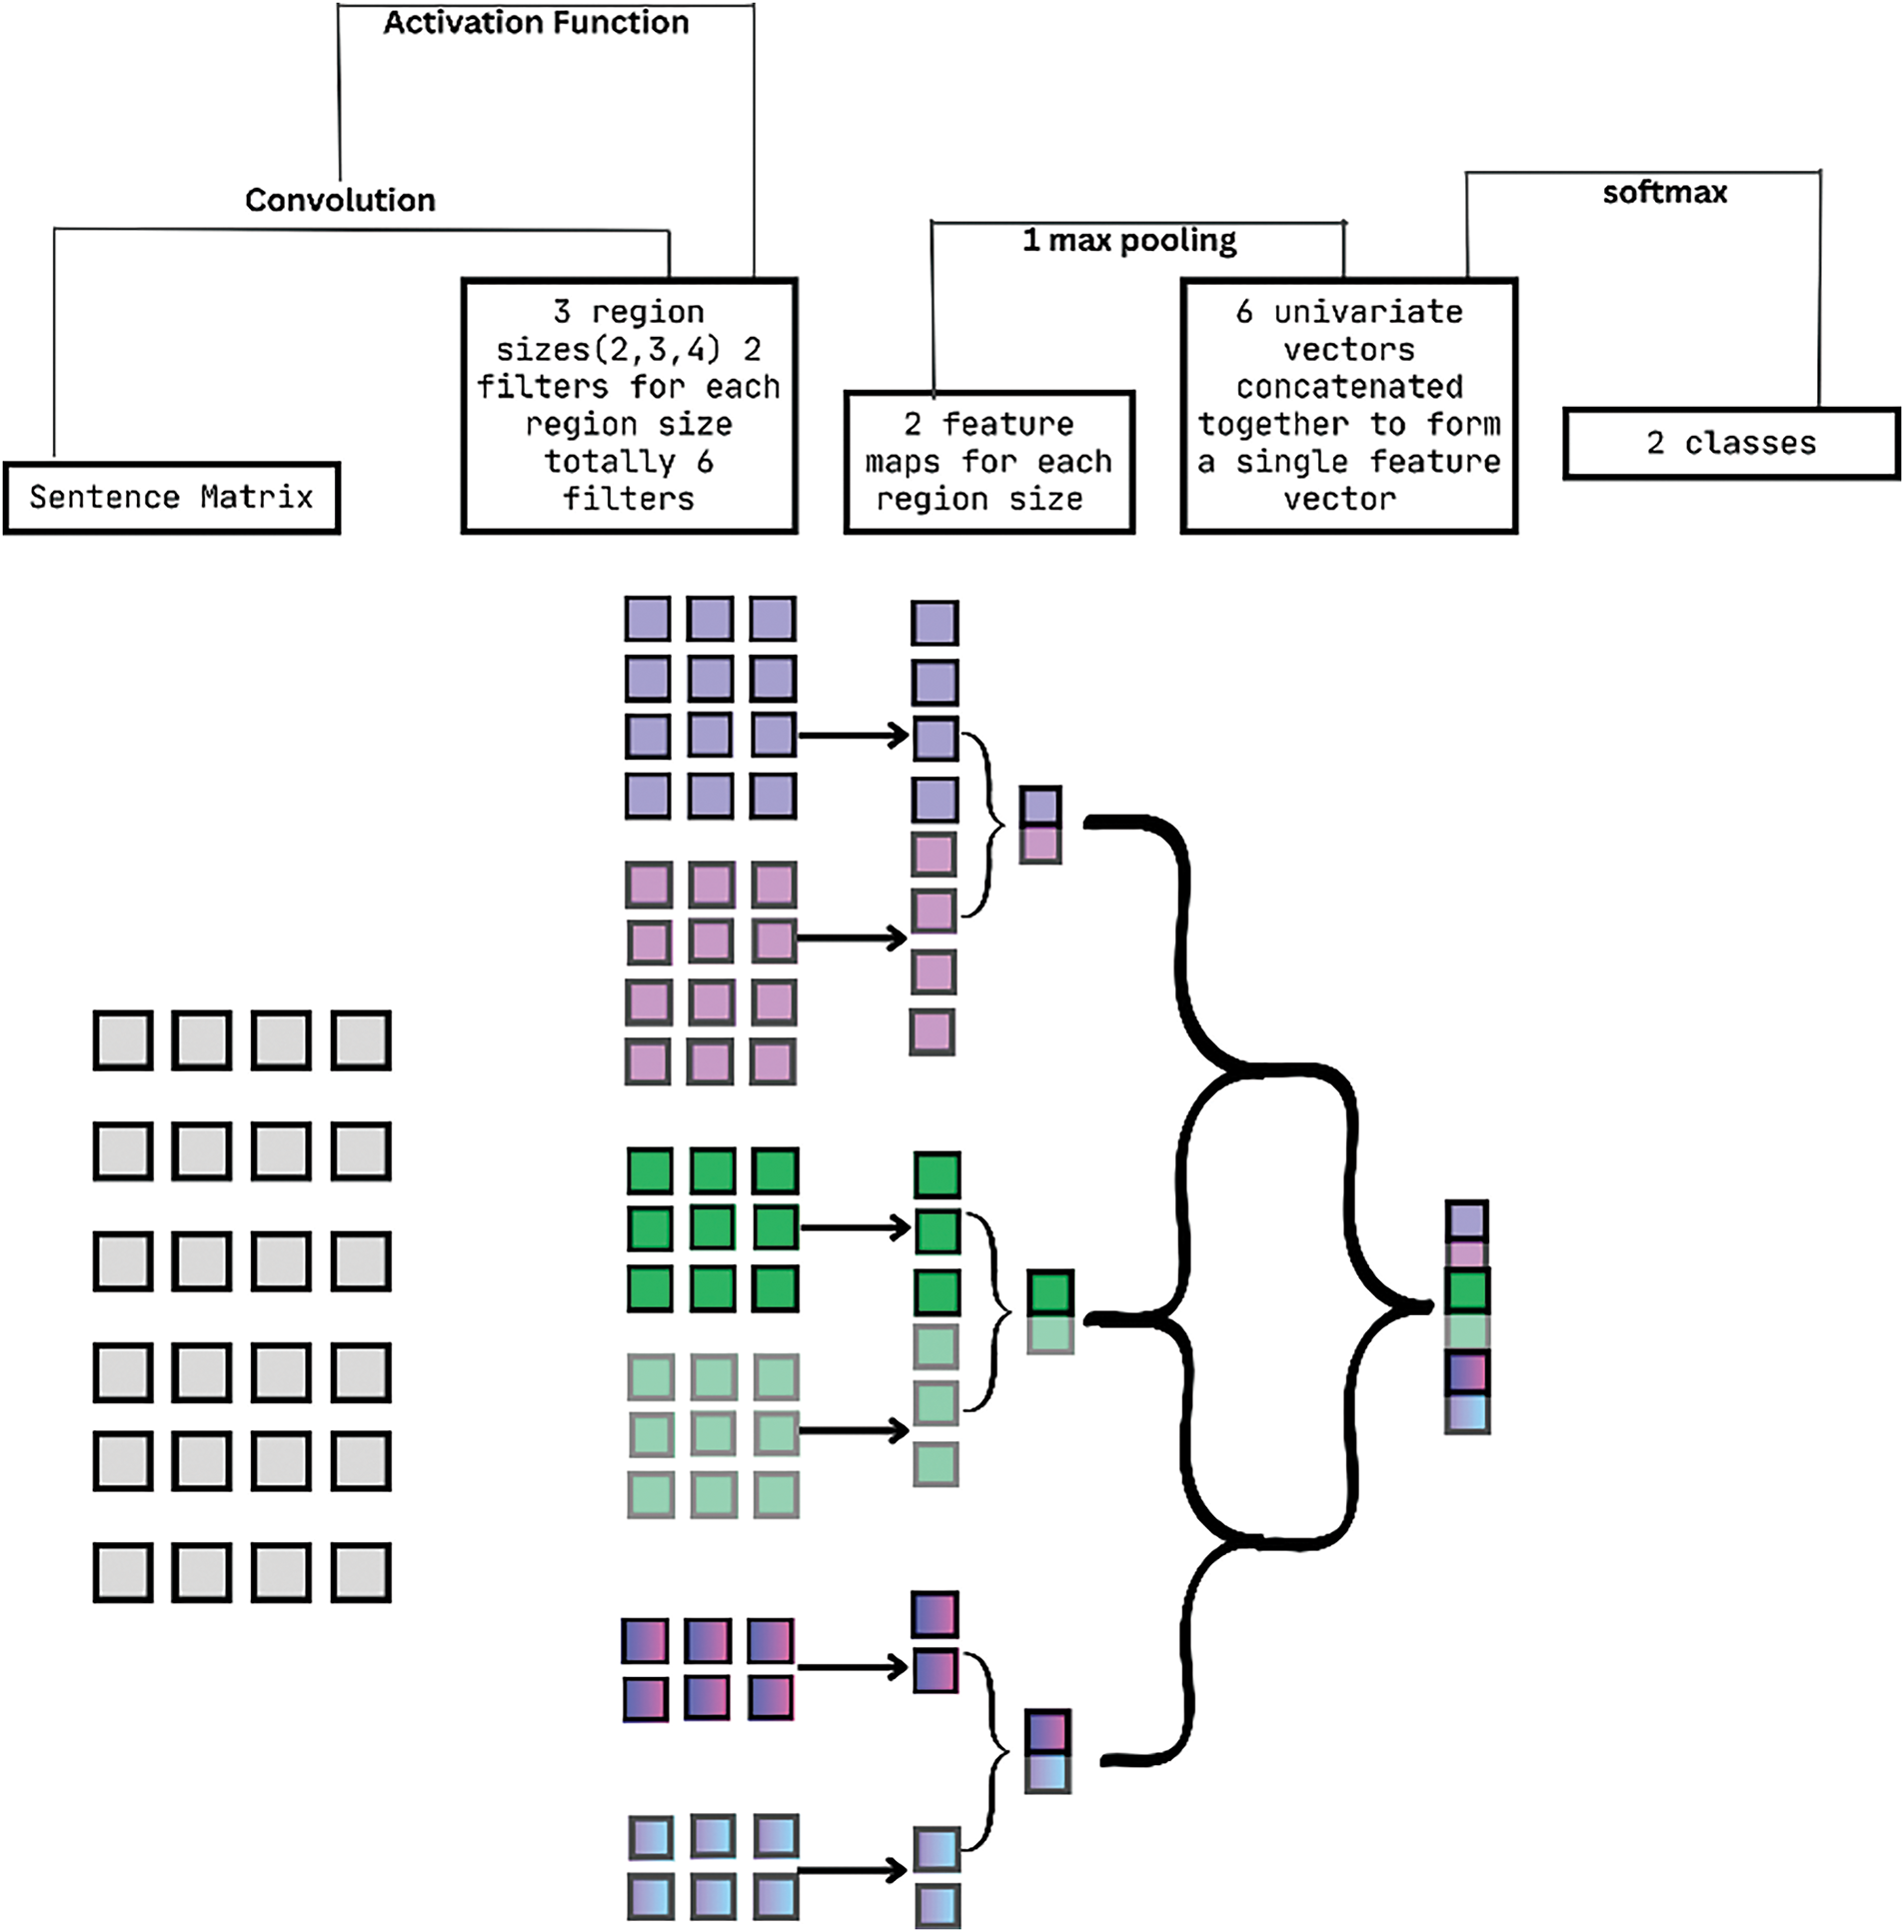
Figure 7: Architecture of CNN model
For the proposed CNN algorithm, let’s assume the given,
Input sequence Eq. (22)
Word embeddings: E
Number of filters: N
Filter sizes:
Activation function:
Embedding Layer:
Embed the input sequence
Zero padding is applied to ensure uniform matrix dimensions for all tweets in the dataset.
Convolutional Layer:
For each filter size
Initialize filter weights
Apply Eq. (47) for convolution operation using the filter weights:
Max Pooling Layer:
Apply max pooling operation to obtain the maximum value from each feature map
Flatten Layer:
Flatten the pooled feature maps M into a 1-dimensional vector.
Fully Connected Layer:
Initialize weight matrix W and bias vector
Compute the weighted sum according to Eq. (49):
Apply activation function Eq. (50):
Apply the ReLU (Rectified Linear Unit) activation function from Eq. (51).
This algorithm takes an input value of
Output Layer: Softmax activation function has been used to obtain the final output probabilities.
Training:
Binary-cross-entropy loss function has been used to measure the discrepancy between predicted and true labels see Eq. (34).
Adam optimization algorithm has been used to minimize the loss by adjusting the model’s weights and biases see Eqs. (37)–(42).
Forward Propagation:
Pass the input sequence
Backpropagation:
Compute the gradients of the loss function with respect to the model’s parameters.
Update the model’s parameters using the gradients and the chosen optimization algorithm.
Support Vector Machine (SVM) is mainly used for binary classification (positive and negative), where it mainly separates the data using a linear hyperplane.
The Hyperplane can be created using Eq. (52):
Here,
Calculate the Distance from the Support Vector from Eq. (53):
Here,
Classification:
To classify the data, the hyperplane equation can be used in the form of a function see Eq. (54),
Here,
4-grams with Logistic Regression [52]:
N-gram follows the Eq. (55):
where
Equation of Multinomial Logistic Regression:
Here,
This Model is a Hybrid of a Bidirectional-Gated Recurrent Unit (Bi-GRU), a variation of RNN, and a Convolutional Neural Network (CNN).
The Equation for GRU [54] see Eqs. (57)–(60):
Here,
The equation for Bi-GRU [54] see Eqs. (61)–(63):
Equation for CNN [38,53]: Convolution Layer Eq. (64):
where,
Zero padding is applied to the sentences with a length less than
where,
where,
Filter R is convoluted on every window of words in the input sentence
Max Pooling Layer:
Shown in Eq. (48).
Here, max pooling is used to obtain the maximum value from each feature map
Flatten Layer:
Flattens the pooled feature maps M into a 1-D vector.
Fully Connected Layer see Eq. (67): Initialize weight matrix W and bias vector
Compute the weighted sum:
Apply activation function as shown in Eq. (50). This algorithm takes an input value of
Bi-ERU Model [55]:
Bidirectional Emotional Recurrent Unit (Bi-ERU) is a variation RNN that is optimized for conversational sentiment analysis.
The model has been divided into 2 main components that are: a Generalized Neural Tensor Block (GNTB), and a Two-channel Feature Extractor (TFE) shown in Fig. 8.
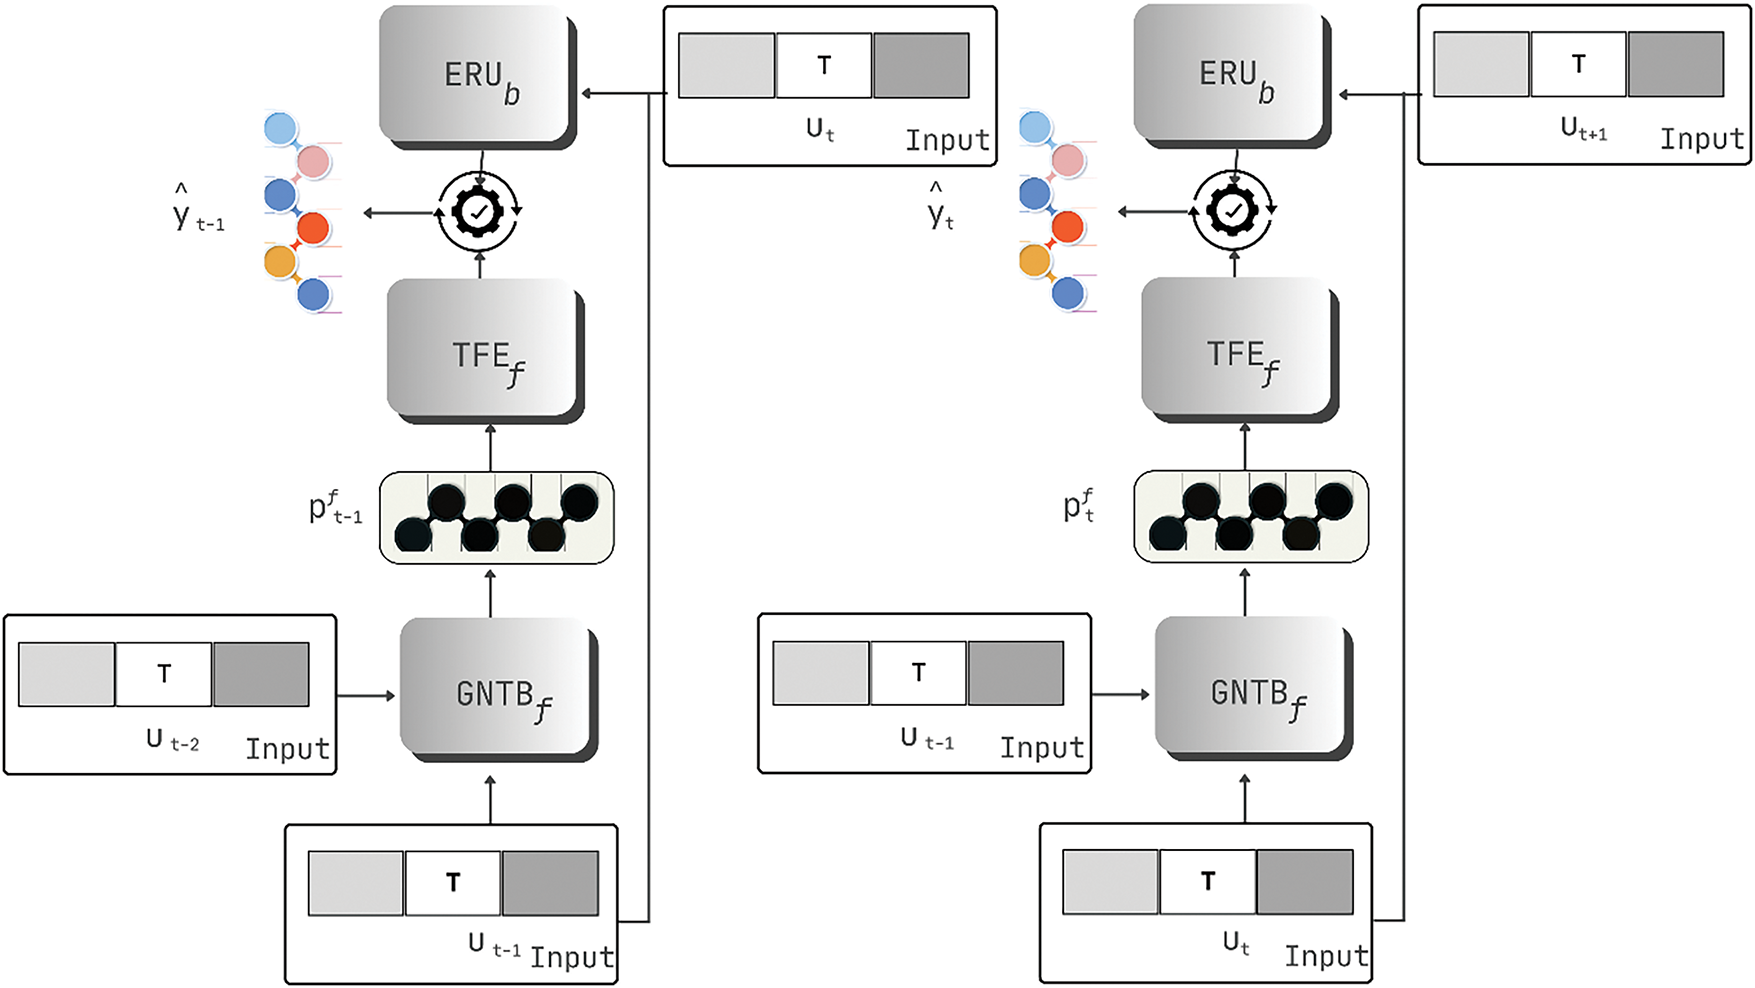
Figure 8: Architecture of BiERU with local context
The Mathematical Representation of these 2 components is as follows:
GNTB:
Extracting contextual utterance vector, see Eq. (68):
Here,
Equation of GNTB can be seen in Eqs. (69) and (70):
Here,
where
Parameter Reduction:
To reduce the number of parameters the following low-level matrix approximation see Eq. (71) is used on the slice of the tensor
Here,
TFE:
Updating Hidden state and Cell state:
Here,
Emotion Feature Vector, see Eq. (73):
Here,
Eq. (74) shows the ERU:
Here,
BERT, which stands for Bidirectional Encoder Representations from Transformers, represents a novel language presentation tool introduced in a significant research paper [4]. BERT has garnered considerable attention within the Machine Learning community, showcasing remarkable performance and enabling a diverse range of NLP applications. Its key innovation lies in applying bidirectional training of Transformer, a well-established attention model, for language modeling.
The BERT model was trained using a subset of the input text language, specifically 15% of the tokens, which were randomly selected. These tokens were then subjected to further pre-processing, with 80% of them being replaced by a special “MASK” token, 10% by a randomly chosen word, and the remaining 10% using the original word. This diverse replacement strategy is crucial as solely utilizing the “MASK” token 100% of the time would not yield optimal representations for un-masked words. Although the un-masked tokens were still utilized for text context, the model’s primary focus was on predicting the masked words, which led to its effective handling of various NLP tasks. The data was divided into two subsets for training and validation [56].
Here is the mathematical algorithm for the BERT model:
Input Sequences:
Let X be the input sequence, which is tokenized into individual tokens (words or sub-words).
Token Embedding:
Convert each token
where,
Positional Encoding: Add positional information to the word embeddings to capture the sequence order, see Eq. (76).
where,
Input Representation:
Combine token embeddings and positional encodings in Eq. (77):
where,
Transformer Encoder Blocks:
Iterate through L Transformer encoder blocks:
For each block
Self-Attention Mechanism:
Compute the attention scores between tokens, see Eq. (79):
where,
Apply softmax to obtain attention weights.
Compute the weighted sum of values using Eq. (80) to get the attention output:
Residual Connection and Layer Normalization:
Apply a residual connection see Eq. (81) to the attention output and normalize the result:
Feed-Forward Neural Network:
Apply a feed-forward neural network to
Task-Specific Layer:
Use the final output representation (Z or
To assess the model’s performance, its accuracy was further computed.
LSTM-RNN Model [57]:
Input Processing:
A simple RNN, an LSTM also has a hidden state where
Here in Fig. 9, the hidden state is known as Short Term Memory, and the cell state is known as Long Term Memory.
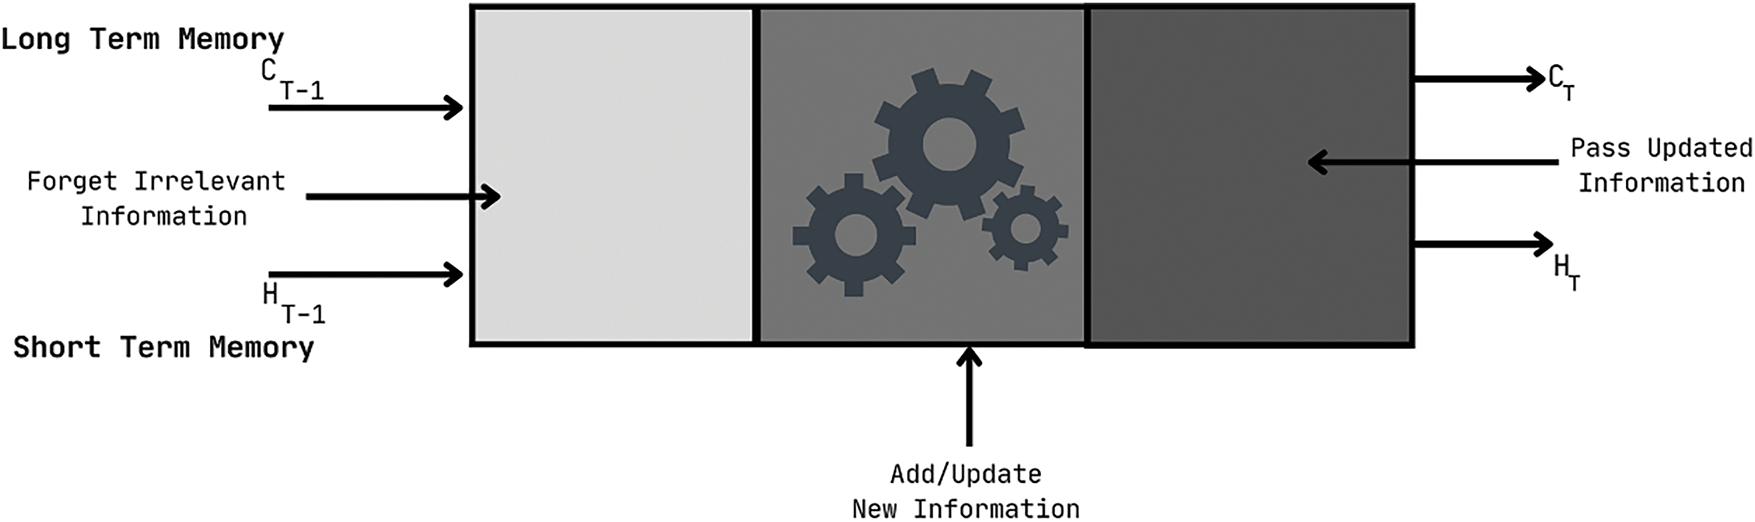
Figure 9: Single LSTM cell
Forget Gate Eq. (84):
Here,
Input Gate Eq. (85):
Here,
Again, we have applied the sigmoid function over it. As a result, the value of I at timestamp
For New Information see Eq. (86)
Updated Equation is (87).
Here,
Output Gate Eq. (88):
Now, Calculating the current hidden state using
Calculating polarity and subjectivity for the KNN Model:
Sentiment analysis depends on polarity and subjectivity. Subjectivity contains facts, opinions, and desires. Polarity contains feelings and emotions. To analyze the sentiment, polarity, and subjectivity of text have to be calculated.
From the polarity and subjectivity data, mean, median, average minimum, and average maximum are calculated. The equation used in the calculations is shown in Eqs. (90)–(93).
Data classification using KNN: Data classification is done to the polarity score. If a tweet has a polarity score greater than zero
Using Eq. (94), the distance of the data point in the KNN Algorithm can be found.
The KNN algorithm uses the tweet polarity for classification. It classified the three types of data into a positive negative and neural class. The classification result is stored and analyzed for this model.
4.2.2 Findings from Review and Discussion
In addition, we also observed the NLP model through which we used various research articles to identify human emotions. Fig. 10 indicates the number of models used to express these human emotions in multiple settings. Among them, the LSTM model is the most popular. And the second one is SVM. Other models such as NER, BERT, CNN and many others are less commonly used for this trend detection—for example, LRR, Bi-GRU-CNN, and SVE.
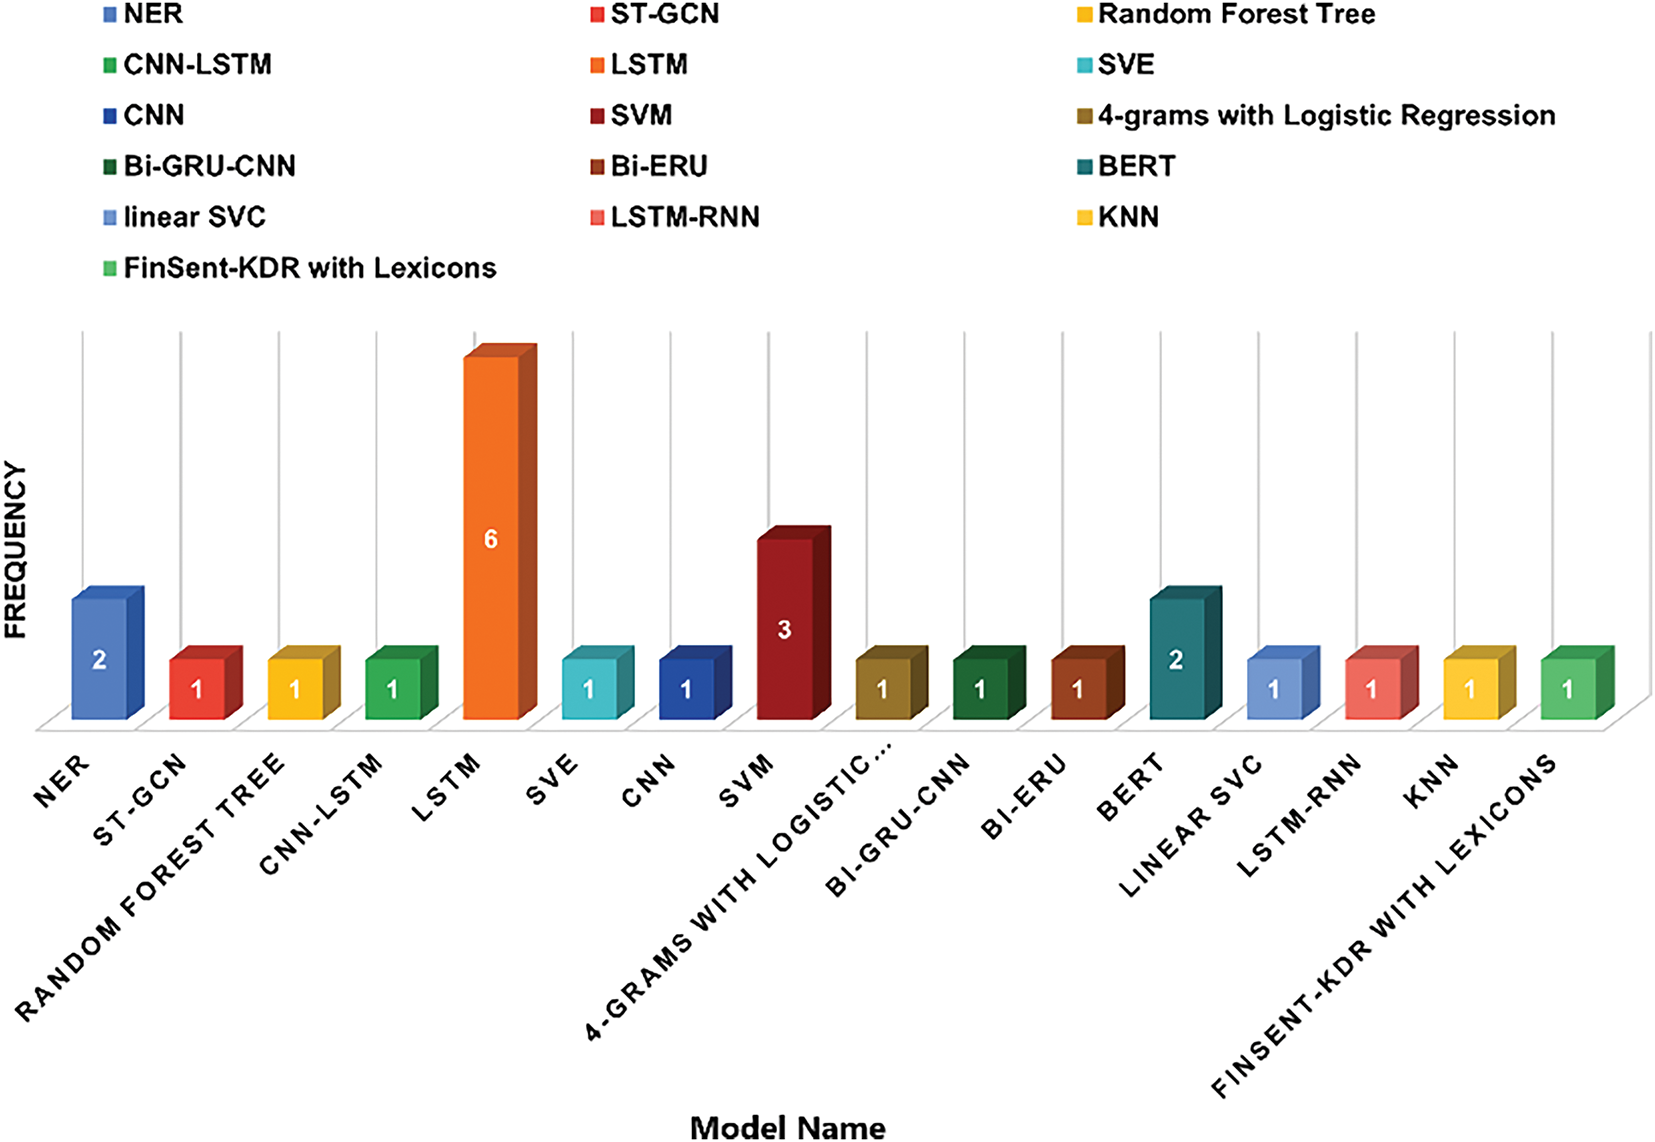
Figure 10: Deep learning models for detecting sentiment of people
Now we have also observed the accuracy of each paper which is shown in Fig. 11, and we can see here that most of the work is done with NER, LRR, and many models. The performance scores of all algorithms are in close proximity, as evidenced by the graph. It identified certain deficiencies in certain research; for instance, certain researchers failed to implement substantial modifications to data preprocessing. Certain individuals have worked with a limited quantity of data, which can impact the performance of ML and CNN methods on larger datasets after the requirement for satisfactory results has passed. However, it can be seen that sometimes good results are also obtained for small datasets. Again, it can be seen that many people want to express their sentiments in many ways, so many times, some mistakes and some errors happen. Therefore, it preprocesses the data from the required CNN model and shows the trend of the data.
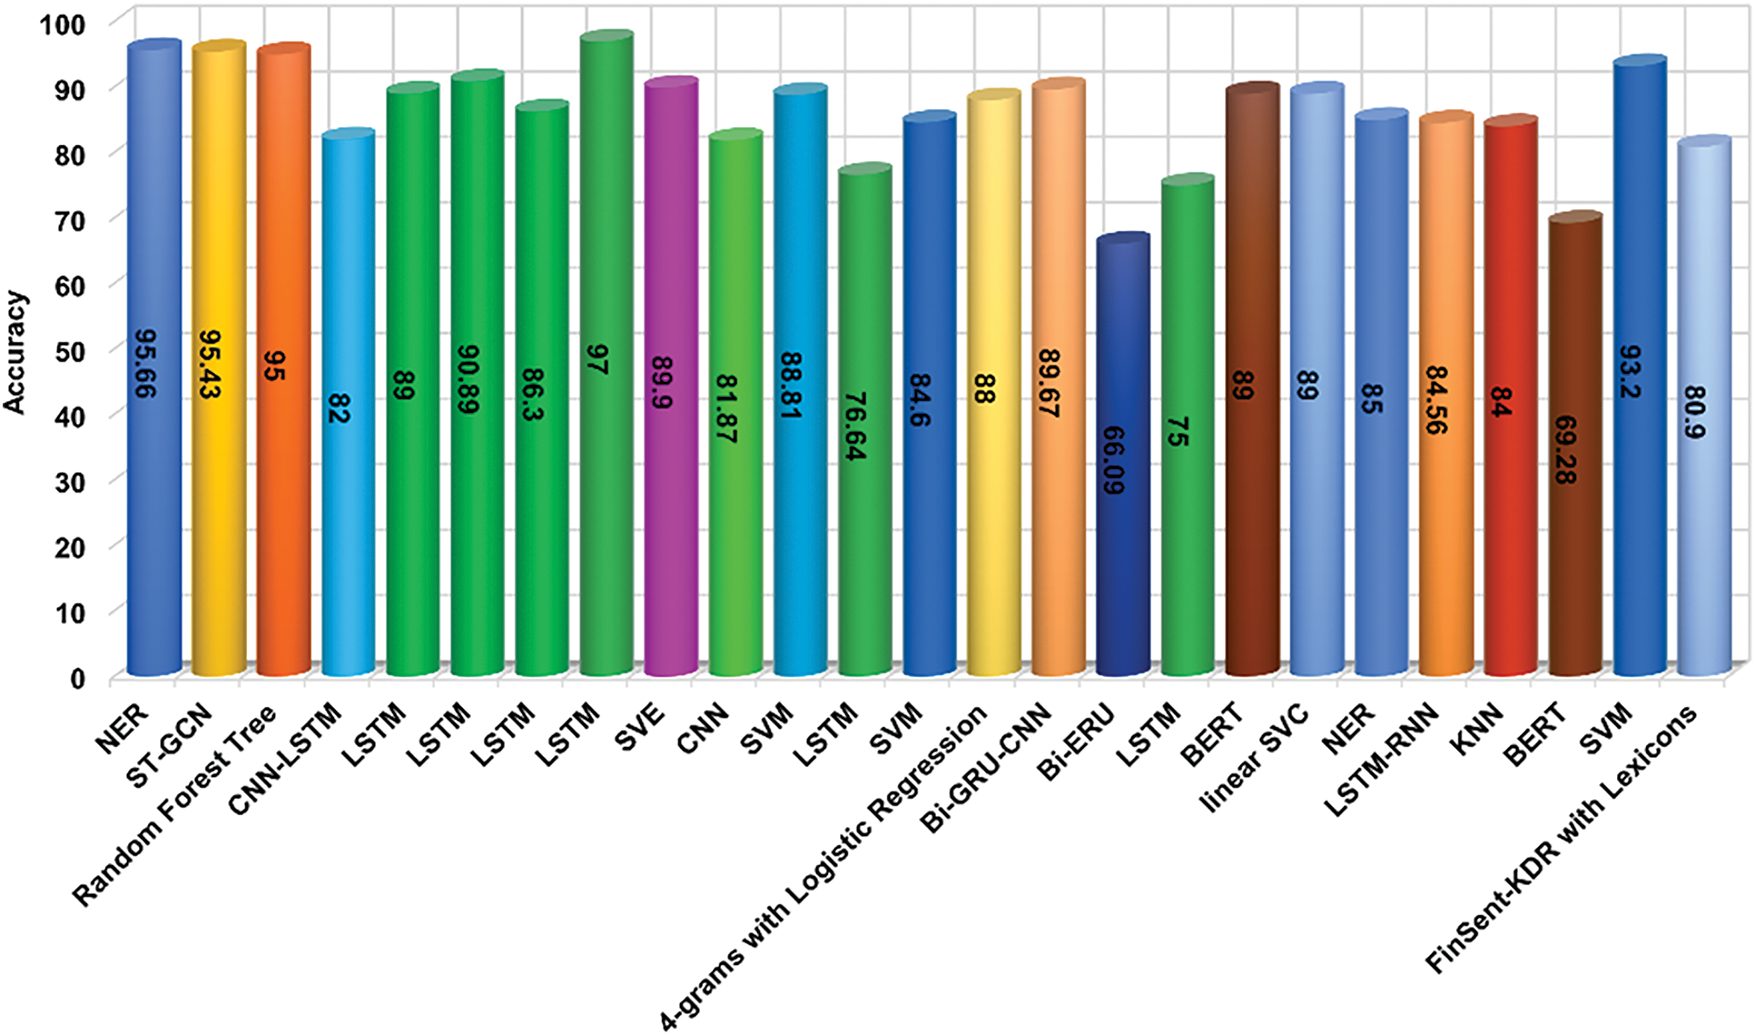
Figure 11: Accuracy of the models and the study
Sentiment analysis with NLP is of utmost importance for individuals speaking different languages, as it empowers businesses to comprehend customer feedback, enhance customer support, uphold the brand reputation, conduct thorough market research, analyze political and social sentiment, facilitate effective cross-cultural communication, and proficiently moderate online content. As different languages possess distinct linguistic features, it is advisable to experiment with various models tailored for each language. This approach allows for a more comprehensive understanding and accurate representation of linguistic nuances across diverse linguistic contexts. By utilizing different models specifically designed for each language, we can enhance the overall effectiveness and performance of natural language processing systems in multilingual scenarios. This not only improves the accuracy of language-specific tasks but also ensures a more nuanced and culturally sensitive interpretation of text in various linguistic domains. Notably, the utilization of diverse language datasets shown in Fig. 12 further reinforces the significance and relevance of sentiment analysis across linguistic boundaries. We have extensively reviewed a diverse range of research articles. Considering English is the universally recognized language for scholarly communication, a significant majority of the studies we examined were conducted in English. Additionally, our analysis revealed that Bangla emerged as the second most prevalent language among the research papers. Furthermore, we identified two research papers that specifically focused on Arabic language studies. Additionally, various other languages, such as Turkish, Malay, Roman Urdhu, Colloquial Arabic, and Brazilian Portuguese, were each utilized in a single research paper.
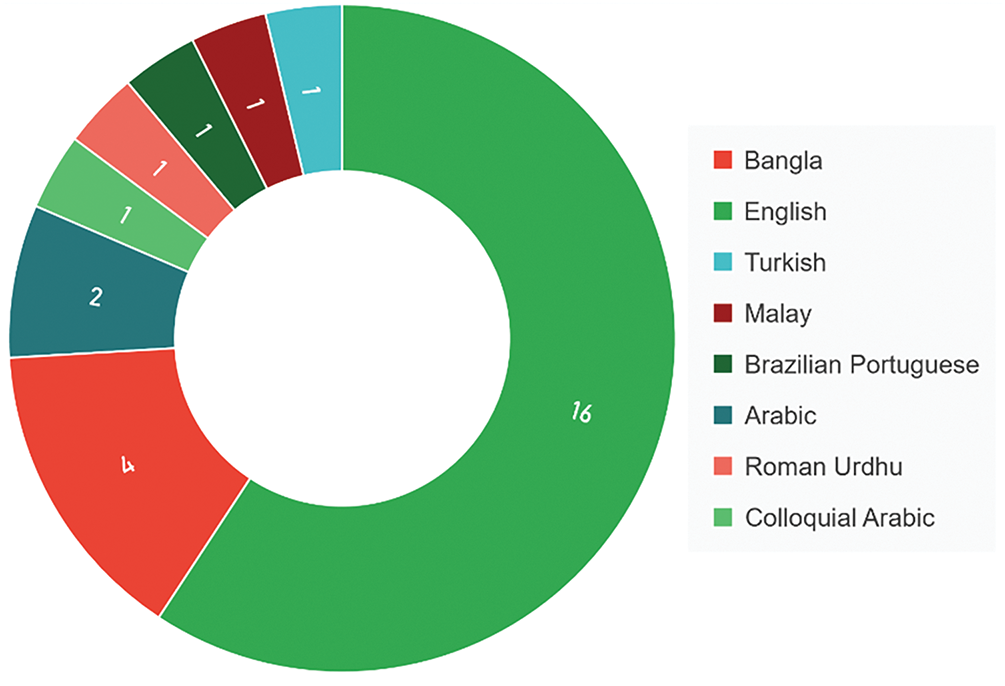
Figure 12: Categorized dataset by language
This section will provide a detailed description of each model that has been incorporated into this review. We have organised it into three distinct subsections: Social Media Review, E-commerce Review, and Others. According to Fig. 13, approximately 64% of the data was obtained from social media websites, 12% from e-commerce platforms, and 24% from other sources. Initially, we will provide a comprehensive description of each individual contribution. Subsequently, we will compare the contributions and provide our observations.
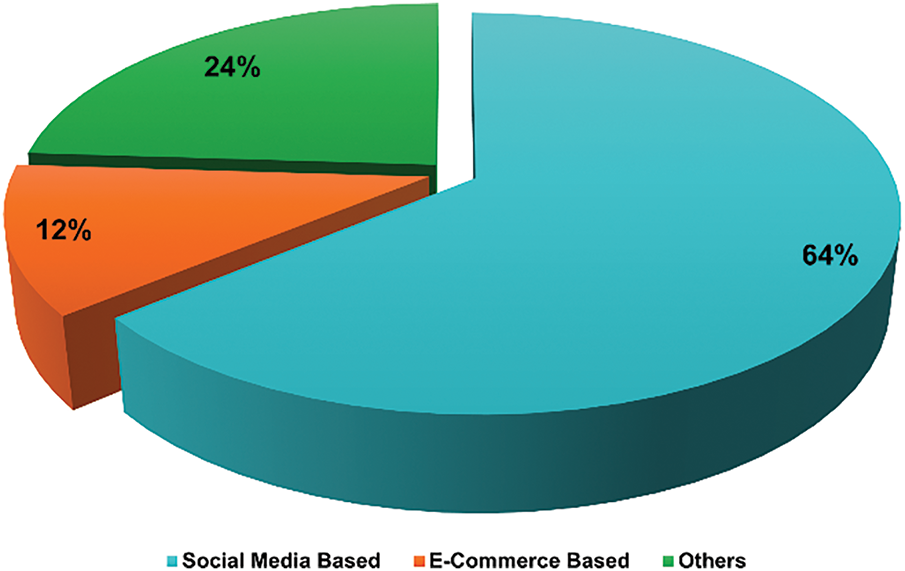
Figure 13: A pie chart of dataset sources
4.3.1 Model-Based on Social Media Review
Here we will provide an overview of various models employed for analyzing social media datasets. A comprehensive examination of each model is presented in Fig. 14. The provided figure demonstrates that LSTM emerges as the predominant choice for this type of dataset as it has been used 3 times, while NER and SVM follow suit by being used 2 times each. Notably, other models, such as CNN, BERT, BI-ERU, etc., are utilized only once for this specific dataset. A summary of the models utilizing Social Media Reviews as training dataset can be found in Table 2.
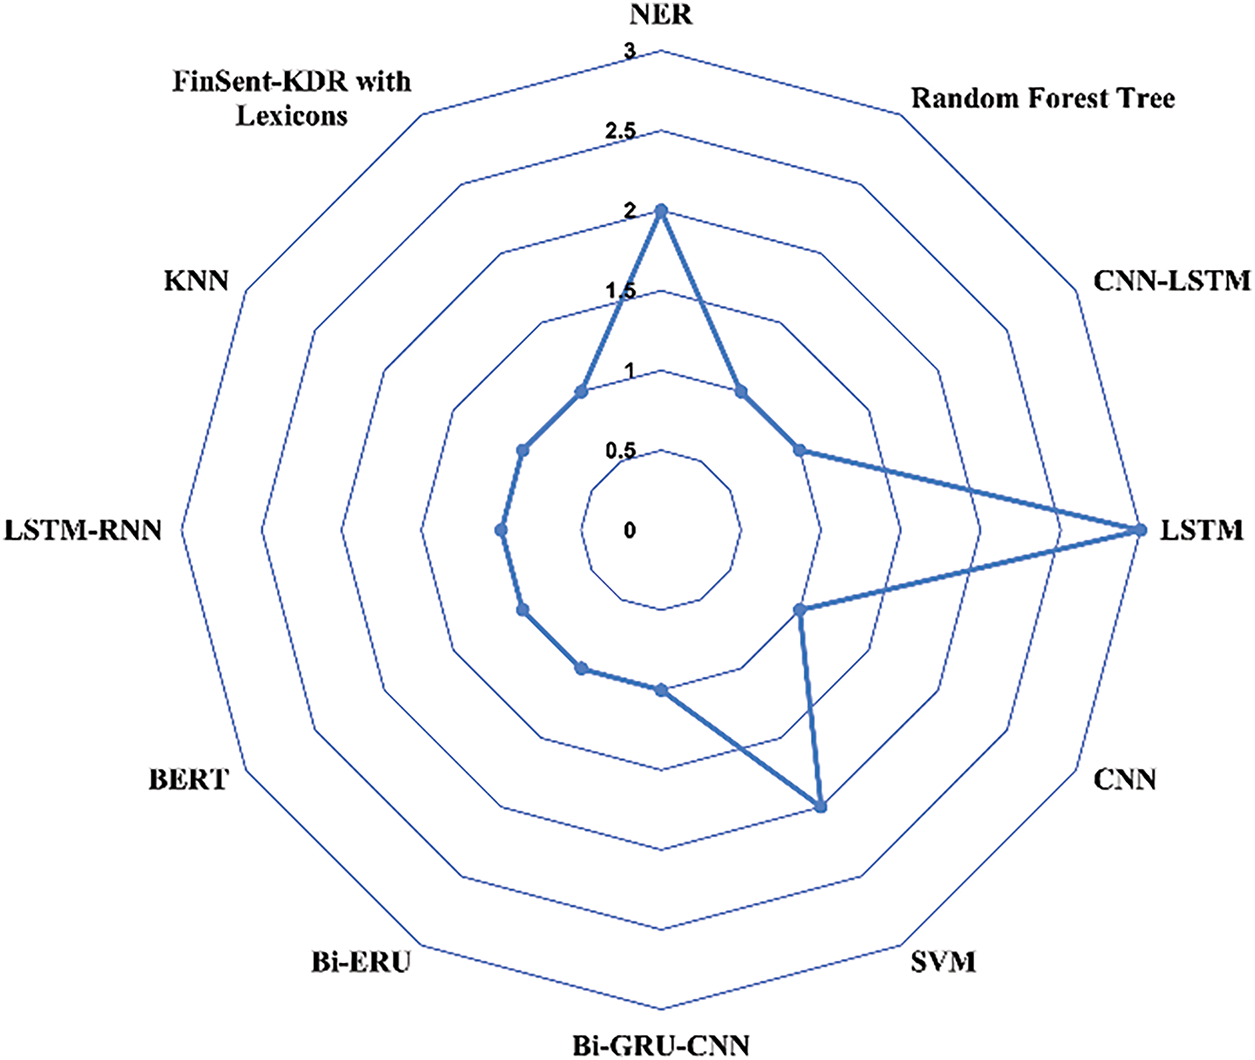
Figure 14: Models based on social media review
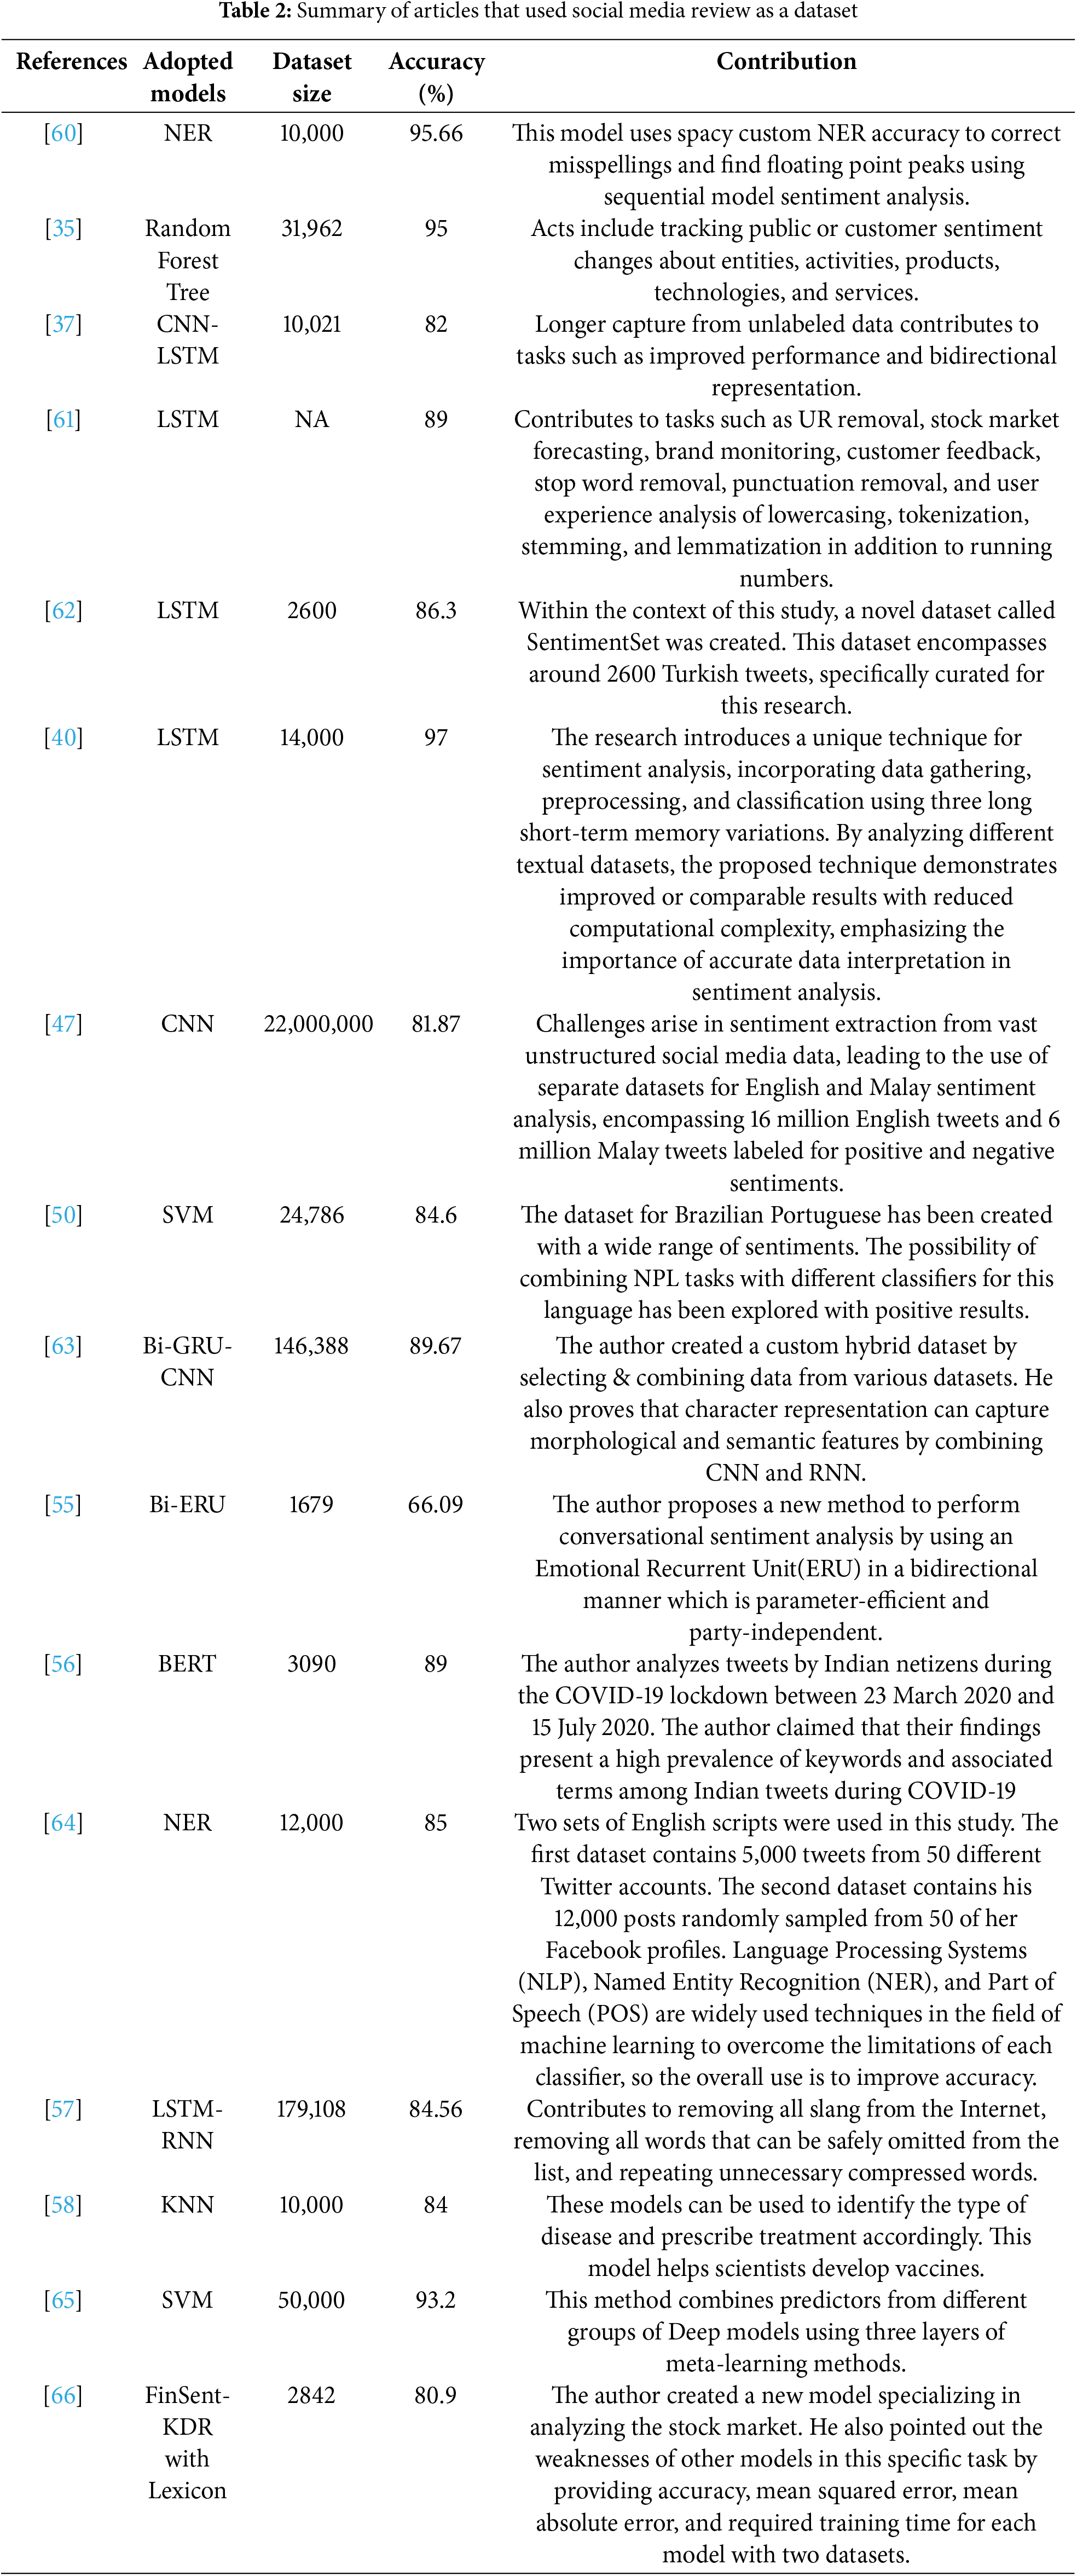
NER-Based [60]: There are millions of Bengali-speaking population, most of whom use social media to communicate with each other. People share their positive and bad experiences on social media. Likewise, this model has been used to correct misspellings using Spacy Custom NER accuracy, find floating-point peaks using Sequential Model Sentiment Analysis, and contribute to gender prediction using the Google Cloud Platform. Also, this study collects gender-based Bengali text data using sentiment analysis and named entity detection and evaluates the most popular smartphones according to market demand in Bangladesh. The process followed by this paper can be seen in Fig. 15. In the Bangladesh market, this model achieved 87.99% accuracy in Spacy Custom Named Entity Recognition, 95.51% accuracy in Amazon Understand Custom NER, and 87.02% accuracy in hierarchical models for demand analysis. Following Spacy’s research, Levenshtein was able to handle 80% of the errors associated with misspelled words using a combination of distance and ratio algorithms and characterized this model as successful. According to comments and post data from consumers, Amazon is the most in-demand device model. Which gave the highest accuracy of 95.66% in the data set.
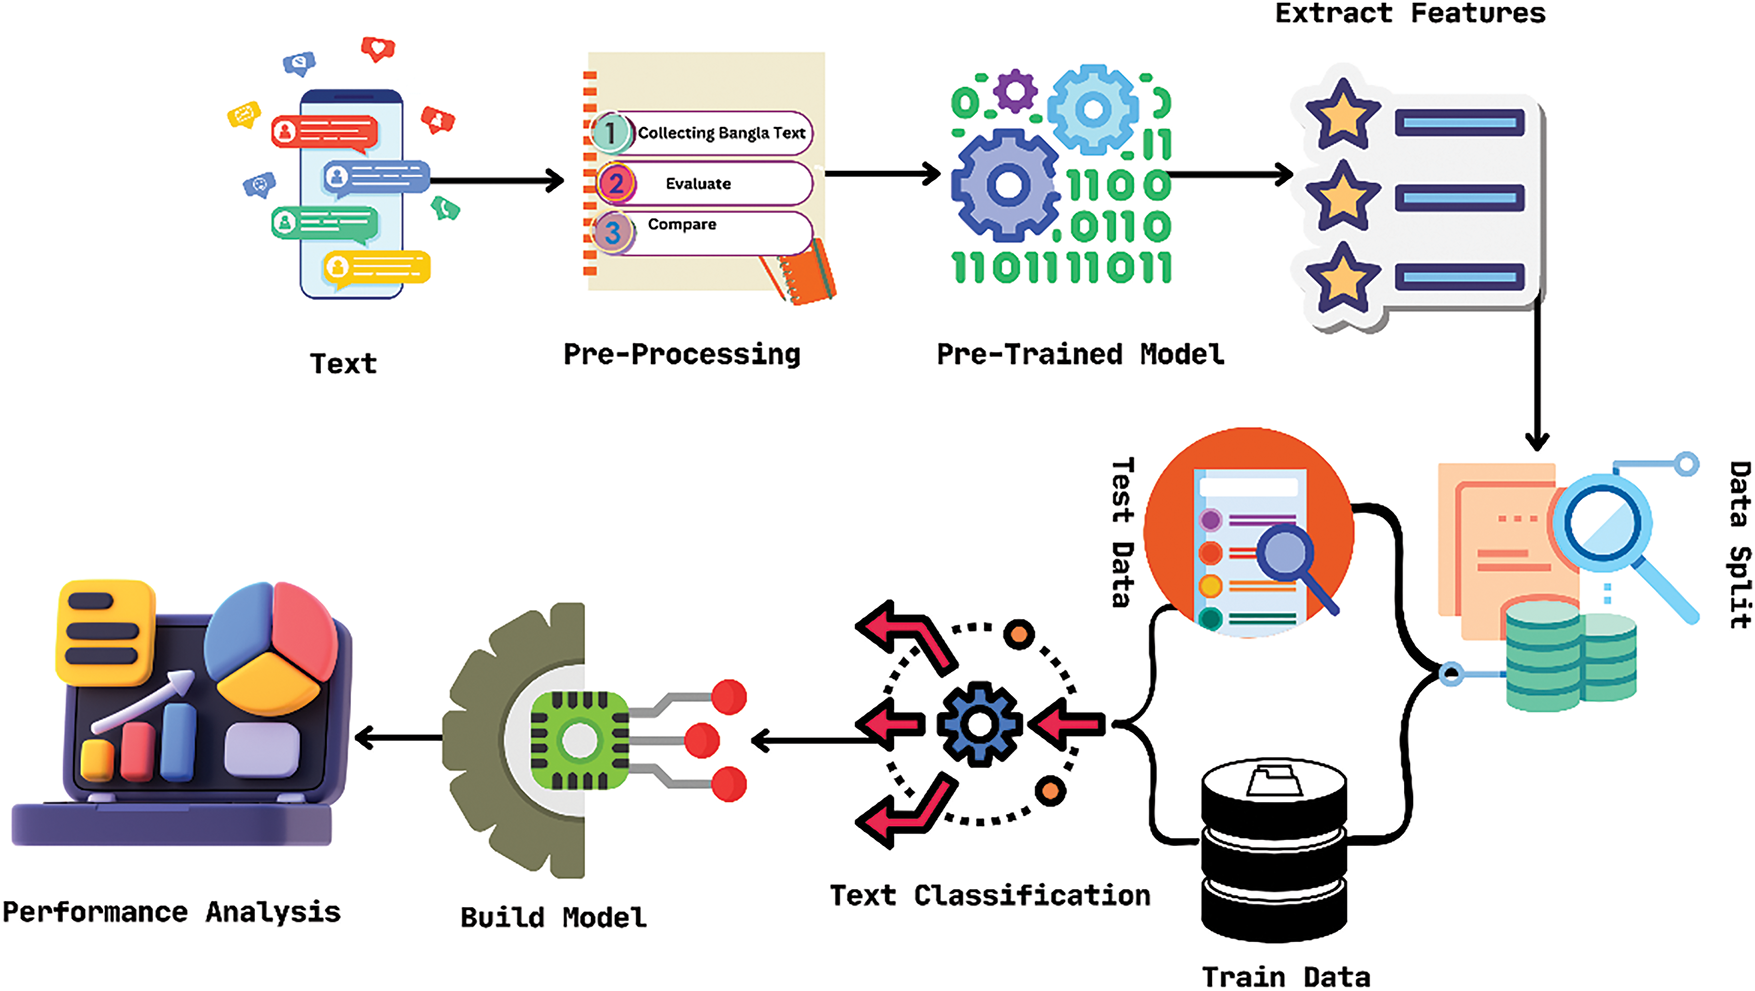
Figure 15: NER-based model for Banglish text
Random Forest Tree [35]: The number of social media users is growing daily. People are continually leaning towards it. People are often drawn to both the positive and negative qualities. The discussed model in this paper helps to change the public or customer perceptions about entities, activities, products, technology, and services through sentiment analysis techniques. This study used Twitter’s voting system to collect data from tweets. Text mining is used to pre-process tweets and create a vector space model based on document and phrase frequency. Sentiment analysis is accomplished using random forest, decision tree, and logistic regression algorithms. Pang et al. analysed movie comments using NP, Naive Bayes (NB), and Support Vector Machines (SVM). SVM outperformed all four methods, but TF-IDF was utilised for sentiment analysis. Researchers showed that the SVM algorithm outperformed other approaches by 82.11%. The study found that the latest Random Forest Tree algorithm achieved 95% accuracy.
CNN-LSTM-Based [37]: This model LSTM layers contribute to tasks such as capturing long, improving performance, and bidirectional representation from unlabeled data to deepen pre-training. This model uses embedding machine learning classifiers for Roman Urdu and English dialects using CNN and LSTM architectures while evaluating the performance of different words. Various noise vector models support this model. Research has shown that Word2Vec and BERT models are suitable for acquiring semantic and syntactic information for Roman. So due to the performance of CNN, it is suggested that the model gives an accuracy of up to 5%. Besides, 84.30% are positive in this model Review, and 83.90% of negative reviews are correctly classified.
LSTM-Based [61]: The model discussed in this paper is useful for tasks such as stock market forecasting, brand monitoring, customer feedback, stop word removal, punctuation removal, and user experience analysis of lowercasing, tokenisation, stemming, and lemmatisation, as well as running numbers and moving UR. This paper aims to address the issues of sentiment polarity classification by presenting a comprehensive technique for categorising sentiment opposition, along with a thorough process explanation. With the analysis results, sentence-level and review-level classification are performed. For this textual data analysis, the SVM method achieves nearly 79% accuracy, whereas Long Short-Term Memory (LSTM) networks get nearly 89% accuracy.
LSTM-Based [62]: People use social media websites in their daily lives. That’s why it is an excellent data source for sentiment analysis. In this model, they aim to analyze social media data sentiment. The author used a public dataset belonging to Beyaz(2021) and another dataset named SentimentSet (Balli 2021). The SentimentSet dataset has been developed within the scope of this study. The SentimentSet dataset consists of approximately 2600 Turkish tweets. Each tweet is marked as neutral, negative, or positive. Google Collab was used as the working environment. The author claims that two different datasets have been used for sentiment analysis in this model. After collecting the dataset, the author works with 3 phases: Data preprocessing, Training with Machine Learning Algorithms, and Classification with trained models. The author used stemming/lemmatization, Snowball library of NLTK, and Text Vectorization in the data with roots. As a text vectorizer, the TF-IDF technique was used. After that, a Machine learning algorithm was applied. Different machine algorithms like Logistic Regression, SGD, Random Forest, Bayesian, SVM, and LSTM models were used for training purposes to see which one performs better. After that, the author claims the best accuracy he got from LSTM is 86.30%. The classification accuracy does not exceed 87% with the test data from both datasets and 84% with small “Sample Test Data” created from the SentimentSet dataset.
LSTM-Based [40]: This study focuses on extracting meaningful insights from unstructured textual data in popular social media platforms like Twitter and Facebook. The researchers are motivated by the considerable challenge posed by the abundance of textual data in social media and consumer reviews. To address this challenge, they propose a novel technique for sentiment analysis that aims to accurately analyze and interpret sentiments expressed in online content to obtain valuable insights. The research contribution lies in introducing a technique that combines data gathering, preprocessing, and classification, utilizing three different variations of long short-term memory (LSTM) models. The proposed technique demonstrates promising results, either surpassing or being on par with existing methods while also reducing computational complexity. The significance of accurately interpreting data for sentiment analysis is highlighted in this study. The employed method involves the use of LSTM classifiers based on recurrent neural networks. Three distinct models (referred to as Model 1, Model 2, and Model 3) are developed, each with network architecture and parameter variations. The training dataset consists of a large number of reviews, with a separate dataset used for performance assessment. To process the review text, a word embedding vector model is utilized, converting it into numerical feature vectors. The LSTM-based classifiers are then trained, and evaluated, and their performance is assessed using a test dataset. This paper follows the pattern illustrated in Fig. 16. The study reports noteworthy achievements based on the utilization of different datasets. The LSTM-based approaches yield an overall accuracy level of over 85%. Notably, the best accuracy rate of 97% is achieved when applying these approaches to the Amazon Products dataset. These results underscore the effectiveness of the proposed technique in accurately analyzing sentiment in textual data
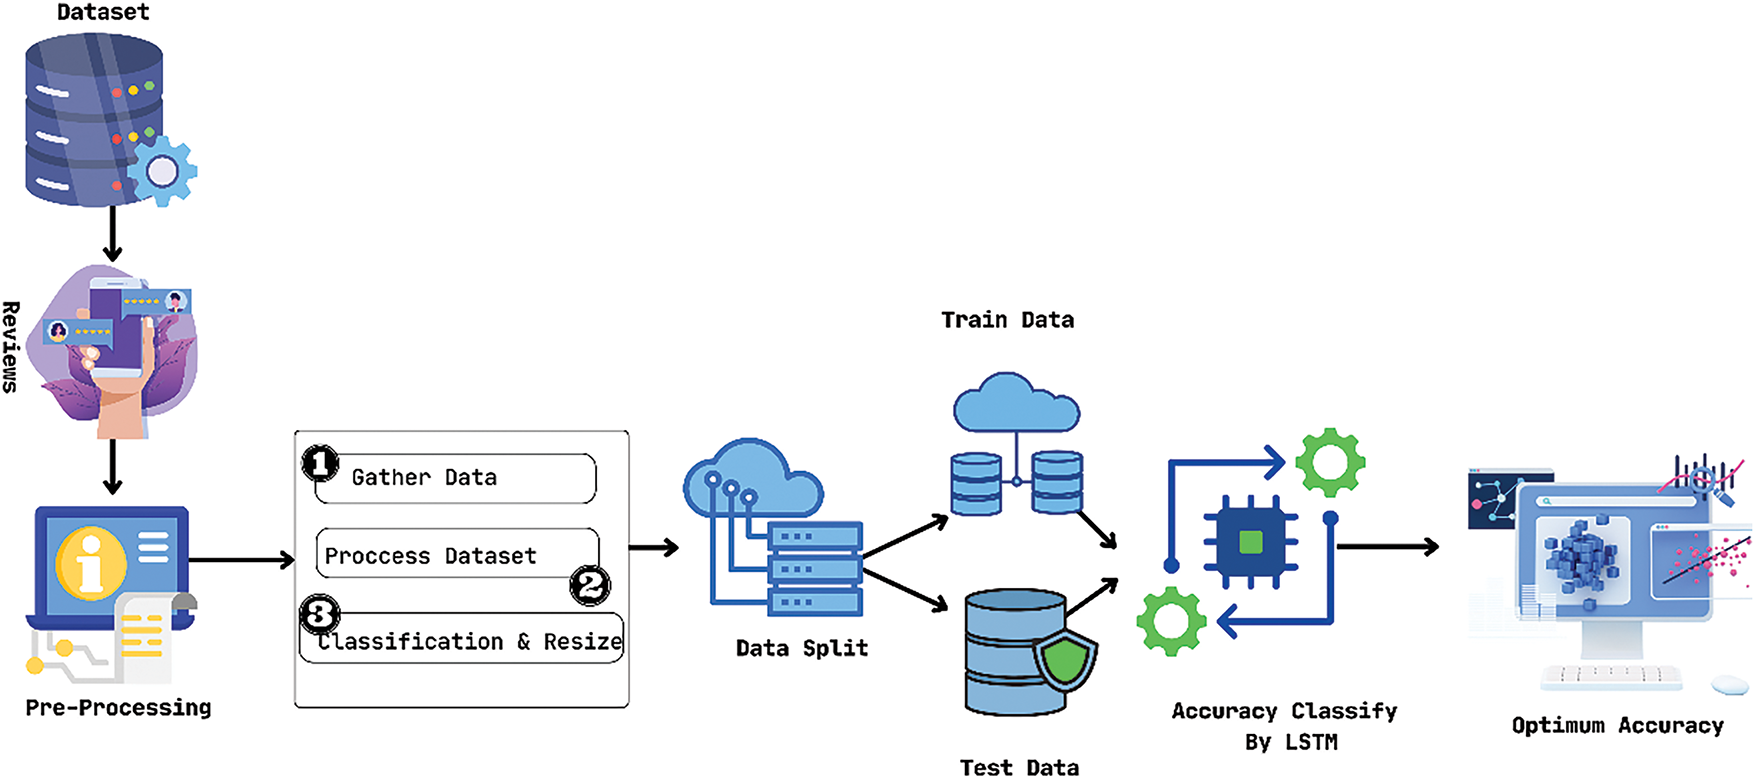
Figure 16: LSTM-based model for consumer review
CNN and LSTM Based [47]: Malay is Malaysia’s international language, and a significant number of users use the Malay language for their tweets. There is less research done with this language. That’s why the author chose Malay tweets for sentiment analysis in this study. In this model, a deep CNN and LSTM have been used to get comparatively better accuracy. Mostly, the data on social media are unstructured. If the unstructured data becomes larger, it becomes tough for humans to extract sentiment from that data. Many people use the Malay language for their tweets. But, there is a limited amount of research done with this language. That’s why the author uses. Malay tweets dataset for this research. Two different datasets have been used separately in this study, the English SA model and the Malay SA model. The English dataset contains 16 million English tweets with positive and negative labels. The Malay SA dataset contains 6 million Malay tweets with positive and negative labels. In this study, first, the author collects the raw data and then starts preprocessing it. The preprocessing steps are split hashtag into words, and capitalization. After that, the author removes the number, html tag, and URL. Then, the author starts to normalize the data by doing lemmatization and stemming. After normalizing the data, the author begins to stop word removal, tokenization, and Data Annotation. When the preprocessing steps have been done, the word2vec method has been used to convert text into numeric representation. Before training the model, the author splits the data into train, test, and validation datasets. 80% data has been selected as train data, 10% has been selected as test data, and 10% data has been chosen as validation data. CNN sentiment analysis model has been used for this research. The author uses hyperparameter tuning to tune and optimize the deep learning model. After doing hyperparameter tuning, it’s time to train the data with the CNN sentiment analysis model. The author claims using Indonesian CNN without a Normalizer, the accuracy is 69.92%; using Indonesian CNN with a Normalizer, 65.45%; using Indonesian LSTM with a Normalizer, the accuracy is 73.22%; using English SA CNN, the accuracy is 81.87%; using Malay SA CNN, the accuracy is 77.59%.
SVM-Based [50]: The dataset for Brazilian Portuguese has been created with a wide range of sentiments. The possibility of combining NPL tasks with different classifiers for this language has been explored with positive results. The author has used tokenization, Part-of-Speech (PoS), stemming, conversion to lowercase, n-grams extraction, representation of documents, and classification sequentially to solve their problem. As they are using 5 preprocessing steps, with each step having two possibilities, they had to evaluate 32 combinations of preprocessing per classifier. They also used the following classifier Random Forest, Support Vector Machine Multiplayer Perceptron to create the combination mentioned in the above paragraph. The author claims that the results in the elite group are equivalent to the already available combination. The author also implied that six combinations made by preprocessing with classifiers were in the elite group. According to the author, using classifiers can greatly improve the performance of preprocessing tasks. However, 5 of these combinations used the SVM classifier. On average, the accuracy was 84.6%, the highest being 97%.
Bi-GRU-CNN-Based [63]: The author created a custom hybrid dataset by selecting & combining data from various types of datasets. The author also proves that character representation can capture morphological and semantic features through the combined use of CNN and RNN. The author used two datasets to train and test the architectures. One is a hybrid dataset comprising data from various datasets, and the other is BRAD, a public dataset comprising book reviews. Positive data was elected to be the 4 or 5-star reviews, while any ratings below that are considered negative. They used 70% of these data for training, 20% for development, and 10% for testing. The efficiency of the model was evaluated by accuracy number and F-score. To assess the models’ ability to detect language features accurately, models trained on a hybrid dataset were tested using the BRAD dataset. Fig. 17 shows how this paper works. The author claims to achieve 89.67% accuracy from the hybrid dataset using the Bi-GRU-CNN model and 83.20% accuracy from the BRAD dataset using the former model.
Figure 17: Bi-GRU-CNN based model for Arabic language
BERT-Based [56]: The biggest problem in this digital age is the spread of false and misleading news, starting big lies on trivial matters, which can be easily spread among people from all walks of life through social media. Monitoring and studying these social media activities can improve quality control platforms and disseminate real information to the world. During the COVID-19 pandemic, the author gathers statistics from Indian citizens’ tweets. And evaluated the data using the BERT (Bidirectional Encoder Encoding from Transformer) model and compared it to three other models: support vector machine (SVM), logistic regression (LR), and long-short-term memory (LSTM). He obtains some degree of precision; also the working process of this model can be seen in Fig. 18. Here are the outcomes: BERT 89%, LR 75%, SVM 74.75%, and LSTM 65%. As a result, the average precision is 79.34%.
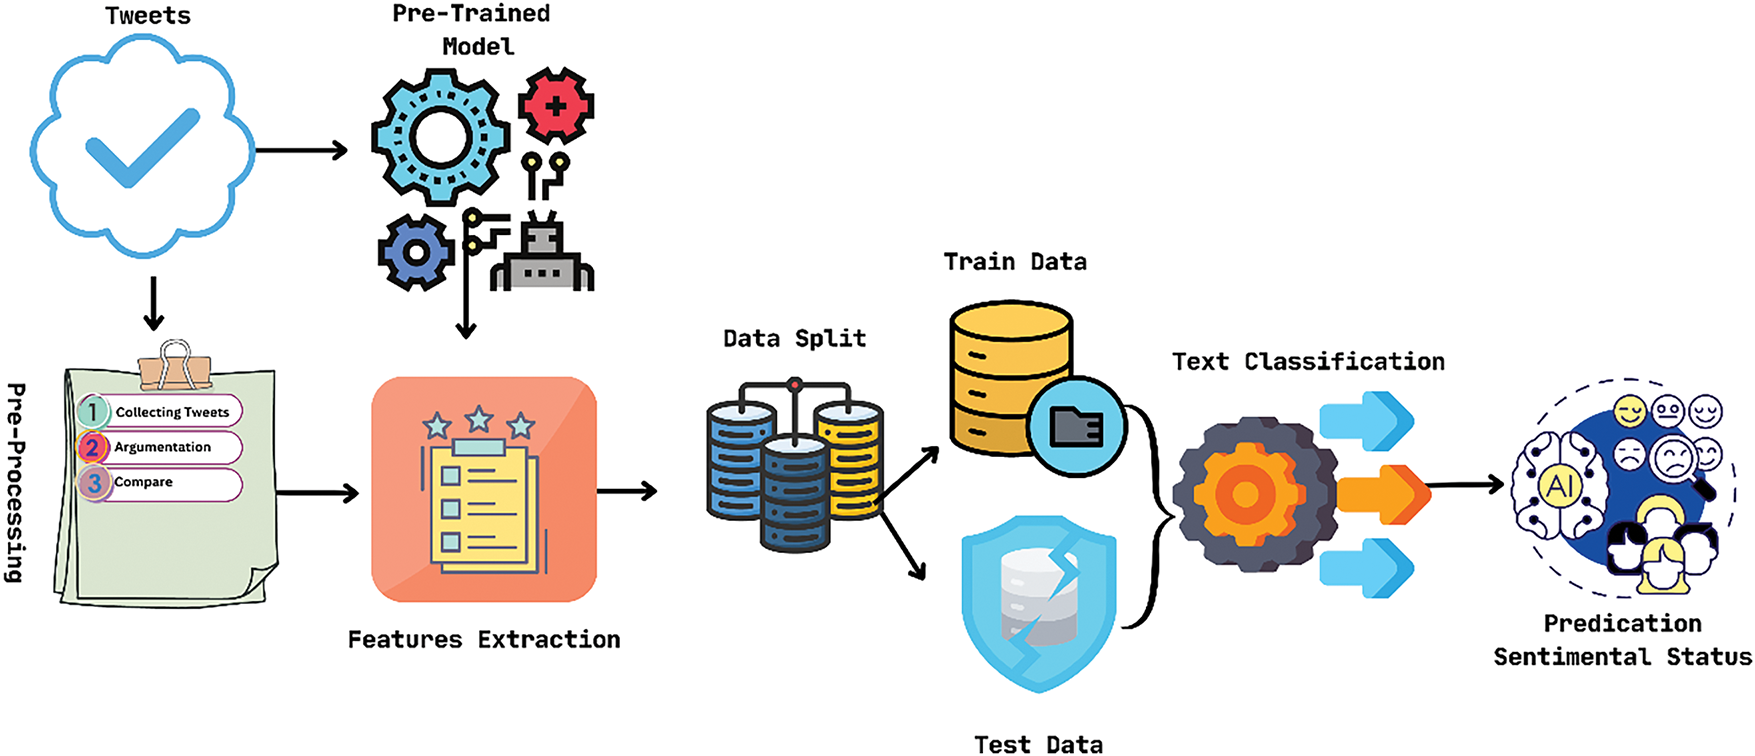
Figure 18: BERT-based model for COVID-19 tweets
BERT-Based [64]: The authors analyzed their approach using various measures and found that out of 5000 tweets, 50.8% were neutral, and 39.2% were negative. Showed that. Second, the majority of Facebook users had a neutral reaction. That is, 55.6% have a positive opinion, 5.6% have a neutral opinion and 38.9% have a negative opinion. However, the selected dataset is rather small compared to his daily tweets. The same is true for Facebook, where it can be trained using real-world data from Twitter and Facebook and a huge database of labeled examples with incremental accuracy and effectiveness.
LSTM-RNN-Based [57]: This study suggests that the proposed deep learning method can be adopted and modified to achieve better accuracy. The main objective of this research paper is to explore deep understanding and learning methods to reflect and identify the emotional feelings of people in everyday lockdown situations. This model contributes to removing all slang from the Internet, removing all words that can be safely omitted from the list, repeating unnecessary compressed words, and keeping hashtag text as is. Also, In this paper, the LSTM-RNN method with attention level and the proposed deep learning method greatly improved all of the performance metrics, with a 20% increase in accuracy and a 10% to 12% increase in accuracy but only 12%–13% recall compared to the current method. Among the 179, 108 COVID-19-related tweets, tweets having positive, neutral, and negative sentiments accounted for 45%, 30%, and 25%, respectively. The dataset consists of more than 170 thousand tweets. These tweets have been collected and tested utilising the proposed algorithm. According to the author’s claim, this proposed approach is 84.56% accurate, which is significantly higher than the other models and the base LSTM-RNN without tuning.
KNN-Based [58]: We can promote epidemics like COVID-19 through social media through which people can be made aware. We can create awareness only by tweeting on Twitter or posting on Facebook. We have many other ways through which we can prevent many such social evils. Extract three COVID-19 vaccine tweets from Twitter and retweet them using the vaccine hashtags #Pfizer, #Moderna, and #AstraZeneca. Ten thousand (10,000) tweets were retrieved for each hashtag used as data. Only text data is extracted from tweets and its datasets are saved in CSV format. The tweets used by the author are stored and processed using NLP, and the processed data is then put through a fine classification using a supervised KNN classification algorithm. Through this classification, an algorithm used the data to classify it into three categories, positive, negative, and neutral. These categories indicate the general sentiment analysis of the tweets extracted for analysis. The authors claim analysis using NLP shows that AstraZeneca shows 408% positive, 40.06% negative, and 13.86% neutral sentiment, while Pfizer shows 47.29% positive, 37.5% negative, and 15.21% neutral, Moderna shows 46.16% positive, 40.71% negative, and 13.13% neutral. The highest accuracy of the model is 84%.
SVM-Based [65]: In this study, the authors evaluate the sentiment analysis benchmark datasets using a meta-ensemble deep learning method by running different experiments in different languages and dialects to evaluate the proposed performance. The experimental results reveal that the baseline deep learning models perform effectively using the meta-ensemble method. Also, experiments reveal that meta-learning improves performance. This meta-combination plays an important role when using probability class distributions to train meta-learners. The author presents big data, improves classification using machine learning (ML), and overcomes limitation problems using deep learning. This paper deals with complex issues and large amounts of data. The meta–ensemble using Deep learning. So, the ensemble with the SVM classifier achieved the best accuracy of 93.2%.
FinSent-KDR with Lexicons-Based [66]: The author created a new model specializing in stock market analysis. He also pointed out the weaknesses of other models in this specific task by providing accuracy, mean squared error, mean absolute error, and required training time for each model with two datasets. Text is represented using pre-trained word embeddings, incorporating words found in the pre-trained model, concepts extracted from a knowledge base, and unknown words. A sentiment prediction model is then trained using a deep neural network, which utilizes stacked dense layers over the average of the word embeddings to predict sentiment scores. The initial embeddings are fine-tuned and converted into domain-specific embeddings by using a domain-specific training corpus. These trained embeddings are then used in addition to the sentiment prediction model to create embedding pairs that consist of general pre-trained embeddings and their corresponding domain-specific embeddings. Finally, a separate neural network, known as the domain-specific embedding mapper model, is trained using these embedding pairs, allowing it to learn the mapping from general embeddings to domain-specific representations. The author claims that the proposed FinSent-KDR model with lexicon features provides 80.9% accuracy for the Twitter Dataset and an accuracy of 80.1% for the News Dataset compared to all other models. The other three implementations of this model with different embedding are also better compared to the traditional models available. Also, it is claimed that this new model takes much less time to train compared to most of the models.
4.3.2 Model Based on E-Commerce Review
Here, we will provide an overview of the models used for analyzing E-commerce review datasets. A comprehensive examination of each model is presented in Fig. 19 and a summary of the models using E-commerce review as dataset is provided in Table 3.
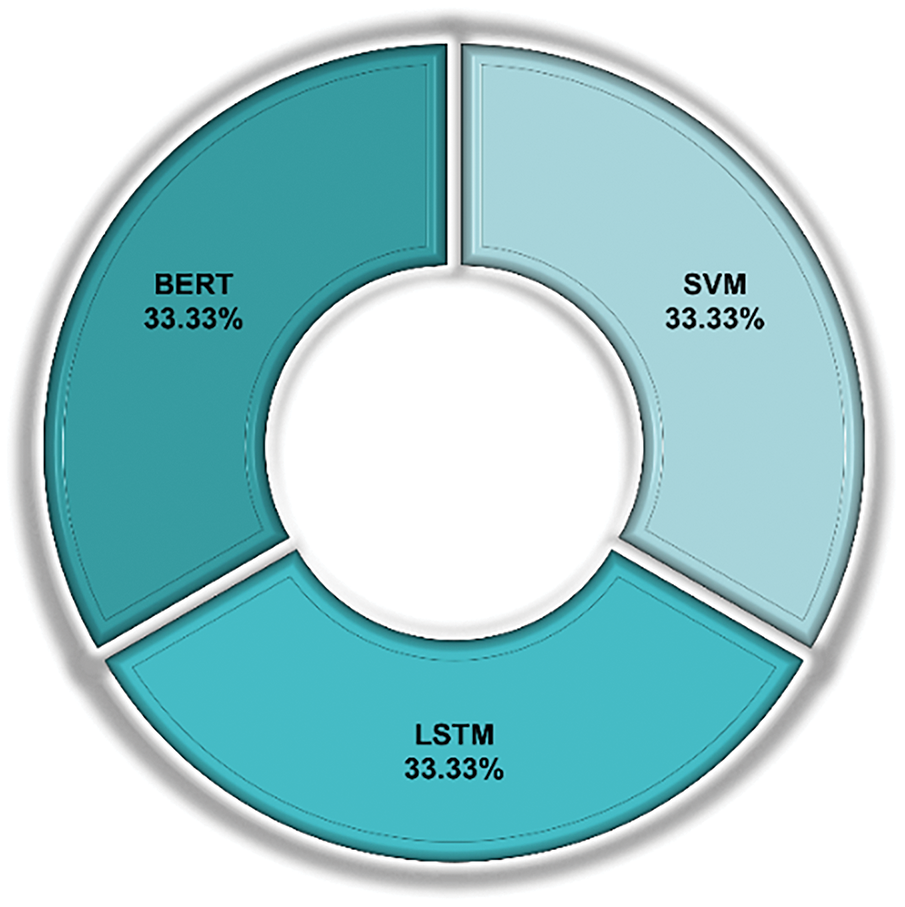
Figure 19: Models based on E-commerce review
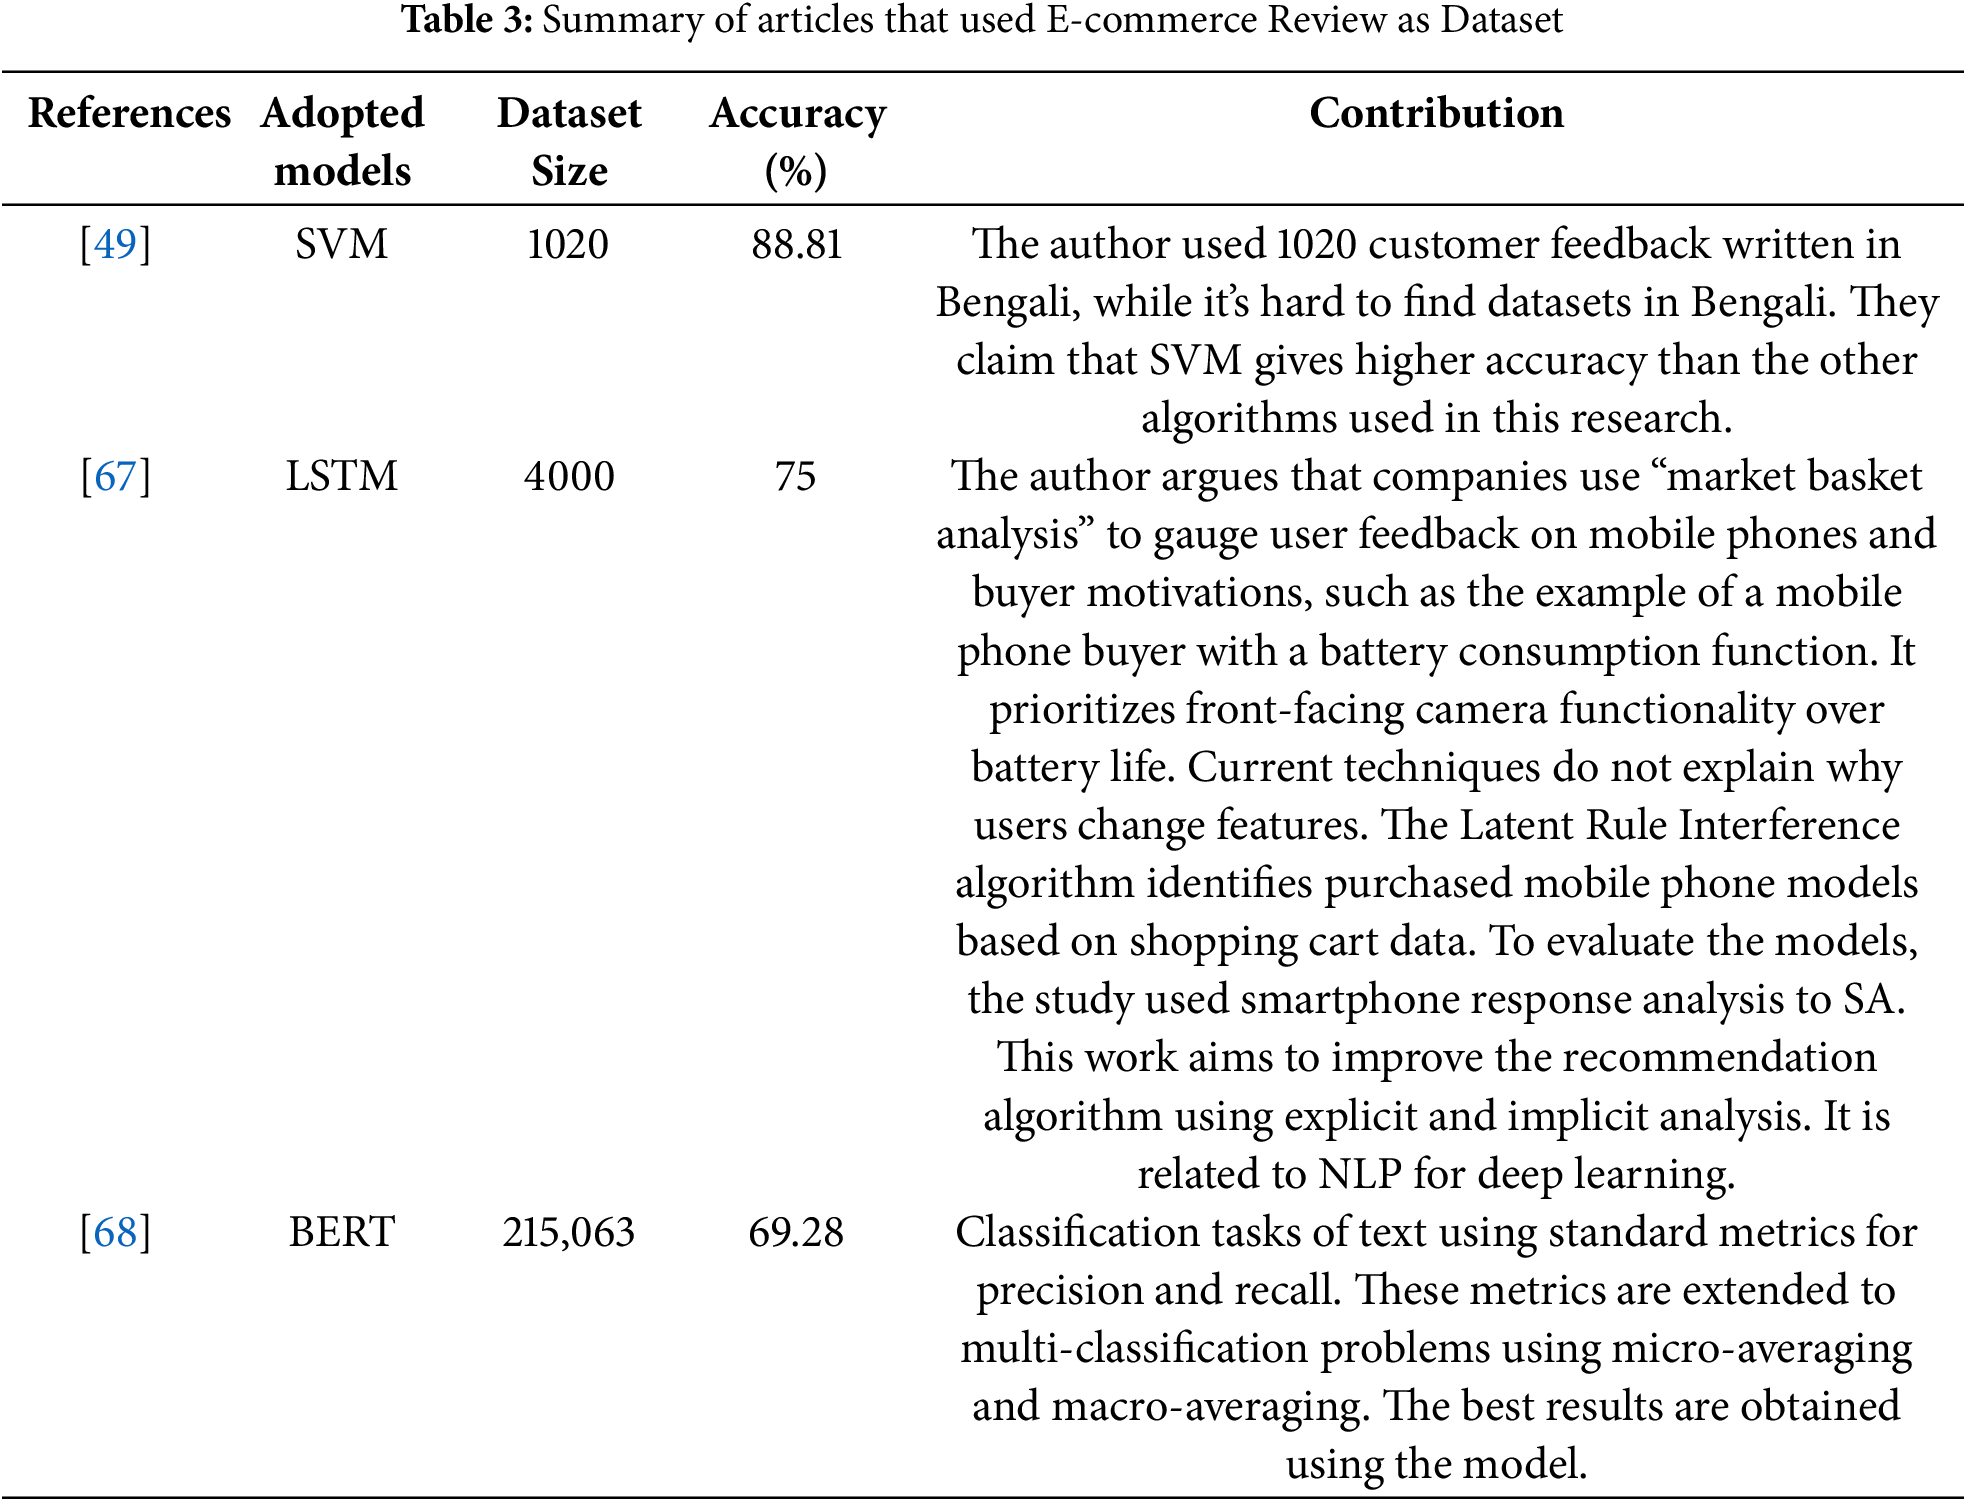
SVM-Based [49]: The author used 1020 customer feedback written in Bengali, while it’s tough to find datasets in Bengali. They claim that SVM gives higher accuracy than the other algorithms used in this research. The author collected 1020 understandable reviews from various e-commerce websites as the research data. While preprocessing the data, this author removed emojis between the reviews and added them at the end of the studies. To transform the string data into numbers, they used the TF-IDF algorithm. Before applying this algorithm, the author tokenized the data. All data is then classified into two categories ‘Positive’ and ‘Negative.’ After this, 5 algorithms were applied, and their accuracy was taken into account while the accuracy was manually checked later. This ensures the credibility of the method used. Among the 5 algorithms used, SVM had the highest accuracy of 88.81%. It allowed the author to find an optimum algorithm for sentiment analysis from Bangla text.
LSTM-Based [67]: In This Study, the authors used a combination of various data mining techniques, including sentiment analysis, to analyze customer reviews and identify the overall sentiment of the customers towards the product. The authors have accomplished the accomplishment of successfully analyzing many customer reviews using sentiment analysis and identifying the customers’ sentiments towards the product. In the research, Support Vector Machine (SVM), Machine Learning (ML), Deep Learning (DL), Natural Language Tool Kit (NLTK), and Inverse Document Frequency (IDF) are used. The author collects datasets from “http://www.kaggle.com” where there exist more than 4000 user experience reviews on mobile phones sold on Amazon.com. These are understandable reviews from various e-commerce websites as the research data. And The author achieves 75% accuracy.
BERT-Based [68]: This author can show that the dataset of the hybrid model is composed of a bivariate LSTM but that the CNN gives the best results. This model provides less accurate results than LSTM and hybrid models during CNN model training. So different deep learning architectures like CNN and LSTM are used for drug review and can be applied in depth in sentiment analysis for benchmark comparison. However, the combination of these models has the effect of different trained and pre-trained models. His transformer revolutionized NLP, which has gained the field of industry for many NLP works. And so, the author’s experiments show that the use of BERT achieves the best results, but at a very high training time. Also, it takes more time. And CNN achieves acceptable results when less training time is required, so other times, we can use CNN as well. How BERT works in this paper can be seen in Fig. 20. The model has the highest accuracy (69.28%).
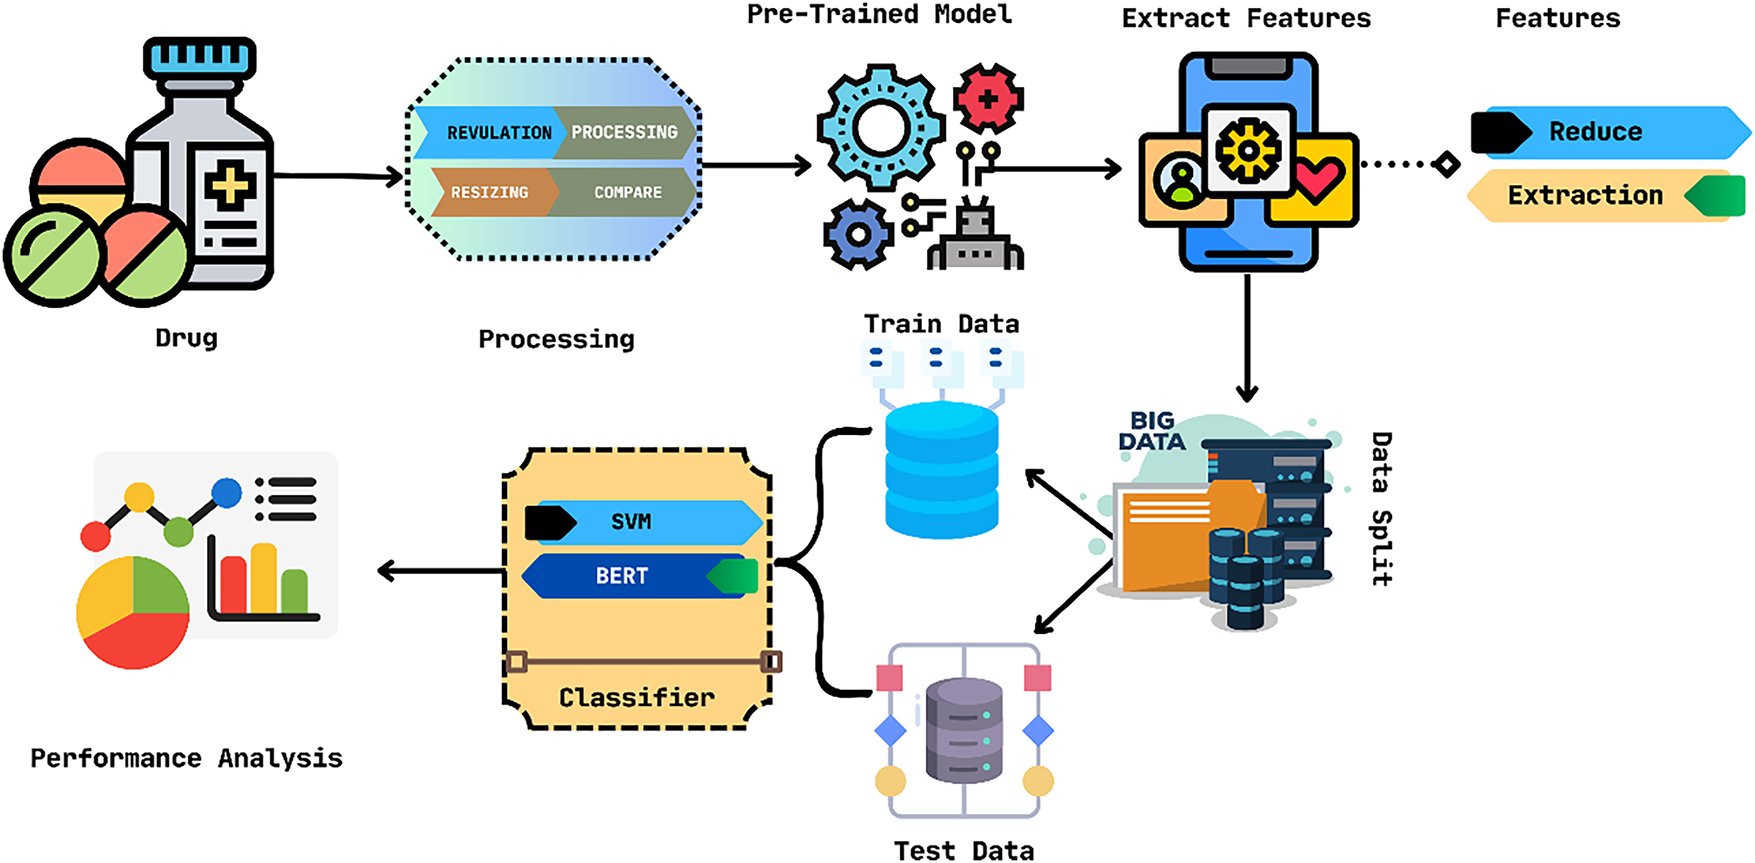
Figure 20: BERT-based model for medicine review
This section will provide an overview of the various models used to analyze other datasets. Fig. 21 depicts a thorough analysis of each model, while Table 4 provides a summary of the models using other sources as dataset. The figure shows that LSTM emerges as the preferred solution for this dataset type.
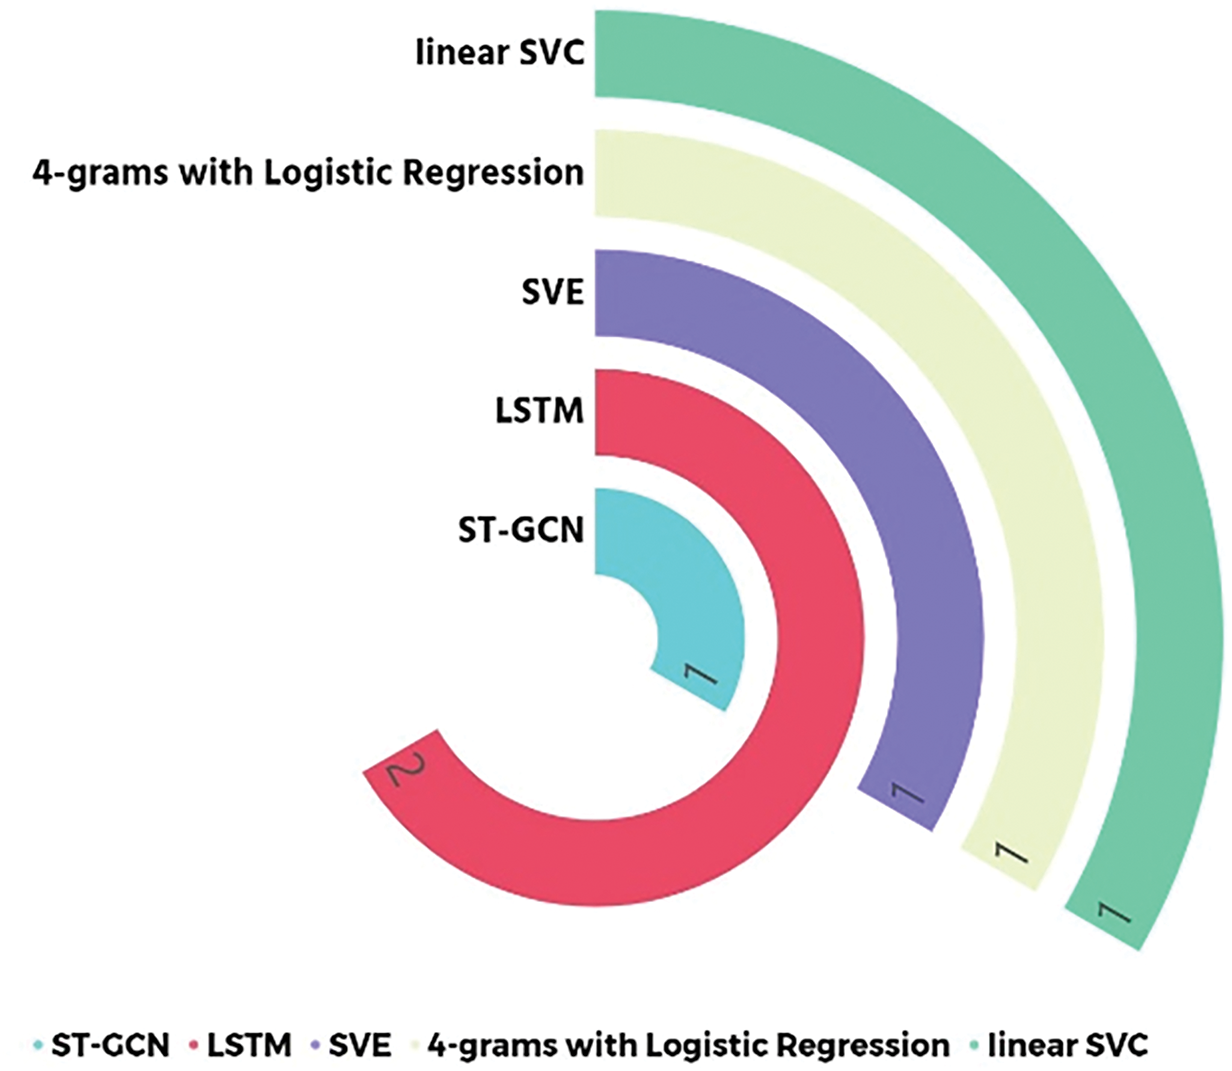
Figure 21: Models based on other datasets
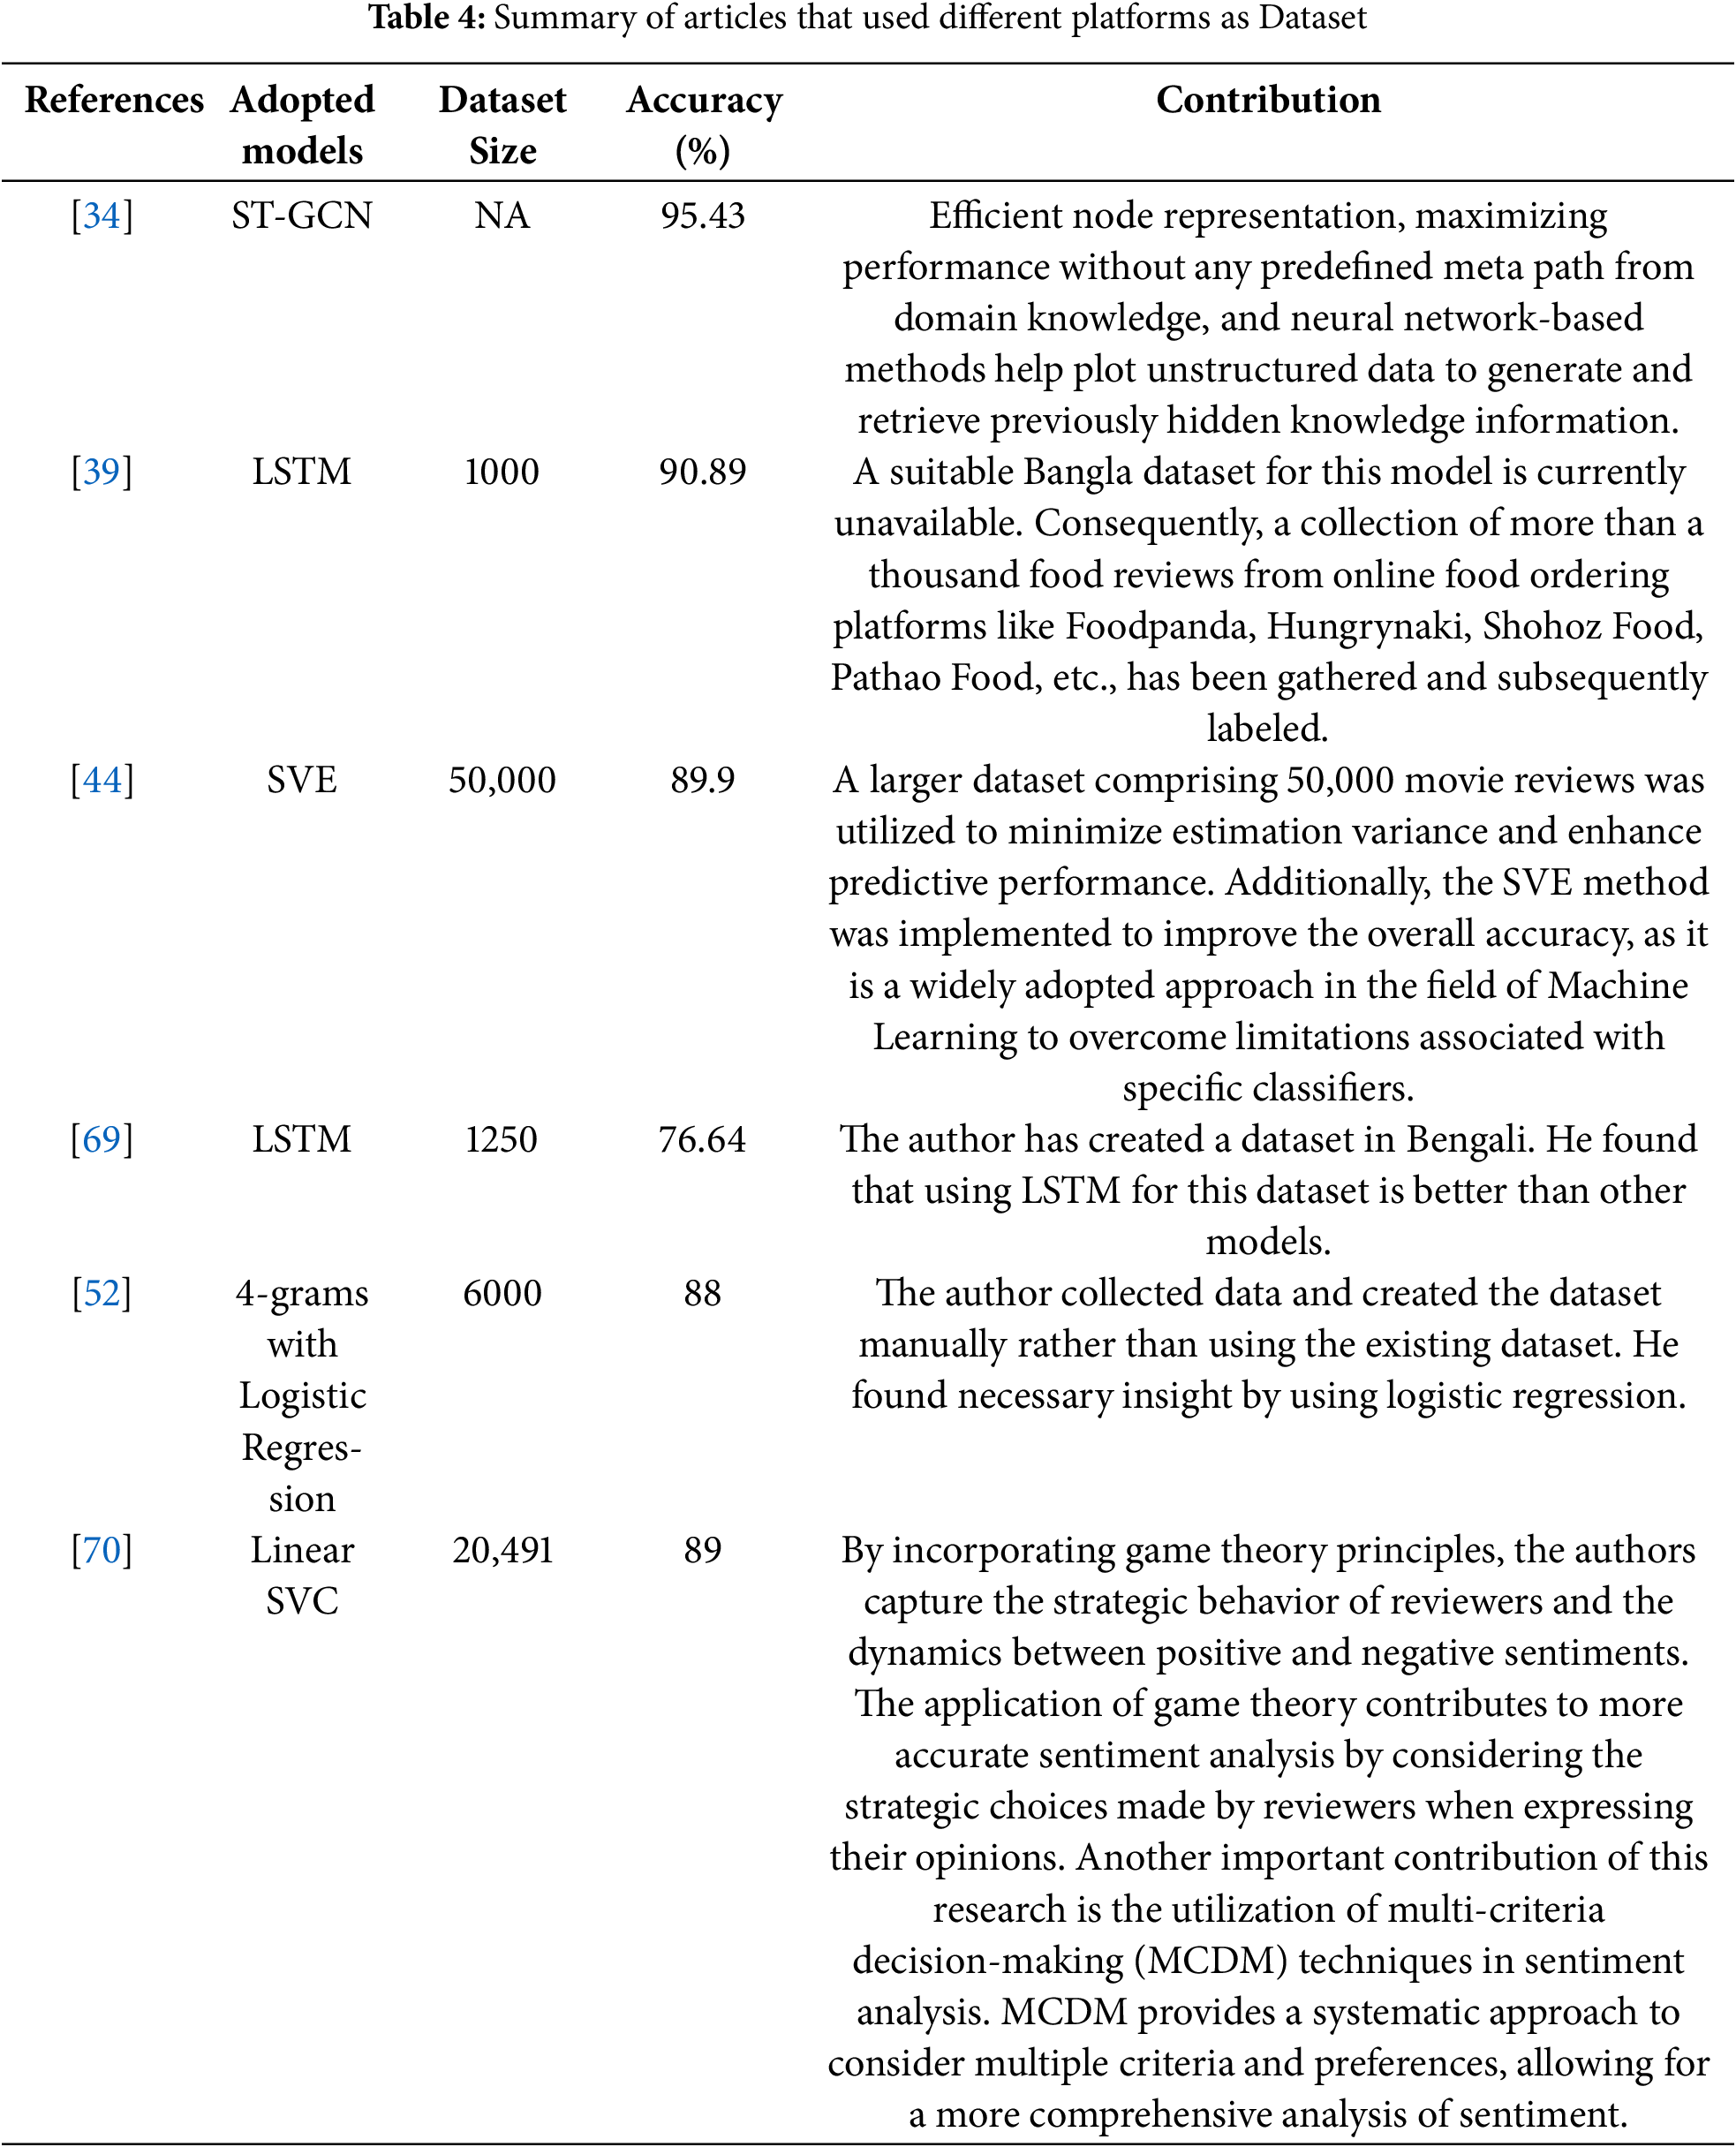
ST-GCN [34]: This model integrates infrastructure with appropriate locations through transformers; A highly efficient node representation technique of encoding and multi-head attention allows for a simple interpretation of the model through Touri. It also leads to efficient node representation, resulting in maximum performance without predefined domain knowledge metapaths. Also, Neural network-based approaches help plot unstructured data to generate and retrieve previously hidden knowledge information. From this study, the use of a different graph, such as the sentiment corpus model, can be learned, and document and word embedding can be learned using the proposed text graph transformer network. In this graph, the classification accuracy rate of the proposed model reached 95.43% on SST-B, 94.95% on IMDB, and 72.7% on the Yelp dataset.
Deep ML-Based [39]: The author claims no Bangla dataset can be used for this model. So, they have collected more than a thousand food reviews from different online food ordering platforms like Foodpanda, Hungrynaki, Shohoz Food, Pathao Food, etc., and labeled them. After collecting the raw data, the author starts to do the pre-processing. While doing the pre-processing, the author removed punctuation, removed English words, used tokenization, removed stop words, and stemming after that, joined all the tokens. After getting the clean data, it’s time to do the feature extraction. While doing the feature extraction, it uses words to sequence. After feature extraction is done, the author uses the LSTM model for training. After the training, it achieved 90.89% accuracy. The author claims that after the training, the machine learning and deep learning models got 90.89% accuracy.
Soft Voting Ensemble [44]: The author claims most of the researchers use 2000 movie reviews while doing the research work. But in this paper, the author used 50,000 movie reviews to lower estimation variance and hence better predictive performance. To improve the overall accuracy, the SVE method has been used, as it is a widely used method in the field of Machine learning to defeat the restriction of any particular classifier. The author proposed a state of art soft voting ensemble approach in this paper. 5 different types of ML classifiers have been used for this purpose: Logistic Regression, Naive Bayes, XGBoost, Random Forests, and Multilayer Perceptron. There were 6 base steps while building the model: Data collection, Data Preprocessing, Creating a word-to-vector, Base Classifier, Soft Voting Ensemble, and Movie reviews classification. In the data collection stage, the author collects 50,000 movie review data. In the data preprocessing stage, the author uses URL and punctuation removal, tokenization, stop-word removal, and stemming. In the word-to-vector stage, the author uses a TF-IDF vectorizer. While doing the Base classifier, the author used 5 methods: Logistic regression, Naive Bayes, Extreme Gradient Boosting, Gradient forest, and Multilayer perceptron. After the base classifier stage is done, it’s time to do the Soft Voting Ensemble. After the soft voting Ensemble is done, it tries to classify whether the movie review is positive or negative. After the proposed Ensemble approach, the overall accuracy level is 89.9%, precision is 90.0%, recall is 90.0%, f1 score is 90.0%
LSTM-Based [69]: The author has created a dataset in Bengali. The author has collected data from various hotel customers using a form; they also collected reviews from hotel websites. The reviews that were written in English were translated into Bengali. In total, they created a data set consisting of 1250 data. Half of these data were positive reviews and half negative reviews. Positive reviews were labeled by assigning 0 and negative with 1. They tokenized the words and used the BNLP toolkit to remove Bangla stop words. They extracted features using the following algorithms: CountVectorizer, Glove Vector, Word Sequence, and TF-IDF. The author used the Random Forest, Linear Support Vector Machine, Multinomial Naive Bayes, Decision Tree, and Logistic Regression as classifiers. They used RNN and LSTM for this task as well. The author claims to achieve a higher accuracy of 76.64% using LSTM compared to previous work.
4-grams-Based [52]: The author collected data and created the dataset manually rather than using the existing dataset. The author used count vectorization, TF-IDF, Naive Bayes, Decision tree, logistic regression techniques, N-grams, and Bag of Word to perform feature extraction. Multinomial Naive Bayes was used for district count, and finally Decision tree was used to perform supervised machine learning. The author claims to achieve 88% accuracy by using 4-grams along with Logistic Regression algorithms.
Bi-ERU-Based [55]: The author proposes a new method to perform conversational sentiment analysis by using an Emotional Recurrent Unit(ERU) in a bidirectional manner which is parameter-efficient and party-independent. The author first identifies the problem by predicting sentiment labels or sentiment types by the utterance. The utterances are then converted into vectors and passed through CNN with 3 sizes of filters to extract features. Max-pooling and ReLU are used to process the convoluted values and added into a hundred-dimensional layer that is fully connected. The proposed model is divided into 3 parts, GNTB, TFE, and ERU. GNTB encodes context information and incorporates background information into an utterance. TFE uses the output of GNTB to extract emotional features that can be used to classify sentiments. The input utterances are passed forward and backward using two ERUs. The results from the forward and backward ERUs are combined with the output of TFE to classify the sentiment. The author of this paper claims to have achieved an average accuracy of 65.35%, an F1 score of 64.24% on the IEMOCAP dataset, and 60.7% accuracy on the MELD dataset by using the BiERU-gc model. Another implementation of BiERU by the author is BiERU-lc. It is slightly better than the former model, with an average accuracy of 66.09%, an F1 score of 64.59%, and 60.9% accuracy on the MELD dataset.
Linear-SVC-Based [70]: By incorporating game theory principles, the authors capture the strategic behavior of reviewers and the dynamics between positive and negative sentiments. The application of game theory contributes to more accurate sentiment analysis by considering the strategic choices made by reviewers when expressing their opinions. Another important contribution of this research is the utilization of multi-criteria decision-making (MCDM) techniques in sentiment analysis. MCDM provides a systematic approach to consider multiple criteria and preferences, allowing for a more comprehensive sentiment analysis. In This Study, The authors present a methodological framework consisting of the following key steps: Data Collection: The authors collect a dataset of restaurant reviews from various online platforms. Sentiment Lexicon Creation: The authors construct a sentiment lexicon specific to restaurant reviews. Game Theory Modeling: The authors incorporate game theory principles into the sentiment analysis framework. Multi-Criteria Decision-Making: The authors employ MCDM techniques to aggregate the sentiment scores obtained from the sentiment lexicon and the game theory model. After the proposed Ensemble approach, the overall accuracy level is 89% precision value Comparisons with TripAdvisor and Yelp datasets are 0.895 and 0.97, respectively. Recall measures how many positive cases are actually. The model was able to predict accurately—received recall value of 0.97 for both datasets.
4.3.4 Model Based on Dataset Size
In the following figure, we are exploring the data size for each of the selected models Fig. 22. From the depicted figure, it is evident that LSTM emerges as the predominant model. However, SVM utilizes a substantial amount of data compared to other models. The LSTM model follows with the second largest dataset. Other models, including NER, SVE, CNN, BERT, etc., employ an average dataset size among them.
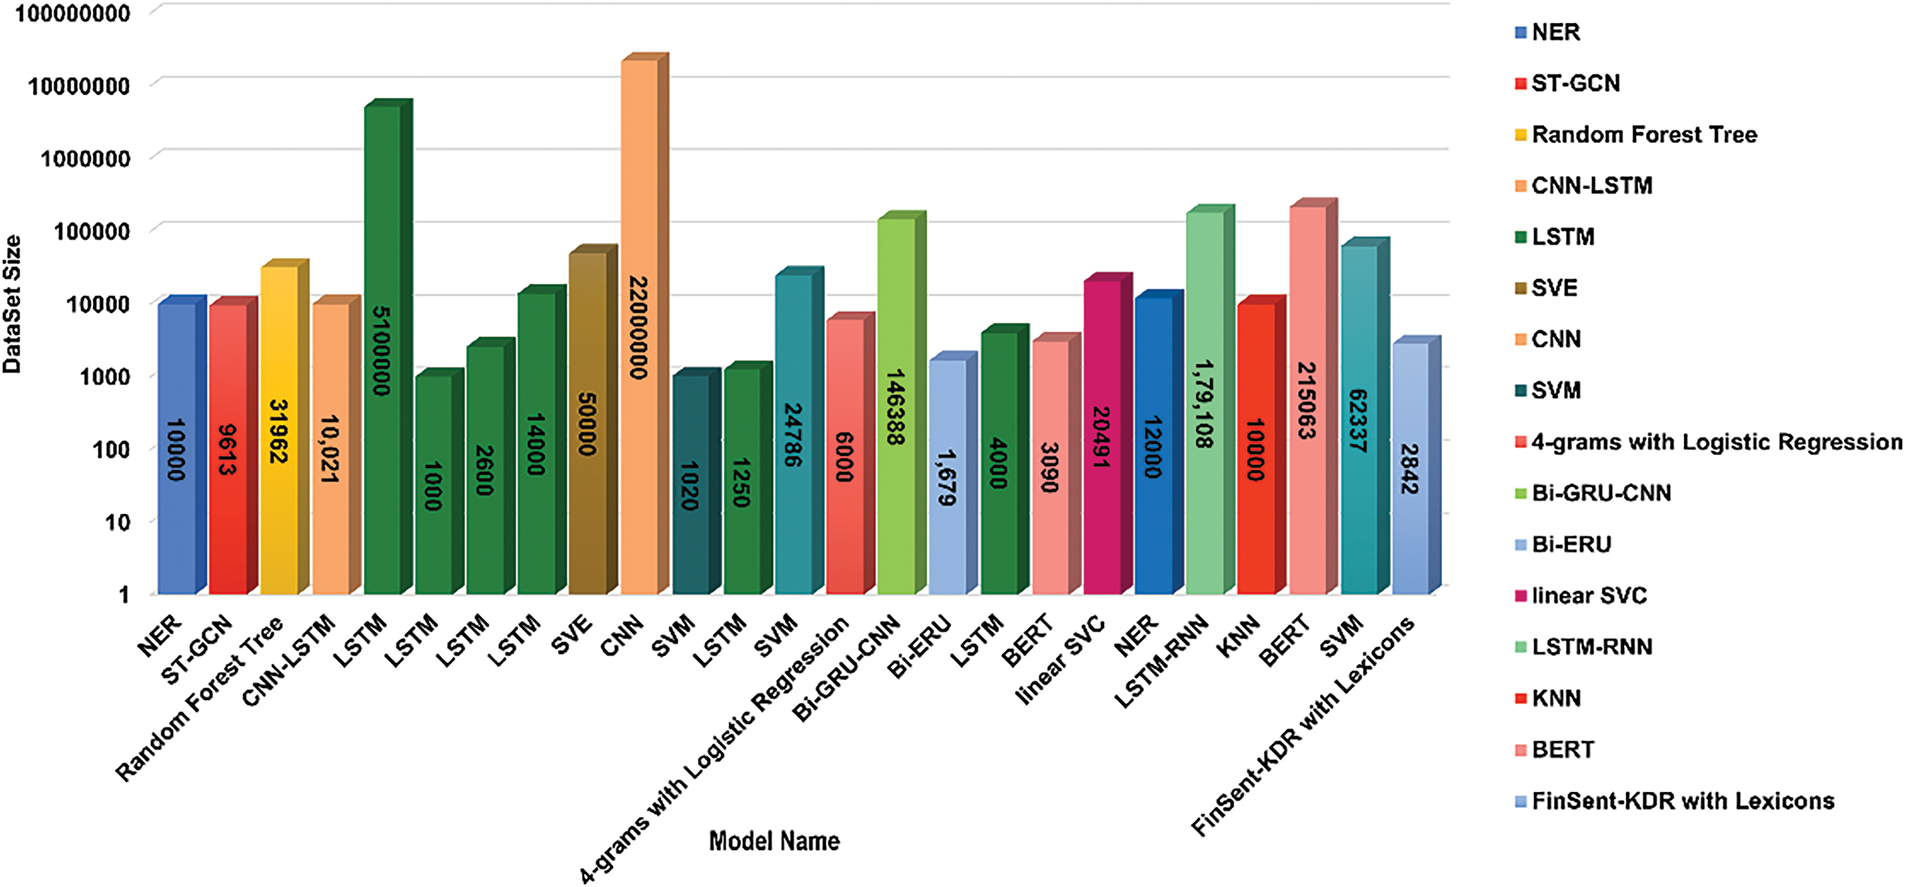
Figure 22: Model based on dataset size
The utilization of NLP in analytical applications has demonstrated exponential growth in recent years. The recent advancements in LLMs are a prime example of this statement. At its core, textual sentiment analysis is a study of written social data to determine the public’s preferences, which enables us to analyze and understand their opinions. Its usage includes measuring customer satisfaction, monitoring brand reputation, analyzing social media sentiment, identifying sentiment in product reviews, and supporting decision-making processes. Many researchers have developed hybrid machine and deep learning models for English, Roman, Portuguese, Bengali, and Arabic languages. Among the numerous models reviewed in this Systematic Literature Review, LSTM, NER, ST-GCN, and SVM models performed best. Among the selected papers, the LSTM model achieved the highest accuracy of 97%.
6 Limitations and Future Scope
The gaps developed in this study aim to indicate the system that will help future researchers analyze sentiment using NLP models and consider the flaws to build a better plan. In the future, more journal articles is planned to be reviewed to get further insight into the field of Sentiment Analysis and NLP. Our current work lacks a detailed discussion about the challenges faced while working with different languages. Although mentioned briefly, a detailed discussion will be more insightful for curious minds. The planned work will also improve the quality of future researchers and our research on machine learning and deep learning, expand thinking, and serve as a great benchmark in the research community.
Acknowledgement: The authors express their gratitude to the Wahid’s Research Lab for their tremendous assistance and motivation.
Funding Statement: This research was supported by the “Technology Commercialization Collaboration Platform Construction” project of the Innopolis Foundation (Project Number: 2710033536) and the Competitive Research Fund of The University of Aizu, Japan.
Author Contributions: Tanvir Ahmed: Conceptualization, Methodology, Result Analysis, Writing; Bakhtiar Mazrur: Paper Collection, Data Optimization, Writing; Md. Mohsin Mia: Visualization, Investigation; Romana Idress Ekfa: Investigation, Data Analysis and Figure Drawing; Md. Sajib Rana: Investigation, Data Analysis and Figure Drawing; Wahidur Rahman: Supervision, and Writing—Reviewing and Editing; Pankoo Kim: Supervision & Editing; Jungpil Shin: Supervision, and Writing—Reviewing. All authors reviewed the results and approved the final version of the manuscript.
Availability of Data and Materials: No data is available to share in this research.
Ethics Approval: Not applicable.
Conflicts of Interest: The authors declare no conflicts of interest to report regarding the present study.
Supplementary Materials: The supplementary material (PRISMA 2020 Checklist) is available online at https://www.techscience.com/doi/10.32604/mcmc.2025.066910/s1.
References
1. Wang S, Manning C. Baselines and bigrams: simple, good sentiment and topic classification. In: Li H, Lin CY, Osborne M, Lee GG, Park JC, editors. Proceedings of the 50th Annual Meeting of the Association for Computational Linguistics (Volume 2: Short Papers). Jeju Island, Republic of Korea: Association for Computational Linguistics; 2012. p. 90–4. [Google Scholar]
2. Maas AL, Daly RE, Pham PT, Huang D, Ng AY, Potts C. Learning word vectors for sentiment analysis. In: Lin D, Matsumoto Y, Mihalcea R, editors. Proceedings of the 49th Annual Meeting of the Association for Computational Linguistics: Human Language Technologies. Portland, OR, USA: Association for Computational Linguistics; 2011. p. 142–50. [Google Scholar]
3. Hochreiter S, Schmidhuber J. Long short-term memory. Neural Computation. 1997;9(8):1735–80. doi:10.1162/neco.1997.9.8.1735. [Google Scholar] [CrossRef]
4. Devlin J, Chang MW, Lee K, Toutanova K. BERT: pre-training of deep bidirectional transformers for language understanding. In: Burstein J, Doran C, Solorio T, editors. Proceedings of the 2019 Conference of the North American Chapter of the Association for Computational Linguistics: Human Language Technologies. Vol. 1. Minneapolis, MN, USA: Association for Computational Linguistics; 2019. p. 4171–86. [Google Scholar]
5. Socher R, Perelygin A, Wu J, Chuang J, Manning CD, Ng A, et al. Recursive deep models for semantic compositionality over a sentiment treebank. In: Yarowsky D, Baldwin T, Korhonen A, Livescu K, Bethard S, editors. Proceedings of the 2013 Conference on Empirical Methods in Natural Language Processing. Seattle, WA, USA: Association for Computational Linguistics; 2013. p. 1631–42. [Google Scholar]
6. Cambria E, White B. Jumping NLP curves: a review of natural language processing research. IEEE Computat Intell Magaz. 2014;9(2):48–57. doi:10.1109/MCI.2014.2307227. [Google Scholar] [CrossRef]
7. Cambria E, Poria S, Gelbukh A, Thelwall M. Sentiment analysis is a big suitcase. IEEE Intell Syst. 2017;32(6):74–80. doi:10.1109/MIS.2017.4531228. [Google Scholar] [CrossRef]
8. Zhang L, Wang S, Liu B. Deep learning for sentiment analysis: a survey. WIREs Data Mini Knowl Disc. 2018;8(4):e1253. doi:10.1002/widm.1253. [Google Scholar] [CrossRef]
9. Stine RA. Sentiment analysis. Ann Rev Statist Applicat. 2019;6(6):287–308. doi:10.1146/annurev-statistics-030718-105242. [Google Scholar] [CrossRef]
10. Pang B, Lee L. Opinion mining and sentiment analysis. Foundat Trends® in Inform Retriev. 2008;2(1–2):1–135. doi:10.1561/1500000011. [Google Scholar] [CrossRef]
11. Feldman R. Techniques and applications for sentiment analysis. Commun ACM. 2013;56(4):82–9. doi:10.1145/2436256.2436274. [Google Scholar] [CrossRef]
12. Rodríguez-Ibánez M, Casánez-Ventura A, Castejón-Mateos F, Cuenca-Jiménez PM. A review on sentiment analysis from social media platforms. Expert Syst Appl. 2023;223:119862. doi:10.1016/j.eswa.2023.119862. [Google Scholar] [CrossRef]
13. Kiritchenko S, Zhu X, Mohammad SM. Sentiment analysis of short informal texts. J Artif Intellig Res. 2014;50:723–62. doi:10.1613/jair.4272. [Google Scholar] [CrossRef]
14. Hutto C, Gilbert E. Vader: A parsimonious rule-based model for sentiment analysis of social media text. In: Proceedings of the International AAAI Conference on Web and Social Media; 2014 Jun 1–4; Ann Arbor, MI, USA. p. 216–25. [Google Scholar]
15. Thelwall M, Buckley K, Paltoglou G, Cai D, Kappas A. Sentiment strength detection in short informal text. J American Soc Inform Sci Technol. 2010;61(12):2544–58. doi:10.1002/asi.21416. [Google Scholar] [CrossRef]
16. Pak A, Paroubek P. Twitter as a corpus for sentiment analysis and opinion mining. In: Proceedings of the Seventh International Conference on Language Resources and Evaluation (LREC’10). Valletta, Malta: European Language Resources Association (ELRA); 2010. p. 1320–6. [Google Scholar]
17. Tripathy A, Agrawal A, Rath SK. Classification of sentiment reviews using n-gram machine learning approach. Expert Syst Applicat. 2016;57(2):117–26. doi:10.1016/j.eswa.2016.03.028. [Google Scholar] [CrossRef]
18. Stieglitz S, Dang-Xuan L. Emotions and information diffusion in social media-sentiment of microblogs and sharing behavior. J Manag Inform Syst. 2013;29(4):217–48. doi:10.2753/MIS0742-1222290408. [Google Scholar] [CrossRef]
19. Bollen J, Mao H, Zeng X. Twitter mood predicts the stock market. J Computat Sci. 2011;2(1):1–8. doi:10.1016/j.jocs.2010.12.007. [Google Scholar] [CrossRef]
20. Olujimi PA, Ade-Ibijola A. NLP techniques for automating responses to customer queries: a systematic review. Disc Artif Intell. 2023;3(1):20. doi:10.1007/s44163-023-00065-5. [Google Scholar] [CrossRef]
21. Horvat M, Gledec G, Leontić F. Hybrid natural language processing model for sentiment analysis during natural crisis. Electronics. 2024;13(10):1991. doi:10.3390/electronics13101991. [Google Scholar] [CrossRef]
22. Yilmaz B. 15 Sentiment Analysis Statistics in 2023; 2023 [Internet]. [cited 2025 Jun 19]. Available from: https://research.aimultiple.com/sentiment-analysis-stats/. [Google Scholar]
23. Go A, Bhayani R, Huang L. Twitter sentiment classification using distant supervision. In: CS224N project report. Stanford; 2009. [Google Scholar]
24. De Cleen T, Baecke P, Goedertier F. The influence of emotions and communication style on customer satisfaction and recommendation in a call center context: an NLP-based analysis. J Bus Res. 2025;189(7):115192. doi:10.1016/j.jbusres.2025.115192. [Google Scholar] [CrossRef]
25. Kumar M, Khan L, Chang HT. Evolving techniques in sentiment analysis: a comprehensive review. PeerJ Comput Sci. 2025;11(3):e2592. doi:10.7717/peerj-cs.2592. [Google Scholar] [CrossRef]
26. Mosqueira-Rey E, Hernández-Pereira E, Alonso-Ríos D, Bobes-Bascarán J, Fernández-Leal Á. Human-in-the-loop machine learning: a state of the art. Artif Intell Rev. 2023;56(4):3005–54. doi:10.1007/s10462-022-10246-w. [Google Scholar] [CrossRef]
27. Assiri A, Gumaei A, Mehmood F, Abbas T, Ullah S. DeBERTa-GRU: sentiment analysis for large language model. Comput Mat Cont. 2024;79(3):4219–36. doi:10.32604/cmc.2024.050781. [Google Scholar] [CrossRef]
28. Siddiqui S, Arifeen M, Hopgood A, Good A, Gegov A, Hossain E, et al. Deep learning models for the diagnosis and screening of COVID-19: a systematic review. SN Comput Sci. 2022;3(5):397. doi:10.1007/s42979-022-01326-3. [Google Scholar] [CrossRef]
29. Kable AK, Pich J, Maslin-Prothero SE. A structured approach to documenting a search strategy for publication: a 12 step guideline for authors. Nurse Educat Today. 2012;32(8):878–86. doi:10.1016/j.nedt.2012.02.022. [Google Scholar] [CrossRef]
30. Zeng X, Zhang Y, Kwong JSW, Zhang C, Li S, Sun F, et al. The methodological quality assessment tools for preclinical and clinical studies, systematic review and meta-analysis, and clinical practice guideline: a systematic review. J Evid-Based Med. 2015;8(1):2–10. doi:10.1111/jebm.12141. [Google Scholar] [CrossRef]
31. NIH N. Study quality assessment tools. National Heart, Lung, and Blood Institute; 2021 [Internet]. [cited 2025 Jun 19]. Available from: https://www.nhlbi.nih.gov/health-topics/study-quality-assessment-tools. [Google Scholar]
32. Kempthorne DP. MIT 18.655-Mathematical Statistics-Lecture Note 7. MIT OpenCourseWare; 2016 [Internet]. [cited 2025 Jun 19]. Available from: https://ocw.mit.edu/courses/18-655-mathematical-statistics-spring-2016/resources/mit18_655s16_lecnote7/. [Google Scholar]
33. Wang B. STAT:4100-Chapter 3-Some Special Distributions. The University of Iowa; 2018 [Internet]. [cited 2025 Jun 19]. Available from: https://myweb.uiowa.edu/boxwang/files/Chapter3.pdf. [Google Scholar]
34. AlBadani B, Shi R, Dong J, Al-Sabri R, Moctard OB. Transformer-based graph convolutional network for sentiment analysis. Appl Sci. 2022;12(3):1316. doi:10.3390/app12031316. [Google Scholar] [CrossRef]
35. Kavitha M, Naib BB, Mallikarjuna B, Kavitha R, Srinivasan R. Sentiment analysis using NLP and machine learning techniques on social media data. In: 2022 2nd International Conference on Advance Computing and Innovative Technologies in Engineering (ICACITE); 2022 Apr 28–29; Greater Noida, India; 2022. p. 112–5. doi:10.1109/ICACITE53722.2022.9823708. [Google Scholar] [CrossRef]
36. Baeza-Yates R, Ribeiro-Neto B. Modern information retrieval. Vol. 463. 1st ed. Boston, MA, USA: Addison Wesley; 1999. [cited 2025 Jun 19]. Available from: https://people.ischool.berkeley.edu/. [Google Scholar]
37. Khan L, Amjad A, Afaq KM, Chang HT. Deep sentiment analysis using CNN-LSTM architecture of english and roman urdu text shared in social media. Appl Sci. 2022;12(5):2694. doi:10.3390/app12052694. [Google Scholar] [CrossRef]
38. Ombabi AH, Ouarda W, Alimi AM. Deep learning CNN-LSTM framework for Arabic sentiment analysis using textual information shared in social networks. Soc Netw Analy Min. 2020;10(1):1–13. doi:10.1007/s13278-020-00668-1. [Google Scholar] [CrossRef]
39. Hossain Junaid MI, Hossain F, Upal US, Tameem A, Kashim A, Fahmin A. Bangla food review sentimental analysis using machine learning. In: 2022 IEEE 12th Annual Computing and Communication Workshop and Conference (CCWC); 2022 Jan 26–29; Las Vegas, NV, USA. p. 347–53. doi:10.1109/CCWC54503.2022.9720761. [Google Scholar] [CrossRef]
40. Iqbal A, Amin R, Iqbal J, Alroobaea R, Binmahfoudh A, Hussain M. Sentiment analysis of consumer reviews using deep learning. Sustainability. 2022;14(17):10844. doi:10.3390/su141710844. [Google Scholar] [CrossRef]
41. Kingma DP, Ba J. Adam: a method for stochastic optimization. arXiv:1412.6980. 2017. [Google Scholar]
42. Wang H, Yang Y, Wang H, Chen D. Soft-voting clustering ensemble. In: Zhou ZH, Roli F, Kittler J, editors. Multiple classifier systems. Berlin/Heidelberg, Germany: Springer Berlin Heidelberg; 2013. p. 307–18. doi:10.1007/978-3-642-38067-9_27. [Google Scholar] [CrossRef]
43. Kumar V, Subba B. A TfidfVectorizer and SVM based sentiment analysis framework for text data corpus. In: 2020 National Conference on Communications (NCC); 2020 Feb 21–23; Kharagpur, India. p. 1–6. doi:10.1109/NCC48643.2020.9056085. [Google Scholar] [CrossRef]
44. Athar A, Ali S, Sheeraz MM, Bhattachariee S, Kim HC. Sentimental analysis of movie reviews using soft voting ensemble-based machine learning. In: 2021 Eighth International Conference on Social Network Analysis, Management and Security (SNAMS); 2021 Dec 6–9; Gandia, Spain. p. 01–5. doi:10.1109/SNAMS53716.2021.9732159. [Google Scholar] [CrossRef]
45. Qaiser S, Ali R. Text mining: use of TF-IDF to examine the relevance of words to documents. Int J Comput Applicat. 2018;181(1):25–9. [Google Scholar]
46. Zhang Y, Wallace B. A sensitivity analysis of (and Practitioners’ Guide to) convolutional neural networks for sentence classification. arXiv:1510.03820. 2016. [Google Scholar]
47. Ong JY, Mun’im Ahmad Zabidi M, Ramli N, Sheikh UU. Sentiment analysis of informal Malay tweets with deep learning. IAES Int J Artif Intell. 2020;9(2):212. doi:10.11591/ijai.v9.i2.pp212-220. [Google Scholar] [CrossRef]
48. Weinberger K. CS4780-machine learning for intelligent systems-lecture 09; 2018 [Internet]. [cited 2025 Jun 19]. Available from: https://www.cs.cornell.edu/courses/cs4780/2018fa/lectures/lecturenote09.html. [Google Scholar]
49. Shafin MA, Hasan MM, Alam MR, Mithu MA, Nur AU, Faruk MO. Product review sentiment analysis by using NLP and machine learning in bangla language. In: 2020 23rd International Conference on Computer and Information Technology (ICCIT); 2020 Dec 19–21; DHAKA, Bangladesh. p. 1–5. doi:10.1109/ICCIT51783.2020.9392733. [Google Scholar] [CrossRef]
50. de Oliveira DN, Merschmann LHDC. Joint evaluation of preprocessing tasks with classifiers for sentiment analysis in Brazilian Portuguese language. Multim Tools Applicat. 2021;80(10):15391–412. doi:10.1007/s11042-020-10323-8. [Google Scholar] [CrossRef]
51. Hearst MA, Dumais ST, Osuna E, Platt J, Scholkopf B. Support vector machines. IEEE Intell Syst Applicat. 1998;13(4):18–28. doi:10.1109/5254.708428. [Google Scholar] [CrossRef]
52. Hossen MS, Chowdhury MNA, Sristy AM, Jahan N. Sentiment analysis using machine learning and NLP for digital education. In: 2022 6th International Conference on Computing Methodologies and Communication (ICCMC); 2022 Mar 29–31; Erode, India. p. 902–8. doi:10.1109/ICCMC53470.2022.9754065. [Google Scholar] [CrossRef]
53. Kim Y. Convolutional neural networks for sentence classification. arXiv.1408.5882. 2014. doi:10.48550/arXiv.1408.5882. [Google Scholar] [CrossRef]
54. Liu X, Wang Y, Wang X, Xu H, Li C, Xin X. Bi-directional gated recurrent unit neural network based nonlinear equalizer for coherent optical communication system. Opt Express. 2021;29(4):5923–33. doi:10.1364/OE.416672. [Google Scholar] [CrossRef]
55. Li W, Shao W, Ji S, Cambria E. BiERU: bidirectional emotional recurrent unit for conversational sentiment analysis. Neurocomputing. 2022;467(5):73–82. doi:10.1016/j.neucom.2021.09.057. [Google Scholar] [CrossRef]
56. Chintalapudi N, Battineni G, Amenta F. Sentimental analysis of COVID-19 tweets using deep learning models. Infect Dis Rep. 2021;13(2):329–39. doi:10.3390/idr13020032. [Google Scholar] [CrossRef]
57. Singh C, Imam T, Wibowo S, Grandhi S. A deep learning approach for sentiment analysis of COVID-19 reviews. Appl Sci. 2022;12(8):3709. doi:10.3390/app12083709. [Google Scholar] [CrossRef]
58. Mehedi Shamrat FMJ, Chakraborty S, Imran MM, Muna JN, Billah MM, Das P, et al. Sentiment analysis on twitter tweets about COVID-19 vaccines using NLP and supervised KNN classification algorithm. Indonesian J Elect Eng Comput Sci. 2021;23(1):463–70. doi:10.11591/ijeecs.v23.i1.pp463-470. [Google Scholar] [CrossRef]
59. Emadi M, Rahgozar M. Twitter sentiment analysis using fuzzy integral classifier fusion. J Informat Sci. 2020;46(2):226–42. doi:10.1177/0165551519828627. [Google Scholar] [CrossRef]
60. Hossain MS, Nayla N, Rassel AA. Product market demand analysis using NLP in Banglish text with sentiment analysis and named entity recognition. In: 2022 56th Annual Conference on Information Sciences and Systems (CISS); 2022 Mar 9–11; Princeton, NJ, USA. p. 166–71. doi:10.1109/CISS53076.2022.9751188. [Google Scholar] [CrossRef]
61. Anny FTZ, Islam O. Sentiment analysis and opinion mining on E-commerce site. arXiv:2211.15536. 2023. [Google Scholar]
62. Balli C, Guzel MS, Bostanci E, Mishra A. Sentimental analysis of twitter users from Turkish content with natural language processing. Comput Intell Neurosci. 2022;2022(1):2455160. doi:10.1155/2022/2455160. [Google Scholar] [CrossRef]
63. Omara E, Mousa M, Ismail N. Character gated recurrent neural networks for Arabic sentiment analysis. Sci Rep. 2022;12(1):9779. doi:10.1038/s41598-022-13153-w. [Google Scholar] [CrossRef]
64. Al Mansoori S, Almansoori A, Alshamsi M, Salloum SA, Shaalan K. Suspicious activity detection of Twitter and Facebook using sentimental analysis. TEM J. 2020;9(4):1313. doi:10.18421/TEM94-01. [Google Scholar] [CrossRef]
65. Kora R, Mohammed A. An enhanced approach for sentiment analysis based on meta-ensemble deep learning. Soc Netw Anal Min. 2023;13(1):38. doi:10.1007/s13278-023-01043-6. [Google Scholar] [CrossRef]
66. Agarwal B. Financial sentiment analysis model utilizing knowledge-base and domain-specific representation. Multim Tools Applicat. 2023;82(6):8899–920. doi:10.1007/s11042-022-12181-y. [Google Scholar] [CrossRef]
67. Suresh P, Gurumoorthy K. Mining of customer review feedback using sentiment analysis for smart phone product. In: Ramu A, Chee Onn C, Sumithra MG, editors. International Conference on Computing, Communication, Electrical and Biomedical Systems. Cham, Switzerland: Springer International Publishing; 2022. p. 247–59. doi:10.1007/978-3-030-86165-0_21. [Google Scholar] [CrossRef]
68. Colón-Ruiz C, Segura-Bedmar I. Comparing deep learning architectures for sentiment analysis on drug reviews. J Biomed Inform. 2020;110:103539. doi:10.1016/j.jbi.2020.103539. [Google Scholar] [CrossRef]
69. Bonny JJ, Haque NJ, Ulla MR, Kanungoe P, Ome ZH, Junaid MIH. Deep learning approach for sentimental analysis of hotel review on Bengali text. In: 2022 Second International Conference on Advances in Electrical, Computing, Communication and Sustainable Technologies (ICAECT); 2022 Apr 21–22; Bhilai, India. p. 1–7. doi:10.1109/ICAECT54875.2022.9808001. [Google Scholar] [CrossRef]
70. Punetha N, Jain G. Game theory and MCDM-based unsupervised sentiment analysis of restaurant reviews. Appl Intellig. 2023;53(17):20152–73. doi:10.1007/s10489-023-04471-1. [Google Scholar] [CrossRef]
Cite This Article
 Copyright © 2025 The Author(s). Published by Tech Science Press.
This work is licensed under a Creative Commons Attribution 4.0 International License , which permits unrestricted use, distribution, and reproduction in any medium, provided the original work is properly cited.
 Downloads
 Citation Tools