
 Submit a Paper
 Propose a Special lssue
 Open Access
ARTICLE

Transformer-Based Fusion of Infrared and Visible Imagery for Smoke Recognition in Commercial Areas
1 School of Technology, Beijing Forestry University, Beijing, 100083, China
2 HES Technology Group Co., Ltd., Beijing, 100071, China
3 Department of Civil, Construction, and Environmental Engineering, North Dakota State University, Fargo, ND 58102, USA
* Corresponding Author: Pengle Cheng. Email:
(This article belongs to the Special Issue: New Trends in Image Processing)
Computers, Materials & Continua 2025, 84(3), 5157-5176. https://doi.org/10.32604/cmc.2025.067367
Received 01 May 2025; Accepted 13 June 2025; Issue published 30 July 2025
 View Full Text
 Download PDF
Abstract
With rapid urbanization, fires pose significant challenges in urban governance. Traditional fire detection methods often struggle to detect smoke in complex urban scenes due to environmental interferences and variations in viewing angles. This study proposes a novel multimodal smoke detection method that fuses infrared and visible imagery using a transformer-based deep learning model. By capturing both thermal and visual cues, our approach significantly enhances the accuracy and robustness of smoke detection in business parks scenes. We first established a dual-view dataset comprising infrared and visible light videos, implemented an innovative image feature fusion strategy, and designed a deep learning model based on the transformer architecture and attention mechanism for smoke classification. Experimental results demonstrate that our method outperforms existing methods, under the condition of multi-view input, it achieves an accuracy rate of 90.88%, precision rate of 98.38%, recall rate of 92.41% and false positive and false negative rates both below 5%, underlining the effectiveness of the proposed multimodal and multi-view fusion approach. The attention mechanism plays a crucial role in improving detection performance, particularly in identifying subtle smoke features.Keywords
In recent years, the acceleration of urbanization has resulted in higher requirements for urban environmental monitoring and management, with urban fires becoming a major challenge in urban governance. Among various monitoring methods, however, image-processing technology has attracted widespread attention due to its intuitive and real-time nature. Particularly in complex scenes such as business parks, smoke detection serves as a crucial means of preventing fires and environmental pollution.
The breakthrough in deep learning technology in computer vision provides new approaches for solving this problem. However, most research focuses on smoke detection with single type of image inputs [1–3], failing to fully utilize multimodal information to capture the characteristics of smoke. Infrared images contain valuable heat radiation and temperature information that, when combined with visible light images in complex scenes, can provide more comprehensive data for improved detection accuracy.
Infrared images offer unique advantages in smoke detection through thermal radiation capture. Early researchers developed various algorithms based on infrared images [4–6], focusing on thermal radiation characteristics through manual feature-based analysis methods. These methods have broadened the information space of pure visible-light images to a certain extent; however, universality issues still exist.
Recent advances in deep learning have enabled more sophisticated approaches, with several studies exploring the fusion of visible and infrared images. Study in [7] put forward the utilization of composite channel data as an image-based fire detection approach applicable to ships. By capitalizing on the characteristics of RGB data within the visible-light range and infrared (IR) data in the infrared region, a convolutional neural network was employed to construct a fire detection model with composite channel input. Study in [8] used an infrared image as the fourth channel of an RGB image to use the target detection algorithm for fire detection. Study in [9] employed Unmanned Aerial Vehicles (UAVs) to gather infrared and visible video data of the combustion of combustible substances in a forest. Following alignment and sampling procedures, the data was applied for the classification of smoke and flame. The author conducted a comparison of the impacts of the pre-fusion and post-fusion strategies for the two types of image data. Study in [10] put forward a method for detecting the danger level and confidence of forest fires by means of infrared and visible-light images. The author utilized visible-light images and infrared images for smoke detection and local temperature determination, respectively. Subsequently, a comprehensive assessment of the danger level was made based on the outcomes of the two. Study in [11] presented a new deep learning framework that transforms UAV-captured RGB images into infrared images for deducing temperature data and applies it in forest fire surveillance. This research adopted an enhanced conditional adversarial generative network, with RGB images and their corresponding IR images serving as inputs and conditions respectively to direct the generator and discriminator. Eventually, it was utilized for forest fire detection and attained favorable outcomes. There are also studies [12,13] that combine image and sensor information for fire and other phenomena detection.
In addition, in view of the mismatch between the viewing angles of infrared and visible images, the introduction of multi-view classification is feasible for the effective detection of smoke, which can deal with the problem of view mismatch in the process of multi-modal image fusion. Multi-view learning aims to learn a common feature space by combining multiple features or data sources. In image processing, multi-view classification has become a major research issue, particularly in medical image analysis [14–16] and 3D shape recognition [17–19]. In these multi-view problems, each view is obtained from a specific angle and is intended to highlight specific features within the view, meaning that the data are generally structured. Cross-view tasks with lower data structuring include plant species recognition [20–22] and action recognition [6,23]. As mentioned in [24], in addition to the aforementioned, some multi-view tasks are more like extensions of single-view tasks because the additional views are not strictly regulated and may only play a role in inference.
Few studies have applied multi-view classification to smoke detection. Notable work includes the Multi-View Generalized Eigenvalue Proximal Support Vector Machine [25] for smoke detection, which uses the Hue, Saturation, Value (HSV) color features and Scale-Invariant Feature Transform (SIFT) features as different views. Another example is the multi-perspective operation inspection system [26] based on UAVs for monitoring flare stacks. These studies demonstrate that multi-view learning can obtain smoke information from multiple angles, improving detection accuracy by addressing occlusion and incomplete information issues.
Currently, there is no large-scale standardized infrared and visible-light smoke dataset for research on multimodal information in smoke detection. Most data processing methods focus on image fusion first, then proceed to various downstream visual tasks, which becomes problematic when the data itself is difficult to fuse visually. Moreover, the lack of training data and stringent requirements for data quality and type present significant challenges in applying multimodal information to smoke detection.
This study proposes a multimodal multi-view smoke detection method mainly aimed at business park scenes. The proposed method uses multi-view images of two modalities—infrared and visible light—and employs deep learning algorithms for smoke detection. Compared with existing research, our method not only combines multimodal and multi-view smoke image information but also better extracts and recognizes smoke features through effective deep learning algorithms. The main contributions of this study include:
• Establishing a dual-view dataset containing infrared and visible-light videos.
• An innovative dual-view multimodal image fusion method that effectively combines the advantages of infrared and visible-light images from different perspectives.
• Designing and implementing a deep-learning-based smoke detection model that significantly improves the accuracy and robustness of detection.
The remainder of this paper is organized as follows: Section 2 provides a detailed description of the Materials and Methods, including the dataset, details and overall situation of the method. Section 3 presents the Experimental Results and Analysis, where the experimental results are shown and analyzed to assess the performance of the proposed method. Finally, Section 4 offers a Discussion, where the experimental findings are discussed, the strengths and limitations are analyzed, and potential improvements are proposed.
Currently, the publicly available fire and smoke datasets mainly focus on forest fires and wildfires, and there are not many that involve urban scenarios. The fire and smoke datasets for urban scenarios can be mainly divided into two categories: one category comes from the Internet [27]. This type of data has a relatively large scale, but the scenarios are complex, the content is diverse, and the quality varies. Many problems are likely to occur when using this data. The other category is collected through experiments by research teams [28]. This type of data has detailed records, but the scenarios and scale are limited by the research objectives of the teams, making it difficult to meet the needs of this study. In addition, publicly available fire and smoke datasets that contain multi-view and infrared-visible light images are relatively scarce. Therefore, this paper constructs a multi-view infrared-visible light smoke image dataset based on the real scenarios of business parks and urban roads, providing a foundation for subsequent research.
2.1 Data Collection and Processing
2.1.1 Data Collection Experiment
In order to obtain multi-view and infrared-visible light smoke image data in urban scenarios, with the support of HES Technology Group Co., Ltd., we carried out smoke simulation experiments and data collection work at the Longxiang International Business Center in Changchun City, Jilin Province. The experiments were conducted on 26 March 2024 from 10 a.m. to 12 p.m., with temperatures ranging from 2°C to 13°C and winds of 2–3 northeasterly. The ambient temperature was about 13°C at the beginning of the experiment, and the surface temperature increased as the experiment progressed. The purpose of this experiment is to obtain high-quality multi-view video data by simulating the smoke generated by a fire, providing reliable data support for subsequent research.
During the experimental preparation stage, to ensure the safety of the experimental site as well as the accuracy and representativeness of the data, we selected the two sides of the main road on the west side of the park as the experimental location and set up five positions, as shown in Fig. 1. Since the park was in a state where construction and trial operation were carried out simultaneously during the experiment, choosing the positions on both sides of the main road can not only ensure the safety of the experiment but also restore the smoke diffusion situation in the real urban scenario to the greatest extent.
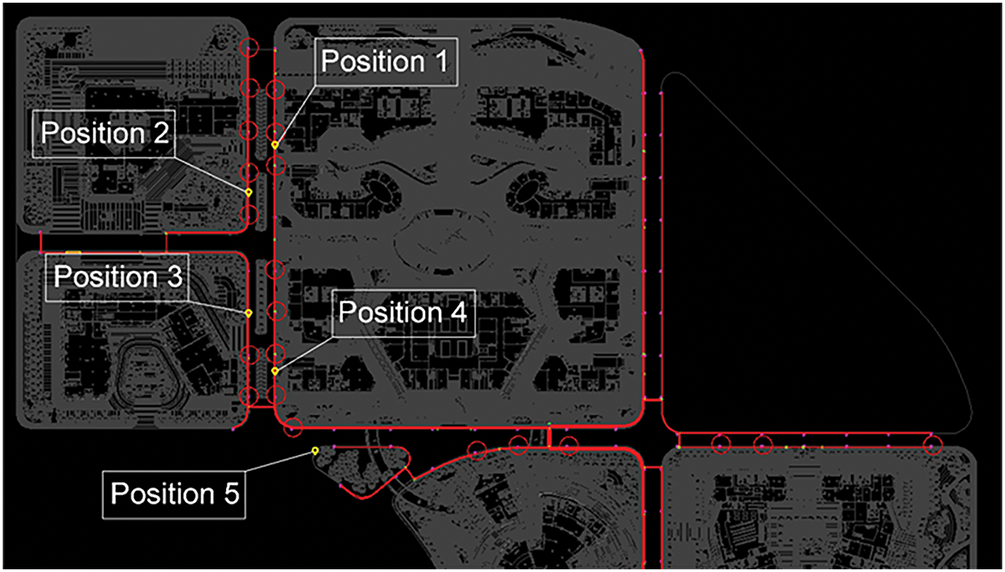
Figure 1: Schematic diagram of data collection points
During the experiment, we used smoke cakes as the smoke source to simulate the fire smoke, and recorded the complete process of the smoke from generation to dissipation through surveillance cameras and infrared thermal imagers. The surveillance camera has a resolution of 2560 × 1440 and a frame rate of 25 frames per second. It is installed on the lampposts 5–10 m away from the smoke source, with a fixed height and an adjustable direction. The infrared thermal imager used is the handheld infrared thermal imager Tianxuan M600F produced by Yantai InfiRay Photoelectric Technology Co., Ltd., with a resolution of 640 × 512 and a frame rate of 25 frames per second. It is manually fixed on a tripod 2–4 m away from the smoke source at a height of about 1.6 m. Although not all the cameras beside some roads were available, by reasonably adjusting the positions of the equipment, we successfully recorded the smoke diffusion process at different distances and viewing angles. The shooting duration at each position was 2–5 min, fully covering the entire process of the smoke from generation to dissipation. Finally, we obtained 7 pairs of video data from different viewing angles.
In addition, we also carried out smoke simulation experiments and data collection work beside some roads in Hualong District, Puyang City, Henan Province. The experiment was carried out from 9:40 to 10:30 p.m. on 05 January 2025, and from 4:20 to 5:00 p.m. on 06 January. The temperature throughout the day on the 5th was −2°C to 13°C, with a wind force of approximately level 3; the temperature throughout the day on the 6th was −2°C to 7°C, with a wind force of approximately level 4. The experimental sites were located on the non-motor vehicle lanes on both sides of the roads, and a total of 6 positions were set up. We also used smoke cakes as experimental props, and recorded the smoke diffusion process through a vivo X90 mobile phone and an infrared thermal imager of the same model. The video recorded by the mobile phone has a resolution of 1920 × 1080 and a frame rate of 30 frames per second. The parameters of the infrared thermal imager are the same as those in the experiment conducted in Changchun. The mobile phone and the infrared thermal imager were installed on a tripod 2–4 m away from the smoke source at a height of about 1.6 m, with a viewing angle difference of approximately 20°. The shooting duration at each position was 2–4 min, and finally, we obtained 11 pairs of video data, including 2 pairs of night videos and 9 pairs of daytime videos.
2.1.2 Data Processing and Augmentation
After completing the collection of video data, in order to convert it into image data suitable for model input, we carried out a systematic preprocessing of the collected visible light and infrared videos. First, regarding the synchronization issue of the two types of video data in the temporal dimension, we adopted a temporal alignment technique to ensure that the content at the same moment in the two videos corresponds to the events that occur at the same moment in reality. Then, we divided the video data into two parts: the part with smoke and the part without smoke. The purpose of this division is to generate comparative data that includes both smoke and non-smoke scenarios, thereby providing more comprehensive sample support for model training. Specifically, the part with smoke covers the complete process of smoke from generation to dissipation, while the part without smoke records the background environment before the appearance of smoke, which is used to provide interference-free reference data.
After completing the temporal alignment and data segmentation, we extracted frames from the two types of videos at intervals of 1 s. This method of frame extraction can reduce the amount of data while ensuring the temporal resolution of the data, thus improving the efficiency of subsequent processing. Through this processing step, we finally obtained 1855 pairs of original image pair data, and each pair of image pairs is composed of a visible light image and an infrared image captured at the same moment. Examples of these image pairs are shown in Fig. 2. Through the above processing of the video data, we successfully converted the original videos into an image dataset suitable for model input. This processing method not only ensures the temporal consistency of the data but also generates high-quality comparative samples through frame extraction and segmentation operations, providing reliable data support for subsequent smoke detection and recognition tasks. In addition, the generation method of the image pairs can effectively support the joint analysis of multimodal data, providing abundant experimental data support for model training and validation.
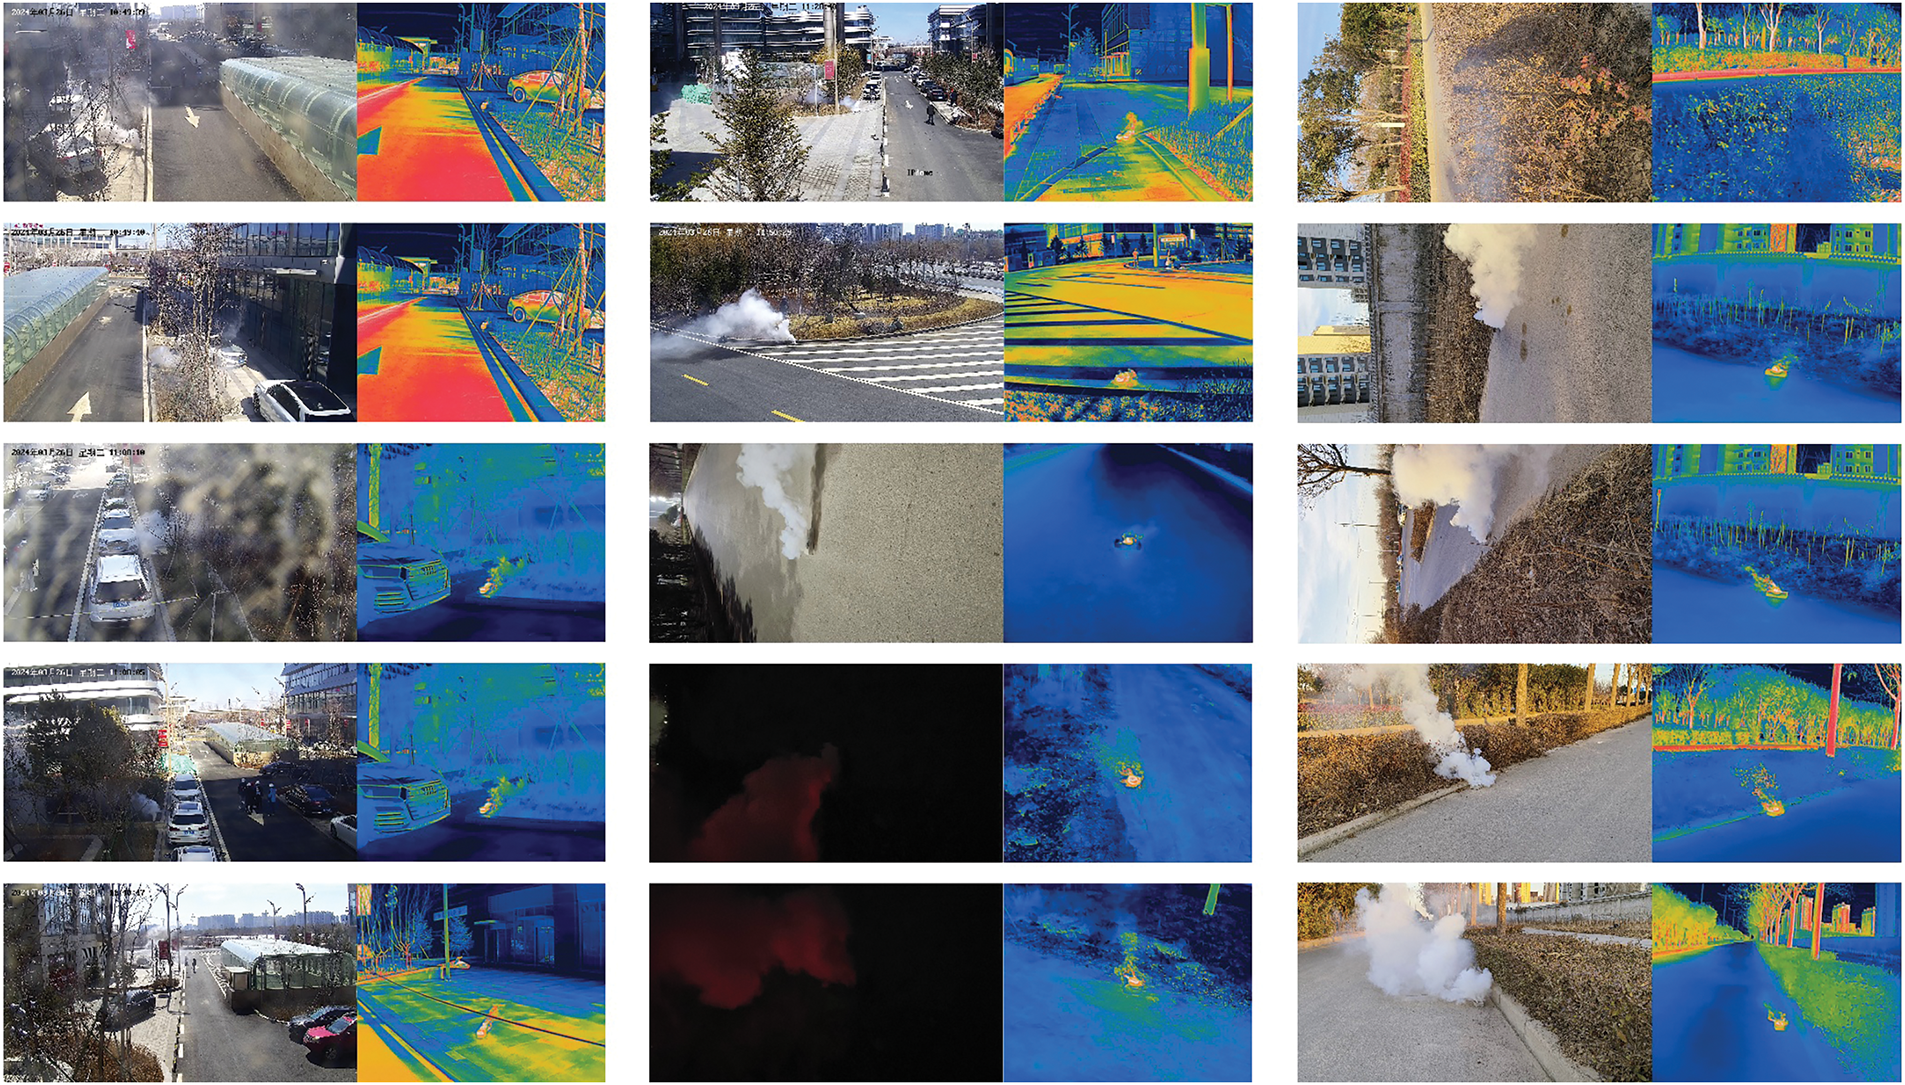
Figure 2: Schematic diagram of the image pair obtained after processing
In order to explore the changing trend of infrared images during the occurrence of smoke, we conducted a grayscale value analysis on the collected infrared image frames to observe their variation patterns over time. The analysis results are shown in Fig. 3, where Fig. 3a shows the changing trend of the grayscale values of the data from Changchun region, and Fig. 3b shows the changing trend of the grayscale values of the data from Puyang region. The horizontal axis represents the serial numbers of the images increasing with time, and the vertical axis represents the average grayscale values of the images.
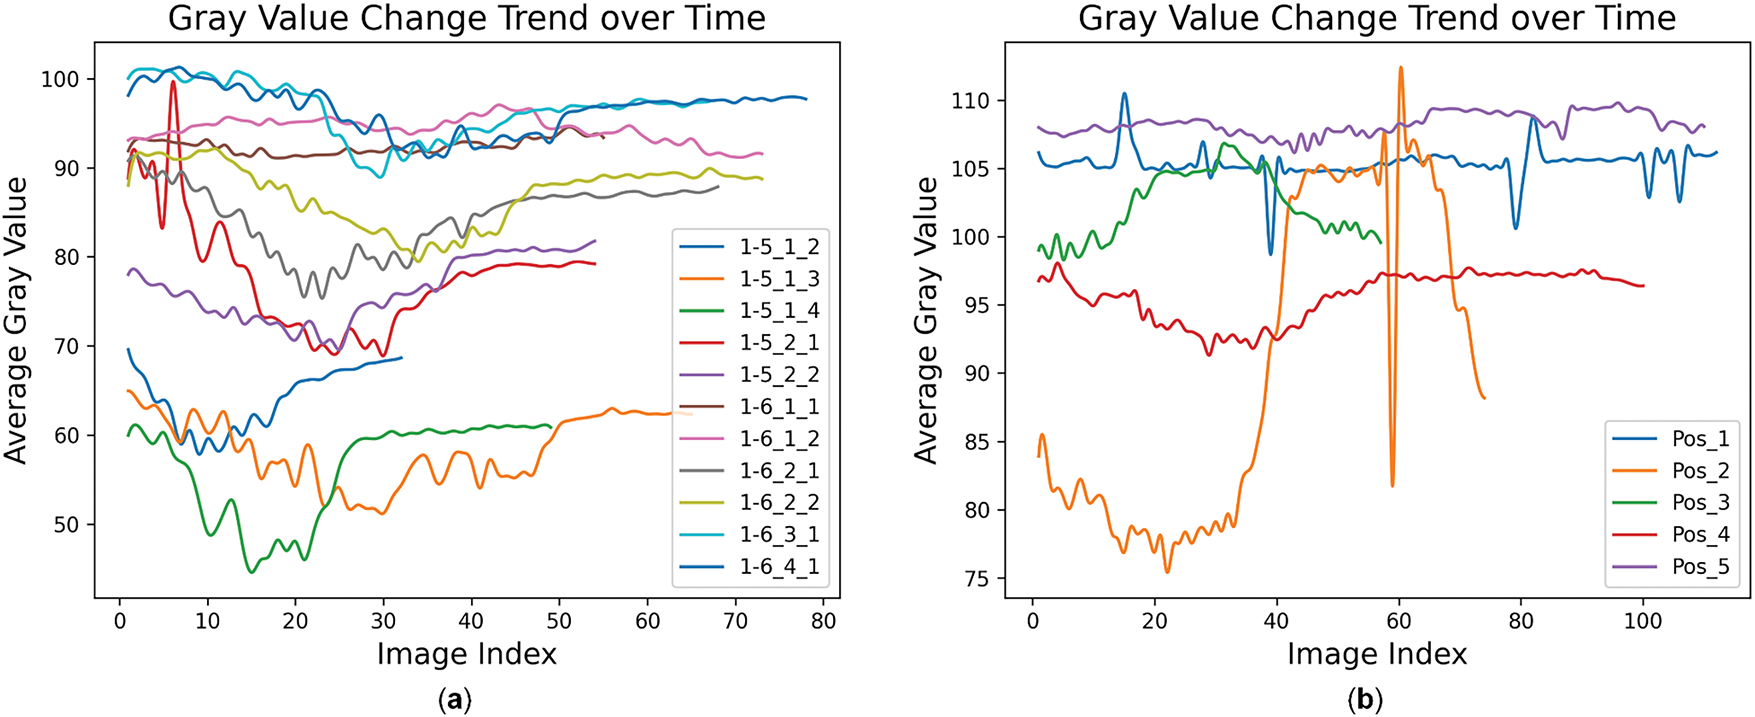
Figure 3: The change trends of the gray values of infrared images in different scenes at two locations over time. (a) The change trend of data gray values in the Changchun region; (b) The change trend of data gray values in the Puyang region
As can be seen from Fig. 3a, the average grayscale values of the image data at the positions “Pos_2”, “Pos_3”, and “Pos_4” show an obvious changing trend. This changing trend is closely related to the process of smoke from generation to dissipation, indicating that the infrared images at these positions can effectively capture the changes in the intensity of thermal radiation caused by smoke. However, the changes in the grayscale values at the positions “Pos_1” and “Pos_5” are not obvious. Analyzing in combination with Fig. 2, this phenomenon may be due to the existence of areas with high radiation intensity on the ground during shooting. These high-radiation areas may originate from the thermal properties of the ground materials or the background environment, resulting in the weakening of the radiation changes brought about by the smoke, so that the overall grayscale value of the image does not change much. In Fig. 3b, except for the positions “1-6_1_1” and “1-6_1_2”, the image data of the remaining positions all show obvious changing trends. This indicates that the infrared images at these positions can truly record the changes in the intensity of thermal radiation caused by the smoke during the process from ignition to dissipation. For the two positions (“1-6_1_1” and “1-6_1_2”) where the changing trend is not obvious, by analyzing in combination with Fig. 2, it is found that in the experimental settings of these two positions, the smoke source is located behind the bushes beside the road. Due to the obstruction of the bushes, the changes in the thermal radiation of the smoke are not obvious in the images, resulting in small changes in the grayscale values.
In addition, regarding the differences in the overall absolute values of the grayscale values, these are caused by the different shooting angles, environmental conditions, and background thermal radiation intensities at each position. These differences have no substantial impact on the trend analysis because the changing trend of the grayscale values, rather than the absolute values, can better reflect the changes in thermal radiation during the smoke diffusion process. By comparing the changing trends of the grayscale values at different positions, it can be found that when the environment around the smoke source is relatively open and there is no obvious obstruction, the infrared image can more clearly record the changes in thermal radiation caused by the smoke; while when the smoke source is blocked or there are high-radiation areas in the background, the changing trend of the grayscale values will be affected to a certain extent.
In order to improve the generalization ability and robustness of the model, this paper conducts data augmentation processing on the collected 1855 pairs of original image pairs to expand the scale of the dataset and enhance data diversity. Different data augmentation strategies are adopted respectively according to the different characteristics of visible light images and infrared images. For visible light images, the following augmentation operations are carried out: (1) Mirroring: By horizontally or vertically flipping the images, new samples are generated to simulate the scenes from different viewing angles. (2) Brightness adjustment: By randomly adjusting the brightness of the images, different lighting conditions are simulated. (3) Noise injection: By adding salt-and-pepper noise, the robustness of the model to noise is enhanced. For infrared images, the following augmentation operations are carried out: (1) Mirroring: Similar to visible light images, new samples are generated by horizontally or vertically flipping the images. (2) Digital detail enhancement: By enhancing the detail information of the images, the characteristics of thermal radiation are highlighted to simulate the changes in thermal radiation under different environments. (3) Noise injection: By adding salt-and-pepper noise, the robustness of the model to noise is enhanced. Through the above data augmentation operations, a total of 12,271 pairs of image pairs are finally generated, including 7887 pairs of image pairs with smoke and 4384 pairs of image pairs without smoke. An example diagram of the data augmentation effect is shown in Fig. 4. The specific distribution of the dataset is shown in Table 1.
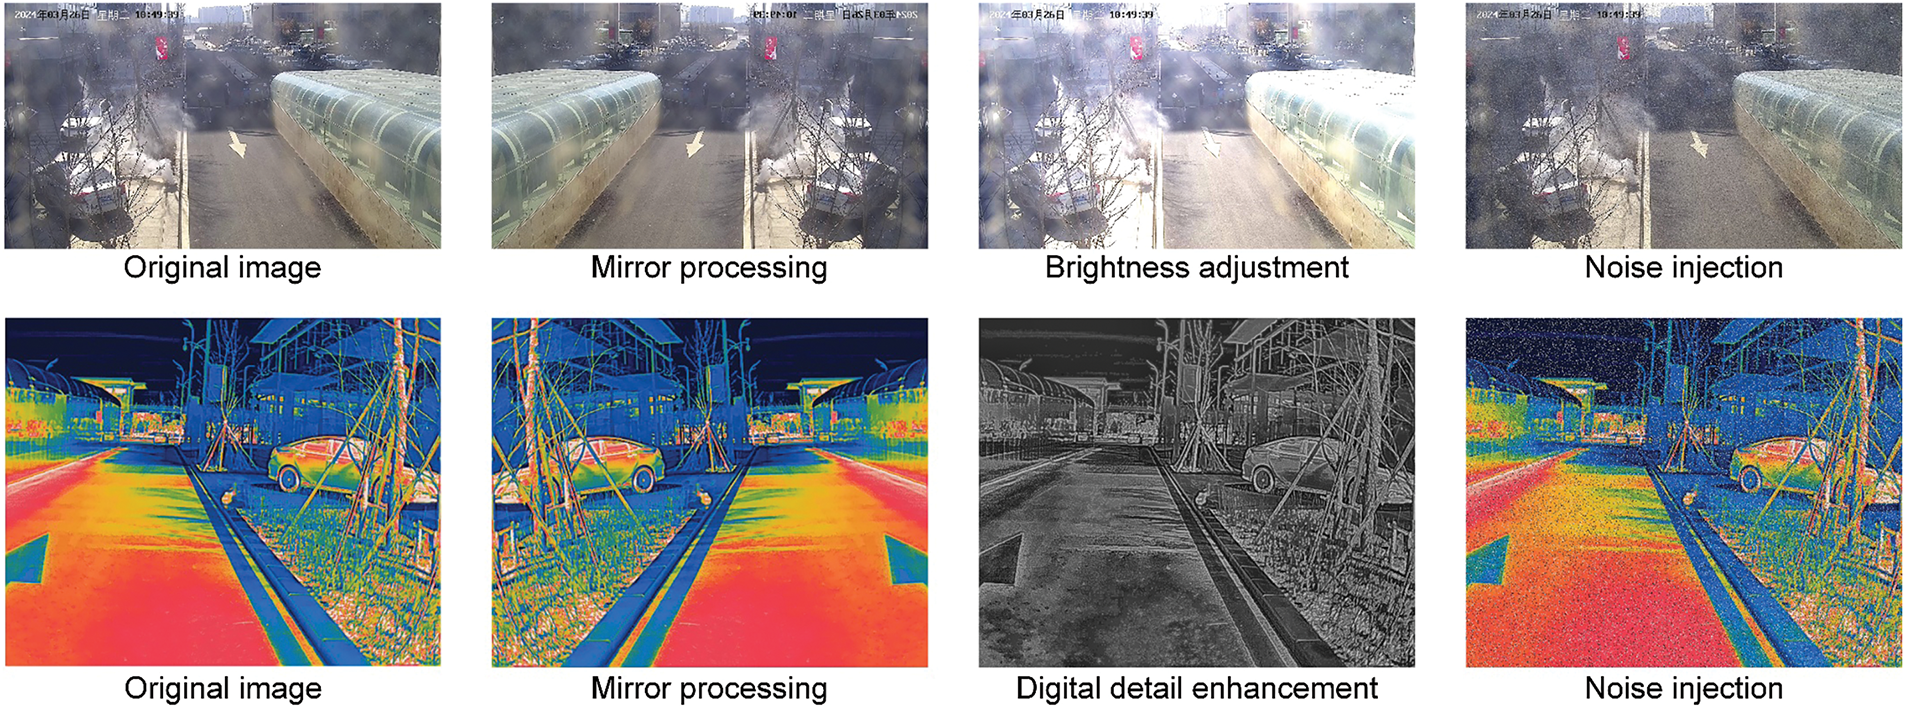
Figure 4: Schematic diagram of the effect of data augmentation
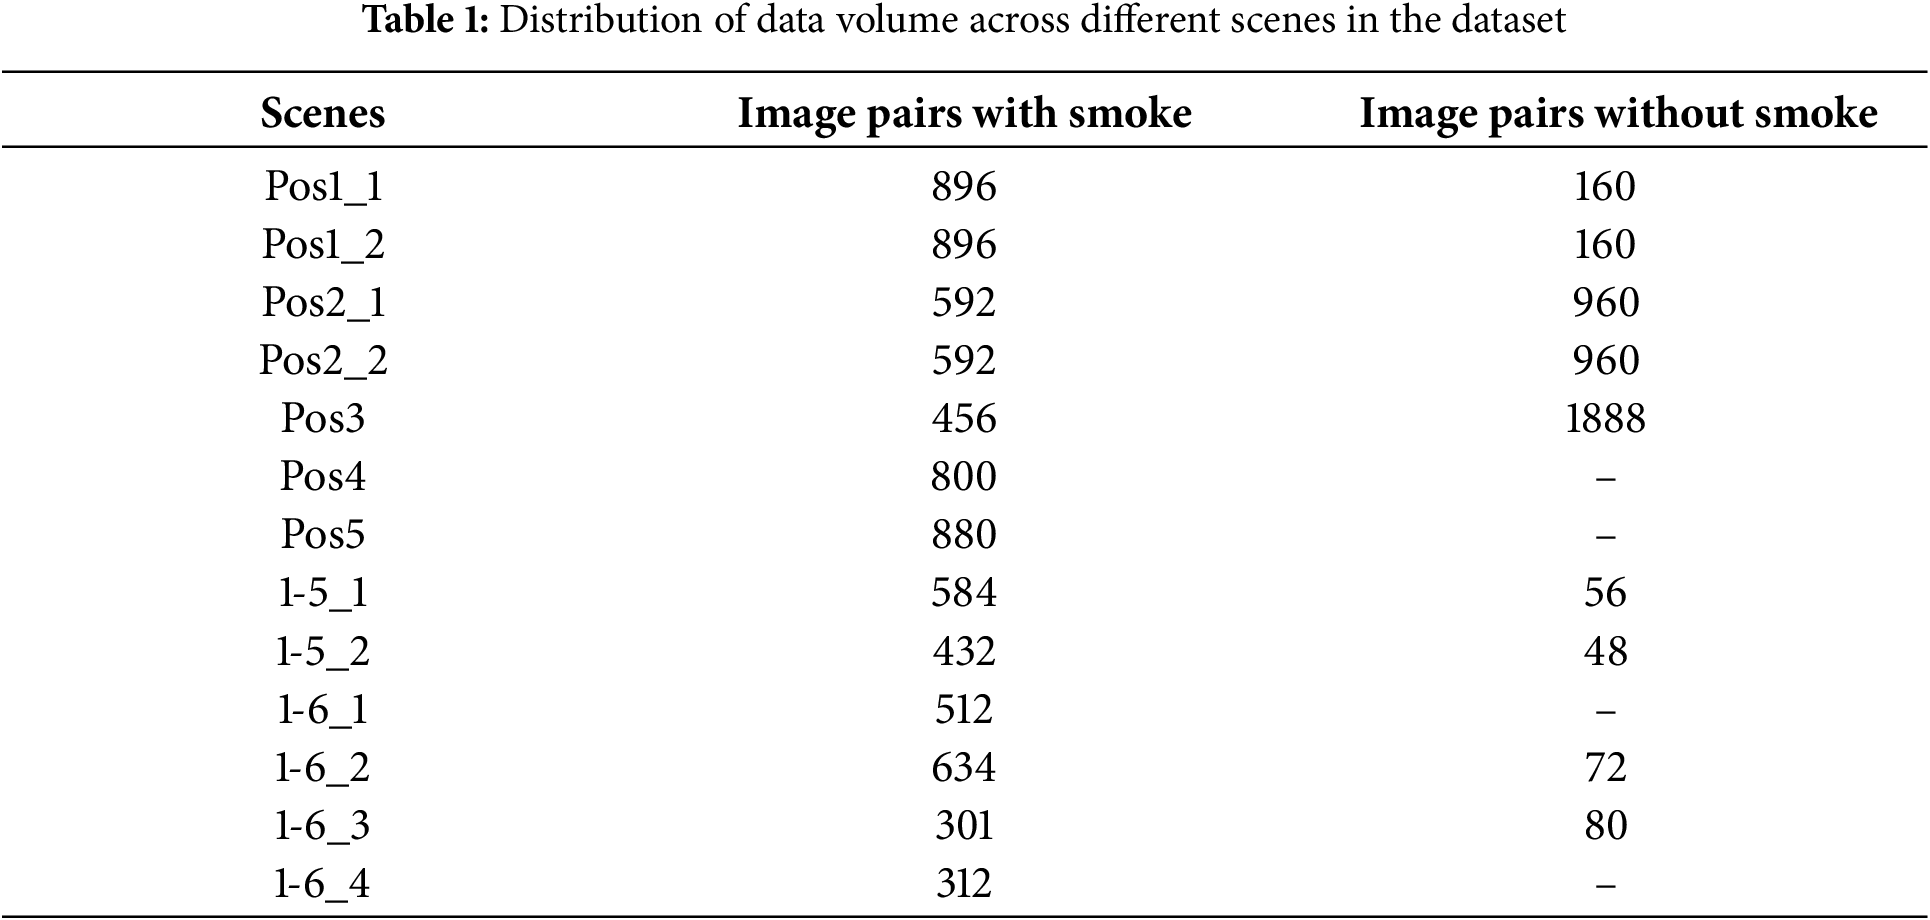
As can be seen from Table 1, due to the fact that insufficient redundant data was retained during the data collection of some scenes, there are missing data categories, and there is an imbalance in the scale of data of different categories within the same scene. Taking these issues into account, when selecting the test set, scene data that is different from the scenes of the training and validation sets and has complete data categories should be chosen. Therefore, according to the quantity of data and the scene characteristics, the data of the two scenes, “Pos1_1” and “1-6_3”, are selected as the test set, and the data of the remaining scenes are used as the training and validation sets. The training set and the validation set are divided at a ratio of 8:2. In summary, the training set accounts for approximately 70% of the total data volume, the validation set accounts for 18%, and the test set accounts for 12%.
In the tasks of multi-view and infrared-visible light fusion, feature fusion, as a part of the data processing procedure, plays a crucial role. It determines whether the information from multiple types of data can be effectively utilized. However, this is different from the pure image fusion problem. Due to the differences in image views, directly fusing the images is of no practical significance. Therefore, the feature-level fusion method is usually adopted to integrate the feature information of each view. The current mainstream image fusion strategies are shown in Fig. 5.
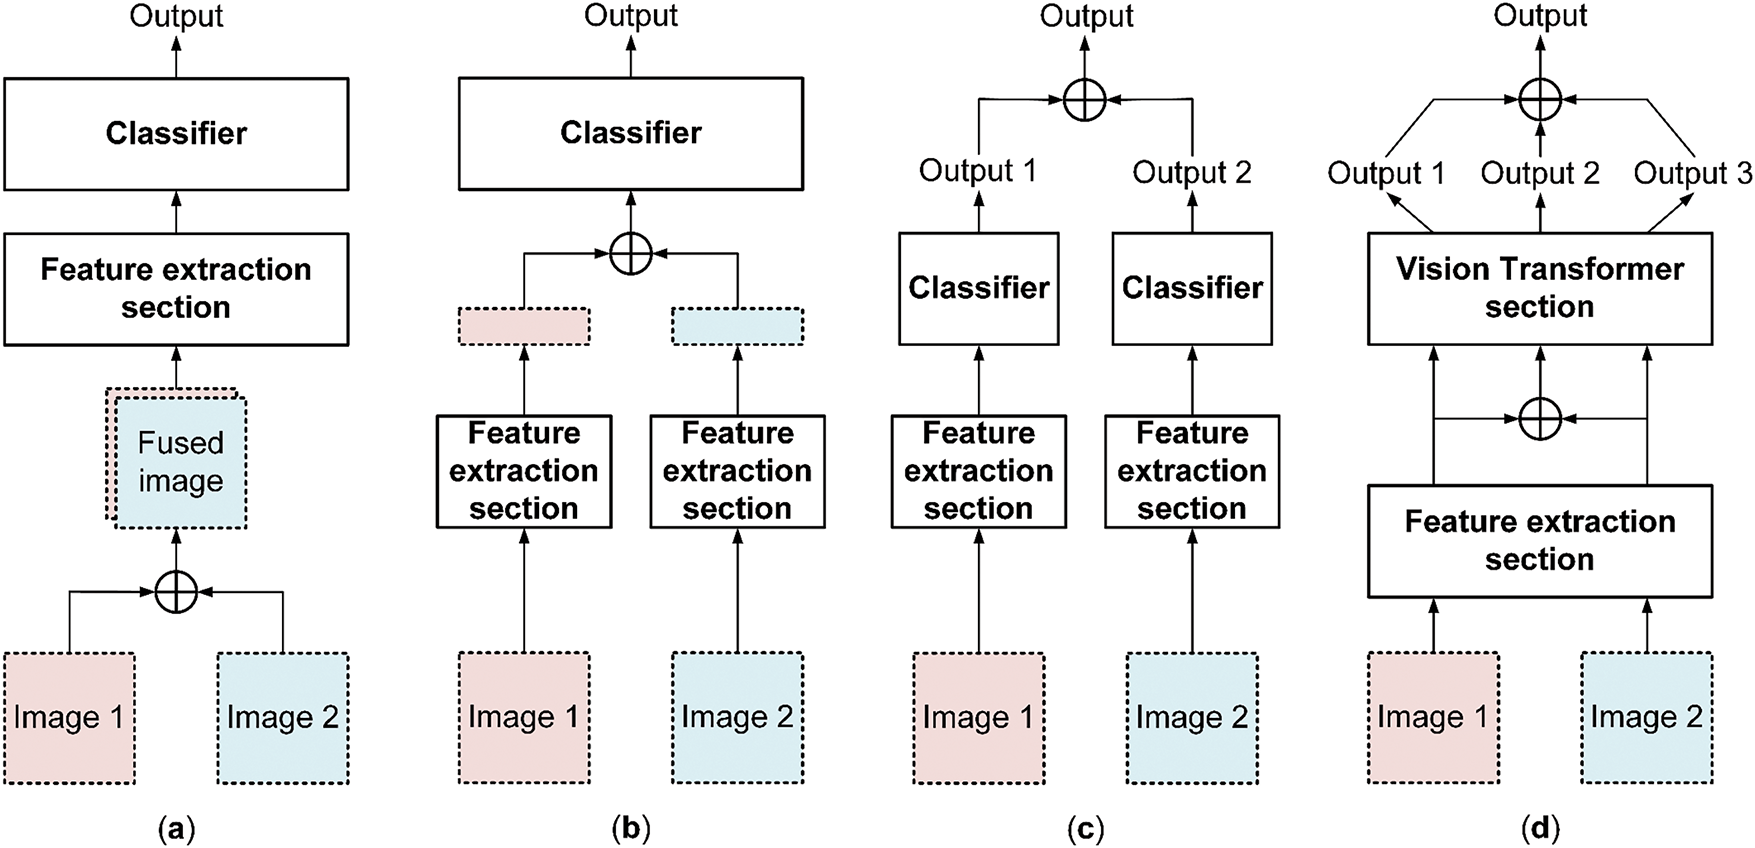
Figure 5: Several common image fusion strategies. (a) Early fusion strategy; (b) Late fusion strategy; (c) Fusion strategy based on evaluation indicators; (d) The adopted fusion strategy
The current common image fusion strategies include the following: (1) Early fusion stategy, as shown in Fig. 5a, that is, the aggregation of low-level features from each view before processing by a deep network [29,30], which is usually used in multimodal settings. However, a disadvantage is that features unrelated to the task may be included in the process early on. (2) Late fusion strategy, as shown in Fig. 5b, that is, learning features independently for each input and then combining the features, which is currently a more effective strategy and is reflected in methods proposed in various fields. In earlier methods, simple connections of single-view features or pooling operations were used [31,32]. Later studies added other operations between the fusion and classification stages, such as two-stage pooling strategies [19], bilinear pooling [33], graph convolution [18], recurrent neural networks [34], Transformers [35], or special modules for specific tasks [17,36,37]. (3) Fusion strategy based on evaluation indicators, as shown in Fig. 5c, regards each input as a separate learning process, and fuses the prediction results. The advantage of this strategy is that each input is independent and can fully learn its features. If there are many input views, the model parameter volume is too large, and the training process is cumbersome. Therefore, inspired by [24], we adopted a combination of late and indicator fusion, as shown in Fig. 5d, which first sends each view of the input into the pre-model for feature extraction separately. In the second stage, it sends the features extracted from each view and the fused features to the subsequent model separately. Finally, the output results of these parts were synthesized to obtain the final result.
For the loss during the training process, three loss terms are used to form the final loss function. In addition to the cross-entropy loss commonly used in classification problems, we also used the mutual distillation loss mentioned in [24,38,39] and other studies to perform mutual distillation learning between single image detection and multi-view fusion detection. The equation used was as Eq. (1):
In Eq. (1), the first term represents the loss of the single infrared image view prediction, the second term represents the loss of the single visible light image view prediction, and the third term represents the loss of the prediction using the two fused views above, all of which are calculated using the cross-entropy loss function. The last term represents the mutual distillation loss between the single and dual views, where
where
where
where
Inspired by [24], we propose a multi-view feature fusion model combined with an attention module for smoke recognition and classification, shown in Fig. 6. This model is based on the hybrid ViT architecture and mainly consists of three parts: the feature extraction stage, the feature fusion processing stage, and the output stage. The input data of the model is a pair of infrared and visible light images from different views. In the feature extraction stage, the input data is first weighted in different dimensions through the attention module, and then the image patch embedding operation is carried out to convert it into a tensor suitable for input into the ViT. Different from the original Transformer, the feature extraction operation of the convolutional layer is added to the image patch embedding part. Taking the Tiny version used in this paper as an example, the input data first undergoes operations such as convolution, group normalization, activation function, and max pooling to extract the image into a feature vector. Then, operations such as image patch embedding and adding position encoding are carried out. In the feature fusion processing stage, the embedding vectors obtained in the previous step are input into the subsequent Transformer model in the forms of a single image and the fusion of two vectors, respectively, and global feature modeling is carried out, respectively. Finally, in the output stage, the model will output a prediction result for each input vector. By synthesizing the two results obtained from the single image vector, the prediction result under a single view and the prediction result under multiple views can be obtained.
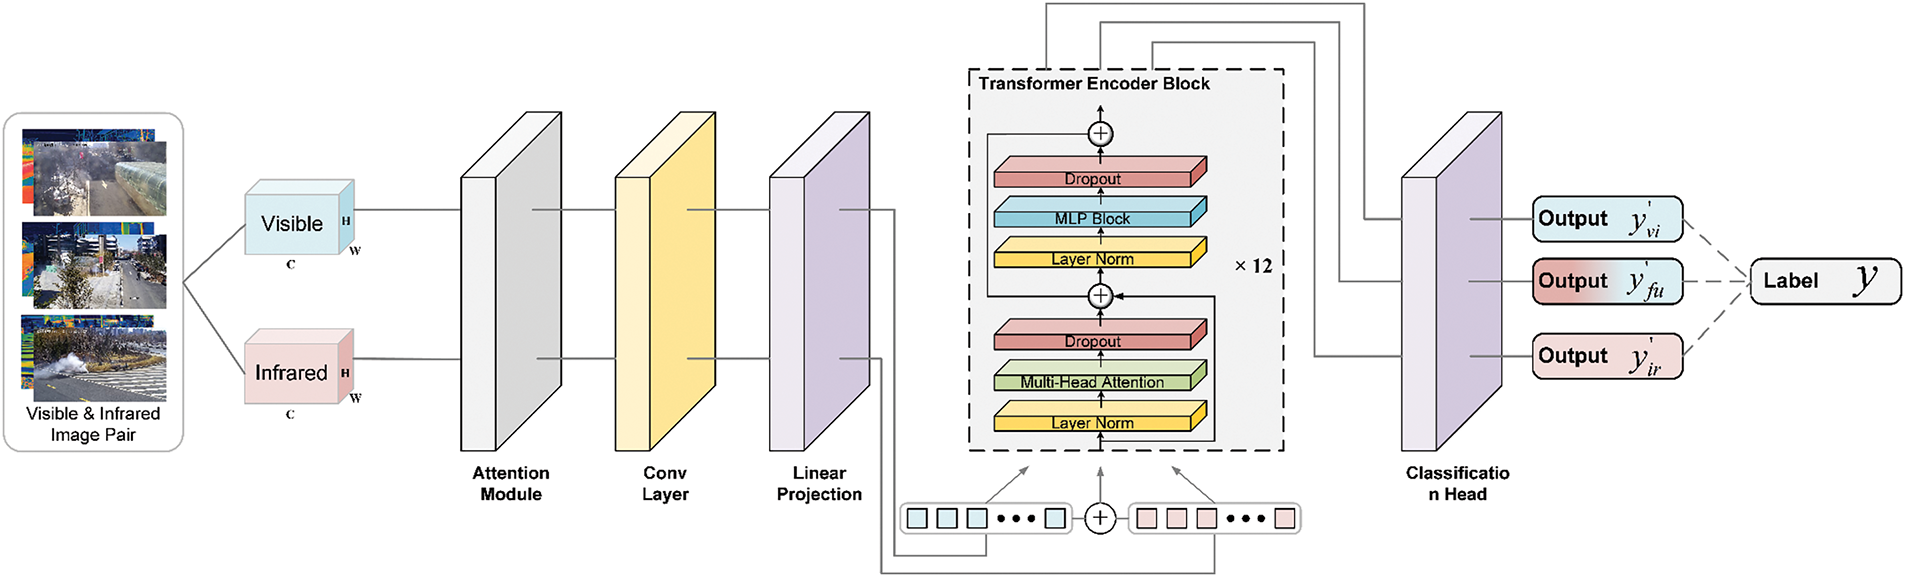
Figure 6: The overall structure and flowchart of the proposed model
In classification tasks, evaluation metrics are crucial for effectively assessing model performance. This experiment will use commonly used evaluation metrics in classification tasks, including accuracy (Acc), precision (Pre), recall (Rec), and F1-score. Additionally, false positive rate (FPR) and false negative rate (FNR) will be calculated. All the above metrics are based on the calculation of confusion matrices, which contain four basic elements: (1) True Positive (TP): The number of samples that are actually positive and correctly predicted as positive; (2) False Positive (FP): The number of samples that are actually negative but incorrectly predicted as positive; (3) True Negative (TN): The number of samples that are actually negative and correctly predicted as negative; (4) False Negative (FN): The number of samples that are actually positive but incorrectly predicted as negative. These four basic elements will serve as important bases for calculating the evaluation metrics.
Accuracy is the most intuitive evaluation index, which represents the proportion of correctly classified samples to the total number of samples. Its definition is shown in Eq. (5):
Accuracy provides an assessment of the overall performance of a model, but its limitation is that it may produce misleading results in imbalanced datasets. Therefore, it is necessary to comprehensively evaluate the model with other evaluation metrics.
Precision measures the proportion of samples predicted as positive by the model that are actually positive. In practical applications, high precision helps reduce false positives and avoid resource waste caused by false alarms. The definition of precision is shown in Eq. (6):
Precision focuses on the accuracy of the model’s positive class predictions and can effectively evaluate the reliability of the model in predicting positive classes.
Recall measures the proportion of actual positive samples that the model can correctly identify. In practical applications, high recall helps improve the ability to detect missed reports and ensures that early fire smoke can be captured. The definition of recall is shown in Eq. (7):
Recall focuses on the model’s ability to capture positive class samples and can effectively evaluate the completeness of the model’s discovery of positive class samples.
The F1 score is defined as the harmonic mean of precision and recall, as shown in Eq. (8):
The false positive rate and false negative rate reflect the ability to correctly predict the purity of positive and negative samples, respectively. Specifically, the false positive rate represents the proportion of negative samples predicted as positive among all negative samples, while the false negative rate represents the proportion of positive samples predicted as negative among all positive samples. As shown in Eqs. (9) and (10):
3 Experiments Results and Analysis
3.1 Parameter Settings and Evaluation Metrics
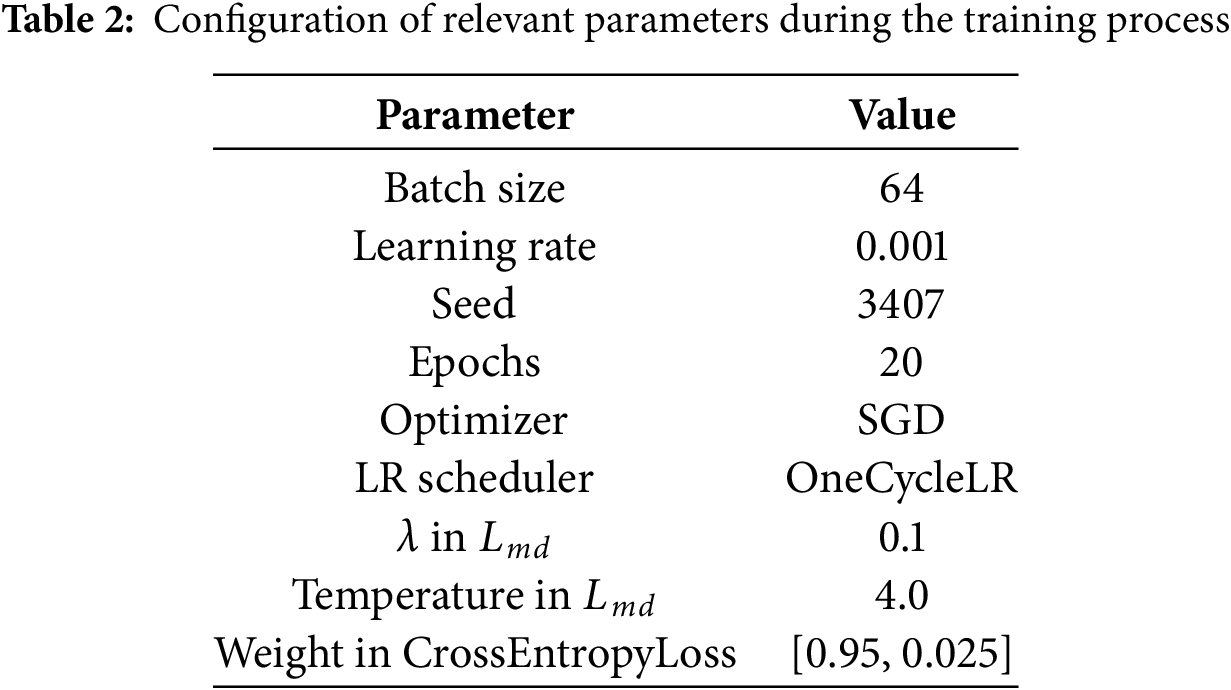
This experiment was conducted on a Linux server equipped with an Intel Xeon Silver 4210 CPU and an NVIDIA RTX A4000 GPU. The backbone part of the proposed model adopts the Tiny model in the hybrid ViT, and uses the pre-trained parameters from Imagenet. The training and evaluation are carried out based on the PyTorch framework. During the training process of each model, the model parameters with the best performance on the validation set are saved and used as the basis for testing on the final test set. The relevant hyperparameter settings are shown in Table 2. The parameter settings of other comparative models that appeared in the experiment adopt the default settings of the models.
In terms of evaluation metrics, this experiment uses the commonly used accuracy, precision, recall, and F1 score in classification tasks as evaluation metrics. At the same time, the number of parameters and the computational load of different models will also be compared.
This experiment compares the classification performance of several popular infrared-visible light fusion models in recent years on the established dataset. Among the models used for comparison, DenseFuse [42], NestFuse [43], RFN-Nest [44], CDDFuse [45], and EMMA [46] represent the typical development trends of image fusion models in recent years, ranging from simple encoder-decoder structures to end-to-end self-supervised learning architectures. The three models CVT [47], MVC-NET [30], and TMC [48] are used for multi-view classification in medical image processing, which is the most widely applied field of multi-view classification and represents the mainstream level of this field. For the models with the task of image fusion, we added a classification head at the end of them to achieve the classification function. All the results are shown in Tables 3 and 4. Among them, “CH” represents the classification head, and “*” represents the non-shared weights. All models are trained according to the settings of Epochs in Table 2. DenseFuse, NestFuse, RFN-Nest, CDDFuse and EMMA all use the cross-entropy as the loss function.
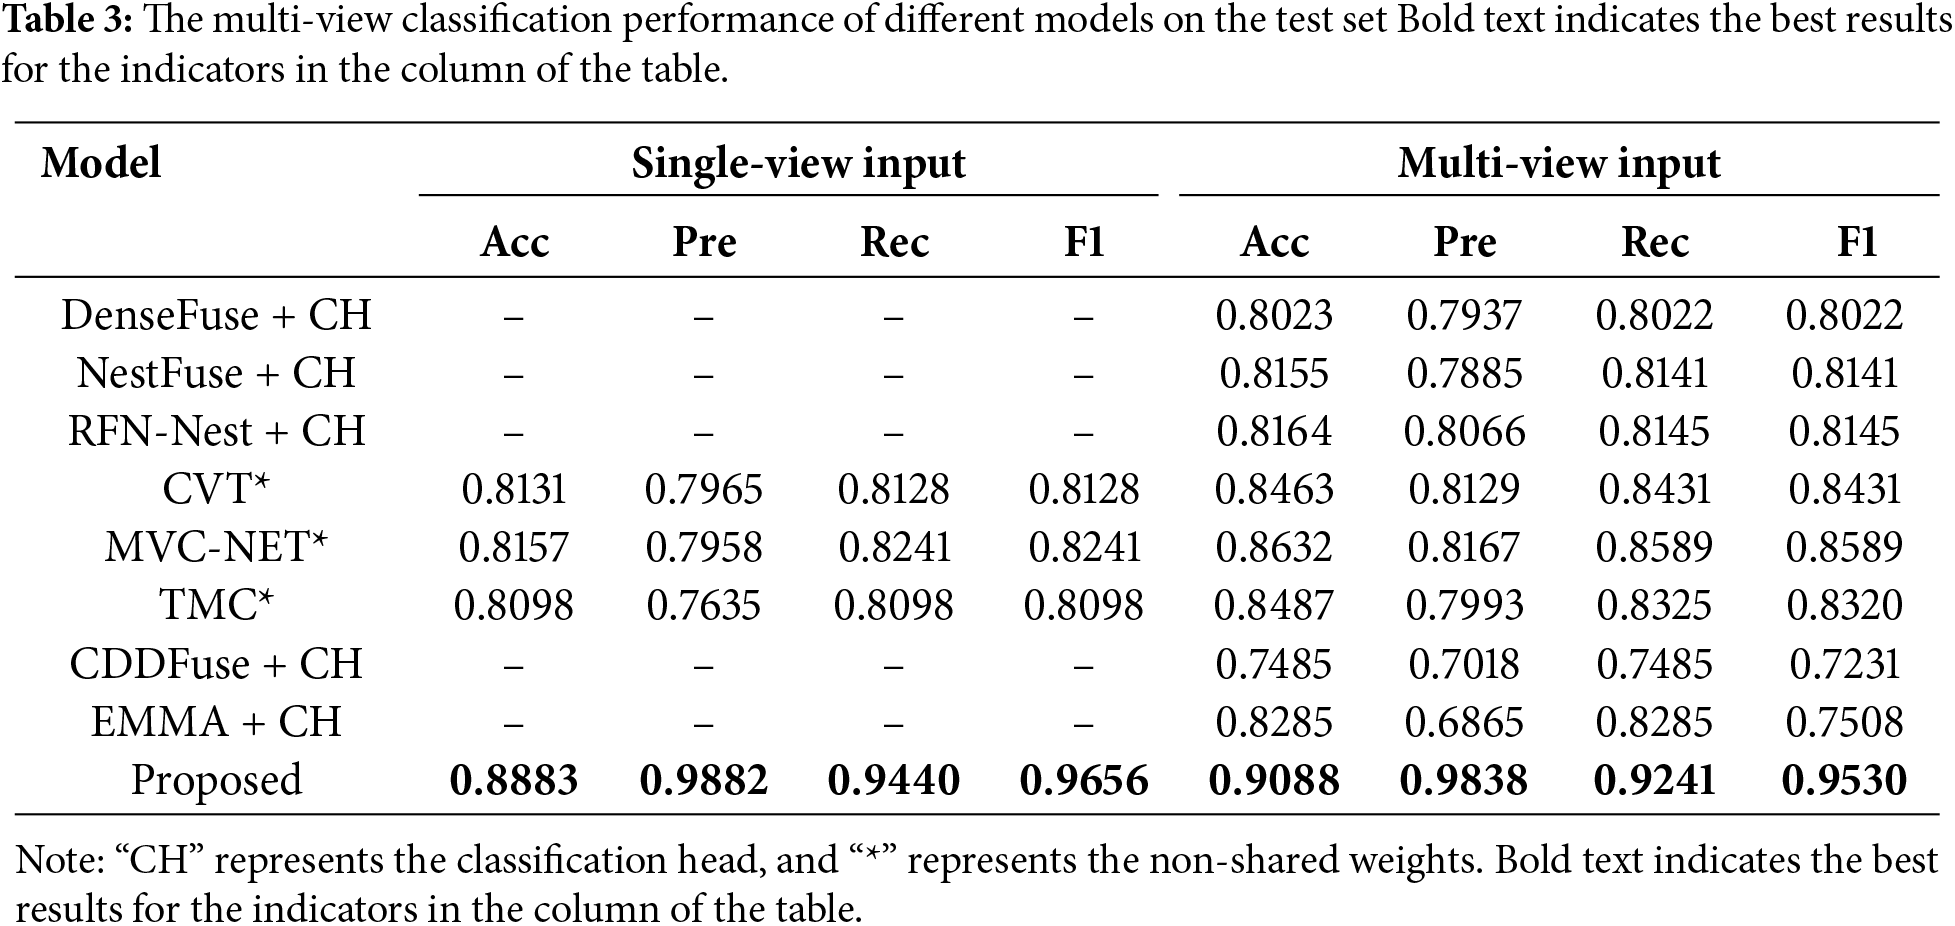
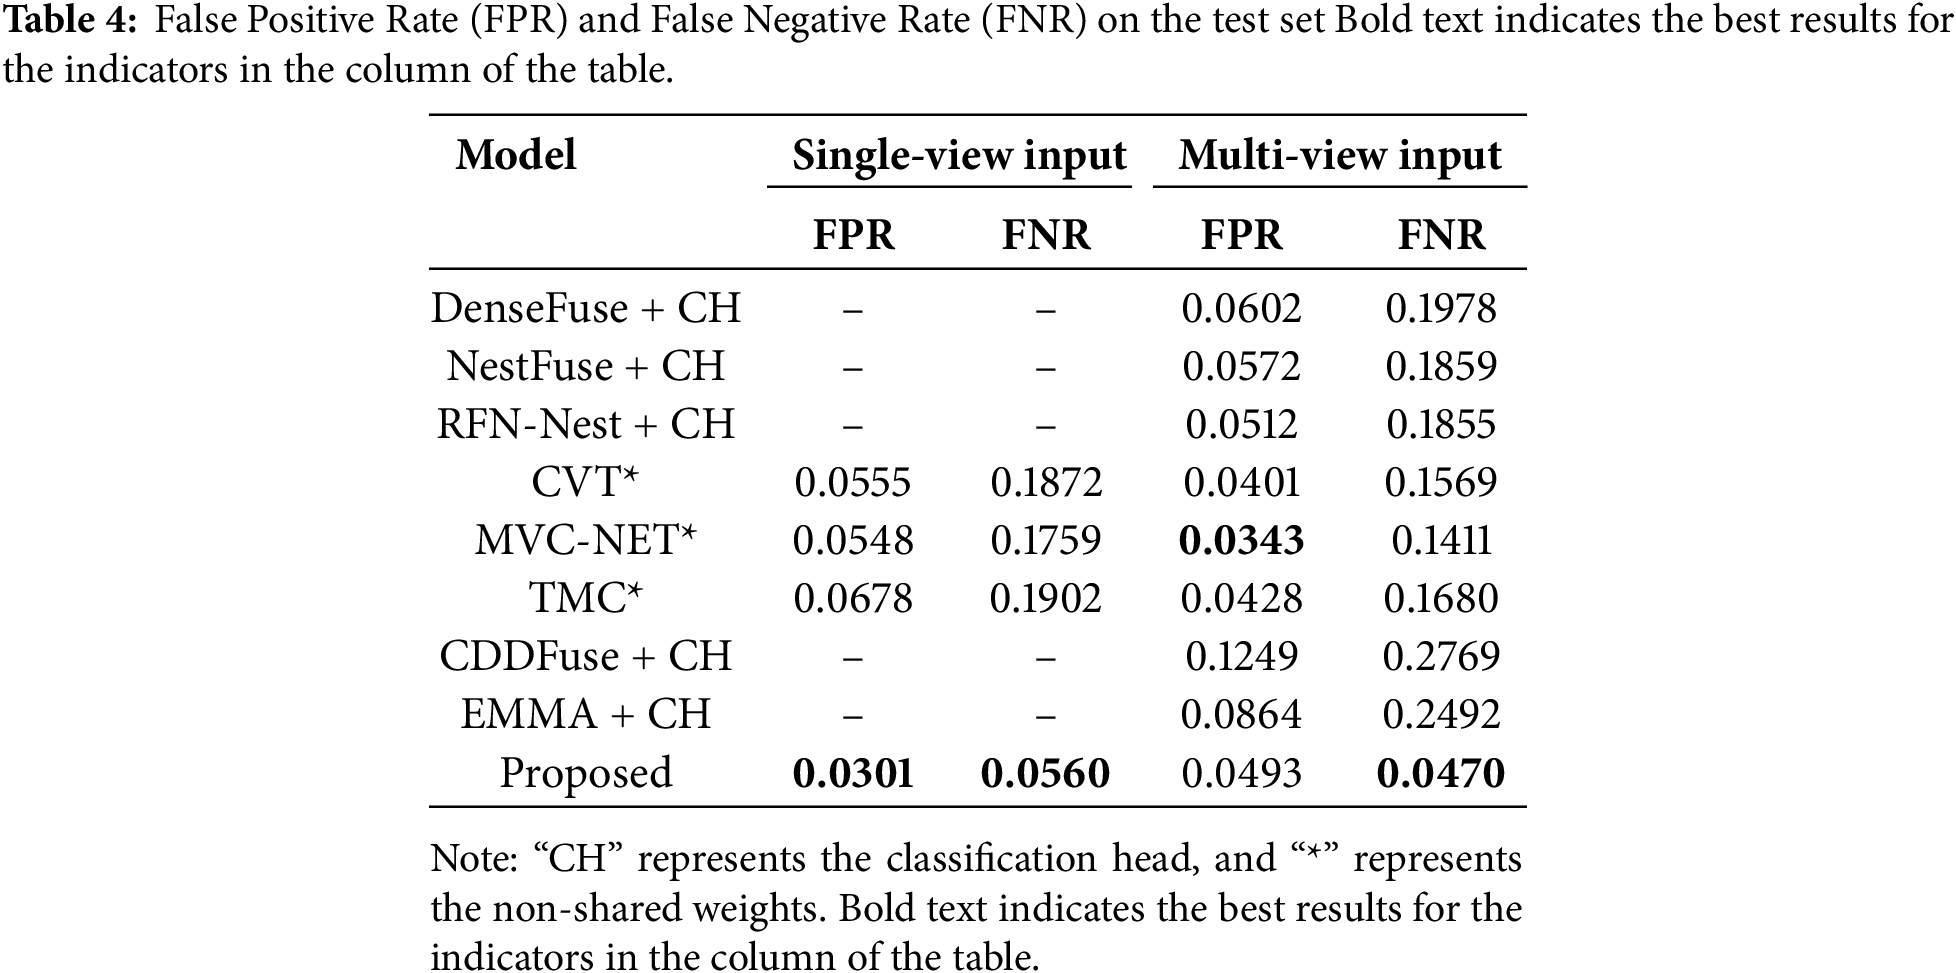
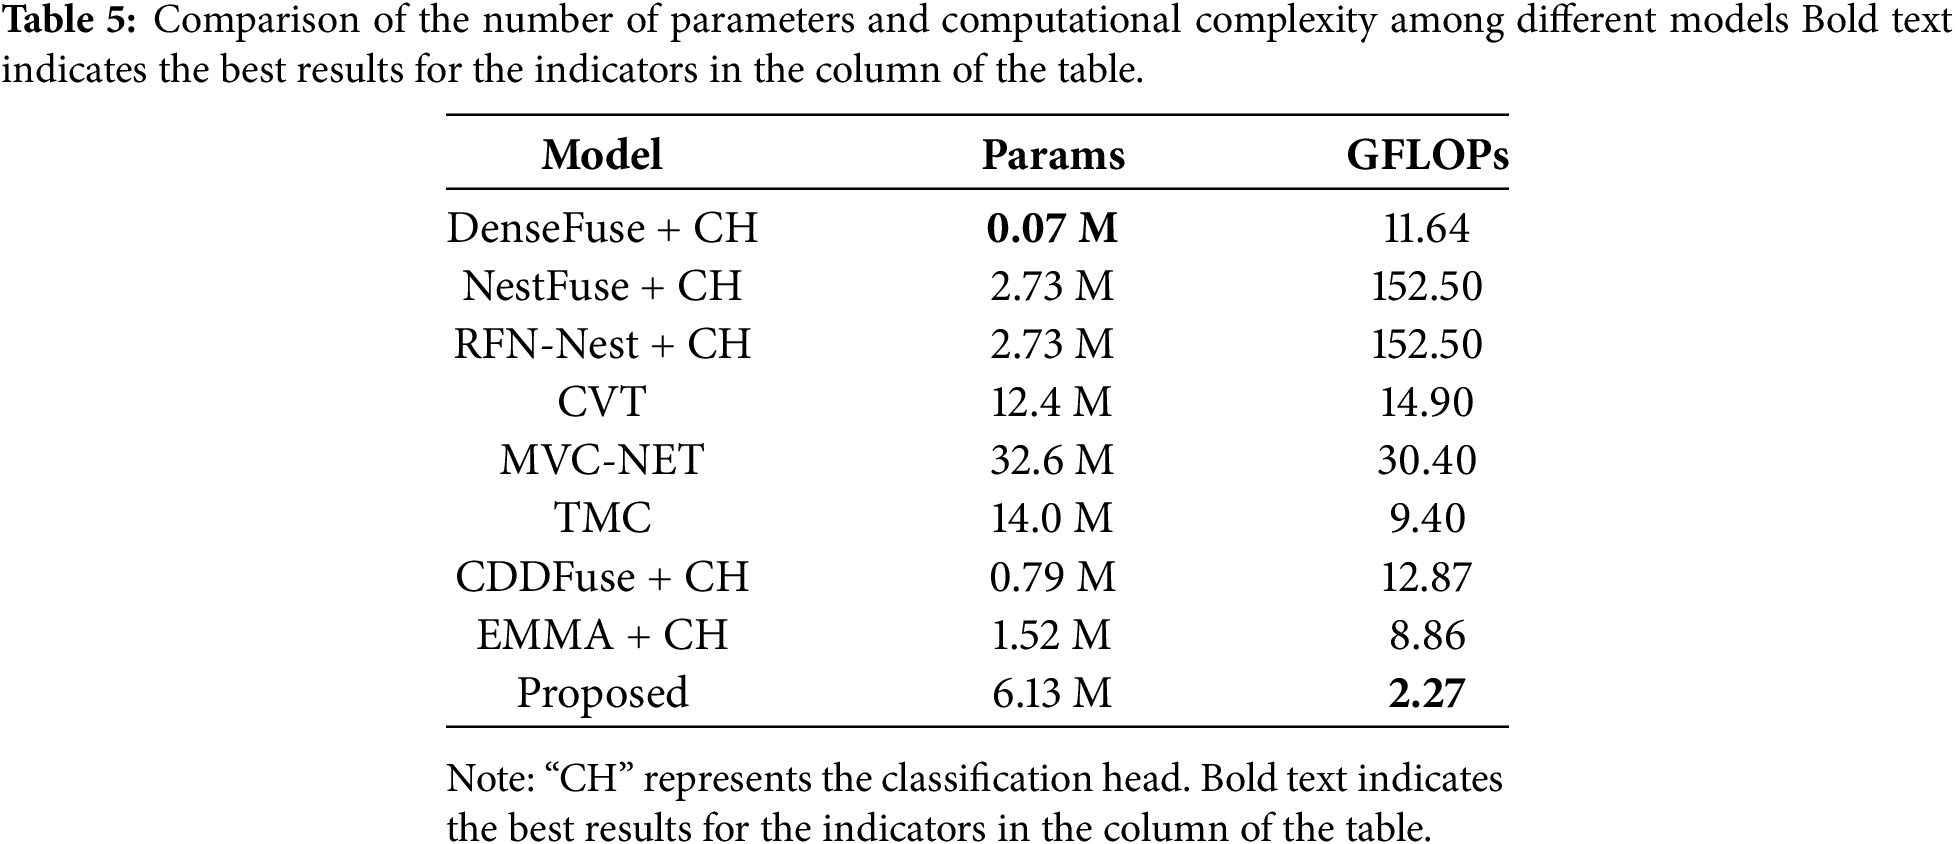
First of all, it can be seen that models such as DenseFuse, NestFuse, RFN-Nest, CDDFuse, and EMMA, which achieve image fusion classification by directly adding a classification head, perform poorly in various classification indicators. This is because, for the cross-view problem, there are significant differences in viewing angles between the input images, and it is difficult to achieve good results through direct fusion. Secondly, for networks with two input modes, all indicators of multi-view input are superior to those of single-view input. This indicates that multi-view input and the feature fusion of these inputs can effectively improve various indicators in the classification task, demonstrating the effectiveness of the multi-view input fusion strategy. Finally, for the three multi-view classification models, namely CVT, MVC-NET, and TMC, all their indicators on the test set are lower than those of the method we proposed. This shows that the proposed method has good performance in the multi-view smoke classification task, especially in cross-view tasks. In terms of false positive rate (FPR) and false negative rate (FNR), the proposed model outperforms the comparative models in all aspects except for a slightly lower FPR under multi-view input conditions, demonstrating its reliability in practical applications. In addition, we compared the number of parameters and computational complexity of several models involved in the comparison, as shown in Table 5. The results show that although the proposed model has a higher number of parameters than other image fusion models, it has fewer parameters and lower computational complexity than the three multi-view classification models, and has certain advantages in lightweight deployment.
In order to eliminate the influence brought by the dataset factors, a comparative experiment was also carried out on the public dataset FLAME2. The FLAME2 dataset is an RGB-thermal imaging image pair dataset used for wildfire flame detection. This dataset was created by [9]. The experimental results are shown in Table 6, and the identifiers in the table are the same as those in Table 3.
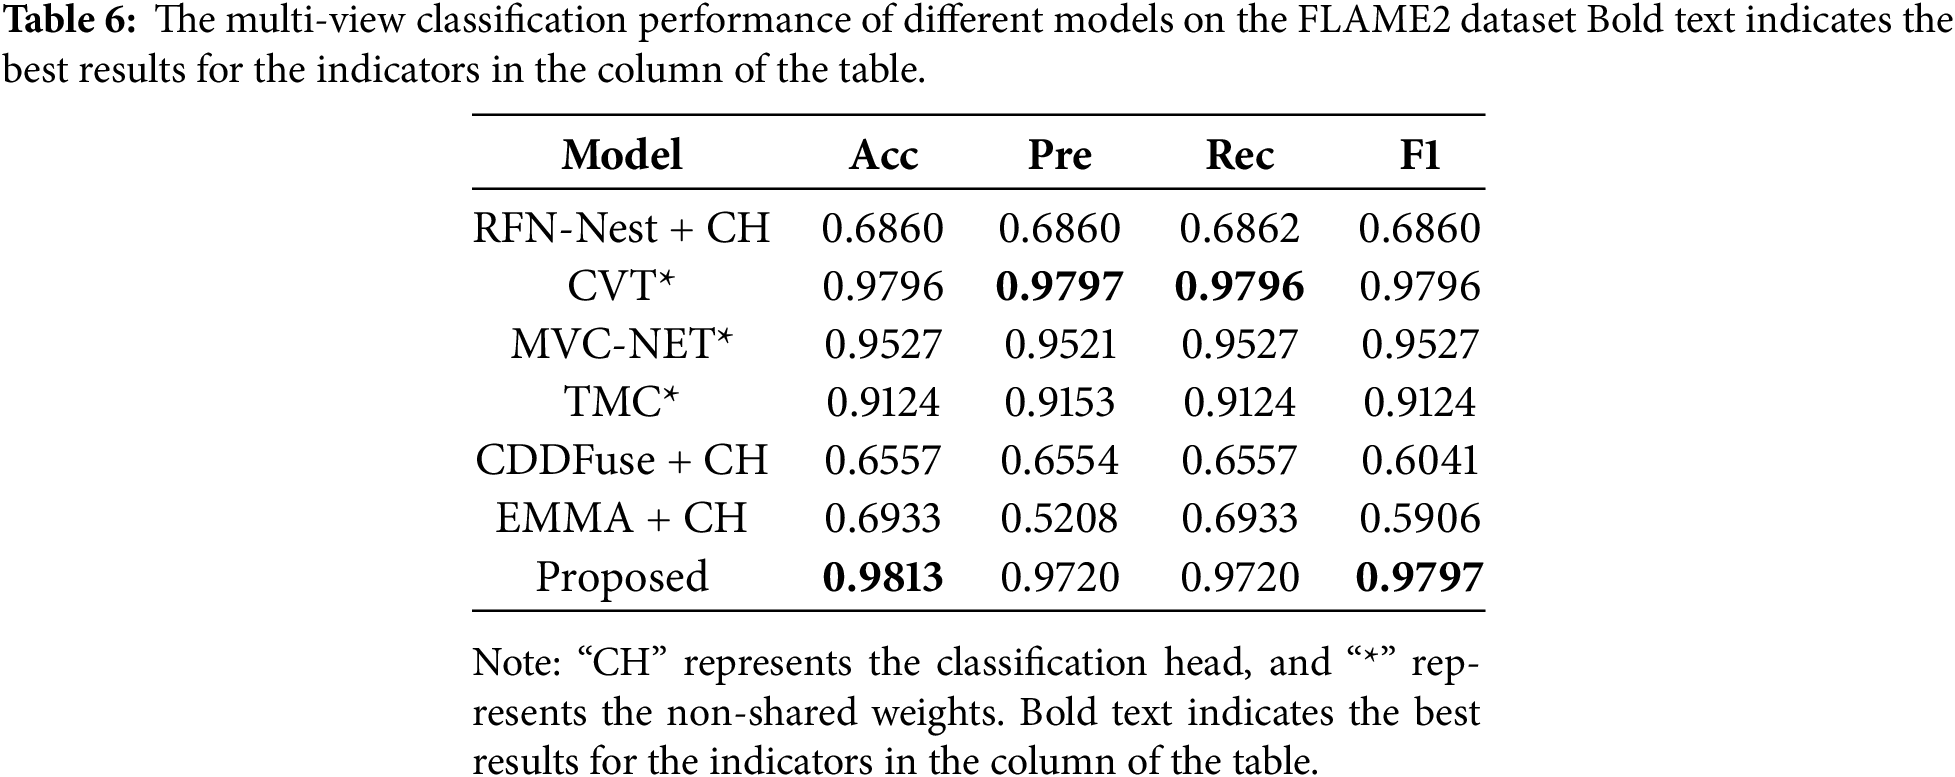
It can be concluded from Table 6 that, similar to Table 3, the models that achieve the classification function by directly adding a classification head still do not perform well, even though the dataset is not a cross-view dataset. For the models whose original data input format is multi-view, they perform well on this dataset, among which the evaluation indicators of CVT are comparable to those of the proposed model. The above results indicate that the proposed model also performs well on the public dataset, demonstrating the effectiveness of the method.
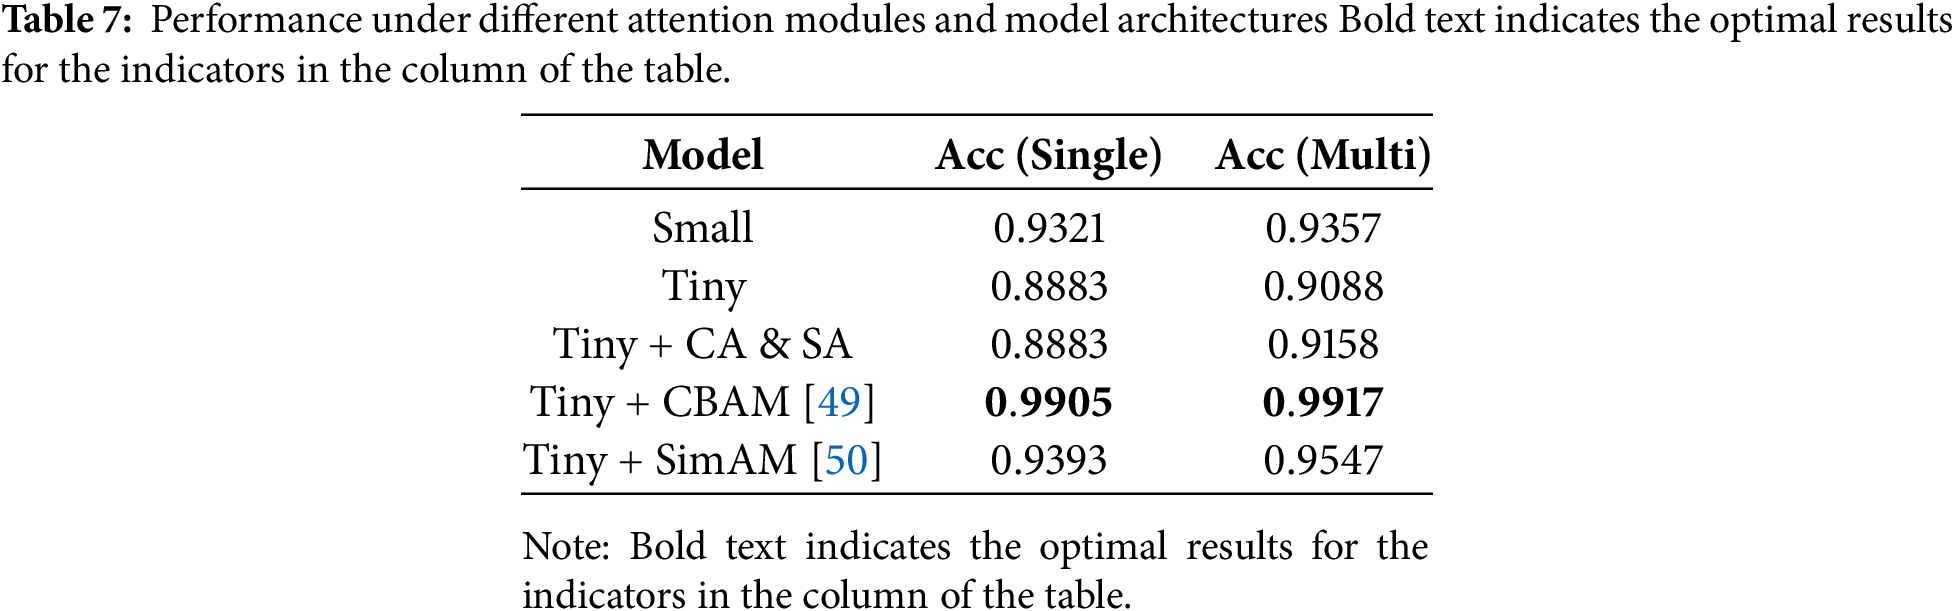
In order to illustrate the effectiveness of adding the attention module and compare the differences between different attention modules, we compared the performance of the model when different attention modules were added. We also compared the performance of the model when the ViT architecture version was changed. The experimental results are shown in Table 7. It can be seen that when the attention module is added, the performance of the model is significantly improved. This indicates that the attention module can effectively enhance the model’s focus on the key areas of the image, thereby better extracting the smoke features and improving the performance. At the same time, when the attention module is added while using the Tiny architecture, the performance of the model is slightly better than that when using the Small architecture, which is crucial for the lightweighting of the model.
To explore the interpretability of our method during the detection process and the model’s attention to the effective areas in the image, we used Grad-CAM [51] to visualize the category activation during the inference process, taking the example of not adding an attention module and adding a CBAM module, the results are shown in Fig. 7.
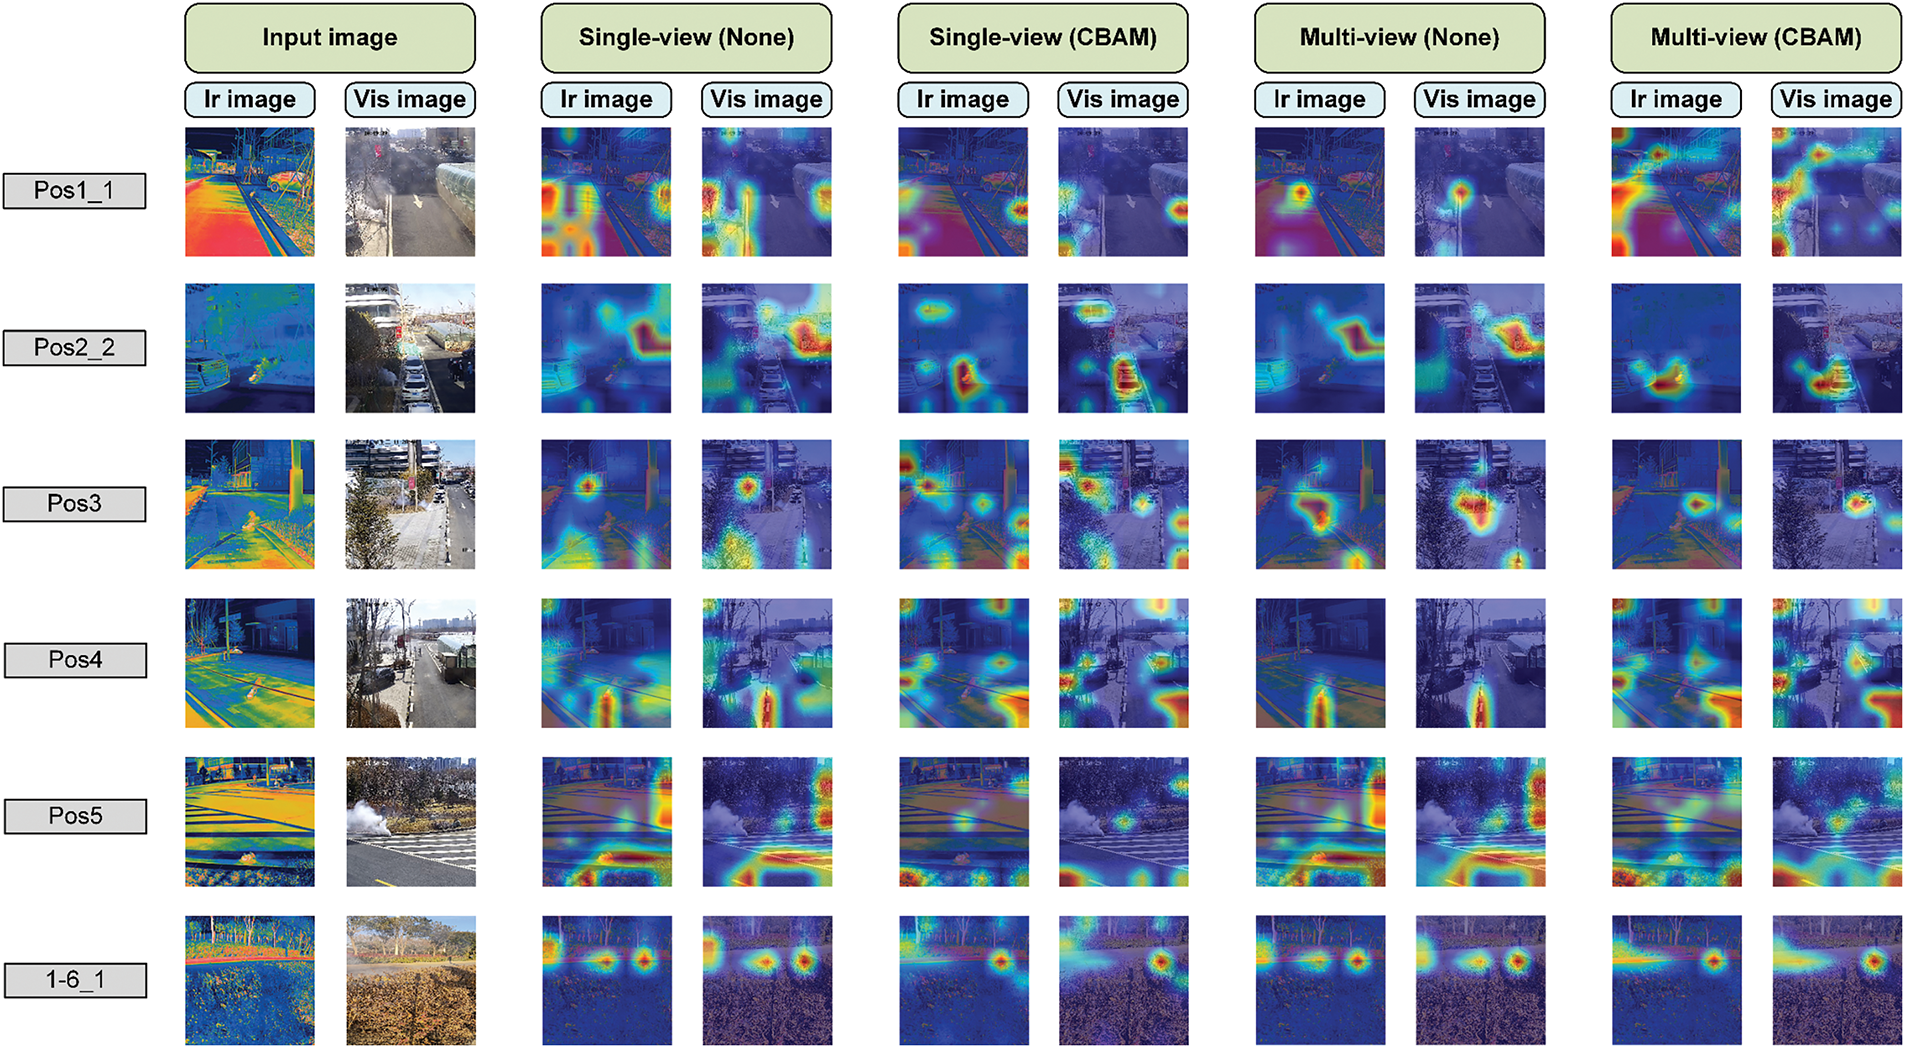
Figure 7: Class activation heatmaps generated using GradCAM, exemplifying models with and without the CBAM module
After adding the attention module, the focus area of the model exhibited a more obvious difference. As shown in “Pos1_1”, “Pos2_2” and “1-6_1”, the improved model can focus more effectively on key areas, thereby improving detection accuracy. However, for “Pos4” and “Pos5”, although the improved model reduced attention to some irrelevant areas, the degree of attention to effective areas was lower than that of the improved model. Second, under the same conditions, the multi-view detection’s focus on effective areas is better than that of single-image detection, which also explains the results in Table 3 to some extent. However, Fig. 7 presents several issues. First, because of the scenes in the pictures, the smoke bombs and smoke do not occupy the main part of the image, so the hot areas in the heatmap do not include smoke, which is also a limitation of the algorithm at present. Second, owing to the shared weights, the hot areas in the heatmap consider the information of different views, which does not correspond well to their respective key areas.
Although the proposed method demonstrates great potential in the task of infrared-visible multi-view smoke recognition in urban areas, there are still many shortcomings, as shown in Fig. 8. Although we have carried out simulation experiments and data collection in multiple scenarios, there is still a substantial gap between the richness of the current dataset scenarios and the real-world situation. In many scenarios, there is a high degree of imbalance in data categories, causing the model to be more inclined to predict that smoke does not exist in the category. Moreover, due to the particularity of the scenarios, it is difficult to conduct more open-flame experiments to expand the categories of the dataset. Therefore, future research should focus on enriching the scenarios and categories of the dataset, especially the data volume of the control categories.
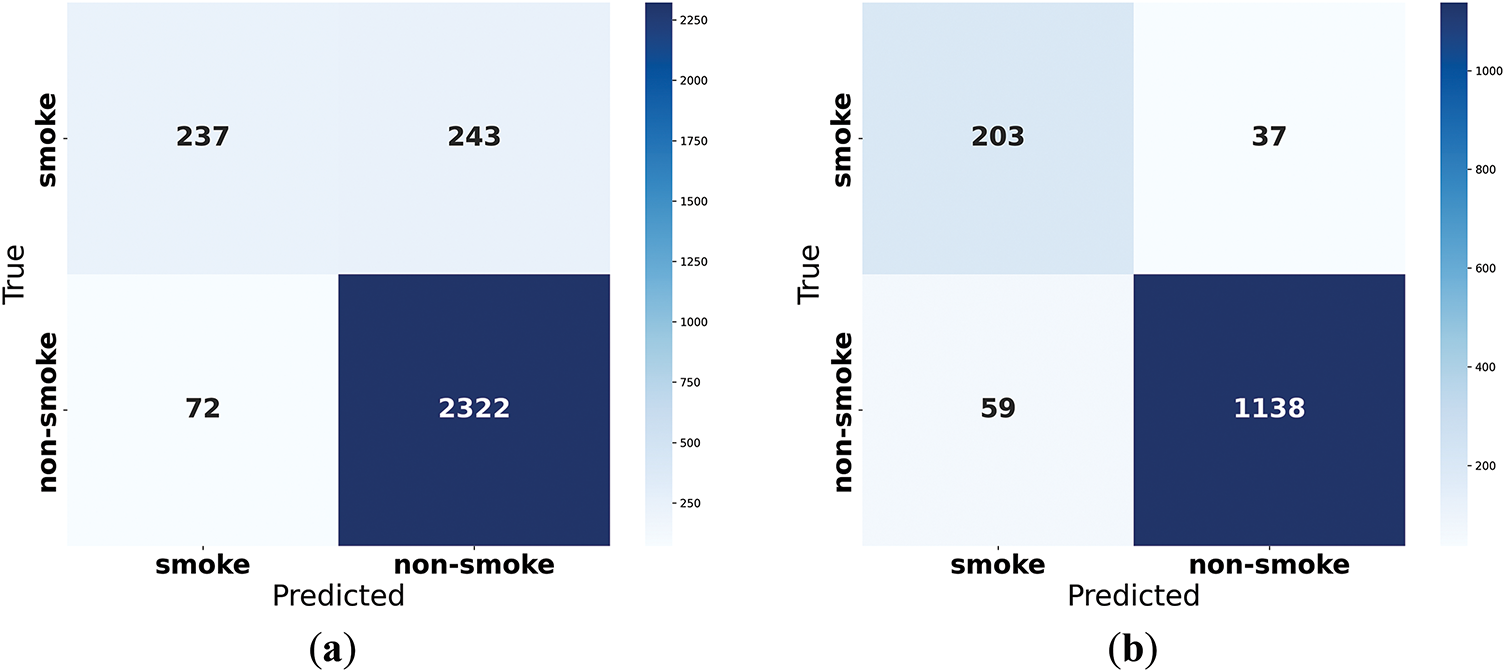
Figure 8: The confusion matrix of the proposed method on the test set (a) Confusion matrix under single-view input; (b) Confusion matrix under multi-view input
Given the outdoor nature of the scenes studied, deploying additional sensor equipment was not feasible, leading us to focus primarily on infrared imagery for multimodal analysis. In recent years there have been many studies focusing on how to design better fusion strategies, such as fusion strategies based on simplified Transformer modules [52], or methods for designing fusion rules based on different lighting conditions to ensure adaptation to different scenes [53]. In addition, drones have significant advantages in outdoor scene data collection. For example, drones equipped with sensors can be used to collect air quality data to con-struct high-resolution air pollution maps [54], etc. In the future, when these conditions allow, we should consider integrating a broader range of modalities to enhance the robustness of our detection methods.
Although there are numerous algorithms for multi-view classification, not all have been implemented and compared in this study, owing to experimental constraints. Thus, the proposed method has room for improvement. Future research should compare additional algorithms for similar tasks and incorporate their strengths to refine our approach further.
This study successfully improved the accuracy of smoke detection in business park scenes by adopting dual-view image fusion technology of visible light and infrared. The results show that even when the perspectives between images are different, combining multimodal data and improved multi-view classification algorithms can effectively identify smoke in an image. In our future research, we will focus on optimizing the model’s complexity in terms of computation, expanding and enhancing the scale and quality of the dataset to further improve the model’s predictive accuracy and generalization capability. This study provides new application scenarios and research ideas in the field of image processing and technical support for actual detection.
Acknowledgement: Not applicable.
Funding Statement: This study was supported by the National Natural Science Foundation of China (32171797) and Chunhui Project Foundation of the Education Department of China (HZKY20220026).
Author Contributions: The authors confirm contribution to the paper as follows: Conceptualization, Chongyang Wang and Pengle Cheng; methodology, Chongyang Wang; software, Chongyang Wang; validation, Chongyang Wang; formal analysis, Chongyang Wang; investigation, Chongyang Wang; resources, Shu Liu; data curation, Chongyang Wang; writing—original draft preparation, Chongyang Wang; writing—review and editing, Pengle Cheng, Qiongyan Li and Ying Huang; visualization, Chongyang Wang; supervision, Pengle Cheng; project administration, Pengle Cheng; funding acquisition, Pengle Cheng. All authors reviewed the results and approved the final version of the manuscript.
Availability of Data and Materials: The data that support the findings of this study are available from the Corresponding Author, Pengle Cheng, upon reasonable request.
Ethics Approval: Not applicable.
Conflicts of Interest: The authors declare no conflicts of interest to report regarding the present study.
References
1. Yin D, Cheng P, Huang Y. YOLO-EPF: multi-scale smoke detection with enhanced pool former and multiple receptive fields. Digit Signal Process. 2024;149(6):104511. doi:10.1016/j.dsp.2024.104511. [Google Scholar] [CrossRef]
2. Li G, Cheng P, Li Y, Huang Y. Lightweight wildfire smoke monitoring algorithm based on unmanned aerial vehicle vision. Signal Image Video Process. 2024;18(10):7079–91. doi:10.1007/s11760-024-03377-w. [Google Scholar] [CrossRef]
3. Zheng X, Chen F, Lou L, Cheng P, Huang Y. Real-time detection of full-scale forest fire smoke based on deep convolution neural network. Remote Sens. 2022;14(3):536. doi:10.3390/rs14030536. [Google Scholar] [CrossRef]
4. Owrutsky JC, Steinhurst DA, Minor CP, Rose-Pehrsson SL, Williams FW, Gottuk DT. Long wavelength video detection of fire in ship compartments. Fire Saf J. 2006;41(4):315–20. doi:10.1016/j.firesaf.2005.11.011. [Google Scholar] [CrossRef]
5. Töreyin BU. Fire detection in infrared video using wavelet analysis. Opt Eng. 2007;46(6):067204. doi:10.1117/1.2748752. [Google Scholar] [CrossRef]
6. Bosch I, Gomez S, Molina R, Miralles R. Object discrimination by infrared image processing. In: Mira J, Ferrández JM, Álvarez JR, De La Paz F, Toledo FJ, editors. Bioinspired applications in artificial and natural computation. Berlin/Heidelberg, Germany: Springer; 2009. p. 30–40. doi:10.1007/978-3-642-02267-8_4. [Google Scholar] [CrossRef]
7. Kim D, Ruy W. CNN-based fire detection method on autonomous ships using composite channels composed of RGB and IR data. Int J Nav Archit Ocean Eng. 2022;14(1):100489. doi:10.1016/j.ijnaoe.2022.100489. [Google Scholar] [CrossRef]
8. Marques T, Carreira S, Miragaia R, Ramos J, Pereira A. Applying deep learning to real-time UAV-based forest monitoring: leveraging multi-sensor imagery for improved results. Expert Syst Appl. 2024;245(2):123107. doi:10.1016/j.eswa.2023.123107. [Google Scholar] [CrossRef]
9. Chen X, Hopkins B, Wang H, O’Neill L, Afghah F, Razi A, et al. Wildland fire detection and monitoring using a drone-collected RGB/IR image dataset. IEEE Access. 2022;10:121301–17. doi:10.21227/swyw-6j78. [Google Scholar] [CrossRef]
10. Shang D, Zhang F, Yuan D, Hong L, Zheng H, Yang F. Deep learning-based forest fire risk research on monitoring and early warning algorithms. Fire. 2024;7(4):151. doi:10.3390/fire7040151. [Google Scholar] [CrossRef]
11. Boroujeni SPH, Razi A. IC-GAN: an improved conditional generative adversarial network for RGB-to-IR image translation with applications to forest fire monitoring. Expert Syst Appl. 2024;238(11):121962. doi:10.1016/j.eswa.2023.121962. [Google Scholar] [CrossRef]
12. Chen S, Ren J, Yan Y, Sun M, Hu F, Zhao H. Multi-sourced sensing and support vector machine classification for effective detection of fire hazard in early stage. Comput Electr Eng. 2022;101(3):108046. doi:10.1016/j.compeleceng.2022.108046. [Google Scholar] [CrossRef]
13. Zhang T, Ding F, Wang Z, Xiao F, Lu CX, Huang X. Forecasting backdraft with multimodal method: fusion of fire image and sensor data. Eng Appl Artif Intell. 2024;132:107939. doi:10.1016/j.engappai.2024.107939. [Google Scholar] [CrossRef]
14. Setio AAA, Ciompi F, Litjens G, Gerke P, Jacobs C, van Riel SJ, et al. Pulmonary nodule detection in CT images: false positive reduction using multi-view convolutional networks. IEEE Trans Med Imag. 2016;35(5):1160–9. doi:10.1109/TMI.2016.2536809. [Google Scholar] [PubMed] [CrossRef]
15. Bekker AJ, Shalhon M, Greenspan H, Goldberger J. Multi-view probabilistic classification of breast microcalcifications. IEEE Trans Med Imagi. 2016;35(2):645–53. doi:10.1109/TMI.2015.2488019. [Google Scholar] [CrossRef]
16. Carneiro G, Nascimento J, Bradley AP. Deep learning models for classifying mammogram exams containing unregistered multi-view images and segmentation maps of lesions. In: Deep learning for medical image analysis. Amsterdam, The Netherlands: Elsevier; 2017. p. 321–39. doi:10.1016/b978-0-12-810408-8.00019-5. [Google Scholar] [CrossRef]
17. Yang Z, Wang L. Learning relationships for multi-view 3D object recognition. In: Proceedings of the 2019 IEEE/CVF International Conference on Computer Vision (ICCV); 2019 Oct 27–Nov 2; Seoul, Republic of Korea. Piscataway, NJ, USA: IEEE; 2019. p. 7504–13. doi:10.1109/iccv.2019.00760. [Google Scholar] [CrossRef]
18. Wei X, Yu R, Sun J. View-GCN: view-based graph convolutional network for 3D shape analysis. In: Proceedings of the 2020 IEEE/CVF Conference on Computer Vision and Pattern Recognition (CVPR); 2020 Jun 13–19; Seattle, WA, USA. Piscataway, NJ, USA: IEEE; 2020. p. 1847–56. doi:10.1109/cvpr42600.2020.00192. [Google Scholar] [CrossRef]
19. Feng Y, Zhang Z, Zhao X, Ji R, Gao Y. GVCNN: group-view convolutional neural networks for 3D shape recognition. In: Proceedings of the 2018 IEEE/CVF Conference on Computer Vision and Pattern Recognition; 2018 Jun 18–23; Salt Lake City, UT, USA. Piscataway, NJ, USA: IEEE; 2018. p. 264–72. doi:10.1109/CVPR.2018.00035. [Google Scholar] [CrossRef]
20. Do TB, Nguyen HH, Nguyen TTN, Vu H, Tran TTH, Le TL. Plant identification using score-based fusion of multi-organ images. In: Proceedings of the 2017 9th International Conference on Knowledge and Systems Engineering (KSE); 2017 Oct 19–21; Hue, Vietnam. Piscataway, NJ, USA: IEEE; 2017. p. 191–6. doi:10.1109/KSE.2017.8119457. [Google Scholar] [CrossRef]
21. Lee SH, Chan CS, Remagnino P. Multi-organ plant classification based on convolutional and recurrent neural networks. IEEE Trans Image Process. 2018;27(9):4287–301. doi:10.1109/TIP.2018.2836321. [Google Scholar] [PubMed] [CrossRef]
22. Seeland M, Mäder P. Multi-view classification with convolutional neural networks. PLoS One. 2021;16(1):e0245230. doi:10.1371/journal.pone.0245230. [Google Scholar] [PubMed] [CrossRef]
23. Gadzicki K, Khamsehashari R, Zetzsche C. Early vs late fusion in multimodal convolutional neural networks. In: Proceedings of the 2020 IEEE 23rd International Conference on Information Fusion (FUSION); 2020 Jul 6–9; Rustenburg, South Africa. Piscataway, NJ, USA: IEEE; 2020. p. 1–6. [Google Scholar]
24. Black S, Souvenir R. Multi-view classification using hybrid fusion and mutual distillation. In: Proceedings of the 2024 IEEE/CVF Winter Conference on Applications of Computer Vision (WACV); 2024 Jan 3–8; Waikoloa, HI, USA. Piscataway, NJ, USA: IEEE; 2024. p. 269–79. doi:10.1109/WACV57701.2024.00034. [Google Scholar] [CrossRef]
25. Cheng Y, Fu L, Luo P, Ye Q, Liu F, Zhu W. Multi-view generalized support vector machine via mining the inherent relationship between views with applications to face and fire smoke recognition. Knowl Based Syst. 2020;210(4):106488. doi:10.1016/j.knosys.2020.106488. [Google Scholar] [CrossRef]
26. Al Radi M, Li P, Karki H, Werghi N, Javed S, Dias J. Multi-view inspection of flare stacks operation using a vision-controlled autonomous UAV. In: Proceedings of the IECON 2023—49th Annual Conference of the IEEE Industrial Electronics Society; 2023 Oct 16–19; Singapore. Piscataway, NJ, USA: IEEE. p. 1–6. doi:10.1109/IECON51785.2023.10312722. [Google Scholar] [CrossRef]
27. Fire-smoke-dataset [Internet]. [cited 2025 Jun 1]. Available from: https://github.com/DeepQuestAI/Fire-Smoke-Dataset. [Google Scholar]
28. Ko BC, Cheong KH, Nam JY. Fire detection based on vision sensor and support vector machines. Fire Saf J. 2009;44(3):322–9. doi:10.1016/j.firesaf.2008.07.006. [Google Scholar] [CrossRef]
29. Sun L, Wang J, Hu Z, Xu Y, Cui Z. Multi-view convolutional neural networks for mammographic image classification. IEEE Access. 2019;7:126273–82. doi:10.1109/access.2019.2939167. [Google Scholar] [CrossRef]
30. Zhu X, Feng Q. MVC-NET: multi-view chest radiograph classification network with deep fusion. In: Proceedings of the 2021 IEEE 18th International Symposium on Biomedical Imaging (ISBI); 2021 Apr 13–16; Nice, France. Piscataway, NJ, USA: IEEE; 2021. p. 554–8. doi:10.1109/isbi48211.2021.9434000. [Google Scholar] [CrossRef]
31. Wang A, Cai J, Lu J, Cham TJ. MMSS: multi-modal sharable and specific feature learning for RGB-D object recognition. In: Proceedings of the 2015 IEEE International Conference on Computer Vision (ICCV); 2015 Dec 7–13; Santiago, Chile. Piscataway, NJ, USA: IEEE; 2015. p. 1125–33. doi:10.1109/ICCV.2015.134. [Google Scholar] [CrossRef]
32. Qi CR, Su H, Nießner M, Dai A, Yan M, Guibas LJ. Volumetric and multi-view CNNs for object classification on 3D data. In: Proceedings of the 2016 IEEE Conference on Computer Vision and Pattern Recognition (CVPR); 2016 Jun 27–30; Las Vegas, NV, USA. Piscataway, NJ, USA: IEEE; 2016. p. 5648–56. doi:10.1109/CVPR.2016.609. [Google Scholar] [CrossRef]
33. Yu T, Meng J, Yuan J. Multi-view harmonized bilinear network for 3D object recognition. In: Proceedings of the 2018 IEEE/CVF Conference on Computer Vision and Pattern Recognition; 2018 Jun 18–23; Salt Lake City, UT, USA. Piscataway, NJ, USA: IEEE; 2018. p. 186–94. doi:10.1109/CVPR.2018.00027. [Google Scholar] [CrossRef]
34. Ma C, Guo Y, Yang J, An W. Learning multi-view representation with LSTM for 3-D shape recognition and retrieval. IEEE Trans Multimed. 2019;21(5):1169–82. doi:10.1109/TMM.2018.2875512. [Google Scholar] [CrossRef]
35. Yan S, Xiong X, Arnab A, Lu Z, Zhang M, Sun C, et al. Multiview transformers for video recognition. In: Proceedings of the 2022 IEEE/CVF Conference on Computer Vision and Pattern Recognition (CVPR); 2022 Jun 18–24; New Orleans, LA, USA. Piscataway, NJ, USA: IEEE; 2022. p. 3323–33. doi:10.1109/CVPR52688.2022.00333. [Google Scholar] [CrossRef]
36. Zhao X, Yu L, Wang X. Cross-view attention network for breast cancer screening from multi-view mammograms. In: Proceedings of the ICASSP 2020—2020 IEEE International Conference on Acoustics, Speech and Signal Processing (ICASSP); 2020 May 4–8; Barcelona, Spain. Piscataway, NJ, USA: IEEE; 2020. p. 1050–4. doi:10.1109/icassp40776.2020.9054612. [Google Scholar] [CrossRef]
37. Ma J, Li X, Li H, Wang R, Menze B, Zheng WS. Cross-view relation networks for mammogram mass detection. In: Proceedings of the 2020 25th International Conference on Pattern Recognition (ICPR); 2021 Jan 10–15; Milan, Italy. Piscataway, NJ, USA: IEEE; 2021. p. 8632–8. doi:10.1109/icpr48806.2021.9413132. [Google Scholar] [CrossRef]
38. Zhang Y, Xiang T, Hospedales TM, Lu H. Deep mutual learning. In: Proceedings of the 2018 IEEE/CVF Conference on Computer Vision and Pattern Recognition; 2018 Jun 18–23; Salt Lake City, UT, USA. Piscataway, NJ, USA: IEEE; 2018. p. 4320–8. doi:10.1109/CVPR.2018.00454. [Google Scholar] [CrossRef]
39. Hinton G, Vinyals O, Dean J. Distilling the knowledge in a neural network. arXiv:1503.02531. 2015. [Google Scholar]
40. Miyato T, Maeda SI, Koyama M, Ishii S. Virtual adversarial training: a regularization method for supervised and semi-supervised learning. IEEE Trans Pattern Anal Mach Intell. 2019;41(8):1979–93. doi:10.1109/TPAMI.2018.2858821. [Google Scholar] [PubMed] [CrossRef]
41. Yun S, Park J, Lee K, Shin J. Regularizing class-wise predictions via self-knowledge distillation. In: Proceedings of the 2020 IEEE/CVF Conference on Computer Vision and Pattern Recognition (CVPR); 2020 Jun 13–19; Seattle, WA, USA. Piscataway, NJ, USA: IEEE; 2020. p. 13873–82. doi:10.1109/cvpr42600.2020.01389. [Google Scholar] [CrossRef]
42. Li H, Wu XJ. DenseFuse: a fusion approach to infrared and visible images. IEEE Trans Image Process. 2018;28(5):2614–23. doi:10.1109/TIP.2018.2887342. [Google Scholar] [PubMed] [CrossRef]
43. Li H, Wu XJ, Durrani T. NestFuse: an infrared and visible image fusion architecture based on nest connection and spatial/channel attention models. IEEE Trans Instrum Meas. 2020;69(12):9645–56. doi:10.1109/TIM.2020.3005230. [Google Scholar] [CrossRef]
44. Li H, Wu XJ, Kittler J. RFN-Nest: an end-to-end residual fusion network for infrared and visible images. Inf Fusion. 2021;73(9):72–86. doi:10.1016/j.inffus.2021.02.023. [Google Scholar] [CrossRef]
45. Zhao Z, Bai H, Zhang J, Zhang Y, Xu S, Lin Z, et al. CDDFuse: correlation-driven dual-branch feature decomposition for multi-modality image fusion. In: Proceedings of the 2023 IEEE/CVF Conference on Computer Vision and Pattern Recognition (CVPR); 2023 Jun 17–24; Vancouver, BC, Canada. Piscataway, NJ, USA: IEEE; 2023. p. 5906–16. doi:10.1109/CVPR52729.2023.00572. [Google Scholar] [CrossRef]
46. Zhao Z, Bai H, Zhang J, Zhang Y, Zhang K, Xu S, et al. Equivariant multi-modality image fusion. In: Proceedings of the 2024 IEEE/CVF Conference on Computer Vision and Pattern Recognition (CVPR); 2024 Jun 16–22;Seattle, WA, USA. Piscataway, NJ, USA: IEEE; 2024. p. 25912–21. doi:10.1109/CVPR52733.2024.02448. [Google Scholar] [CrossRef]
47. van Tulder G, Tong Y, Marchiori E. Multi-view analysis of unregistered medical images using cross-view transformers. In: Proceedings of the Medical Image Computing and Computer Assisted Intervention-MICCAI 2021: 24th International Conference; 2021 Sep 27–Oct 1; Strasbourg, France. Berlin/Heidelberg, Germany: Springer; 2021. p. 104–13. [Google Scholar]
48. Han Z, Zhang C, Fu H, Zhou JT. Trusted multi-view classification with dynamic evidential fusion. IEEE Trans Pattern Anal Mach Intell. 2023;45(2):2551–66. doi:10.1109/TPAMI.2022.3171983. [Google Scholar] [PubMed] [CrossRef]
49. Woo S, Park J, Lee JY, Kweon IS. CBAM: convolutional block attention module. In: Proceedings of the Computer Vision—ECCV 2018. Cham, Switzerland: Springer International Publishing; 2018. p. 3–19. doi:10.1007/978-3-030-01234-2_1. [Google Scholar] [CrossRef]
50. Yang L, Zhang RY, Li L, Xie X. SimAM: a simple, parameter-free attention module for convolutional neural networks. In: Proceedings of the 38th International Conference on Machine Learning. New York, NY, USA: PMLR; 2021. p. 11863–74. [Google Scholar]
51. Selvaraju RR, Cogswell M, Das A, Vedantam R, Parikh D, Batra D. Grad-CAM: visual explanations from deep networks via gradient-based localization. In: Proceedings of the 2017 IEEE International Conference on Computer Vision (ICCV); 2017 Oct 22-29; Venice, Italy. Piscataway, NJ, USA: IEEE; 2017. p. 618–26. doi:10.1109/ICCV.2017.74. [Google Scholar] [CrossRef]
52. Liu Y, Li X, Liu Y, Zhong W. SimpliFusion: a simplified infrared and visible image fusion network. Vis Comput. 2025;41(2):1335–50. doi:10.1007/s00371-024-03423-1. [Google Scholar] [CrossRef]
53. Li C, He K, Xu D, Luo Y, Zhou Y. MVSFusion: infrared and visible image fusion method for multiple visual scenarios. Vis Comput. 2024;40(10):6739–61. doi:10.1007/s00371-024-03273-x. [Google Scholar] [CrossRef]
54. Bakirci M. Smart city air quality management through leveraging drones for precision monitoring. Sustain Cities Soc. 2024;106(6):105390. doi:10.1016/j.scs.2024.105390. [Google Scholar] [CrossRef]
Cite This Article
 Copyright © 2025 The Author(s). Published by Tech Science Press.
This work is licensed under a Creative Commons Attribution 4.0 International License , which permits unrestricted use, distribution, and reproduction in any medium, provided the original work is properly cited.
 Downloads
 Citation Tools