
 Submit a Paper
 Propose a Special lssue
 Open Access
ARTICLE

A Facial Expression Recognition Network Using Rebalance-Based Regulation of Attention Consistency and Focus
National Engineering Research Center of Educational Big Data, The Faculty of Artificial Intelligence in Education, Central China Normal University, Wuhan, 430079, China
* Corresponding Author: Liang Zhao. Email:
Computers, Materials & Continua 2025, 85(1), 1585-1602. https://doi.org/10.32604/cmc.2025.066147
Received 31 March 2025; Accepted 09 July 2025; Issue published 29 August 2025
 View Full Text
 Download PDF
Abstract
Facial expression datasets commonly exhibit imbalances between various categories or between difficult and simple samples. This imbalance introduces bias into feature extraction within facial expression recognition (FER) models, which hinders the algorithm’s comprehension of emotional states and reduces the overall recognition accuracy. A novel FER model is introduced to address these issues. It integrates rebalancing mechanisms to regulate attention consistency and focus, offering enhanced efficacy. Our approach proposes the following improvements: (i) rebalancing weights are used to enhance the consistency between the heatmaps of an original face sample and its horizontally flipped counterpart; (ii) coefficient factors are incorporated into the standard cross entropy loss function, and rebalancing weights are incorporated to fine-tune the loss adjustment. Experimental results indicate that the FER model outperforms the current leading algorithm, MEK, achieving 0.69% and 2.01% increases in overall and average recognition accuracies, respectively, on the RAF-DB dataset. The model exhibits accuracy improvements of 0.49% and 1.01% in the AffectNet dataset and 0.83% and 1.23% in the FERPlus dataset, respectively. These outcomes validate the superiority and stability of the proposed FER model.Keywords
Existing datasets on public facial expression usually contain more samples of happy or neutral facial expressions and fewer samples of fear and disgust [1,2], indicating a significant class imbalance phenomenon. Existing facial expression recognition (FER) methods usually provide overall high accuracy on such imbalanced datasets. Therefore, high recognition rates for main classes, such as happy and neutral facial expressions, achieved after training yield higher overall accuracy; however, this results in low average accuracy across all expression classes [3–6]. These imbalanced categories hinder improvements in overall and average accuracies of FER and considerably impact the understanding of human emotional states through FER models. Specifically, existing facial expression datasets contain category numbers and complex sample imbalances [7]. The category number imbalance can be slightly mitigated using the attention consistency adjustment module with rebalancing [8]. However, common difficulties and imbalanced samples can negatively impact classification loss [7]. The classification of difficult samples within a dataset is challenging. Moreover, models find it difficult to differentiate such samples, as they often contain blurred, occluded, and indistinct facial expressions [9]. Datasets contain fewer such samples, but these still yield low recognition accuracy. In contrast, simple samples can be easily classified and are distinctly recognized by the model; they are characterized by clear, unobstructed, and neutral expressions [9] and account for a large portion of the dataset, yielding high recognition accuracy and minimal computational loss. However, due to the predominance of simple class samples, their cumulative loss is considerably higher than that of difficult samples, leading to misdirected recognition by models. By primarily focusing on difficult samples instead of simple samples, the overall recognition accuracy of the model can be adversely impacted.
To address these issues, a static image-based expression recognition method is proposed herein, which incorporates a rebalanced attention consistency and focus adjustment module into the FER model. During training, the feature information of secondary and difficult classes is gleaned from primary and simple classes, respectively, guiding the FER model to focus more on the secondary and difficult classes without compromising the recognition accuracy of primary and simple classes. This adjusted model exhibits enhanced performance in imbalanced FER tasks, showing improved overall and average recognition accuracy on various facial expression datasets.
The remainder of this paper is organized as follows. Section 2 provides an overview of related technologies, and Section 3 describes the architecture and implementation of the proposed model. Section 4 discusses experiments and analyzes the results and performance of the proposed model. Section 5 concludes the paper with a discussion of future research prospects.
2.1 Facial Expression Recognition Methods
Modern FER methods predominantly employ deep learning models to distill meaningful features from facial expression datasets captured in natural scenes [10–13]. Compared with the dataset collected in laboratories, the facial expression dataset in natural scenes [2,14] is characterized by issues such as occlusion, image blurring, pose changes, and inaccurate labeling [15,16]; these issues collectively hinder the efficacy of FER algorithms. The challenges associated with outdoor FER have been addressed using approaches such as a self-cure-network (SCN) that introduces self-attention importance weighting and relabeling modules to weight samples and suppress dataset noise [5] and Region Attention Network (RAN) that introduces self-attention and relational attention modules to improve the model recognition rate for occlusion and pose change samples [4]. The Spatio-Channel Attention Net with Complementary Context Information (SCAN-CCI) [17] further advances occlusion-robust recognition through independent spatio-channel attention mechanisms and complementary FR-derived features. For label noise mitigation, Dynamic Noise-robust FER (DNFER) [18] introduces adaptive threshold-based sample selection with consistency regularization, employing class-specific dynamic thresholds to address inter-class imbalance and intra-class difficulty without requiring prior noise rate knowledge. Moreover, distribution mining and uncertainty estimation (DMUE) was previously proposed for hidden distribution mining along with paired uncertainty estimation methods to tackle inaccurate labeling in FER [19]. Erasing Attention Consistency (EAC) was also introduced, which uses erasure attention map consistency to prevent the model from remembering noisy labels in facial expression datasets [20].
In summary, noise inherent in datasets—such as occlusions, image blur, pose alterations, and imprecise labeling—constitutes primary challenges for current FER methods. Although denoising is a prevalent strategy employed during model training, its ability to mitigate dataset imbalances is limited.
Current research on FER models predominantly focuses on addressing the noise challenges within natural scene facial expression datasets, but frequently underestimates the impact of dataset imbalances. The existing methods may yield high overall accuracy but often have reduced average accuracy across all facial expression categories [3–6]. To tackle imbalanced datasets—where some categories are abundant while others are scarce—three common strategies are adopted: model integration, loss reweighting, and data preprocessing. Model integration strategies enhance the model performance via the fusion of multiple model traits [21,22]. This study primarily focused on the latter two strategies. Loss reweighting strategically assigns different weights during training to ensure equitable gradient propagation across categories [9,23,24], and data preprocessing methods frequently employ data resampling [25,26]; however, oversampling may inadvertently lead to duplicate samples and increase the risk of overfitting. Alternatively, data augmentation [27,28] can be used to enhance the samples, particularly for underrepresented classes. However, finding effective enhancement methods for FER datasets is difficult, as each category of samples contains specific local features related to expressions.
Building on these insights, the proposed approach concentrates on extracting feature information from secondary and difficult classes by leveraging the features of primary and simpler classes. It thus steers the model to uniformly mine relevant information from the entire training dataset, as opposed to solely relying on samples from secondary and difficult classes.
A novel approach, known as attention map consistency, is introduced herein to tackle the challenge of imbalanced FER [29]. Feature attention maps are scaled based on the number of class samples, and attention maps for all classes are computed for each individual sample. For primary and simple classes, less emphasis is placed on spatial transformation consistency of the feature maps by assigning smaller weights. Conversely, for secondary and difficult classes, stronger emphasis is placed on the consistency of spatial transformations of the feature maps by assigning larger weights. This guides the model to focus more on the feature information of secondary and difficult classes across all training samples, which in turn enhances the accuracy of the model in recognizing these classes.
The proposed model incorporates two modules for its regularization: rebalanced consistency adjustment (RBC) and rebalanced focus adjustment (RBF). By leveraging the imbalanced category distribution within facial expression datasets, the model directs more focus to secondary and difficult classes without compromising the recognition performance on primary and simple classes, thus achieving balanced learning.
We note that the RAF-DB images (please see the image in this figure) are from the following subject: train_00012, the usage of this image has been approved. Copyright reference: http://www.whdeng.cn/RAF/model1.html (accessed on 8 July 2025)
The architecture of the proposed network model is shown in Fig. 1.
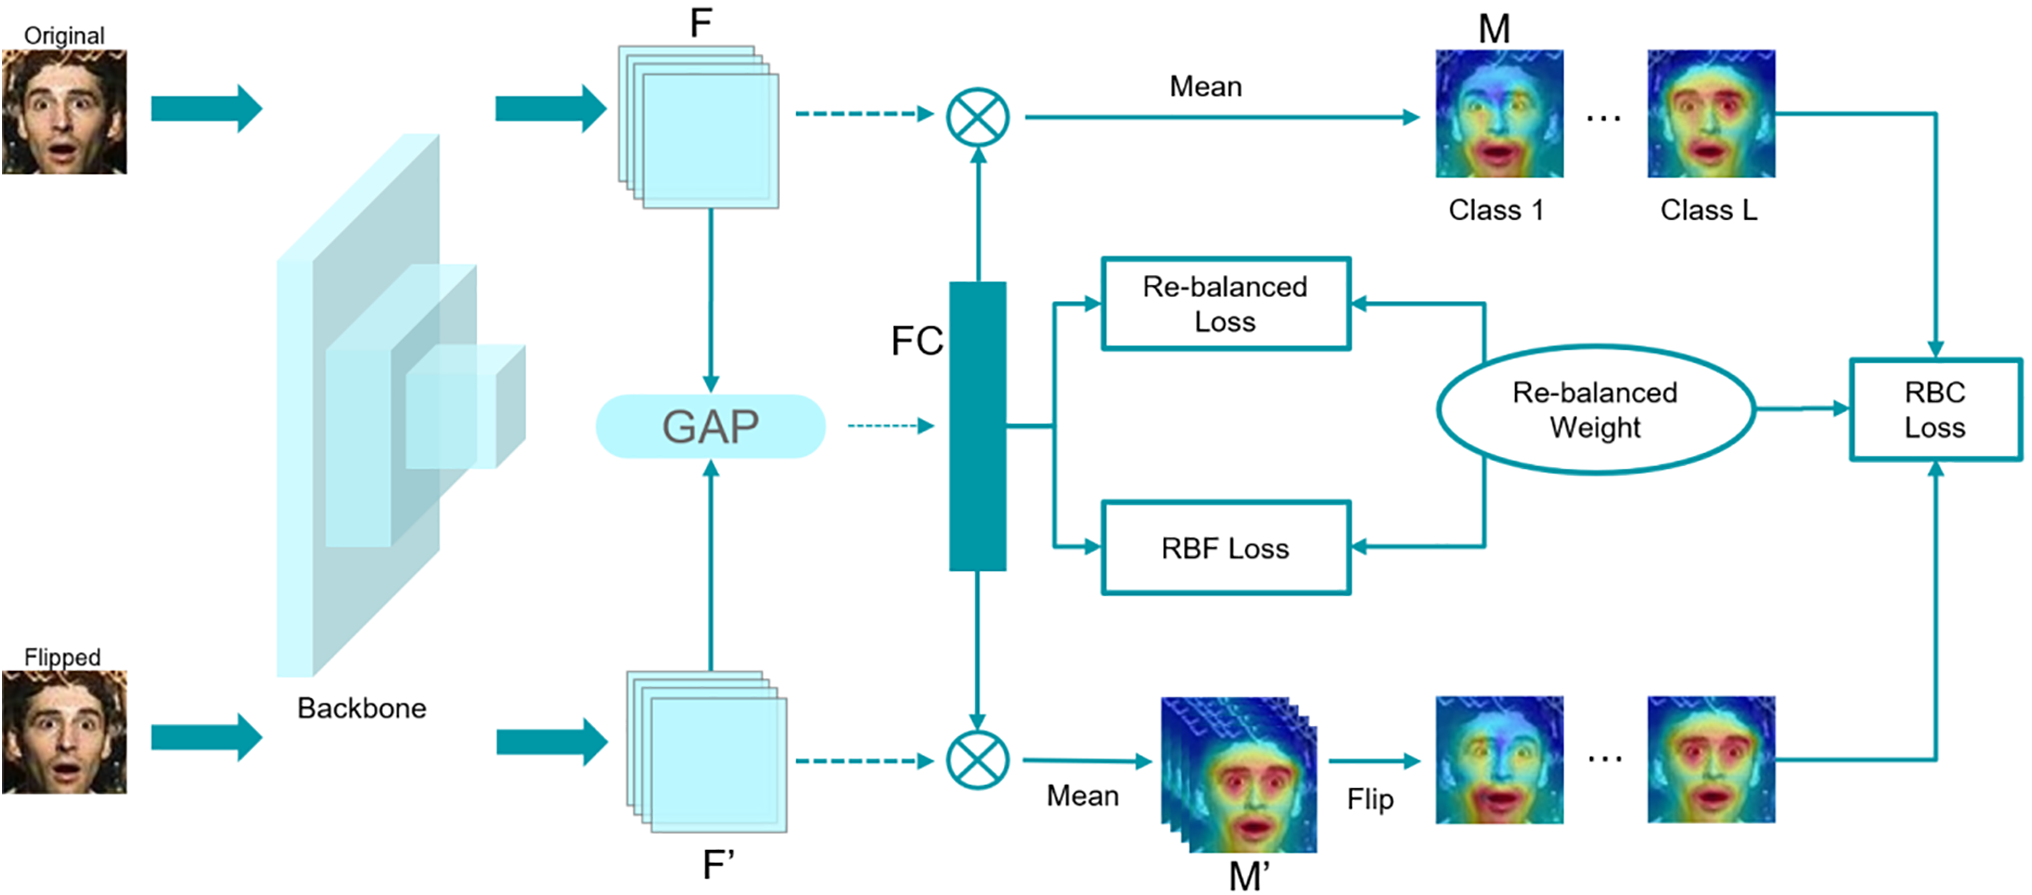
Figure 1: Network architecture
3.1 Attention Consistency Regulation with Rebalancing
If the input sample graph is horizontally flipped, the corresponding attention graph also follows the same spatial transformation for regularization. This helps the model to learn attention consistency information before and after sample transformation. Attention map consistency, such as EAC [20], is traditionally used to prevent models from memorizing noisy samples and labels, thereby addressing the common problem of noisy labels in facial expression datasets. Herein, attention graph consistency is used to solve the imbalanced learning problem in the model and mined information from multiple categories in a training sample. The attention consistency adjustment module with rebalancing is detailed as follows.
The given image is first flipped horizontally and input into the backbone network to obtain features extracted from the last convolutional layer. These features are denoted as
where
where
The above equation represents the rebalancing consistency module, which enables the model to extract balance and flipping consistency information of secondary classes from all training samples, thereby improving the recognition accuracy of secondary classes.
3.2 Focus Adjustment with Rebalancing
To solve the problem of difficult and simple sample imbalance [7], a rebalancing focus loss module was proposed, inspired by focal loss [9]. This module regulated the classification loss and promoted balanced learning of the model. The focal loss was calculated as follows:
where
3.3 Rebalance Weight and Total Loss Function
The model obtains attention maps for each category in the training sample and extracts information for secondary classes. For secondary categories, larger weights are used in the loss function calculation to constrain the flipping consistency of the feature attention map. Contrarily, for primary categories, smaller weights are used to constrain the flipping consistency of the feature attention map. Thus, the model pays more attention to the feature information of secondary categories in all class samples during training. Inspired by CB loss [23], weights are inversely proportional to the number of samples in each category and are calculated as follows for each category:
where
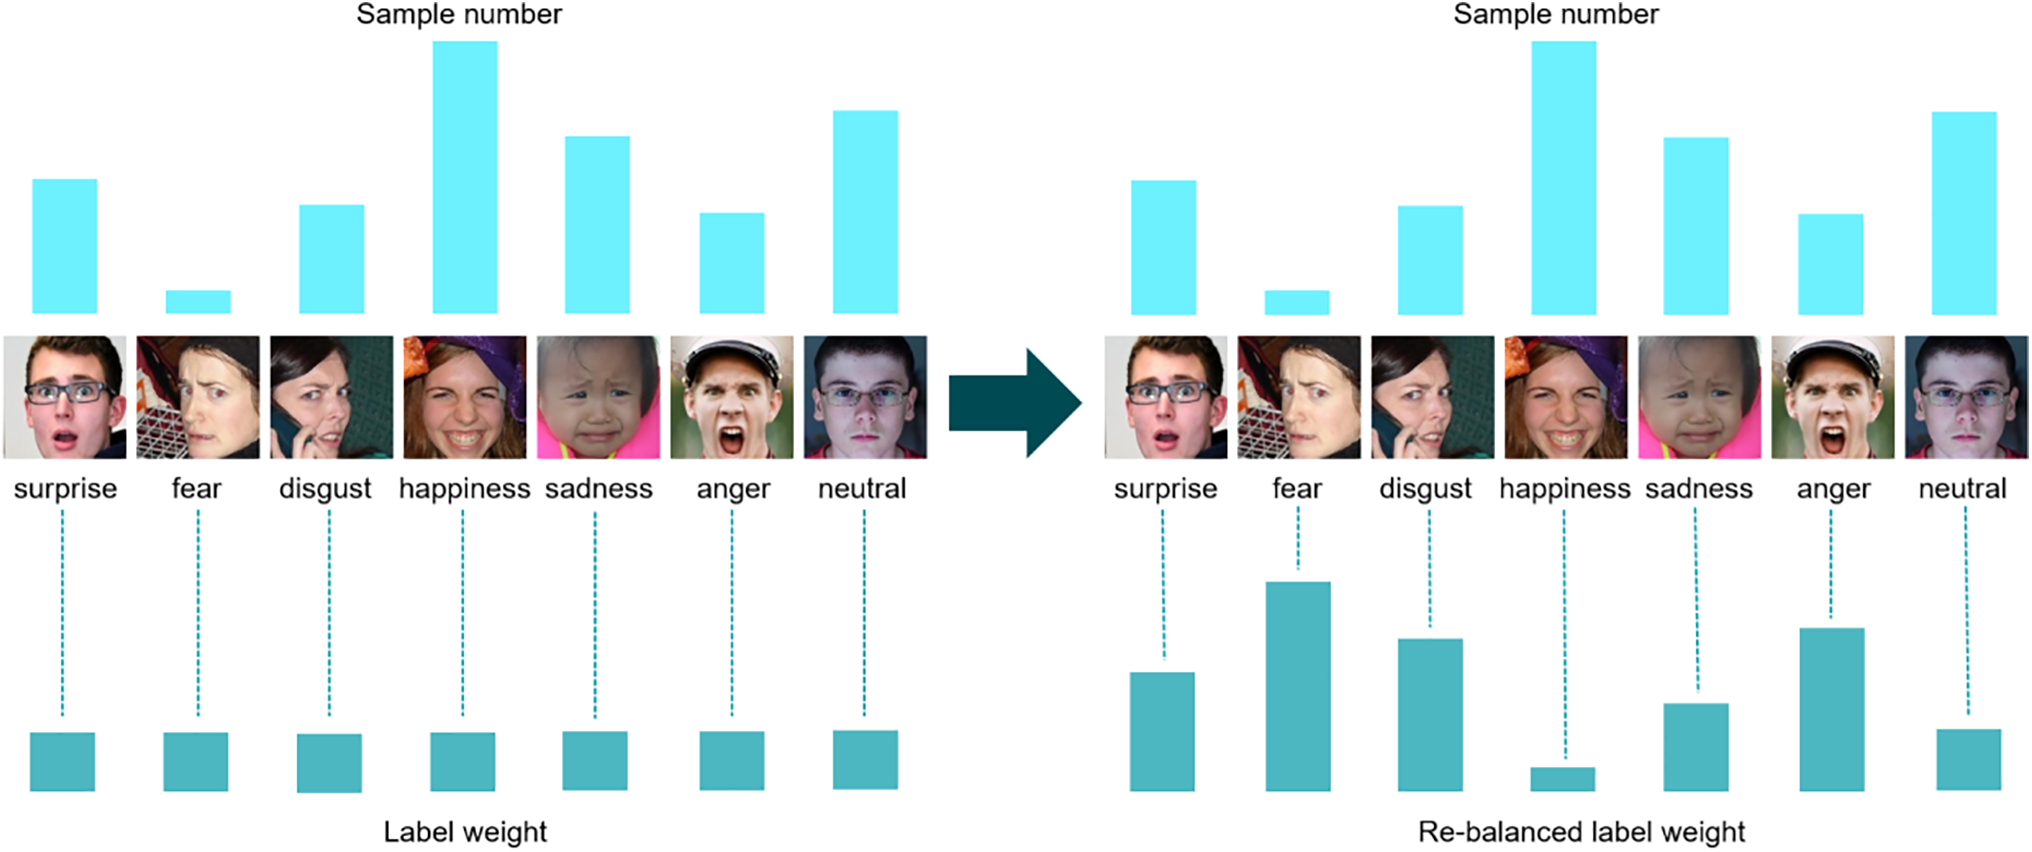
Figure 2: Rebalance weight adjustment effect
We note that the RAF-DB images (please see the seven columns in this figure) are from the following seven subjects: train_00069, train_00779, train_00031, train_00036, train_00030, train_00070, and train_09753, the usage of their images has been approved. Copyright reference: http://www.whdeng.cn/RAF/model1.html.
The total loss function is calculated as follows:
where
4 Analysis of Experimental Results
The RAF-DB [14] dataset contains facial expression data from natural scenes used for training deep learning models in fields such as FER and sentiment analysis. The dataset contains approximately 30,000 facial expression images, with each image independently labeled by 40 annotators. Detailed emotional labels include 7 basic emotions and 11 compound emotions, ensuring the accuracy and reliability of sample labels. The dataset contains 12,271 and 3068 training and testing samples, respectively. The average accuracy of all categories in the experiment was used to evaluate the model performance of different methods on imbalanced datasets. Fig. 3 shows the number of samples for each expression category in the training set of the RAF-DB dataset.
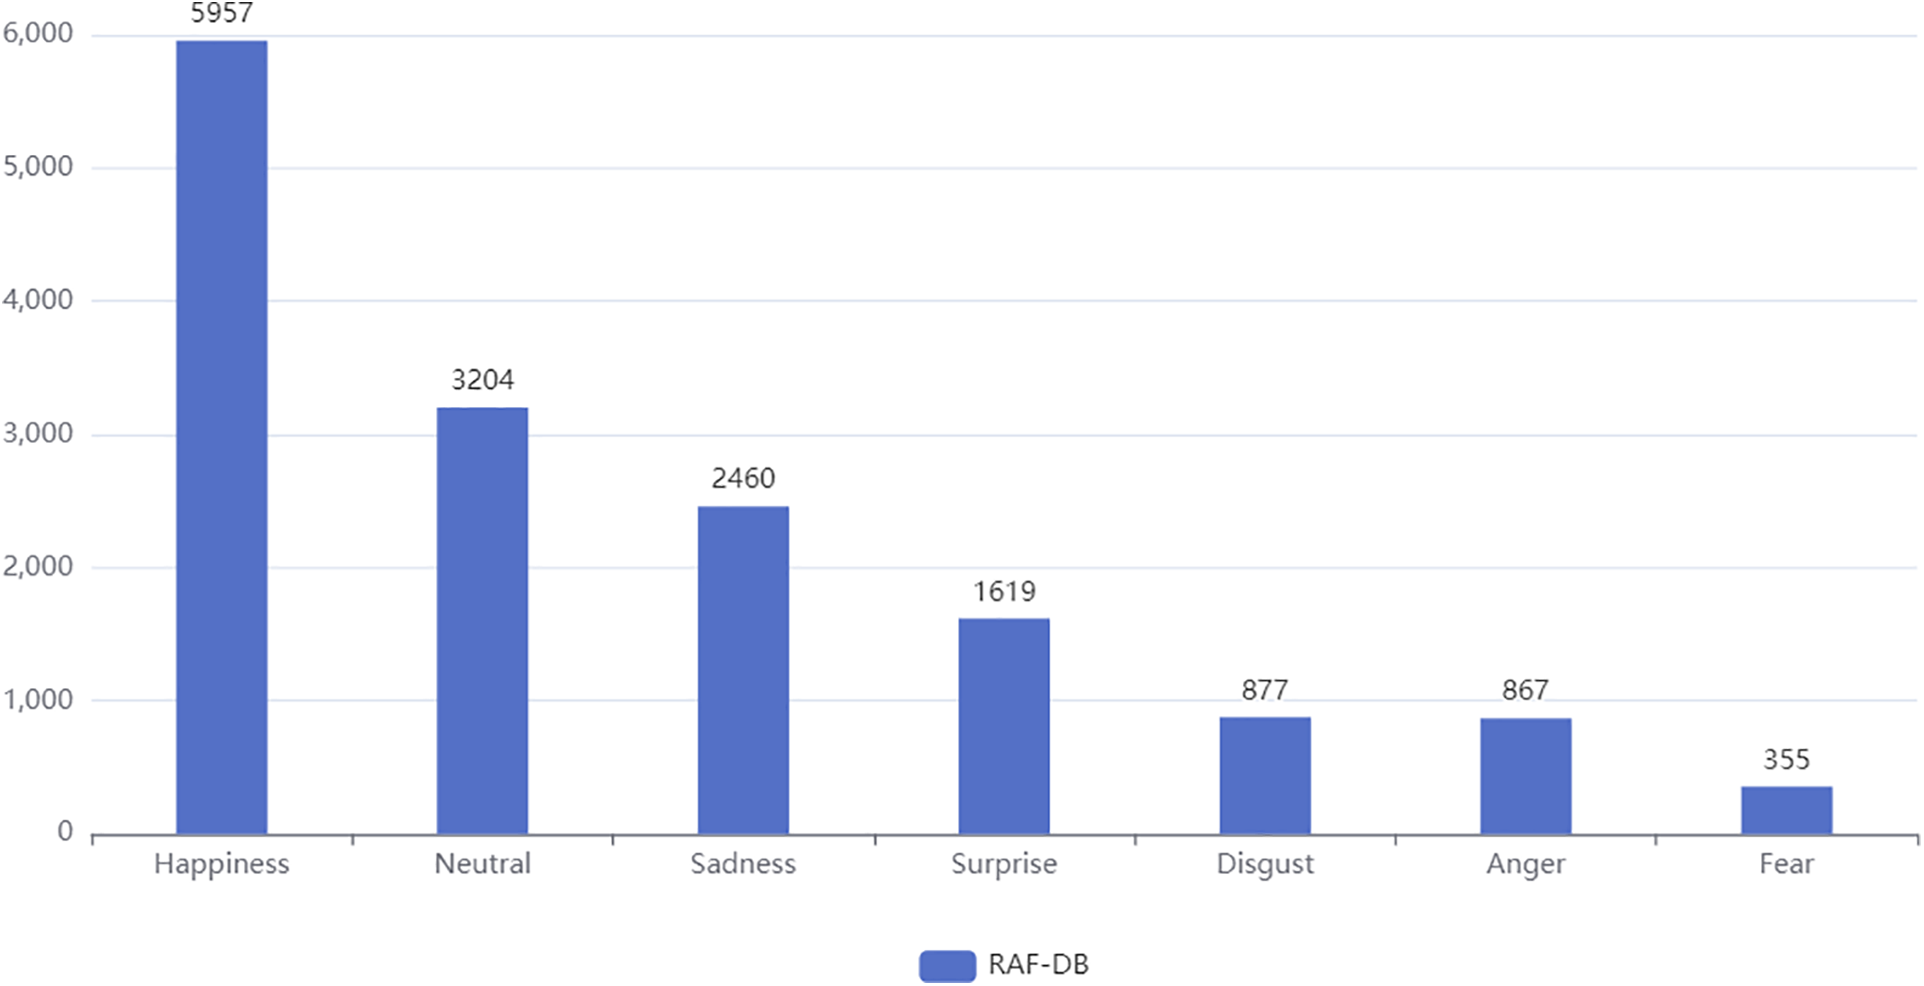
Figure 3: Number of categories in the RAF-DB dataset
AffectNet [1] is a large-scale FER dataset that contains 8 expression categories (7 basic expressions and contempt categories), 286,564 training samples, and 4000 test samples. To facilitate the comparison of model performance, 7 basic expression categories were used in the experiment. Fig. 4 shows the number of samples for each expression category in the AffectNet dataset training set.
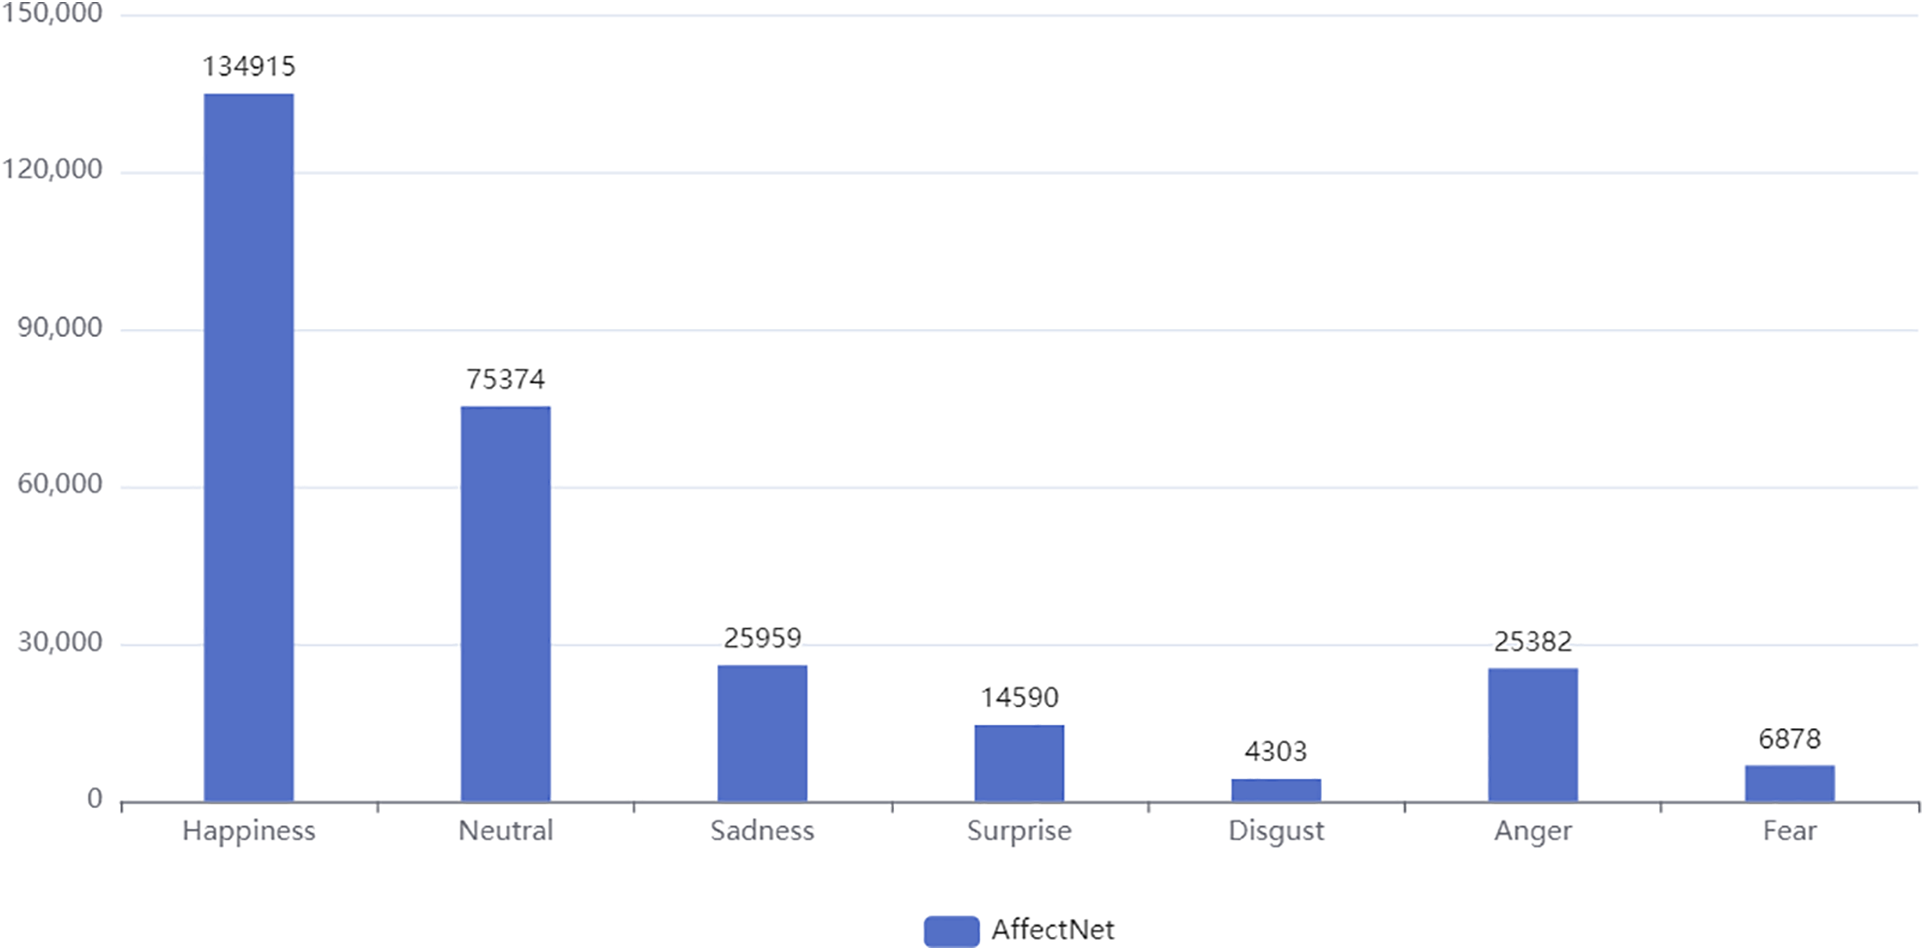
Figure 4: Number of categories in the AffectNet dataset
FERPlus [30] is an extension of the FER2013 [2] dataset, with more refined labels. The dataset contains 24,941 and 3137 training and testing samples, respectively, with 7 basic facial expressions labeled. Fig. 5 shows the number of samples for each expression category in the training set of the FERPlus dataset.
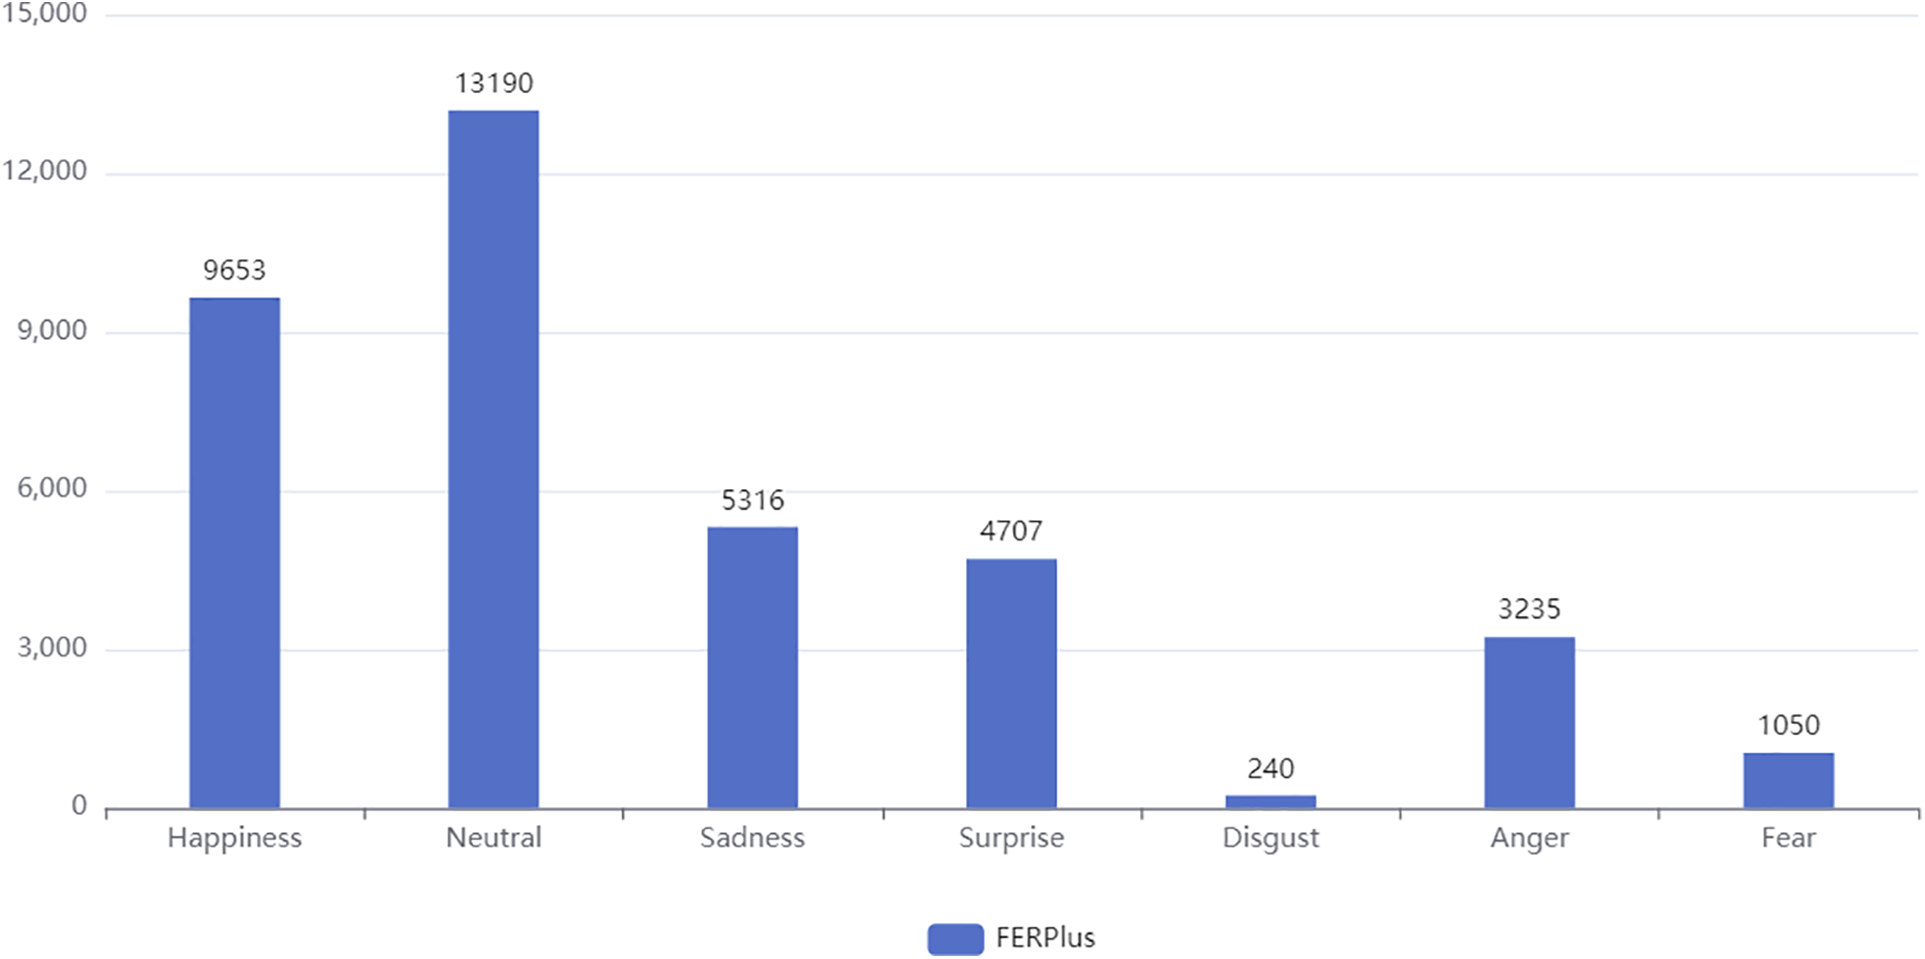
Figure 5: Number of categories in the FERPlus dataset
The proposed model was trained in Python using an NVIDIA GeForce GTX 1080 Ti GPU. As the ResNet backbone network was used in previous methods, ResNet-18 [31] was used as the backbone network for a fair comparison with other methods. It was pretrained based on the large-scale facial recognition dataset of Microsoft, MS-Celeb-1M [32]. The effectiveness of this method was also tested on different backbone networks such as MobileNet [33], ResNet-50 [31], and Swin Transformer [34]. During the data preprocessing stage, MTCNN [35] was used to monitor and align facial expressions. The image sample size was 224 × 224, and the learning rate was 0.0001. Random erasure and color jitter were used for data augmentation. During the training phase, the maximum number of training iterations was set to 60, and the batch size was 32. The Adam [36] optimizer was used to attenuate the weight to 0.0001. ExponentialLR was used as the learning rate regulator [37], and gamma was set to 0.9 to reduce the learning rate after each round.
4.3 Analysis of Experimental Results
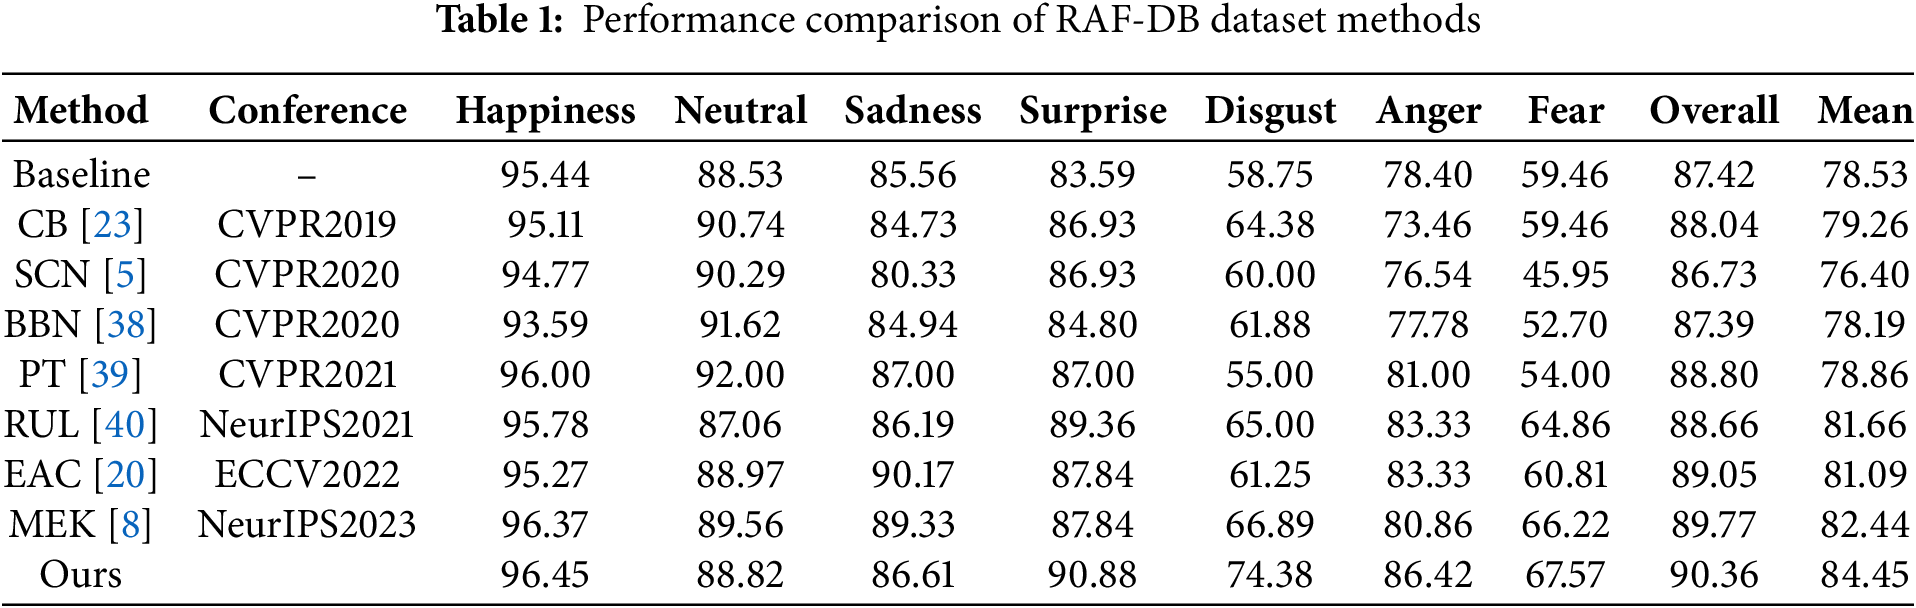
Table 1 compares different methods on the RAF-DB dataset with pre-trained ResNet-18 [31] as the backbone. An analysis of the accuracy of each category based on sample size revealed that each category exhibited varying degrees of difficulty. For instance, although the gas class had a small sample size, it achieved high performance in all methods. In contrast, disgust and fear were the most challenging to model and generally yielded low accuracies. This method achieved the highest accuracy in both categories, with improvements of 7.49% and 1.35% compared with the highest method, respectively. In addition, the number of anger categories was similar to that of disgust, and it also belonged to the secondary category. However, due to its distinctive facial expression features, the recognition rate was generally high. This method still improved the recognition rate of anger as a secondary category by 3.09% compared to the state-of-the-art methods. In addition, the recognition accuracies of the main categories (such as happiness and surprise) were high, indicating that this method does not impact the recognition accuracies of the main categories. In addition, to address the class imbalance problem, we adopt the F1-score as the core evaluation metric, which comprehensively reflects the model’s ability to recognize minority classes by balancing precision and recall. Experimental results demonstrate that our method achieves a mean F1-score of 85.72%, outperforming the state-of-the-art method MEK by a 3.18% improvement. Finally, this model also demonstrated the best performance in terms of the average accuracy of each category, with a 2.01% improvement compared with the state-of-the-art FER method, i.e., MEK.
4.3.2 Experiments on Different Backbone Networks
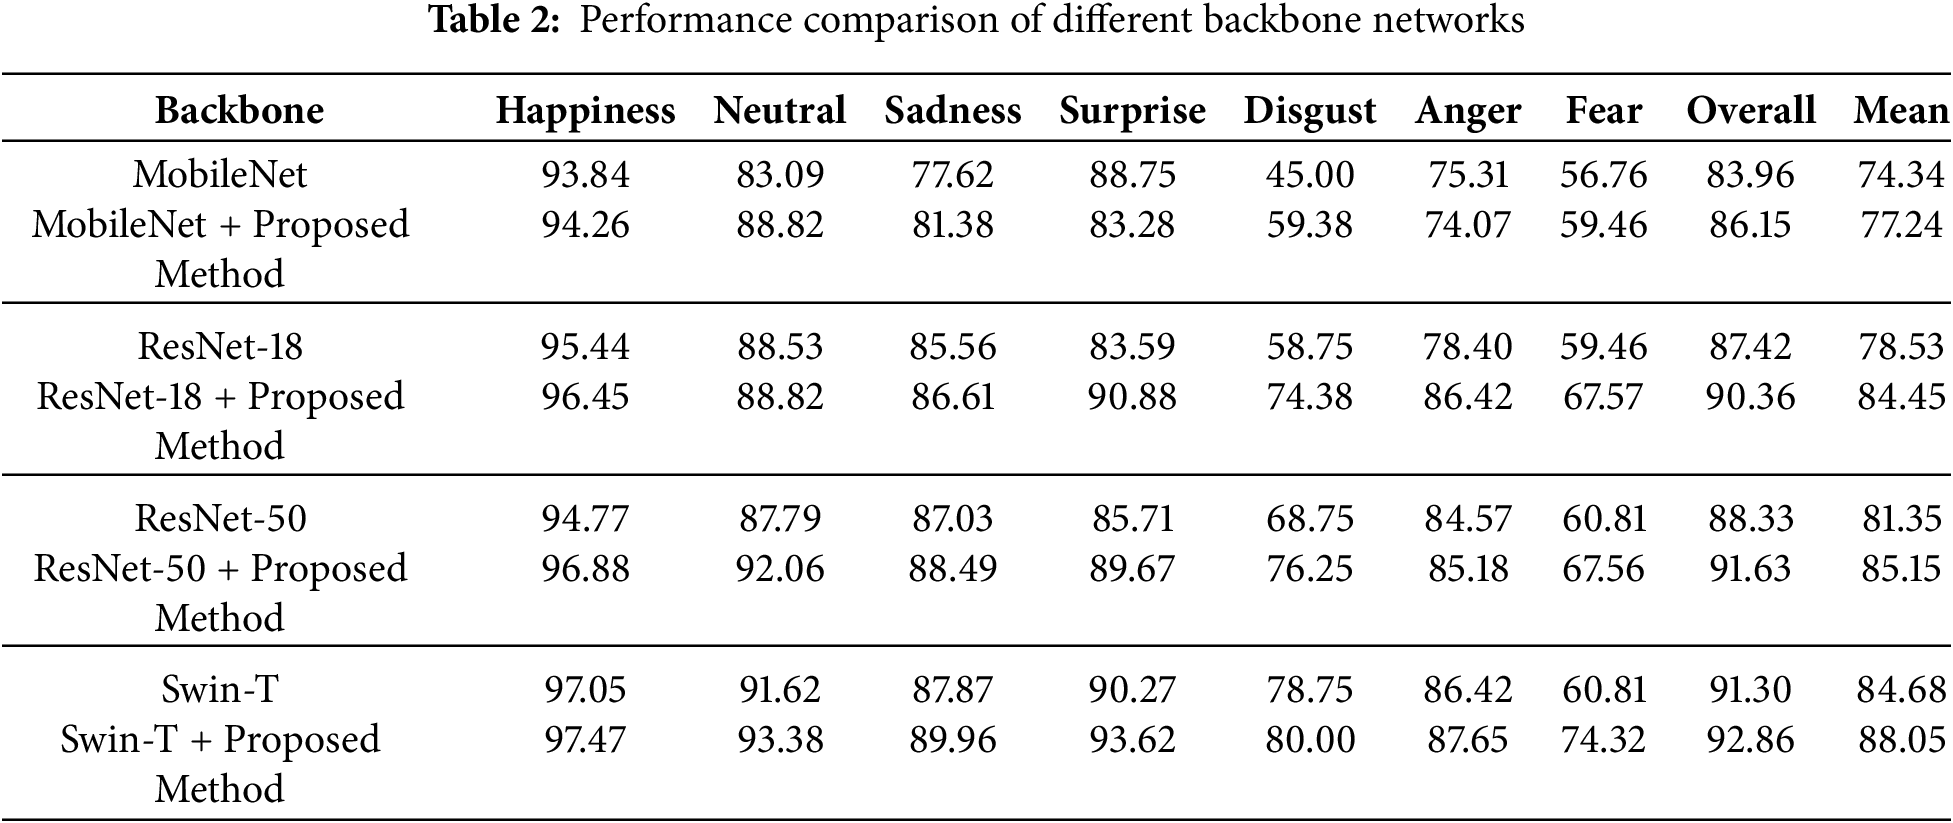
Table 2 evaluates the generalization ability of the proposed method on the RAF-DB dataset by combining it with four different backbone networks (MobileNet, ResNet-18, ResNet-50, and Tiny Swin Transformer). The experimental results showed that the imbalanced learning performance of the model was improved by adding modules on the baseline of each backbone network, which was manifested by the overall accuracy and average accuracy in each category. Note that this method achieved the best performance when combined with Tiny Swin Transformer, with the highest accuracy of 74.32% and 80.00% in minor fear and disgust classes (in addition to the difficult class), respectively, with an overall accuracy of 92.86% and an average accuracy of 88.05%.
4.3.3 Confusion Matrix Experiment
Fig. 6 shows the prediction results of the confusion matrix analysis model in each category, further verifying the performance of the model in imbalanced learning. The confusion matrix is a table used to evaluate the classification performance of a model; it displays the model’s predictions and confusion situation for each category. The rows and columns in the table represent true and predicted labels, respectively, and the data on the diagonal represent the recognition accuracy of each class. The remaining data represent the confusion probability of each class on other classes. As shown in the figure, fear and surprise have a higher probability of confusion because they have similar facial expression features (mouth opening). However, the proposed model extracts common features (mouth opening) between the primary class (surprise) and secondary class (fear) by generating an attention map for all categories on a sample. Under the influence of weights, the model pays more attention to the features of the secondary class, thereby improving the recognition accuracy of the secondary class. Compared with MEK, the proposed method yielded enhanced recognition accuracies for fear, disgust, and anger in secondary categories by 6%, 4%, and 3%, respectively, and reduced the confusion rate in secondary categories.

Figure 6: Confusion matrix of MEK and the proposed method on RAF-DB dataset. (a): MEK and (b): proposed method
4.3.4 Visualization of Results
To verify whether the model has learned the correct feature information for each category, Grad CAM [41] was used to analyze the focus area of the model for each category. Grad CAM calculates the gradient of the target category in a specific convolutional layer, calculates the global average of the gradient to give weight coefficients, determines the focus area of the model on the input image, and generates a heatmap. The heatmap highlights the most relevant area between the input image and the target category in red. Fig. 7 shows different focus process of the proposed model for each category during training. For the surprised and happy categories, the model focuses on the mouth area with obvious features, whereas for the disgusted and sad categories, the model focuses on the eye area with obvious features.
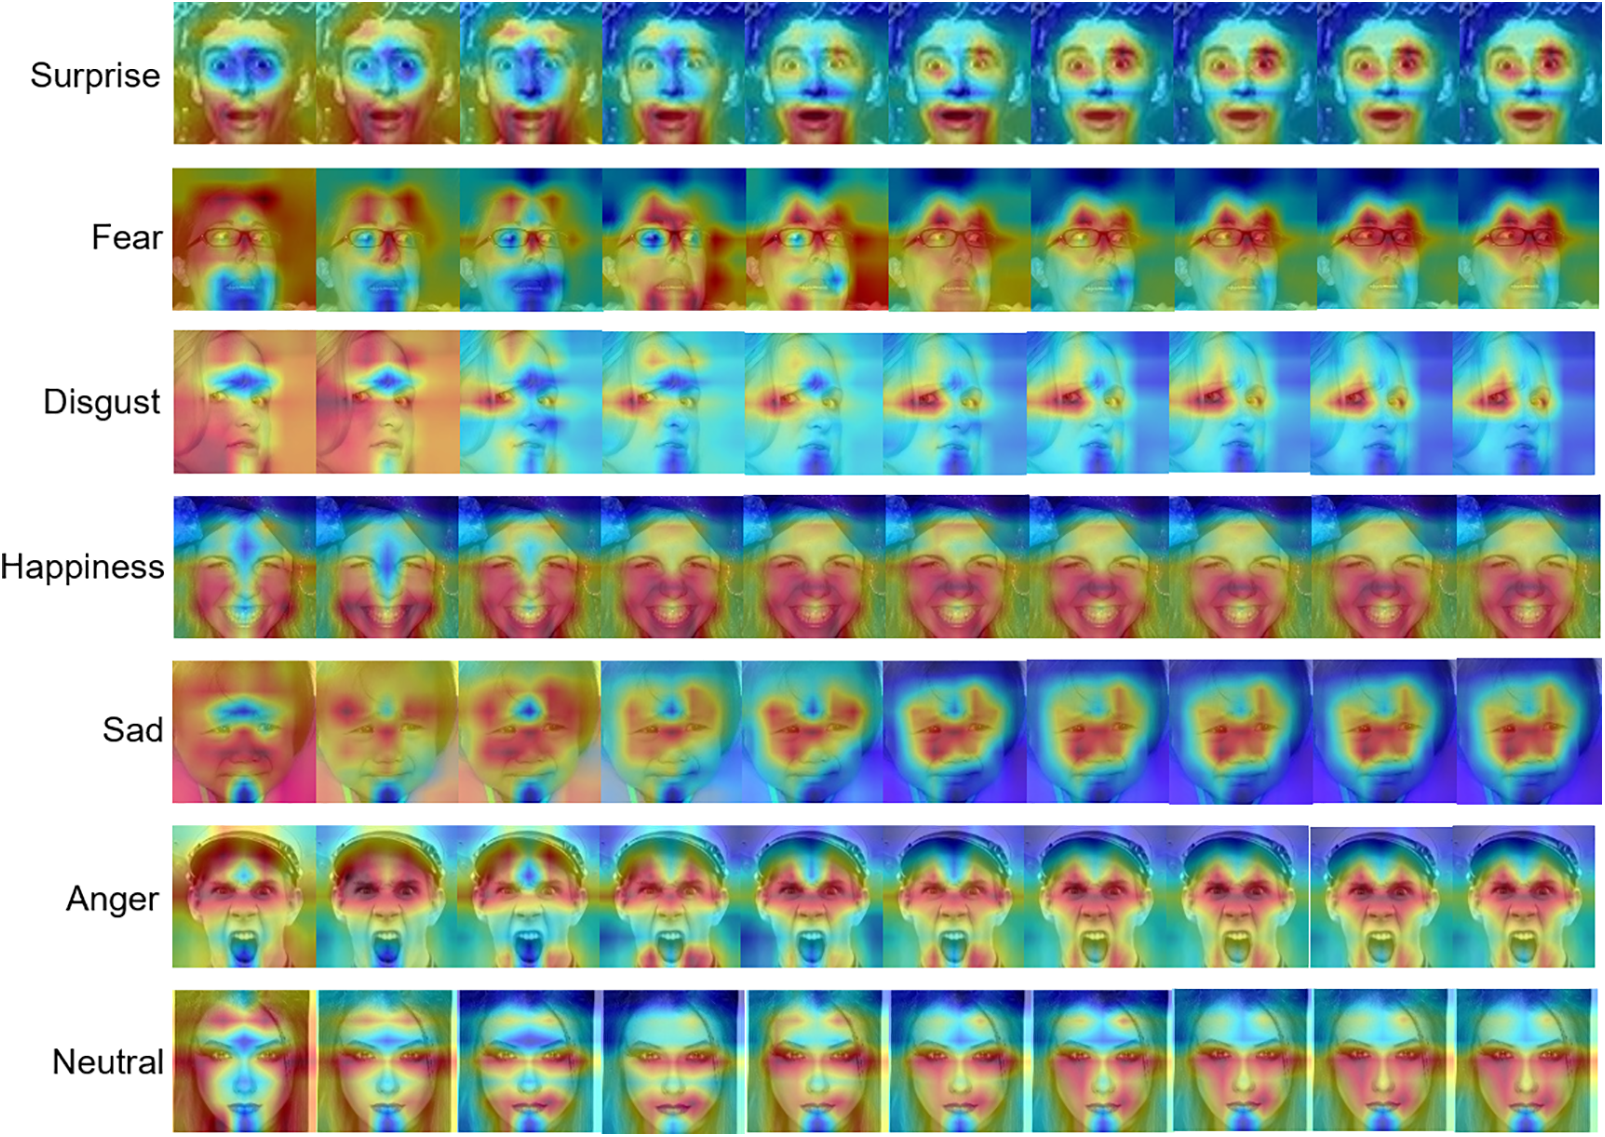
Figure 7: Focus process of the proposed model on various categories
We note that the RAF-DB images (please see the seven lines in this figure) are from the following seven subjects: train_00012, train_01157, train_00031, train_00036, train_00030, train_00070, and train_09764. The usage of their images has been approved. Copyright reference: http://www.whdeng.cn/RAF/model1.html.
Fig. 8 shows the use of Grad CAM [41] to analyze the regions of interest in the sample and verify whether the model has extracted additional feature information from the secondary classes. During training, the model generated attention maps for all classes for each sample. Regions A, B, and C showed the target and nontarget attention regions of the model for sad, surprised, and happy class samples, respectively. The target class referred to the expression category of this sample, whereas the nontarget class referred to other categories besides the original expression category. Results showed that the model maintained consistency in the attention feature map before and after sample flipping for extracting flipping consistency information across various categories. Moreover, the proposed method could effectively extract additional information related to secondary categories from the main categories. The first and second columns showed that the model extracted mouth opening features related to fear from samples marked as sad. Similarly, the third and fourth columns showed that the model extracted mouth opening features related to fear from samples marked as surprised, enabling it to extract feature information related to fear (secondary class) from fear and surprise (primary class) samples and improve the recognition accuracy of secondary classes. Finally, in the fifth and sixth columns, no correlation was observed between the happy and sad categories. This is because the model did not pay attention to the feature information of the sad category for the samples marked as happy in the fifth column, indicating that it negatively impacts the feature learning of the main categories.

Figure 8: Region of focus of the model on target and nontarget categories
We note that the RAF-DB images (please see the six even columns in this figure) are from the following three subjects: train_00025, train_00012, and train_00035, the usage of their images has been approved. Copyright reference: http://www.whdeng.cn/RAF/model1.html.
4.4.1 Weight Coefficients of Loss Function
Fig. 9 conducts ablation experiments on the weight coefficients of two modules on the RAF-DB dataset to obtain the best performance of the RBC and RBF modules on the model, using Swin Transformer [34] as the backbone network. The range of
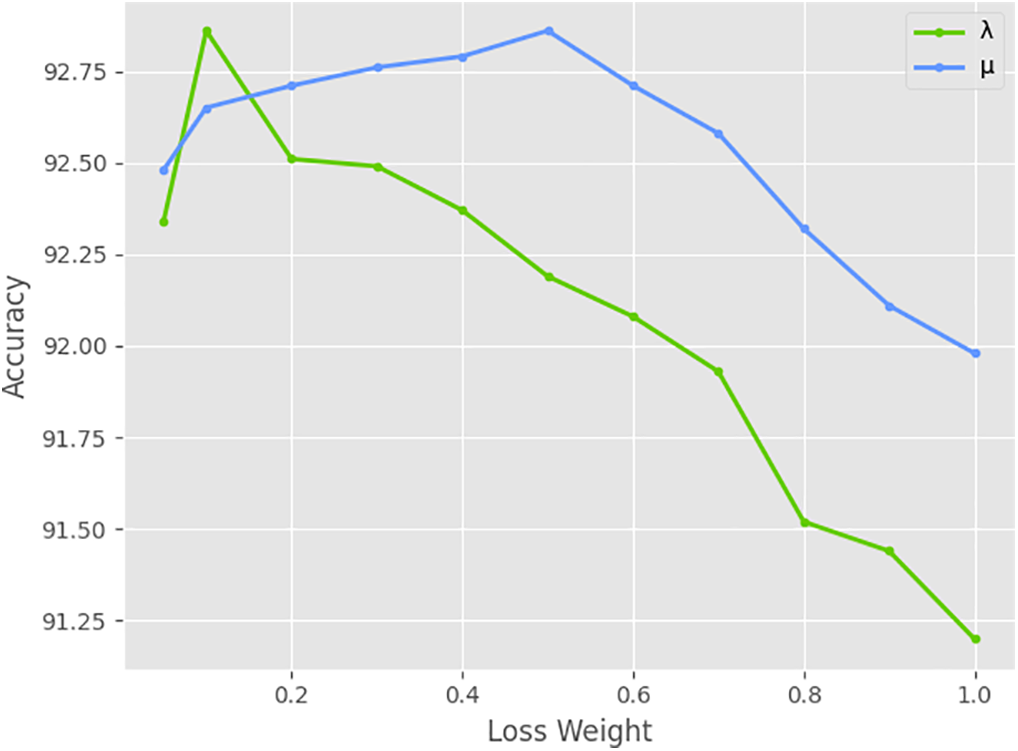
Figure 9: Ablation experiments of RBC and RBF modules on parameters λ and μ
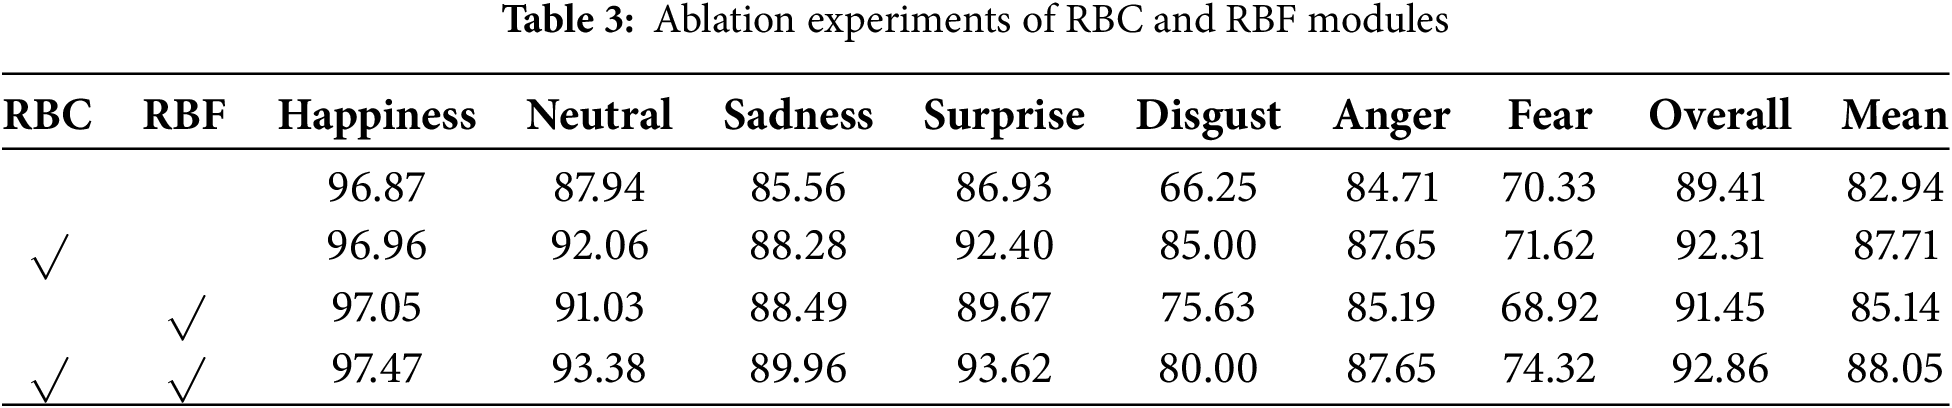
4.4.2 Effectiveness of RBC and RBF Modules
Table 3 shows the ablation experiments of RBC and RBF modules to verify their effectiveness. Using Swin Transformer [34] as a benchmark, RBC and RBF modules were first added separately, and then added simultaneously. The module weight coefficients used their optimal values, as discussed in Section 4.4.1. The experimental results show that the overall accuracy increases by 2.04% and 2.9% respectively when RBF and RBC modules are added separately, and by 3.45% when RBF and RBC modules are added simultaneously. In terms of the average accuracy reflecting unbalanced learning, the average accuracy increased by 4.77% and 2.2% respectively, when RBF and RBC modules were added separately, and by 5.11% when RBF and RBC modules were added simultaneously. These results indicate that both modules can improve the performance on the baseline and can complement each other to achieve optimal performance.
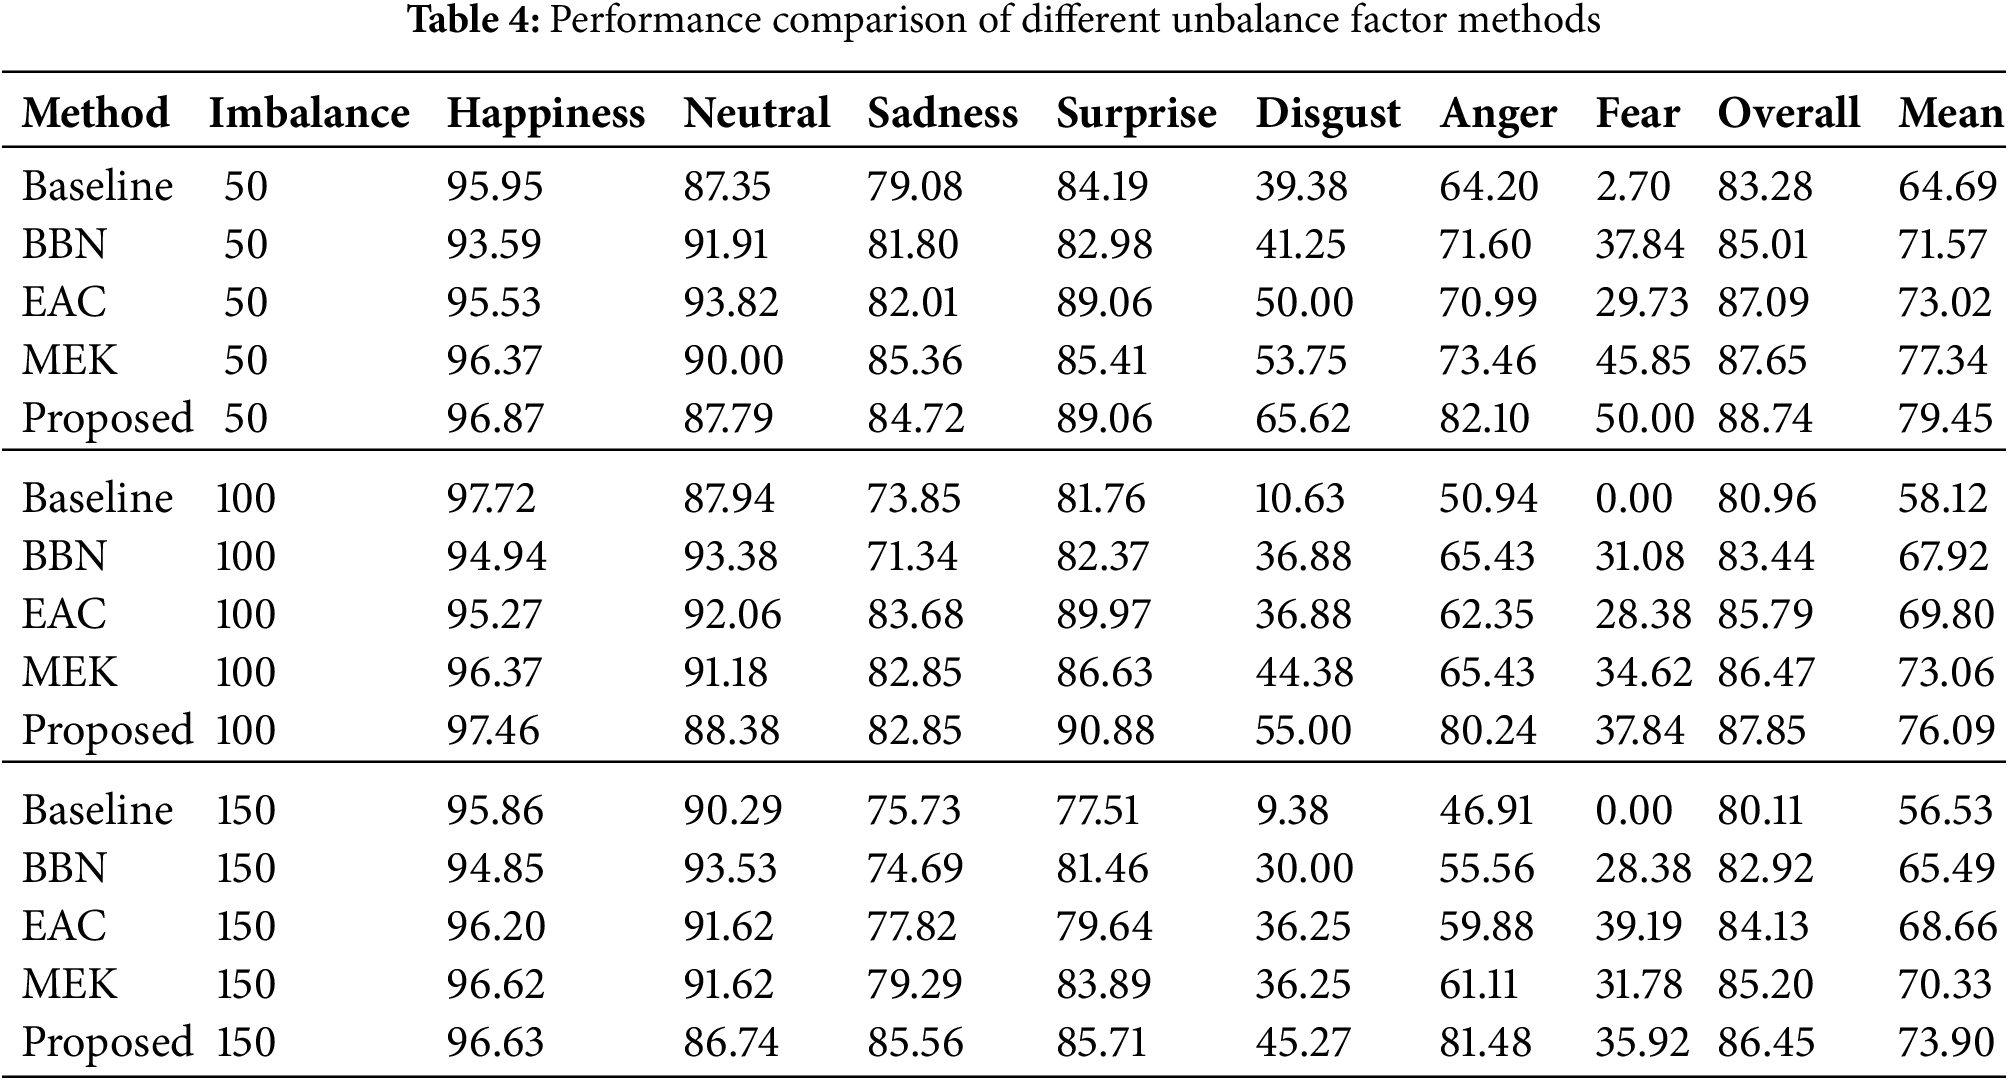
4.5 Different Imbalance Factors
Table 4 shows the performance of the proposed model on different degrees of imbalanced datasets. RAF-DB datasets with different imbalanced factors were constructed [23] by reducing the number of training samples for each class using an exponential function
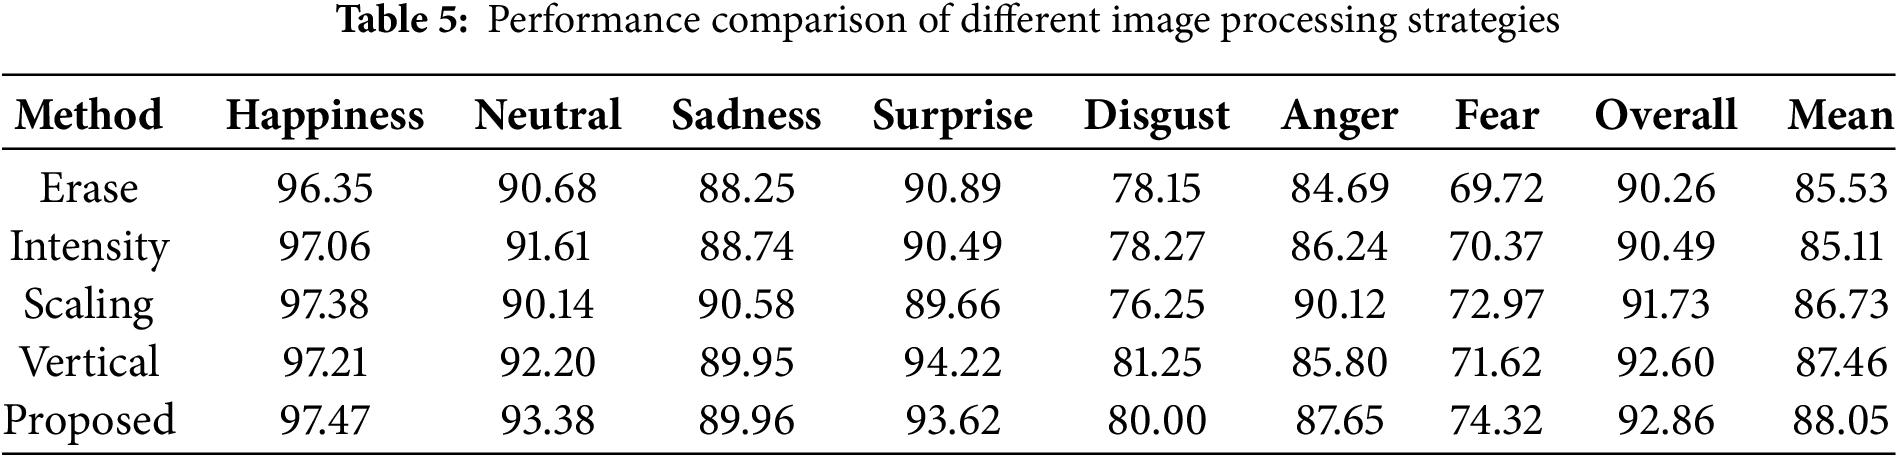
4.6 Image Processing Strategies
Horizontal flipping was performed to ensure the consistency handling of samples in the model architecture. Herein, image processing strategies were analyzed, and their effectiveness in performing horizontal flipping was verified. Experimental image processing involves vertical flipping, downsampling, intensity attenuation, and random erasing. Table 5 shows the performance results of testing whether these processes can outperform horizontal flipping under unbalanced learning. Results showed that the performance of random erasure, intensity attenuation, and downsampling was poor. This was because random erasure increased the robustness of the model by randomly covering a part of the image and removing important features in the image. Intensity attenuation simulated different lighting conditions by reducing the intensity of pixels in the image and decreasing its overall contrast, making certain features blurry and affecting the model’s recognition of subtle features. Moreover, downsampling led to the loss of details in the image and affected model recognition for samples with high-density features. Vertical flipping was performed similarly to the proposed method because it used similar image processing strategies. Moreover, attention consistency was crucial for attention maps, which have two dimensions of height and width, and incorporate spatial information. As flipping is an image processing strategy closely related to space, it can maximize the performance of the proposed model.
4.7 Model Generalization Ability
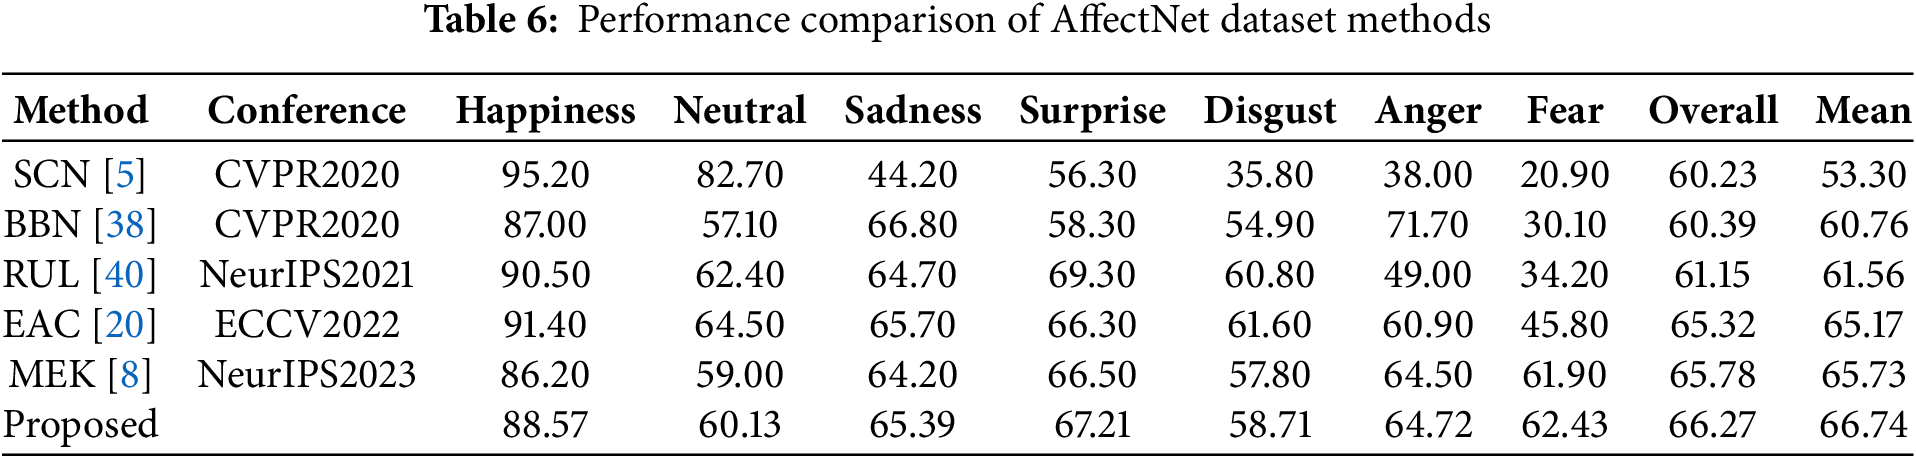
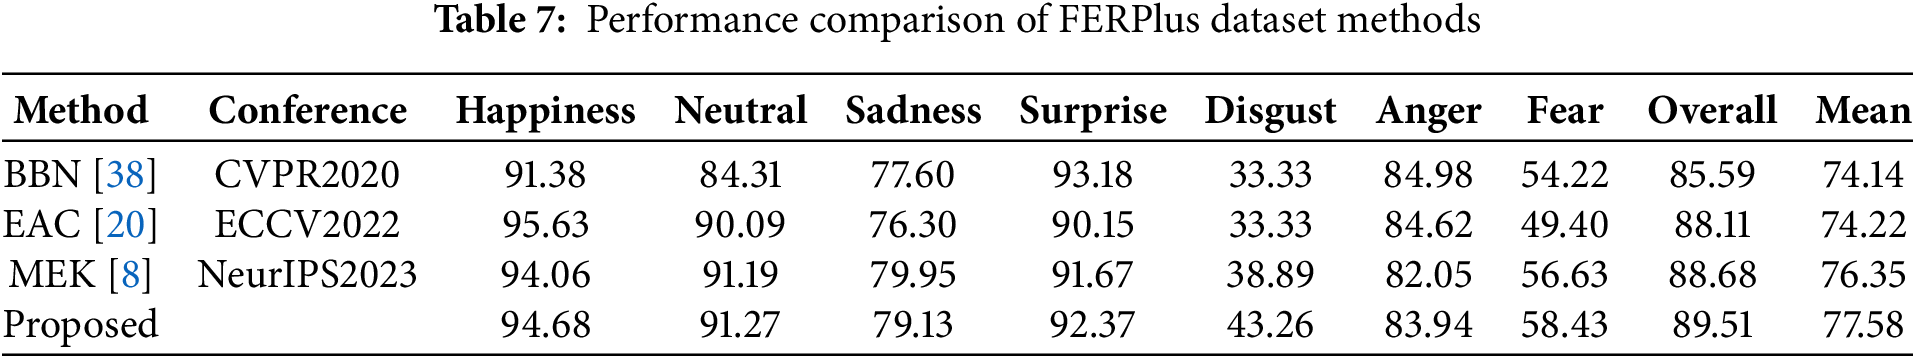
The pretrained ResNet-18 [31] was used as the backbone network to demonstrate the generalization ability of the model on AffectNet [1] and FERPlus [1,2] FER datasets. Tables 6 and 7 show the experimental results of the model on the AffectNet and FERPlus datasets. Results showed that compared with mainstream algorithms, the overall and average recognition accuracies of the proposed model on the AffectNet dataset improved by 0.49% and 1.01%, respectively, and the recognition rates on secondary class fear and disgust improved by 0.53% and 0.91%, respectively. The overall and average recognition accuracies of the model on the FERPlus dataset improved by 0.83% and 1.23%, respectively, and the recognition rates on secondary classes fear and disgust improved by 1.80% and 4.37%, respectively.
In this study, we focused on improving the imbalanced learning problem in FER using the static image expression recognition method. Current imbalanced learning methods often sacrifice the recognition rate of primary classes to improve the recognition performance of secondary classes. However, the proposed model extracts additional feature information from the samples of secondary classes to address this issue. The performance of the proposed model was compared with the existing methods. Results revealed that during model training, the recognition rate of secondary classes was improved while maintaining a high recognition rate for the primary class. Experiments performed on publicly available FER datasets demonstrated that compared with mainstream algorithms such as SCN, BBN, RUL, EAC, and MEK, the proposed method effectively improved the overall and average recognition accuracies on the RAF-DB, AffectNet, and FERPlus datasets. The analysis and visualization of the experimental results demonstrated the effectiveness of the proposed method in imbalanced learning. In the future, we plan to explore new methods for designing rebalancing weights and optimizing loss functions. We also aim to explore more refined expression recognition methods to address imbalanced phenomena in facial expression datasets. Additionally, we have planned to investigate the effectiveness of different data preprocessing methods for identifying imbalanced facial expression datasets.
Acknowledgement: Not applicable.
Funding Statement: The authors would like to thank support from the National Natural Science Foundation of China (Grant Number 62477023).
Author Contributions: Conceptualization: Xiaoliang Zhu, Hao Chen; Methodology: Xiaoliang Zhu, Hao Chen, Liang Zhao; Formal analysis and investigation: Liang Zhao, Zhicheng Dai; Software: Hao Chen, Xin Yang; Writing—original draft preparation: Hao Chen; Writing—review and editing: Xiaoliang Zhu, Liang Zhao; Funding acquisition: Xiaoliang Zhu; Resources: Hao Chen; Supervision: Xiaoliang Zhu, Liang Zhao. All authors reviewed the results and approved the final version of the manuscript.
Availability of Data and Materials: Three open access datasets (AffectNet, RAF-DB, FERPlus) are used in our study. We have obtained authorization for them. Their links are as follows: http://www.whdeng.cn/RAF/model1.html; http://mohammadmahoor.com/pages/databases/affectnet/; https://github.com/Microsoft/FERPlus# (accessed on 8 July 2025).
Ethics Approval: This study does not contain any studies with human or animal subjects performed by any of the authors.
Conflicts of Interest: The authors declare no conflicts of interest to report regarding the present study.
References
1. Mollahosseini A, Hasani B, Mahoor MH. AffectNet: a database for facial expression, valence, and arousal computing in the wild. IEEE Trans Affective Comput. 2019;10(1):18–31. doi:10.1109/taffc.2017.2740923. [Google Scholar] [CrossRef]
2. Goodfellow IJ, Erhan D, Luc Carrier PL, Courville A, Mirza M, Hamner B, et al. Challenges in representation learning: a report on three machine learning contests. Neural Networks. 2015;64(1):59–63. doi:10.1016/j.neunet.2014.09.005. [Google Scholar] [PubMed] [CrossRef]
3. Psaroudakis A, Kollias D. MixAugment & mixup: augmentation methods for facial expression recognition. In: Proceedings of the 2022 IEEE/CVF Conference on Computer Vision and Pattern Recognition Workshops (CVPRW). New Orleans, LA, USA; 2022. p. 2366–74. [Google Scholar]
4. Wang K, Peng X, Yang J, Meng D, Qiao Y. Region attention networks for pose and occlusion robust facial expression recognition. IEEE Trans Image Process. 2020;29:4057–69. doi:10.1109/tip.2019.2956143. [Google Scholar] [PubMed] [CrossRef]
5. Wang K, Peng X, Yang J, Lu S, Qiao Y. Suppressing uncertainties for large-scale facial expression recognition. In: Proceedings of the 2020 IEEE/CVF Conference on Computer Vision and Pattern Recognition (CVPR). Seattle, Washington, DC, USA; 2020. p. 6896–905. [Google Scholar]
6. Lukov T, Zhao N, Lee GH, Lim SN. Teaching with soft label smoothing for mitigating noisy labels in facial expressions. In: Proceedings of the 17th European Conference on Computer Vision (ECCV). Tel Aviv, Israel; 2022. p. 648–65. [Google Scholar]
7. Li S, Deng W. Deep facial expression recognition: a survey. IEEE Trans Affective Comput. 2022;13(3):1195–215. doi:10.1109/taffc.2020.2981446. [Google Scholar] [CrossRef]
8. Zhang Y, Li Y, Liu X, Deng W. Leave no stone unturned: mine extra knowledge for imbalanced facial expression recognition. In: Proceedings of the Advances in Neural Information Processing Systems 36: Annual Conference on Neural Information Processing Systems (NIPS). New Orleans, LA, USA; 2023. [Google Scholar]
9. Lin T-Y, Goyal P, Girshick R, He K, Dollar P. Focal loss for dense object detection. IEEE Trans Pattern Anal Mach Intell. 2020;42(2):318–27. [Google Scholar] [PubMed]
10. Li H, Wang N, Yang X, Gao X. CRS-CONT: a well-trained general encoder for facial expression analysis. IEEE Trans Image Process. 2022;31:4637–50. doi:10.1109/tip.2022.3186536. [Google Scholar] [PubMed] [CrossRef]
11. Zeng D, Lin Z, Yan X, Liu Y, Wang F, Tang B. Face2Exp: combating data biases for facial expression recognition. In: Proceedings of the 2022 IEEE/CVF Conference on Computer Vision and Pattern Recognition (CVPR). New Orleans, LA, USA; 2022. p. 20259–68. [Google Scholar]
12. Li H, Wang N, Yang X, Wang X, Gao X. Towards semi-supervised deep facial expression recognition with an adaptive confidence margin. In: Proceedings of the 2022 IEEE/CVF Conference on Computer Vision and Pattern Recognition (CVPR). New Orleans, LA, USA; 2022. p. 4156–65. [Google Scholar]
13. Li H, Wang N, Yang X, Wang X, Gao X. Unconstrained facial expression recognition with no-reference de-elements learning. IEEE Trans Affective Comput. 2024;15(1):173–85. doi:10.1109/taffc.2023.3263886. [Google Scholar] [CrossRef]
14. Li S, Deng W, Du J. Reliable crowdsourcing and deep locality-preserving learning for expression recognition in the wild. In: Proceedings of the 2017 IEEE Conference on Computer Vision and Pattern Recognition (CVPR). Honolulu, HI, USA; 2017. p. 2584–93. [Google Scholar]
15. Lyons M, Akamatsu S, Kamachi M, Gyoba J. Coding facial expressions with gabor wavelets. In: Proceedings of the Third IEEE International Conference on Automatic Face and Gesture Recognition (FG). Nara, Japan; 1998. p. 200–5. [Google Scholar]
16. Kanade T, Cohn JF, Yingli T. Comprehensive database for facial expression analysis. In: Proceedings of the the 4th IEEE International Conference on Automatic Face and Gesture Recognition (FG). Grenoble, France; 2000. p. 46–53. [Google Scholar]
17. Gera D, Balasubramanian S. Landmark guidance independent spatio-channel attention and complementary context information based facial expression recognition. Pattern Recognit Lett. 2021;145(5):58–66. doi:10.1016/j.patrec.2021.01.029. [Google Scholar] [CrossRef]
18. Gera D, Raj Kumar BV, Badveeti NSK, Balasubramanian S. Dynamic adaptive threshold based learning for noisy annotations robust facial expression recognition. Multimed Tools Appl. 2024;83(16):49537–66. doi:10.1007/s11042-023-17510-3. [Google Scholar] [CrossRef]
19. She J, Hu Y, Shi H, Wang J, Shen Q, Mei T. Dive into ambiguity: latent distribution mining and pairwise uncertainty estimation for facial expression recognition. In: Proceedings of the 2021 IEEE/CVF Conference on Computer Vision and Pattern Recognition (CVPR). Nashville, TN, USA; 2021. p. 6244–53. [Google Scholar]
20. Zhang Y, Wang C, Ling X, Deng W. Learn from all: erasing attention consistency for noisy label facial expression recognition. In: Proceedings of the 17th European Conference on Computer Vision (ECCV). Tel Aviv, Israel; 2022. p. 418–34. [Google Scholar]
21. Wang X, Lian L, Miao Z, Liu Z, Yu SX. Long-tailed recognition by routing diverse distribution-aware experts. In: Proceedings of the 9th International Conference on Learning Representations (ICLR); 2021 May 3–7; Virtual Event, Austria. [Google Scholar]
22. Zhang Y, Hooi B, Hong L, Feng J. Test-agnostic long-tailed recognition by test-time aggregating diverse experts with self-supervision. arXiv:2107.09249. 2022. [Google Scholar]
23. Cui Y, Jia M, Lin T-Y, Song Y, Belongie S. Class-balanced loss based on effective number of samples. In: Proceedings of the 2019 IEEE/CVF Conference on Computer Vision and Pattern Recognition (CVPR). Long Beach, CA, USA; 2019. p. 9260–9. [Google Scholar]
24. Tan J, Li B, Lu X, Yao Y, Yu F, He T, et al. The equalization losses: gradient-driven training for long-tailed object recognition. IEEE Trans Pattern Anal Mach Intell. 2023;45(11):13876–92. [Google Scholar] [PubMed]
25. Mahajan D, Girshick R, Ramanathan V, He K, Paluri M, Li Y, et al. Exploring the limits of weakly supervised pretraining. In: Proceedings of the 15th European Conference on Computer Vision (ECCV). Munich, Germany; 2018. Vol. 2, p. 185–201. [Google Scholar]
26. Shen L, Lin Z, Huang Q. Relay backpropagation for effective learning of deep convolutional neural networks. In: Proceedings of the 16th European Conference on Computer Vision (ECCV); 2016. Vol. 7, p. 467–82. [Google Scholar]
27. Zhou B, Khosla A, Lapedriza A, Oliva A, Torralba A. Learning deep features for discriminative localization. In: Proceedings of the 2016 IEEE Conference on Computer Vision and Pattern Recognition (CVPR). Las Vegas, NV, USA; 2016. p. 2921–9. [Google Scholar]
28. Chou H-P, Chang S-C, Pan J-Y, Wei W, Juan D-C. Remix: rebalanced mixup. In: Proceedings of the 16th ECCV Workshops. Glasgow, UK; 2020, Vol. 6, p. 95–110. [Google Scholar]
29. Guo H, Zheng K, Fan X, Yu H, Wang S. Visual attention consistency under image transforms for multi-label image classification. In: Proceedings of the 2019 IEEE/CVF Conference on Computer Vision and Pattern Recognition (CVPR). Long Beach, CA, USA; 2019. p. 729–39. [Google Scholar]
30. Barsoum E, Zhang C, Ferrer CC, Zhang Z. Training deep networks for facial expression recognition with crowd-sourced label distribution; In: Proceedings of the 18th ACM International Conference on Multimodal Interaction (ICMI). Tokyo, Japan; 2016. p. 279–83. [Google Scholar]
31. He K, Zhang X, Ren S, Sun J. Deep residual learning for image recognition. In: Proceedings of the 2016 IEEE Conference on Computer Vision and Pattern Recognition; 2016 Jun 27–30; Las Vegas, NV, USA: CVPR. p. 770–8. [Google Scholar]
32. Guo Y, Zhang L, Hu Y, He X, Gao J. MS-Celeb-1M: a dataset and benchmark for large-scale face recognition. Computer vision. In: Proceedings of the 14th European Conference on Computer Vision (ECCV). Amsterdam, the Netherlands; 2016. Vol. 3, p. 87–102. [Google Scholar]
33. Howard AG, Zhu M, Chen B, Kalenichenko D, Wang W, Weyand T, et al. MobileNets: efficient convolutional neural networks for mobile vision applications. arXiv:1704.04861. 2017. [Google Scholar]
34. Liu Z, Lin Y, Cao Y, Hu H, Wei Y, Zhang Z, et al. Swin transformer: hierarchical vision transformer using shifted windows. In: Proceedings of the 2021 IEEE/CVF International Conference on Computer Vision (ICCV). Montreal, QC, Canada; 2021. p. 9992–10002. [Google Scholar]
35. Zhang K, Zhang Z, Li Z, Qiao Y. Joint face detection and alignment using multitask cascaded convolutional networks. IEEE Signal Proces Lett. 2016;23(10):1499–503. doi:10.1109/lsp.2016.2603342. [Google Scholar] [CrossRef]
36. Kingma DP, Adam J.B. BA. A method for stochastic optimization. In: Proceedings of the 3rd International Conference on Learning Representations (ICLR). San Diego, CA, USA; 2015. [Google Scholar]
37. Li Z, Arora S. An exponential learning rate schedule for deep learning. In: Proceedings of the 8th International Conference on Learning Representations (ICLR). Addis Ababa, Ethiopia; 2020. [Google Scholar]
38. Zhou B, Cui Q, Wei X-S, Chen Z-M. BBN: bilateral-branch network with cumulative learning for long-tailed visual recognition. In: Proceedings of the 2020 IEEE/CVF Conference on Computer Vision and Pattern Recognition (CVPR). Seattle, Washington, DC, USA; 2020. p. 9716–25. [Google Scholar]
39. Jiang J, Deng W. Boosting facial expression recognition by A semi-supervised progressive teacher. IEEE Trans Affective Comput. 2023;14(3):2402–14. doi:10.1109/taffc.2021.3131621. [Google Scholar] [CrossRef]
40. Zhang Y, Wang C. Deng W Relative uncertainty learning for facial expression recognition. Proc Neural Inf Process Syst (NIPS). 2021;17627:7616. [Google Scholar]
41. Selvaraju RR, Cogswell M, Das A, Vedantam R, Parikh D, Batra D. Grad-CAM: visual explanations from deep networks via gradient-based localization. In: Proceedings of the 2017 IEEE International Conference on Computer Vision (ICCV). Venice, Italy; 2017. p. 618–26. [Google Scholar]
Cite This Article
 Copyright © 2025 The Author(s). Published by Tech Science Press.
This work is licensed under a Creative Commons Attribution 4.0 International License , which permits unrestricted use, distribution, and reproduction in any medium, provided the original work is properly cited.
 Downloads
 Citation Tools