
 Submit a Paper
 Propose a Special lssue
 Open Access
ARTICLE

VRCL: A Discrimination Detection Method for Multilingual and Multimodal Information
1 Department of Cyberspace Security, Beijing Electronic Science and Technology Institute, Beijing, 100070, China
2 Department of Information and Cybersecurity, The State Information Center, Beijing, 100045, China
* Corresponding Author: Meijiao Li. Email:
Computers, Materials & Continua 2025, 85(1), 1019-1035. https://doi.org/10.32604/cmc.2025.066532
Received 10 April 2025; Accepted 23 June 2025; Issue published 29 August 2025
 View Full Text
 Download PDF
Abstract
With the rapid growth of the Internet and social media, information is widely disseminated in multimodal forms, such as text and images, where discriminatory content can manifest in various ways. Discrimination detection techniques for multilingual and multimodal data can identify potential discriminatory behavior and help foster a more equitable and inclusive cyberspace. However, existing methods often struggle in complex contexts and multilingual environments. To address these challenges, this paper proposes an innovative detection method, using image and multilingual text encoders to separately extract features from different modalities. It continuously updates a historical feature memory bank, aggregates the Top-K most similar samples, and utilizes a Gated Recurrent Unit (GRU) to integrate current and historical features, generating enhanced feature representations with stronger semantic expressiveness to improve the model’s ability to capture discriminatory signals. Experimental results demonstrate that the proposed method exhibits superior discriminative power and detection accuracy in multilingual and multimodal contexts, offering a reliable and effective solution for identifying discriminatory content.Keywords
Discriminatory content refers to negative attacks or expressions of prejudice targeting an individual or group based on identity characteristics such as race, gender, religion, and language. With the rise of social media and the global internet, discriminatory content has evolved beyond textual forms, exhibiting complex multimodal and multilingual features, including the integration of images and text. This presents a significant challenge to the harmony and social equality of online communities.
Traditional detection methods primarily rely on keyword matching and user metadata analysis [1]. The former is susceptible to vocabulary variations and requires frequent updates, while the latter may introduce biases. In addition, rule-based detection methods capture potential discriminatory expressions by establishing syntactic or semantic rules [2]. However, this approach still has limitations in identifying implicit discrimination. Sentiment analysis, as a traditional method, evaluates the presence of negative or hostile emotions in text by analyzing emotional tendencies but struggles with sarcasm or indirect discriminatory content [3]. Meanwhile, some studies have explored emotion recognition in images; for example, Bhavana et al. [4] proposed a convolutional neural network (CNN)-based method that leverages CNNs’ hierarchical feature learning to extract emotional features from raw images, demonstrating CNNs’ strong ability to understand image content. Social network analysis identifies the spread of discriminatory content by monitoring user interactions and information propagation patterns, which is especially effective in capturing group-based discriminatory behavior. Behavioral analysis methods enhance detection accuracy by predicting potential discriminatory actions through the tracking of user interactions and historical behavior [5]. As technology progresses, machine learning-based approaches, such as Naive Bayes [6] and Support Vector Machines (SVM) [7], have shown promise in detecting discriminatory content.
Recently, the use of deep learning techniques has further propelled advancements in the field. For instance, Rodríguez-Sánchez [8] applied Bidirectional Long Short-Term Memory (Bi-LSTM) and Multilingual BERT (mBERT) models to enhance classification performance on multilingual datasets. Despite these advancements, existing methods remain limited, primarily addressing text-image interactions within single-language environments and neglecting combined multimodal and multilingual scenarios. As shown in Fig. 1, the same image content exhibits significant differences in detection results in five different countries. This variation indicates that identical multimodal content can be perceived as offensive and discriminatory in certain cultural contexts while being deemed acceptable in others. Such cross-cultural differences underscore the complexities and challenges inherent in detecting discriminatory content. Therefore, automated detection of complex multimodal and multilingual discriminatory content has become the focus of current research.
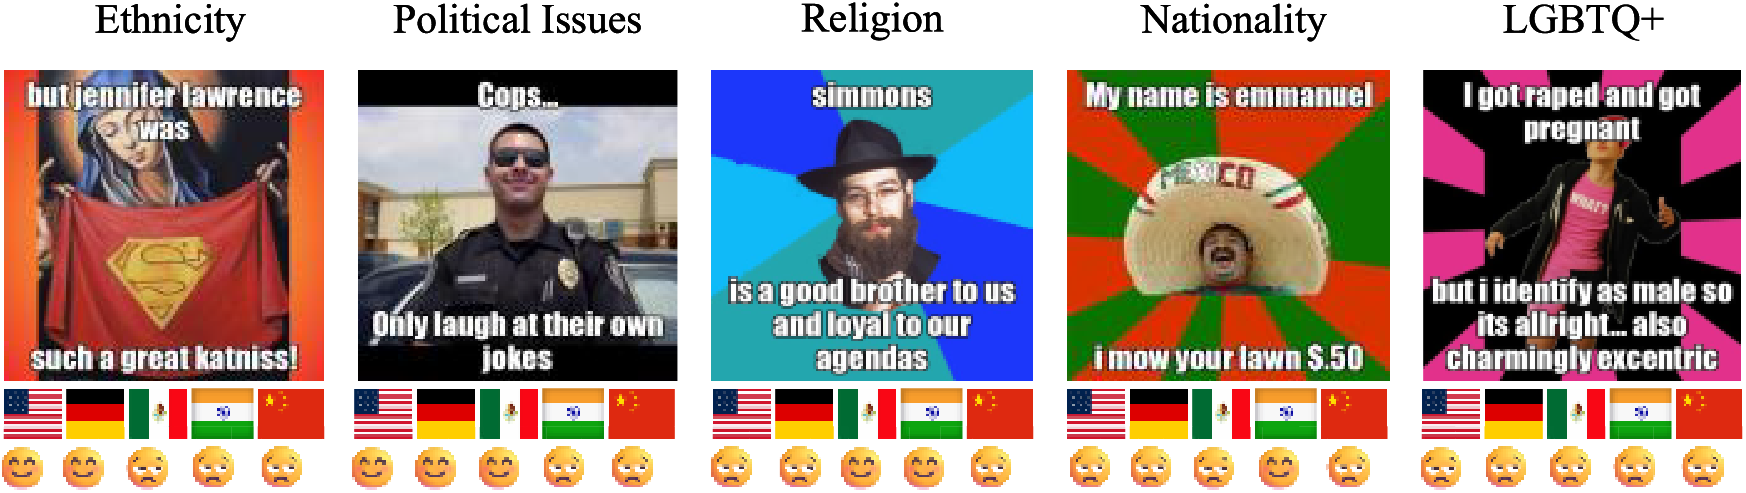
Figure 1: Detection results for five image contents vary significantly across five countries: the United States, Germany, Mexico, India, and China
To address these challenges, this paper proposes a multimodal, multilingual method for discriminatory content detection, aimed at capturing cross-modal relationships between images and text while accounting for language-specific discrimination characteristics in multilingual contexts. The key contributions are as follows:
• Integration of Cross-lingual Language RoBERTa (XLM-R) [9] and Vision Transformer (ViT) Models [10]: The XLM-R model is used for multilingual text feature extraction, while the ViT model extracts image features. These features are then precisely aligned and fused using a cross-attention mechanism, effectively capturing the deep semantic relationships between image and text.
• Dynamic Memory-based Discriminatory Signal Detection: This method dynamically updates a historical feature memory bank, aggregates the top-K similar samples, and generates a fused historical feature representation. A Gated Recurrent Unit (GRU) [11] module integrates both historical and current features, generating enhanced features with stronger semantic expressiveness.
• Comprehensive Validation: Experiments conducted on multimodal multilingual datasets demonstrate that the proposed method surpasses existing models in precision, recall, and F1 score, highlighting its effectiveness in discriminatory content detection tasks.
The rest of this paper is organized into six sections. Section 2 briefly reviews related work, including multimodal discrimination detection and multilingual discrimination detection. Section 3 introduces the VRCL model, including the Multilingual and Multimodal Feature Extraction Module, the Multimodal Feature Alignment and Fusion Module, the Label-Guided Contrastive Learning Module, and the Dynamic Memory-based Discrimination Detection Module. Section 4 presents the experimental datasets and baseline models. Section 5 analyzes the experimental results. Section 6 provides visualization of the experimental results. Finally, Section 7 concludes the paper.
2.1 Multimodal Discrimination Detection
Multimodal discrimination detection integrates image and text information to comprehensively identify discriminatory content. It addresses the limitations of single-modality approaches, which often fail to capture the complexity of discriminatory information. For instance, Kiela [12] proposed an early fusion method combining image and text modalities to detect discriminatory internet memes. Ma [13] utilized a self-supervised label generation module alongside Bidirectional Encoder Representations from Transformers (BERT) and Residual Network (ResNet) models to enhance feature learning without requiring additional annotations. Similarly, Chen and Pan [14] implemented the OSCAR+ model with Optical Character Recognition (OCR) technology to improve detection performance.
Nie et al. [15] proposed MAGIC, a multimodal dialogue system that interprets user intent within multimodal contexts and dynamically determines the response type and modality. This context-aware and modality-adaptive approach provides useful inspiration for improving multimodal discrimination detection in complex semantic environments.
Furthermore, models such as HateCLIPper [16] and InterCLIP-MEP [17] explored various modality interactions in Contrastive Language-Image Pre-training (CLIP)’s visual and linguistic representations to address the challenges of hate meme detection. Recent advances in multimodal pre-trained models, including Vision-and-Language BERT (ViLBERT) [18], VisualBERT [19] and Universal Image-Text Representation (UNITER) [20], have employed Transformer architectures to enhance cross-modal interactions, significantly boosting task performance. Nevertheless, challenges persist, such as modality heterogeneity, noise in training data, and the diverse manifestations of discriminatory content. Moreover, the lack of fine-grained annotations in existing datasets hinders models’ ability to process metaphorical and contextually complex discrimination.
2.2 Multilingual Discrimination Detection
Multilingual discrimination detection focuses on identifying discriminatory content across diverse languages and cultural contexts. Multilingual pre-trained models, such as mBERT, XLM-R, and multilingual Text-to-Text Transfer Transformer (mT5) [21], offer an effective solution for cross-lingual detection by leveraging large-scale corpora to capture both commonalities and differences between languages. However, these models still exhibit limited generalization capabilities, particularly in low-resource languages and implicit discrimination detection, due to variations in linguistic expression and cultural context. Montariol [22] enhanced the models’ ability to transfer across languages by introducing auxiliary tasks like sentiment analysis and named entity recognition. However, semantic differences remain a significant challenge. Röttger [23] introduced the MULTILINGUAL HATCHECK framework, which covers 10 languages and highlights the complexity of cross-cultural applications through 36,582 comparison cases, offering a more comprehensive perspective on multilingual discrimination detection.
This section provides a comprehensive overview of the proposed discrimination detection method. The structural framework of the proposed method is illustrated in Fig. 2.
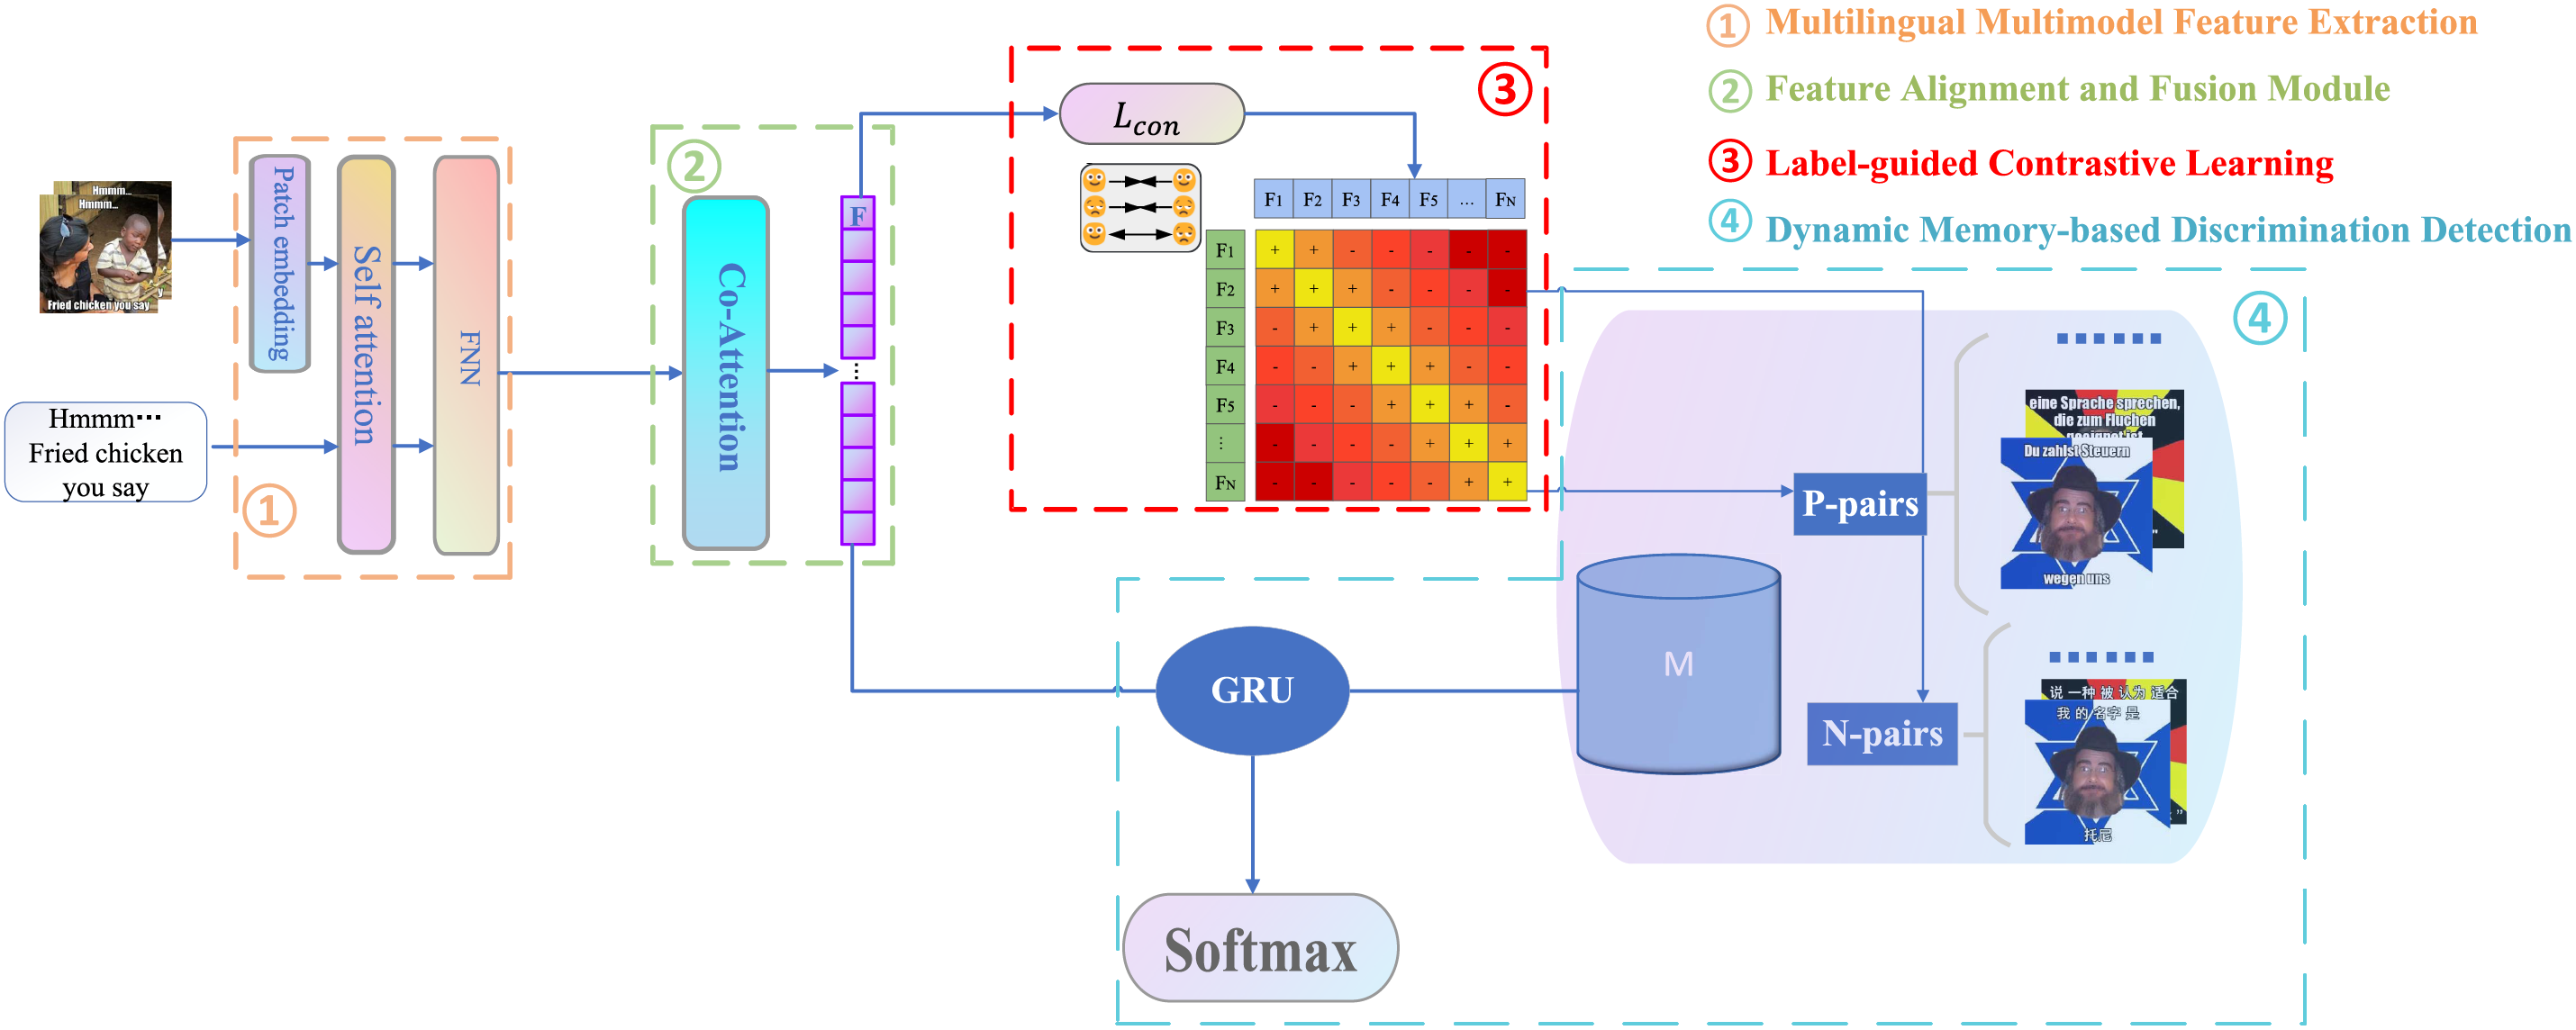
Figure 2: Structural diagram for multilingual and multimodal discrimination detection
3.1 Multilingual and Multimodal Feature Extraction Module
To enhance the cross-lingual generalization of CLIP, we replace its original text encoder with XLM-R, a multilingual pre-trained model supporting over 100 languages. Built on RoBERTa, XLM-R effectively captures multilingual semantics and performs well in low-resource settings, making it suitable for this task. Given a batch of image-text pairs
where
For visual encoding, we adopt the original Vision Transformer (ViT) backbone from CLIP. ViT splits images into fixed-size patches and applies Transformer layers to capture global semantics, outperforming CNN-based models such as ResNet and ConvNeXT in vision and multimodal tasks. The resulting global image feature is denoted as
The above process separately extracts image and multilingual text features, laying the foundation for the subsequent feature alignment and fusion of text and image modalities.
3.2 Multimodal Feature Alignment and Fusion Module
In order to solve the difference in dimension between image and text features, a linear transformation operation is used to map the two modal features into a unified feature space, as shown in Fig. 3. The specific form of the transformation is given in Eq. (3).
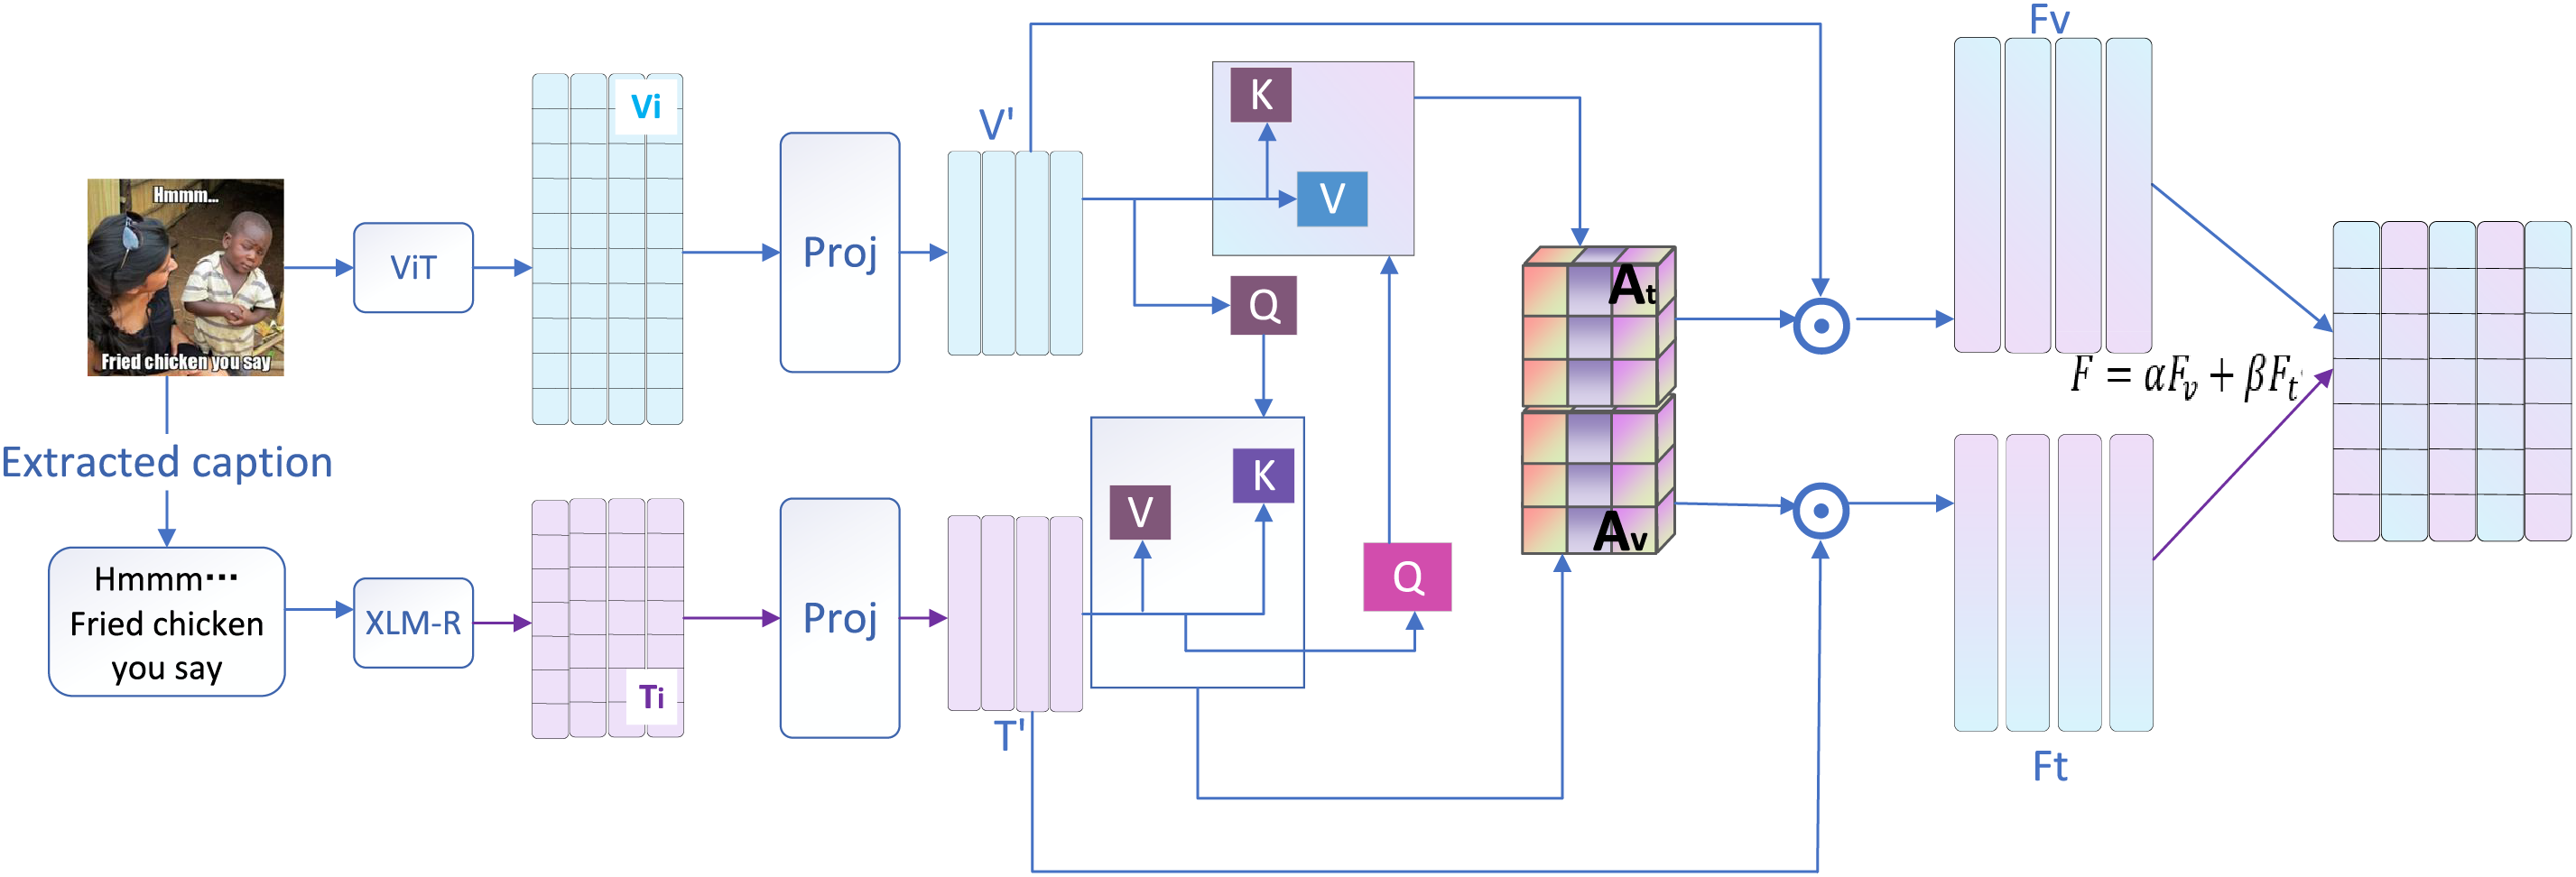
Figure 3: The process of aligning and fusing image and text features. The image and text features are mapped by projection linear transformation, and unified into the same feature space to obtain V′ and T′. The cross-attention mechanism calculates the attention weights of the image guiding the text (
where
After completing the feature dimension alignment according to Eq. (4), a cross-attention mechanism is utilized to achieve effective interaction between image and text features. Specifically, image feature V′ is used as Query and text feature T′ is used as Key and Value. By calculating the attention weight
The attention weights for images guided by text are computed as shown in Eq. (5):
Calculation of fused image and text features is given in Eq. (6):
In order to further refine the fused representation, a weighted summation integrates the image and text features into the final multimodal representation F. Learnable weighting coefficients
This feature alignment and fusion strategy effectively mitigates the challenges posed by dimensional differences and insufficient cross-modal interactions in multilingual multimodal discrimination detection tasks.
3.3 Label-Guided Contrastive Learning Module
Given a batch of image-text pairs
3.3.1 Definition of Positive and Negative Sample Pairs
Positive and negative sample pairs in contrastive learning are defined based on their labels:
• Positive sample pairs: Two samples
• Negative sample pairs: Two samples
3.3.2 Contrastive Learning Loss Function
In the contrastive learning framework, the model enhances the expression capability of multimodal features by maximizing the similarity of positive sample pairs and minimizing the similarity of negative sample pairs, significantly improving the model’s performance in distinguishing between discriminatory and non-discriminatory samples. This method utilizes the following contrastive learning loss function, as defined in Eq. (8):
where
3.4 Dynamic Memory-Based Discrimination Detection Module
The complex discrimination signal detection process based on the dynamic memory mechanism is shown in Fig. 4. This module is based on the fused multimodal features obtained from the multimodal feature alignment and fusion module. By constructing a memory bank that stores the feature representations of historical samples along with their label information, it enables similarity retrieval and similarity-weighted aggregation between the current sample and historical samples. Specifically, the memory bank M storing historical samples is continuously updated. Cosine similarity measures the similarity between the current sample
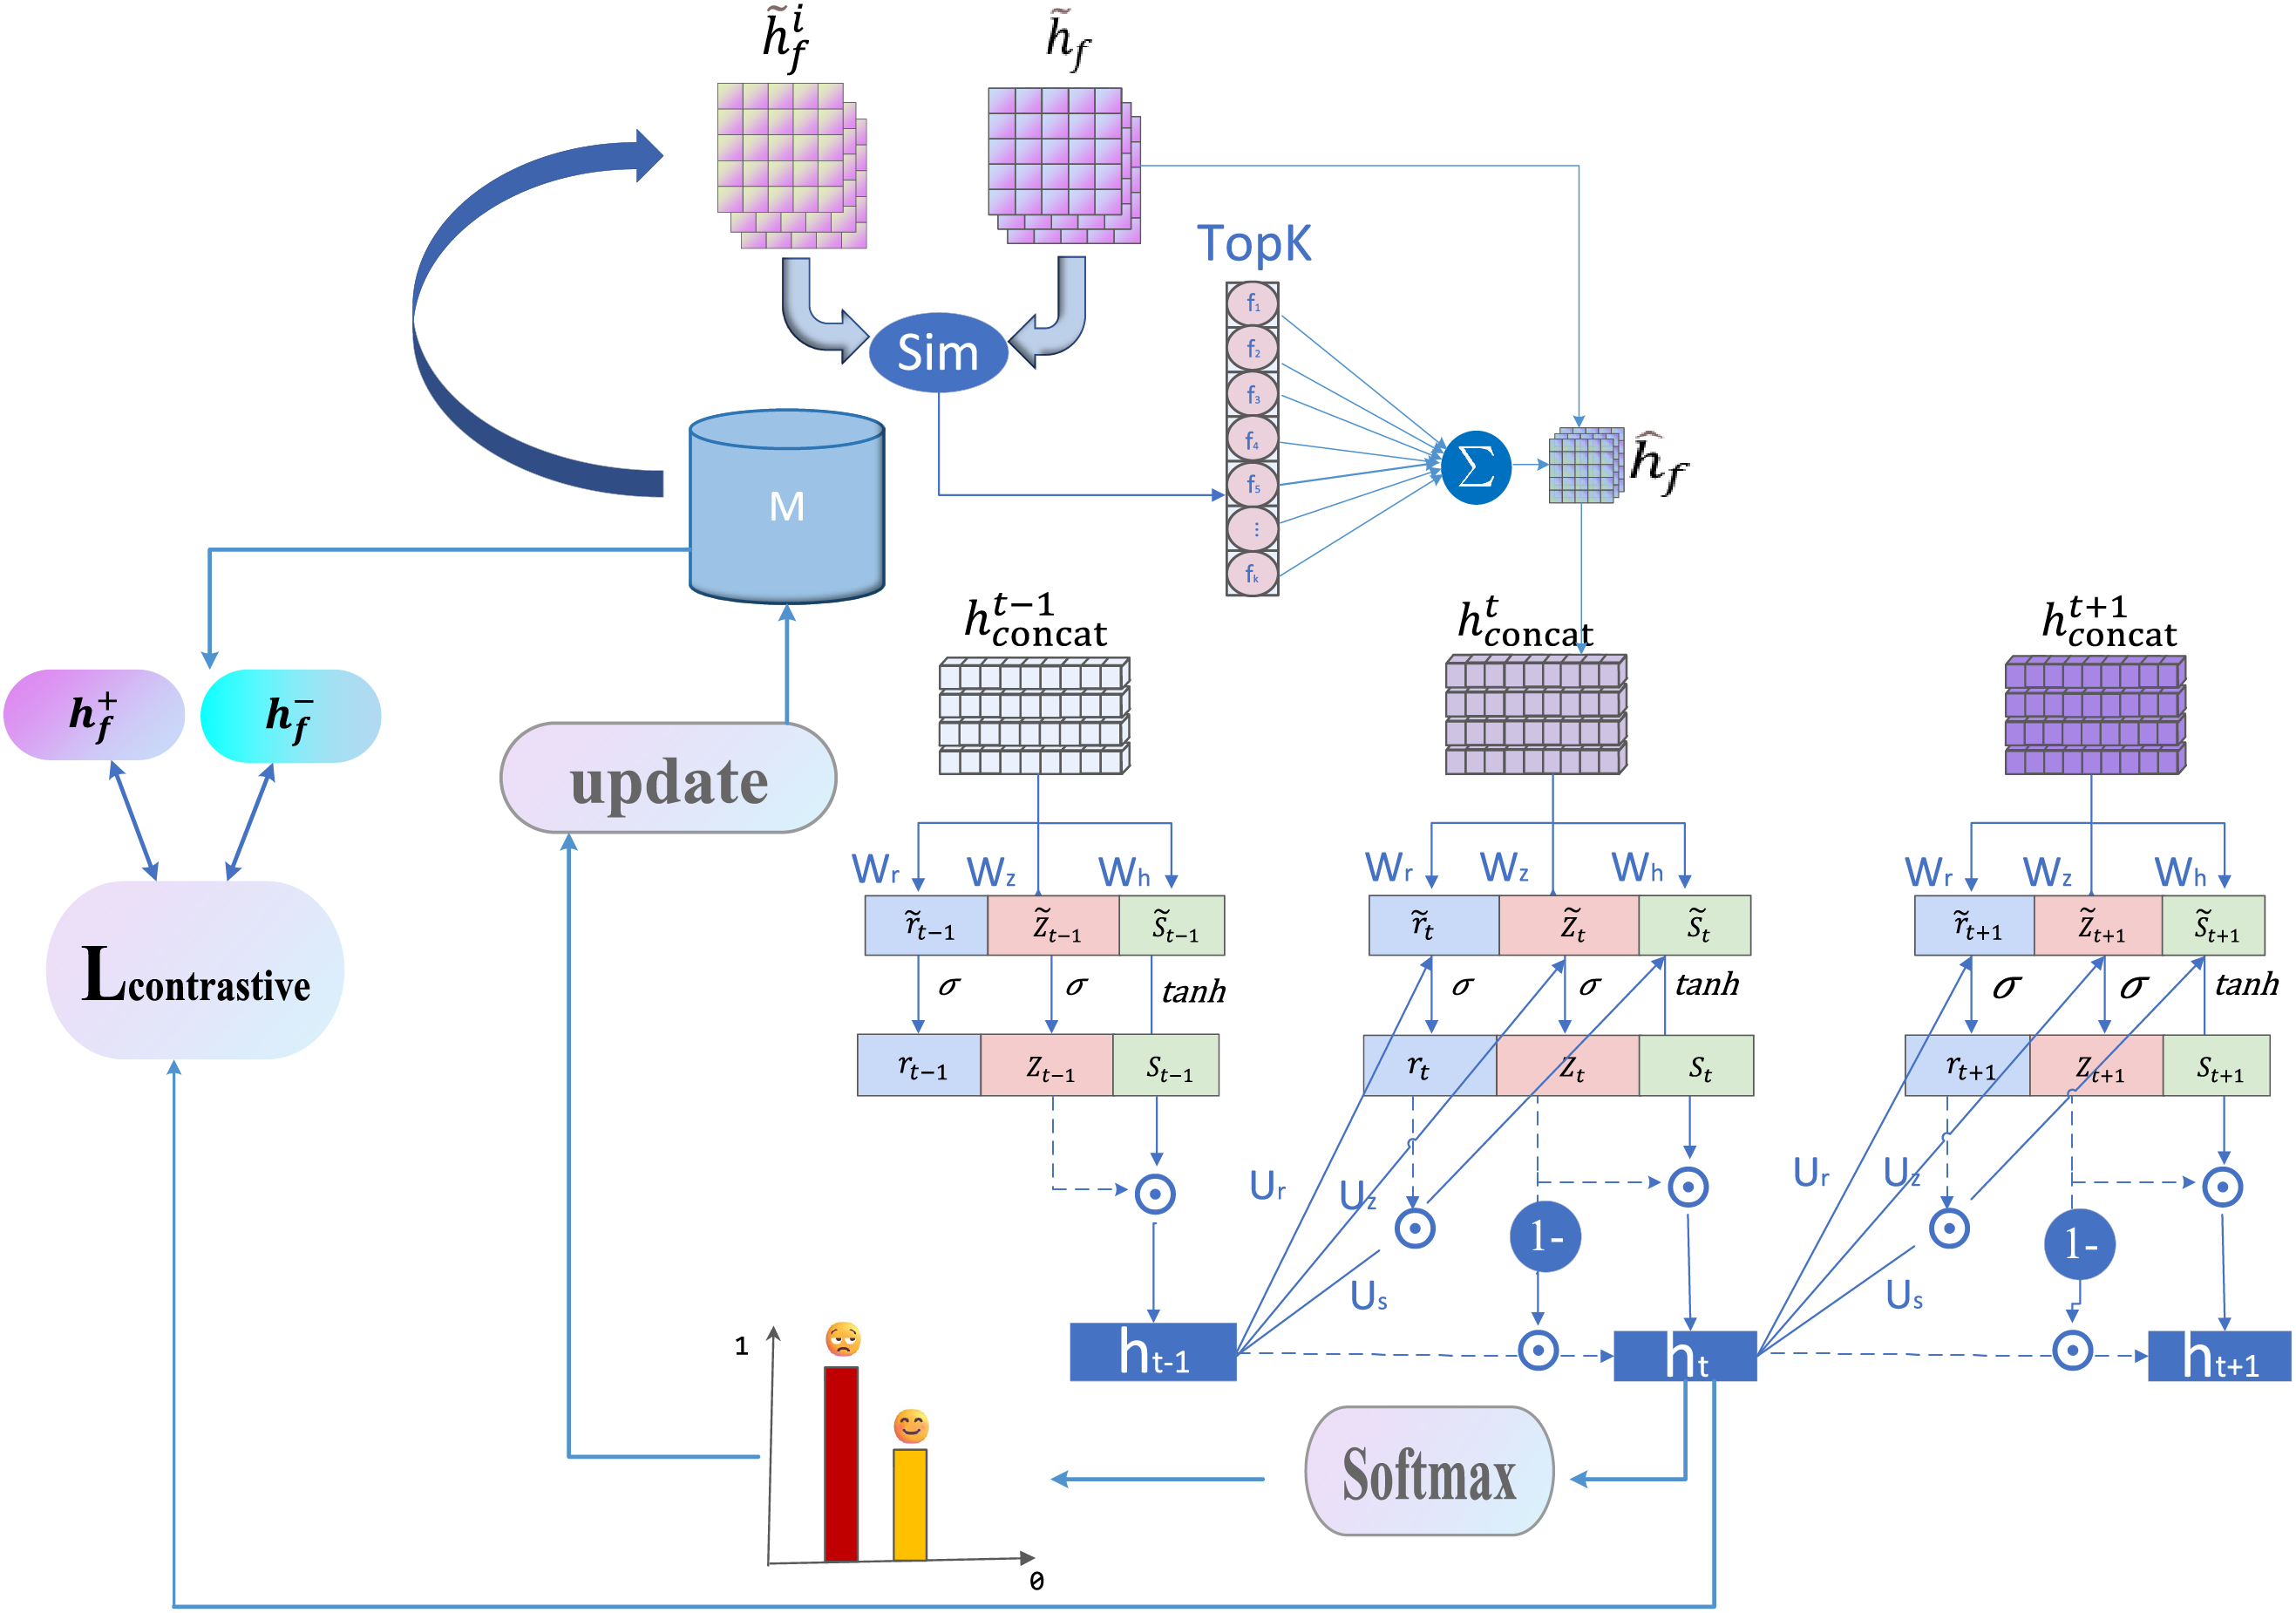
Figure 4: Illustration of the discrimination signal detection process using a dynamic memory mechanism
3.4.1 Establishment of Dynamic Memory Bank
During the model training process, a Memory Bank M is constructed to store key information, including feature representations of historical samples, true labels, and predicted entropy values, as defined in Eq. (9):
where
The predicted entropy value indicates the degree of confusion in the model’s output probability distribution for each category, is calculated as shown in Eq. (10):
where C denotes the number of categories, and
Predicted entropy reflects the model’s confidence in its output—higher entropy signifies greater uncertainty, indicating the potential for ambiguous or unclear predictions. Therefore, when the memory bank reaches its capacity, it is updated based on the predicted entropy values, with preference given to retaining samples with lower entropy. This process ensures that the memory bank contains samples with higher confidence and stability, offering more reliable references for subsequent feature enhancement and semantic analysis.
3.4.2 Similarity Calculation and Retrieval
During the prediction phase, the current sample
Based on the similarity scores, the top-K most relevant historical samples are selected to form the retrieval neighborhood, as defined in Eq. (12):
To ensure that more similar samples have higher contribution weights, weights are calculated based on similarity, and feature fusion is performed by weighted average to obtain the fusion feature
where the weight is computed based on the similarity between samples, as defined in Eq. (14):
where
3.4.4 Dynamic Fusion Based on GRU
In discrimination detection tasks, discriminatory signals often exhibit complex semantic dependencies across samples. For instance, certain discriminatory remarks require contextualization with historical information to be accurately interpreted. Current and historical samples contain different levels of feature information, and the dynamic fusion mechanism of GRUs helps the model minimize misclassification and underclassification, especially when dealing with ambiguous samples such as sarcasm, puns, or cultural bias. Moreover, as expressions of discriminatory language and behavior evolve over time and in different social contexts, GRU enables the model to continuously learn the relationship between historical and current samples, allowing it to adapt to new forms of discriminatory expression and significantly enhance the model’s adaptability and generalization ability.
The concatenation of the two feature sets serves as the input to the GRU, as defined in Eq. (15):
The GRU update process is defined as shown in Eqs. (16) to (19):
where
Classification Prediction: The dynamically fused feature
where
Specifically, if
As shown in Eq. (21), the closer
During the training phase, the model is optimized using both cross-entropy loss and contrastive loss. The cross-entropy loss minimizes the discrepancy between the predicted and true labels, thereby improving classification accuracy. The model’s classification loss function is defined in Eq. (22):
Contrastive loss optimizes the feature space differentiation by reducing the distance between positive sample features and increasing the distance between negative sample features, thereby enhancing the clustering effect within the feature space. Let the positive sample be denoted as
The loss function updates the parameters of the GRU module and the classifier through backpropagation, guiding the model to learn a more discriminative dynamic representation. The total loss for this method is as follows, as shown in Eq. (24):
The features and predicted labels of the current samples are saved into the memory bank, as shown in Eq. (25):
This section presents a comparative analysis of the performance of the baseline models and the proposed method. Experiments are conducted on two multilingual multimodal datasets, as shown in Table 1. A variety of models are selected as baseline comparisons, including unimodal vision models, text models, and multimodal pre-trained models.
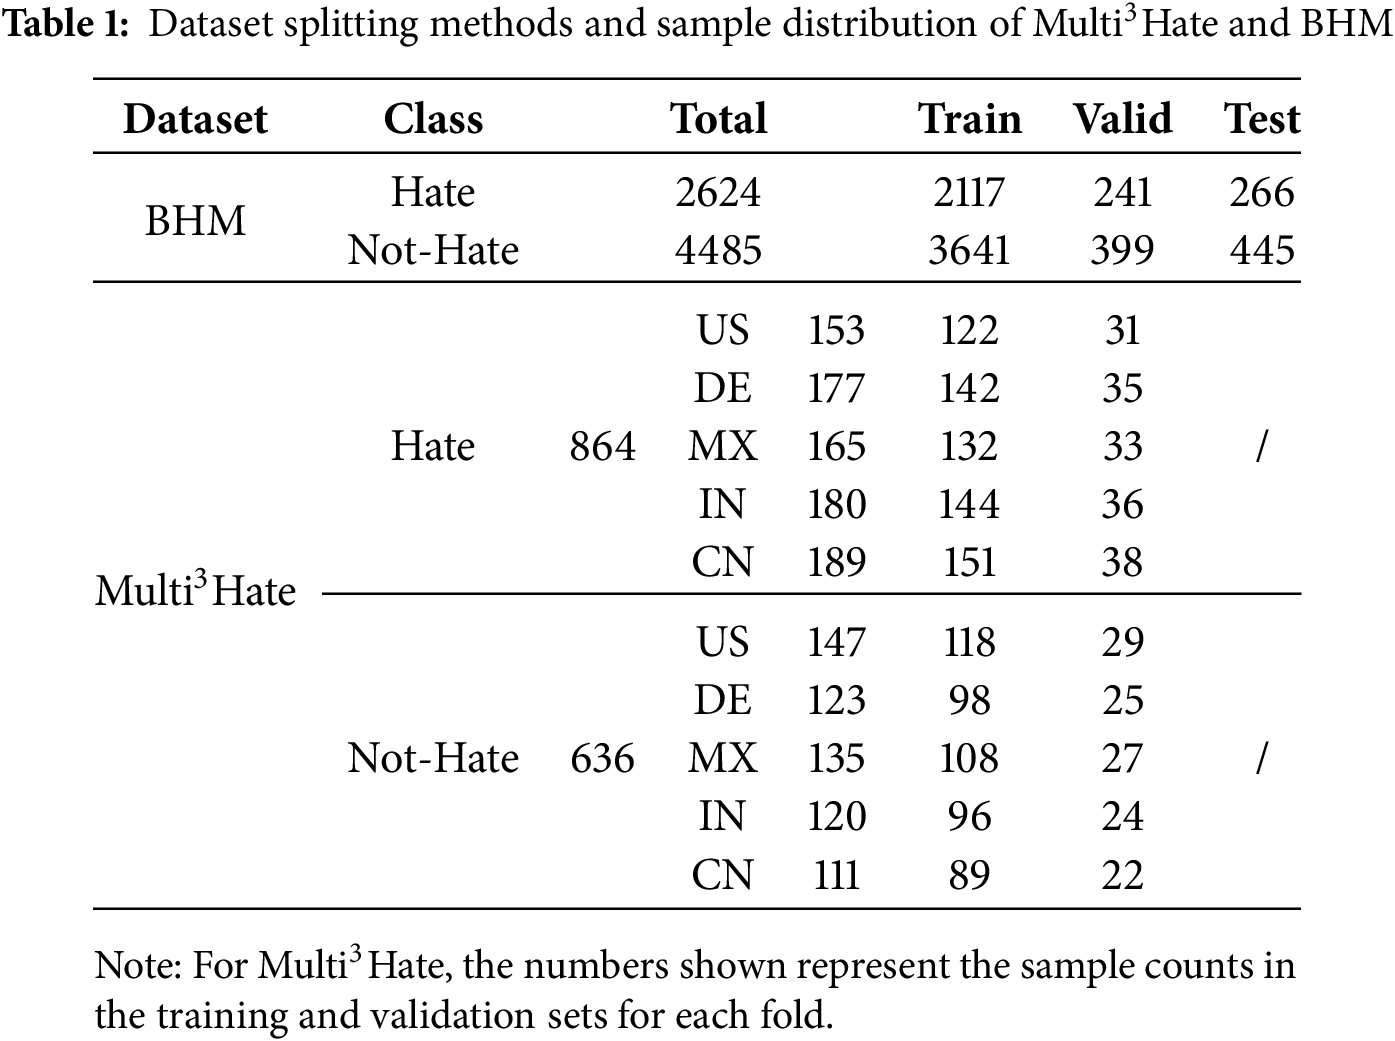
• Multi3Hate dataset [24]:A multimodal, multilingual, and multicultural dataset designed for hate speech detection. It contains 300 parallel meme samples across five languages—English, German, Spanish, Hindi, and Chinese—resulting in a total of 1500 examples. Each sample is annotated by at least five native speakers from diverse cultural backgrounds and classified as either hate speech or non-hate speech. To partition the dataset, a 5-fold cross-validation approach is used to maximize the utility of limited samples. Specifically, the 300 samples in each language are randomly divided into five subsets, with four subsets serving as the training set and one as the validation set in each iteration. This process is repeated over five rounds of training and evaluation. The final model performance is evaluated by averaging the results from all validation rounds, thereby reducing bias introduced by dataset partitioning.
• BHM Dataset [25]: The BHM dataset is a multimodal collection designed for Bengali hate meme detection, consisting of 7109 samples gathered from public platforms such as Facebook, Instagram, Pinterest, and blogs. The dataset is divided into training, validation, and test sets in an 80%, 10%, and 10% split, respectively, to facilitate model training and evaluation. It contains content in Bengali and code-mixed text combining Bengali and English.
• For the text-only models, we employed classic models, including TextCNN [26], sequence-dependent models such as Bi-LSTM [27] and mBERT [28].
• For the visual-only models, we selected ResNet [29], ViT and ConvNeXT [30] for comparison. These models represent image feature extraction techniques based on convolutional and Transformer architectures, respectively.
• CLIP: CLIP is a multimodal model trained using a contrastive learning approach to process large-scale image-text paired data effectively. It has been extensively utilized in multimodal classification tasks.
• ALBEF: ALBEF (Align Before Fuse) [31] is another multimodal model, using momentum distillation and contrastive learning method for the pre-training on noisy image-text data.
• G2SAM: G2SAM [32] is a multimodal model that leverages a gated fusion mechanism and contrastive learning to jointly align and integrate visual and textual representations, enabling effective gender bias detection in multimodal content.
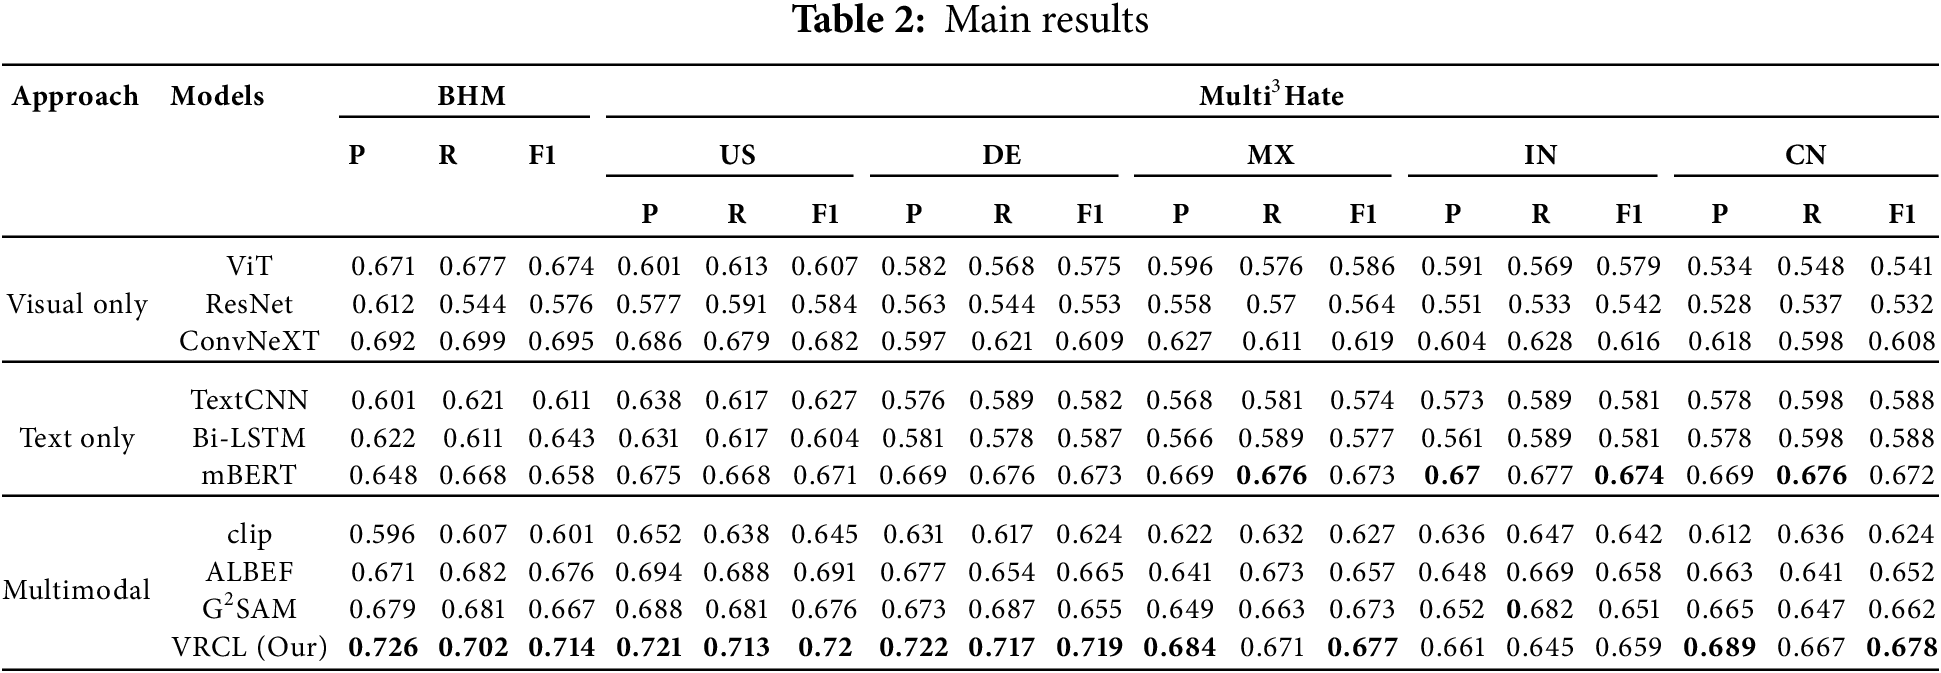
Table 2 displays the experimental results for multimodal and multilingual discrimination detection tasks. Performance was evaluated on the BHM dataset and the Multi3Hate dataset across five languages: English (US), German (DE), Spanish (MX), Hindi (IN), and Chinese (CN). The experiments compared the performance of various models in visual, textual, and multimodal tasks, using Precision (P), Recall (R), and F1 score (F1) as the primary evaluation metrics.
5.1 Analysis of Visual Model Performance
In the visual model, ConvNeXT outperforms both ViT and ResNet across all languages. On the BHM dataset, ConvNeXT achieves an F1 score of 0.695, surpassing ViT’s 0.674 and ResNet’s 0.576. VRCL (our) further exceeds ConvNeXT, improving the F1 score to 0.714. Additionally, in the Multi3Hate dataset across five languages, the VRCL demonstrates an average F1 score improvement of 0.0618 over ConvNeXT, underscoring its superior performance and multilingual adaptability in visual modeling. A deeper analysis of these baseline models reveals several critical limitations. For instance, while ViT achieves a moderate average F1 score (0.674), its performance drops significantly on Chinese (F1 = 0.541), indicating challenges in handling linguistic diversity. ResNet performs even worse, with an average F1 score of 0.564, suggesting limited capacity to extract discriminative features from visual data. Although ConvNeXT demonstrates relatively better generalization (average F1 = 0.616), it still encounters difficulties with certain languages, such as Chinese (F1 = 0.608). These observations further highlight the effectiveness and robustness of the proposed VRCL model in managing multilingual visual inputs.
5.2 Analysis of Text Model Performance
In evaluating text model performance, the multilingual pre-trained model mBERT consistently outperforms traditional models such as TextCNN and Bi-LSTM. For example, on the BHM dataset, mBERT achieves an F1 score of 0.658, compared to 0.611 and 0.643 for TextCNN and Bi-LSTM, respectively. Moreover, mBERT demonstrates strong performance across all languages in the Multi3Hate dataset, particularly in Hindi (IN), where it achieves an F1 score of 0.674. A closer examination of the text-only baseline models further underscores the value of multimodal integration. TextCNN achieves a relatively low average F1 score of 0.588, suggesting that relying solely on textual inputs may overlook important visual cues essential for accurate discrimination detection. Although Bi-LSTM performs slightly better than TextCNN, with a comparable average F1 score of 0.588, it still faces challenges in modeling complex linguistic patterns–particularly in multilingual contexts. These findings emphasize the limitations of traditional text models in capturing nuanced and cross-lingual semantics. Notably, while mBERT alleviates some of these limitations with its strong multilingual capabilities, our proposed VRCL model still surpasses mBERT’s performance in all languages except Hindi, further demonstrating VRCL’s broader adaptability and effectiveness in detecting multilingual discriminatory content.
5.3 Analysis of Multimodal Model Performance
In the task of multimodal discrimination detection, VRCL demonstrates significant advantages across multiple datasets and language settings, consistently outperforming mainstream models such as ALBEF, CLIP, and G2SAM. Specifically, on the BHM dataset, VRCL achieves an F1 score of 0.714, notably higher than ALBEF’s 0.676, indicating stronger capabilities in multimodal feature fusion and semantic representation. On the Multi3Hate dataset, VRCL attains the highest F1 score of 0.721 on the English (US) subset, while also showing stable and robust performance across other language subsets: 0.719 on German (DE) and 0.678 on Chinese (CN), both surpassing the best results of existing methods.
Although G2SAM, as one of the latest fusion models, achieves a competitive average F1 score of 0.662, close to VRCL, it still falls short. This gap is mainly attributed to G2SAM’s current and historical feature fusion mechanism, which has not been fully optimized and thus fails to effectively leverage historical semantic context. Consequently, its performance in cross-modal semantic alignment and discrimination signal recognition is limited. In fact, mainstream multimodal models such as ALBEF, CLIP, and G2SAM mostly adopt a “single-step” feature fusion strategy, lacking the ability to remember and model semantic evolution over time. This limitation makes it difficult for these models to accurately capture subtle cross-modal semantic changes in the presence of semantic drift, implicit discrimination, or complex contextual variations.
In contrast, the superior performance of VRCL primarily benefits from its innovative incorporation of a historical feature memory mechanism and a GRU-based sequential modeling architecture. By dynamically retrieving and integrating the most semantically similar historical samples with the current features, VRCL effectively captures the semantic evolution process, greatly enhancing feature expressiveness and semantic continuity. As a result, VRCL is able to more accurately identify cross-modal semantic biases and discriminatory signals, demonstrating stronger robustness and generalization capabilities.
To assess the contribution of each module to the model’s performance, this study conducted ablation experiments by systematically removing individual modules and tracking changes in the F1 score. Table 3 presents the experimental results.
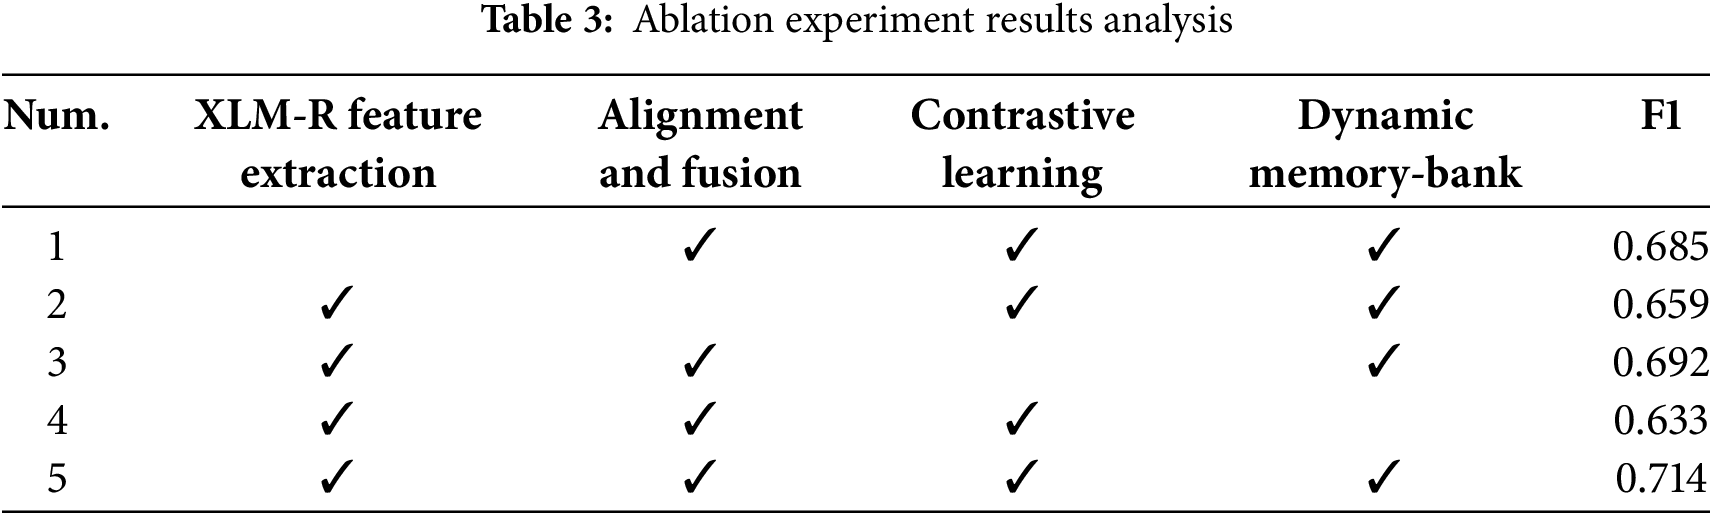
• Experiment 1: Replacing the original CLIP model’s text extractor with XLM-R resulted in a decrease in the F1 score to 0.685. This indicates that XLM-R is essential for cross-linguistic feature capture and semantic understanding, and its absence significantly impacts performance in multilingual tasks.
• Experiment 2: Removing the multimodal alignment and fusion module resulted in a drop in the F1 score to 0.659. The results demonstrate that this module strengthens alignment between textual and visual features via a cross-attention mechanism, effectively modeling both local and global dependencies and supporting cross-modal semantic interactions.
• Experiment 3: Removing the contrastive learning module reduced the F1 score to 0.692, reflecting a relatively smaller decline. This indicates that the module optimizes feature distribution and enhances model robustness by increasing intra-class similarity and inter-class differentiation, thereby improving feature representation quality.
• Experiment 4: Removing the dynamic memory module caused the F1 score to drop to 0.633, marking the largest decline. This underscores the dynamic memory bank’s importance for long-term feature storage and contextual modeling, enabling it to capture historical features and dynamic information, thus improving adaptability to complex tasks.
• Experiment 5: The complete model, incorporating all modules, achieved the best performance with an F1 score of 0.714. These results validate the synergistic contributions of each module to feature extraction, cross-modal alignment, contrastive learning, and dynamic memory modeling, enhancing both model robustness and adaptability.
5.5 Computational Complexity and Model Analysis
The proposed VRCL model demonstrates strong performance in integrating multilingual textual and visual features. However, its computational complexity warrants careful consideration. Both the text encoder (XLM-R) and image encoder (ViT) are based on the Transformer architecture, resulting in a time complexity of approximately
To further demonstrate the effectiveness of our proposed VRCL module in multimodal multilingual discrimination detection, we visualize the feature distribution around a discrimination instance. Specifically, we retrieve the top 200 nearest neighbor instances as reference samples for a discrimination case, and employ the t-SNE algorithm to reduce the feature dimensions to 2D space, as shown in Fig. 5. Fig. 5a illustrates the distribution without applying VRCL, whereas Fig. 5b shows the feature distribution when VRCL is used. As seen in Fig. 5b, the retrieved neighbors are more semantically consistent with the ground-truth label (discrimination), while Fig. 5a contains more irrelevant or noisy (non-discrimination) instances. This observation suggests that VRCL enhances the semantic alignment of retrieved k-nearest neighbors across both modalities and languages, thereby boosting model performance in complex real-world scenarios.
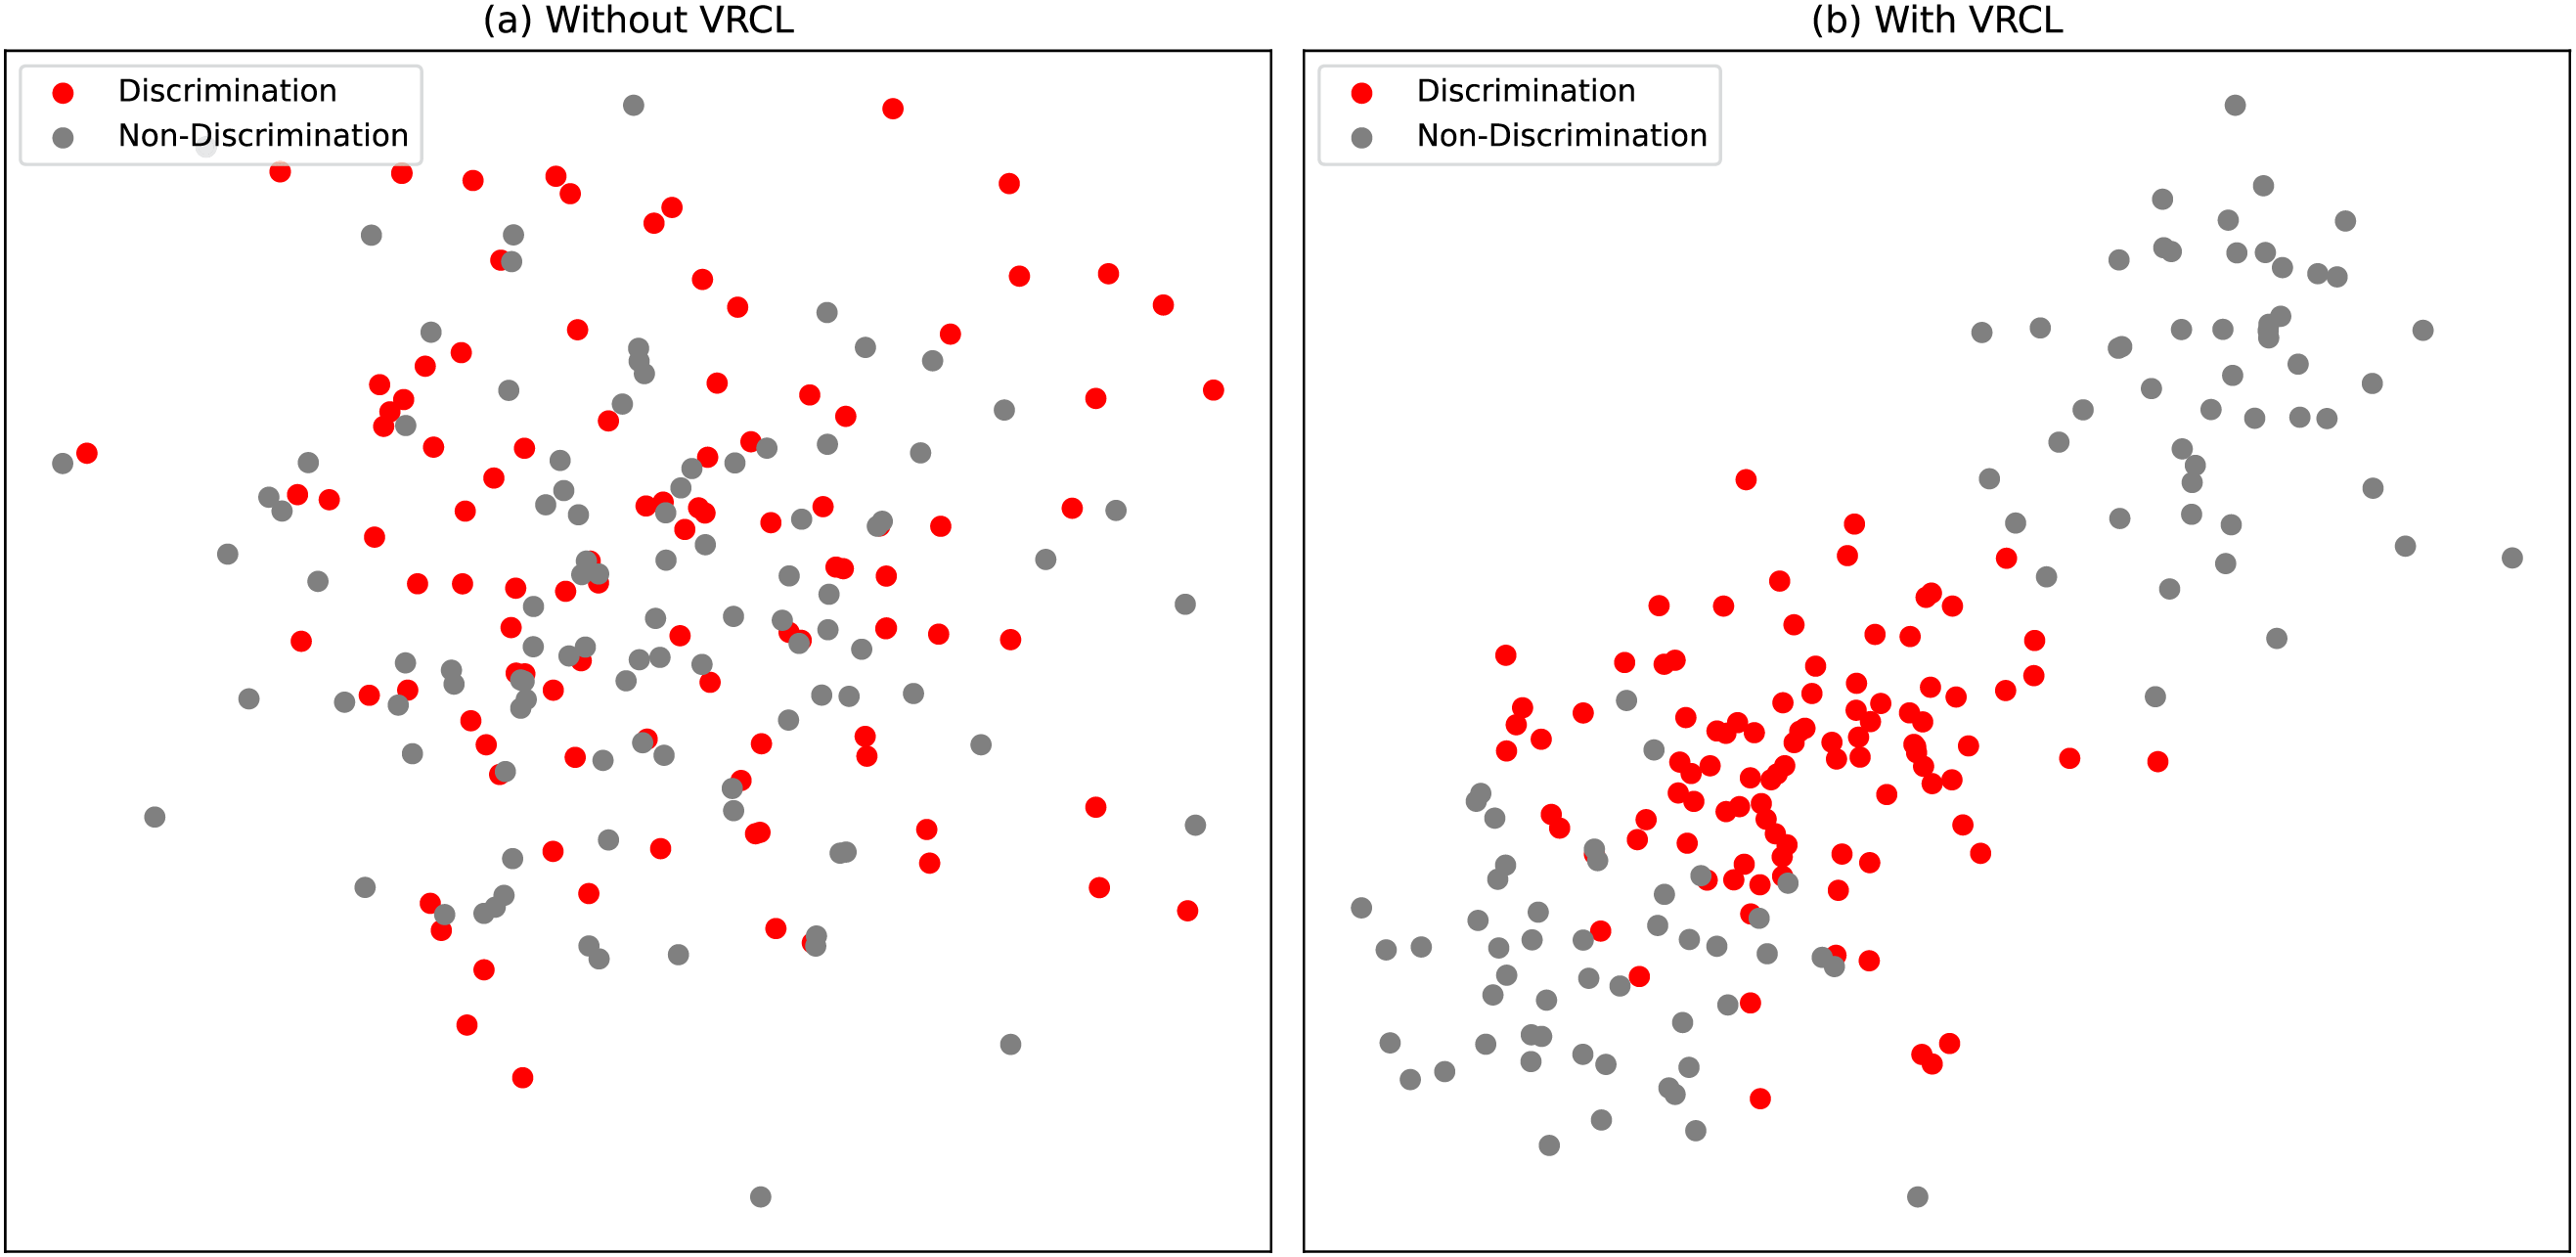
Figure 5: Distribution of the retrieved top 200 nearest neighbors instances for a sarcasm case
In this paper, we propose a discrimination detection method for multilingual multimodal information, which integrates a ViT image encoder and an XLM-R text encoder. The multimodal feature alignment and fusion module effectively captures fine-grained interactive information between images and text. Based on this, VRCL combines contrastive learning with a historical feature memory bank to create a high-quality discrimination feature embedding space. The GRU module is employed to merge historical and current features, enhancing both the representation capability and detection accuracy of discriminatory signals. Experimental results demonstrate that the proposed method achieves strong performance across multiple multilingual multimodal datasets, highlighting its effectiveness and robustness across diverse cultural and contextual environments. As our future work, we plan to focus on optimizing the model’s computational efficiency and expanding its applicability across various domains to better address the growing complexity of online discrimination.
Acknowledgement: This work was funded by the Open Foundation of Key Laboratory of Cyberspace Security, Ministry of Education [KLCS20240210].
Funding Statement: This research was funded by the Open Foundation of Key Laboratory of Cyberspace Security, Ministry of Education [KLCS20240210].
Author Contributions: All authors contributed to the conceptualization and methodology of the study. Jiahao Cheng, Jun Wang, and Ying Yang conducted the primary data collection and analysis. Meijiao Li contributed to drafting the initial manuscript. Kejun Zhang reviewed and revised the manuscript critically for important intellectual content. All authors reviewed the results and approved the final version of the manuscript.
Availability of Data and Materials: The data that support the findings of this study are openly available in the Multi3Hate dataset and BHM dataset at: https://github.com/minhducbui/multi3hate (accessed on 22 June 2025) and https://github.com/eftekhar-hossain/bengali-hateful-memes?tab=readme-ov-file (accessed on 22 June 2025).
Ethics Approval: Not applicable.
Conflicts of Interest: The authors declare no conflicts of interest to report regarding the present study.
References
1. Waseem Z, Hovy D. Hateful symbols or hateful people? Predictive features for hate speech detection on Twitter. In: Proceedings of the 2016 Conference of the North American Chapter of the Association for Computational Linguistics: Human Language Technologies; 2016 Jun 12–17; San Diego, CA, USA. p. 88–93. doi:10.18653/v1/n16-2013. [Google Scholar] [CrossRef]
2. Sundararajan K, Palanisamy A. Multi-rule based ensemble feature selection model for sarcasm type detection in Twitter. Comput Intell Neurosci. 2020;2020(7):1–17. doi:10.1155/2020/2860479. [Google Scholar] [PubMed] [CrossRef]
3. Dagar V, Verma A, Govardhan K. Sentiment analysis and sarcasm detection (using emoticons). In: Swarnalatha P, Prabu S, editors. Research anthology on implementing sentiment analysis across multiple disciplines. Hershey, PA, USA: IGI Global; 2022. p. 1600–10. doi: 10.4018/978-1-6684-6303-1.ch085. [Google Scholar] [CrossRef]
4. Bhavana N, Guthur AS, Reddy KLS, Ahmed ST, Ahmed A. Cognizance through convolution: a deep learning approach for emotion recognition via convolutional neural networks. Procedia Comput Sci. 2025;259:1336–45. [Google Scholar]
5. Siddiqui M, Pandey R, Srivastava S, Mishra R, Singh N. Sarcasm detection from social media posts using machine-learning techniques: a comparative analysis. In: Proceedings of the 3rd International Conference on Advanced Computing and Software Engineering; 2021 Feb 19–20; Sultanpur, India. p. 28–33. doi:10.5220/0010561900003161. [Google Scholar] [CrossRef]
6. Kiilu KK, Okeyo G, Rimiru R, Ogada K. Using naïve Bayes algorithm in detection of hate tweets. Int J Sci Res Publ. 2018;8(3):99–107. doi:10.29322/ijsrp.8.3.2018.p7517. [Google Scholar] [CrossRef]
7. Hana KM, Adiwijaya, Al Faraby S, Bramantoro A. Multi-label classification of Indonesian hate speech on Twitter using support vector machines. In: Proceedings of the 2020 International Conference on Data Science and Its Applications (ICoDSA); 2020 Aug 5–6; Bandung, Indonesia. p. 1–7. doi:10.1109/icodsa50139.2020.9212992. [Google Scholar] [CrossRef]
8. Rodriguez-Sanchez F, Carrillo-de-Albornoz J, Plaza L. Automatic classification of sexism in social networks: an empirical study on Twitter data. IEEE Access. 2020;8:219563–76. doi:10.1109/access.2020.3042604. [Google Scholar] [CrossRef]
9. Conneau A, Baevski A, Collobert R, Mohamed A, Auli M. Unsupervised cross-lingual representation learning for speech recognition. In: Proceedings of the Interspeech 2021; 2021 Aug 30–Sep 3; Brno, Czech Republic. p. 2426–30. doi:10.21437/interspeech.2021-329. [Google Scholar] [CrossRef]
10. Dosovitskiy A, Beyer L, Kolesnikov A, Weissenborn D, Zhai X, Unterthiner T, et al. An image is worth 16x16 words: transformers for image recognition at scale. arXiv:2010.11929. 2020. doi:10.48550/arXiv.2010.11929. [Google Scholar] [CrossRef]
11. Ballakur AA, Arya A. Empirical evaluation of gated recurrent neural network architectures in aviation delay prediction. In: Proceedings of the 5th International Conference on Computing, Communication and Security (ICCCS); 2020 Oct 14–16; Patna, India. p. 1–7. doi:10.1109/icccs49678.2020.9276855. [Google Scholar] [CrossRef]
12. Kiela D, Firooz H, Mohan A, Goswami V, Singh A, Ringshia P, et al. The hateful memes challenge: detecting hate speech in multimodal memes. Adv Neural Inf Process Syst. 2020;33:2611–24. doi:10.48550/arXiv.2005.04790. [Google Scholar] [CrossRef]
13. Ma Z, Yao S, Wu L, Gao S, Zhang Y. Hateful memes detection based on multi-task learning. Mathematics. 2022;10(23):4525. doi:10.3390/math10234525. [Google Scholar] [CrossRef]
14. Chen Y, Pan F. Multimodal detection of hateful memes by applying a vision-language pre-training model. 2022. doi:10.21203/rs.3.rs-1414253/v2. [Google Scholar] [CrossRef]
15. Nie L, Wang W, Hong R, Wang M, Tian Q. Multimodal dialog system: generating responses via adaptive decoders. In: Proceedings of the 27th ACM International Conference on Multimedia; 2019 Oct 21–25; Nice, France. p. 1098–106. doi:10.1145/3343031.3350923. [Google Scholar] [CrossRef]
16. Kumar GK, Nandakumar K. Hate-CLIPper: multimodal hateful meme classification based on cross-modal interaction of CLIP features. In: Proceedings of the 2nd Workshop on NLP for Positive Impact (NLP4PI); 2022 Dec 7; Abu Dhabi, United Arab Emirates. p. 171–83. doi:10.18653/v1/2022.nlp4pi-1.20. [Google Scholar] [CrossRef]
17. Chen J, Yu H, Liu W, Huang S, Liu S. InterCLIP-MEP: interactive CLIP and memory-enhanced predictor for multi-modal sarcasm detection. arXiv:2406.16464. 2024. doi:10.48550/arXiv.2406.16464. [Google Scholar] [CrossRef]
18. Lu J, Batra D, Parikh D, Lee S. ViLBERT: pretraining task-agnostic visiolinguistic representations for vision-and-language tasks. In: Proceedings of the Neural Information Processing Systems 2019; 2019 Dec 8–14; Vancouver, BC, Canada. doi:10.48550/arXiv.1908.02265. [Google Scholar] [CrossRef]
19. Li LH, Yatskar M, Yin D, Hsieh CJ, Chang KW. What does BERT with vision look at? In: Proceedings of the 58th Annual Meeting of The Association For Computational Linguistics; 2020 Jul 5–10; Online. p. 5265–75. doi:10.18653/v1/2020.acl-main.469. [Google Scholar] [CrossRef]
20. Chen YC, Li L, Yu L, El Kholy A, Ahmed F, Gan Z, et al. UNITER: universal image-text representation learning. In: Proceedings of the Computer Vision—ECCV 2020; 2020 Aug 23–28; Glasgow, UK. Springer; 2020. p. 104–20. doi:10.1007/978-3-030-58577-8_7. [Google Scholar] [CrossRef]
21. Xue L, Constant N, Roberts A, Kale M, Al-Rfou R, Siddhant A, et al. mT5: a massively multilingual pre-trained text-to-text transformer. In: Proceedings of the 2021 Conference of the North American Chapter of the Association for Computational Linguistics: Human Language Technologies; 2021 Jun 6–11; Online. p. 483–98. doi:10.18653/v1/2021.naacl-main.41. [Google Scholar] [CrossRef]
22. Montariol S, Riabi A, Seddah D. Multilingual auxiliary tasks training: bridging the gap between languages for zero-shot transfer of hate speech detection models. In: Findings of AACL-IJCNLP 2022; 2022 Nov 21–23; Taipei, Taiwan. p. 347–63. doi:10.18653/v1/2022.findings-aacl.33. [Google Scholar] [CrossRef]
23. Röttger P, Seelawi H, Nozza D, Talat Z, Vidgen B. Multilingual HateCheck: functional tests for multilingual hate speech detection models. In: Proceedings of the 6th Workshop on Online Abuse and Harms (WOAH); 2022 Jul 10–15; Seattle, WA, USA. p. 154–69. doi:10.18653/v1/2022.woah-1.15. [Google Scholar] [CrossRef]
24. Bui MD, von der Wense K, Lauscher A. Multi3Hate: multimodal, multilingual, and multicultural hate speech detection with vision-language models [Preprint]. arXiv:2411.03888. 2024. doi:10.48550/arXiv.2411.03888. [Google Scholar] [CrossRef]
25. Hossain E, Sharif O, Hoque MM, Preum SM. Deciphering hate: identifying hateful memes and their targets. In: Proceedings of the 62nd Annual Meeting of the Association for Computational Linguistics (ACL 2024); 2024 Aug 11–16; Bangkok, Thailand. p. 8347–59. doi:10.18653/v1/2024.acl-long.454. [Google Scholar] [CrossRef]
26. Kim Y. Convolutional neural networks for sentence classification. In: Proceedings of the 2014 Conference on Empirical Methods in Natural Language Processing (EMNLP); 2014 Oct 25–29; Doha, Qatar. p. 1746–51. doi:10.3115/v1/d14-1181. [Google Scholar] [CrossRef]
27. Graves A, Schmidhuber J. Framewise phoneme classification with bidirectional LSTM and other neural network architectures. Neural Netw. 2005;18(5):602–10. doi:10.1016/j.neunet.2005.06.042. [Google Scholar] [PubMed] [CrossRef]
28. Devlin J, Chang MW, Lee K, Toutanova K. BERT: pre-training of deep bidirectional transformers for language understanding. In: Proceedings of the 2019 Conference of the North American Chapter of the Association for Computational Linguistics: Human Language Technologies (NAACL-HLT 2019); 2019 Jun 2–7; Minneapolis, MN, USA. p. 4171–86. doi:10.18653/v1/N19-1423. [Google Scholar] [CrossRef]
29. He K, Zhang X, Ren S, Sun J. Deep residual learning for image recognition. In: Proceedings of the 2016 IEEE Conference on Computer Vision and Pattern Recognition (CVPR); 2016 Jun 27–30; Las Vegas, NV, USA. p. 770–8. doi:10.1109/CVPR.2016.90. [Google Scholar] [CrossRef]
30. Liu Z, Mao H, Wu CY, Feichtenhofer C, Darrell T, Xie S. A ConvNet for the 2020s. In: Proceedings of the 2022 IEEE/CVF Conference on Computer Vision and Pattern Recognition (CVPR); 2022 Jun 18–24; New Orleans, LA, USA. p. 11966–76. doi:10.1109/CVPR52688.2022.01167. [Google Scholar] [CrossRef]
31. Li J, Selvaraju RR, Gotmare A, Joty S, Xiong C, Hoi SCH. Align before fuse: vision and language representation learning with momentum distillation. Adv Neural Inf Process Syst. 2021;34:9694–705. doi:10.48550/arXiv.2107.07651. [Google Scholar] [CrossRef]
32. Wei Y, Yuan S, Zhou H, Wang L, Yan Z, Yang R, et al. G2SAM: graph-based global semantic awareness method for multimodal sarcasm detection. In: Proceedings of the 38th AAAI Conference on Artificial Intelligence; 2024 Feb 20–27; Vancouver, BC, Canada. p. 9151–9. doi:10.1609/aaai.v38i8.28766. [Google Scholar] [CrossRef]
Cite This Article
 Copyright © 2025 The Author(s). Published by Tech Science Press.
This work is licensed under a Creative Commons Attribution 4.0 International License , which permits unrestricted use, distribution, and reproduction in any medium, provided the original work is properly cited.
 Downloads
 Citation Tools