
 Submit a Paper
 Propose a Special lssue
 Open Access
ARTICLE
A Novel Evidential Reasoning Rule with Causal Relationships between Evidence
1 Guangxi Key Laboratory of Trusted Software, Guilin University of Electronic Science Technology, Guilin, 541004, China
2 Key Laboratory of the Ministry of Education, Guilin University of Electronic Technology, Guilin, 541004, China
* Corresponding Author: Liang Chang. Email:
Computers, Materials & Continua 2025, 85(1), 1113-1134. https://doi.org/10.32604/cmc.2025.067240
Received 28 April 2025; Accepted 25 June 2025; Issue published 29 August 2025
 View Full Text
 Download PDF
Abstract
The evidential reasoning (ER) rule framework has been widely applied in multi-attribute decision analysis and system assessment to manage uncertainty. However, traditional ER implementations rely on two critical limitations: 1) unrealistic assumptions of complete evidence independence, and 2) a lack of mechanisms to differentiate causal relationships from spurious correlations. Existing similarity-based approaches often misinterpret interdependent evidence, leading to unreliable decision outcomes. To address these gaps, this study proposes a causality-enhanced ER rule (CER-e) framework with three key methodological innovations: 1) a multidimensional causal representation of evidence to capture dependency structures; 2) probabilistic quantification of causal strength using transfer entropy, a model-free information-theoretic measure; 3) systematic integration of causal parameters into the ER inference process while maintaining evidential objectivity. The PC algorithm is employed during causal discovery to eliminate spurious correlations, ensuring robust causal inference. Case studies in two types of domains—telecommunications network security assessment and structural risk evaluation—validate CER-e’s effectiveness in real-world scenarios. Under simulated incomplete information conditions, the framework demonstrates superior algorithmic robustness compared to traditional ER. Comparative analyses show that CER-e significantly improves both the interpretability of causal relationships and the reliability of assessment results, establishing a novel paradigm for integrating causal inference with evidential reasoning in complex system evaluation.Keywords
The assessment and decision-making of key areas, such as medical care, engineering, and the Internet, reveal a causal relationship between the evidence involved. Nevertheless, the current evidential reasoning (ER) framework has limitations in dealing with causal relationships between evidence, leading to inaccurate reasoning processes. The ER framework was initially developed through the belief distribution expansion of the Dempster-Shafer theory [1]. This strategy probabilistically characterizes the evidence through belief structures while systematically combining evidence weight with reliability measures to establish hybrid uncertainty representations, thus solving the combined explosion problem in evidence aggregation. To further deal with ambiguity, the belief distribution used the rules-based inference method of evidential reasoning (RIMER) [2]. This method uses a formal mapping between the system input and output attributes. Rule-based weights ensure data quality, and probability state subset allocation quantifies fuzzy propagation. Additionally, for the case of inference modeling of imperfect data, reference [3] introduced a robust framework using ER. It uniformly represents qualitative and quantitative information within the framework of belief structures while systematically dealing with various types of uncertainty, such as randomness, inaccuracy, ambiguity, and inconsistency.
ER rules have been widely used in information fusion [4], assessment [5], decision-making, and data analysis [6] due to their excellent ability to process uncertain information. However, a critical analysis of these applications reveals inherent limitations in traditional ER frameworks. For instance, Liu et al. [7] applied the ER framework to model incomplete information dissemination but acknowledged challenges in capturing causal dependencies between information diffusion pathways—this limitation restricted the model’s ability to differentiate between direct causal effects and spurious correlations in dynamic systems. Similarly, while Ren et al. [8] developed a density-based particle size fusion clustering method to address evidence aggregation explosions, their approach relied on implicit assumptions of evidence independence, which may introduce inference bias when handling interdependent data sources. Li et al. [9] proposed an ER-based health assessment model for complex systems but noted that the conventional form of ER struggled to represent causal relationships between assessment indices, leading to potential misinterpretations of index interactions in engineering practice.
With the increasing complexity of systems, ensuring complete independence among pieces of evidence becomes increasingly challenging. To tackle evidence correlation, Tang et al. [10] proposed the MLER (Evidence Rule with Likelihood Analysis and Perturbation Analysis). Building on this, Liu et al. [11] developed MICER (Evidence Inference Rule with Maximum Mutual Information Coefficient), which uses the maximum mutual information coefficient (MIC) to model evidence correlation. Furthermore, Yang and Xu [12] proposed maximum likelihood evidential reasoning (MAKER) classifier to characterize evidence reliability via probabilistic modeling. This approach systematically leverages evidence interdependencies through factor parameterization, optimizing evidence combination to enhance classification decision accuracy.
While existing ER rule enhancements address statistical dependencies and reliability calibration [13,14], critical limitations persist in causal reasoning integration: (1) Current frameworks conflate causal relationships with spurious correlations due to reliance on correlation-driven evidence aggregation [15,16], fundamentally limiting decision interpretability in complex systems. (2) No systematic methodology exists to reconcile causal discovery techniques with ER’s orthogonal sum operator, creating a mechanistic disconnect between causal topology identification and evidence fusion processes. (3) Dynamic adaptation to evolving causal structures in multidimensional systems remains unaddressed, as conventional approaches employ static reference levels and transformation matrices. (4) The absence of causal counterfactual reasoning frameworks undermines ER’s ability to answer “why”-type diagnostic questions despite accuracy improvements. For instance, in the mid-1960s, a tension arose between the medical consensus that smoking elevates lung cancer risk and the birth weight paradox [17]. This paradox was resolved in 2006 when a causal explanation emerged: research showed two plausible mechanisms for low birth weight in infants: either the mother smoked, or the infant had pre-existing conditions (e.g., severe genetic abnormalities or congenital defects). This led to the causal diagram: smoking → birth weight ← birth defects → infant mortality. Notably, this pathway is non-causal because it reflects an associational structure (not direct causality), where the bidirectional arrow at birth weight induces a spurious correlation between smoking and infant mortality. This spurious association biases estimates of the direct causal effect: smoking → infant mortality. This empirical evidence highlights the urgent need to develop an ER framework that integrates causal relationships to improve diagnostic reliability. These gaps collectively establish an urgent need for causal-embedded ER paradigms that unify evidence fusion with causal graph discovery, causal relationship quantification, and explainable decision pathways, which is the gap that this study will fill.
ER methods have been revolutionized due to advances in causal discovery techniques, especially in automated causal inference frameworks. Contemporary causal discovery technology is committed to systematically identifying potential causal relationships through observational data mining [18,19]. Its excellent ability to mine for causality is proven. Indeed, Budhathoki et al. [20] introduced a practical rule induction framework by enabling causal relationship extraction from operational datasets. Besides, recent reviews have systematically demonstrated the potential of graph-theoretic causal discovery methods [21], with researchers proposing various methods and frameworks for learning and inferring causal networks from data. Unlike traditional correlation analysis, the causal graph theory approach considers potential confounders in causal inference. The goal of causal discovery techniques is to discover correlations between variables and, more importantly, to reveal causal effects through statistical tests and algorithmic modeling. The practical efficacy of causal discovery methodologies has been increasingly validated through cross-domain empirical studies [22]. Notably, these methodologies have been successfully implemented in industrial process control systems [23] and geotechnical monitoring architectures [24], where complex system risk analysis and assessment modeling have been systematically enhanced with improved operational validity.
There are three primary causal discovery methods: structural causal modeling (SCM) [25], latent variable framework (LVF) [26], and the Peter Clark (PC) algorithm [27]. These schemes are designed to uncover latent causal mechanisms through rigorous statistical verification, enhancing inferential validity in complex system analysis. Distinct methodological priorities have been implemented across these frameworks. For instance, direct causal relationships between variables in SCM are represented by directed acyclic graphs (DAGs) [28]. However, practical applications are challenged when encountering high-dimensional variable spaces. In contrast, LVFs have been developed as statistical inference systems for analyzing unobservable causal mechanisms between measurable variables [29]. It should be noted that since an LVF does not focus on the causal relationship between the variables, it does not apply to this study. Complementing these approaches, the PC algorithm has been widely adopted as a constraint-based causal discovery mechanism, where conditional independence tests are systematically implemented to reconstruct causal DAGs. Fazal et al. [30] demonstrated that spurious correlation elimination is achieved through iterative edge pruning and orientation procedures based on statistical dependence analysis. Moreover, they revealed that true causality is identified through structural dependency analysis rather than superficial correlation detection. Additionally, their work highlighted that the accuracy of the results is significantly improved by in-depth causal structural analysis, which provides decision-theoretic support for the management of complex systems. Therefore, to establish a robust ER framework that integrates causality, it is necessary to develop new ER methods to handle the interdependence between evidence. This study uses the PC algorithm as the core method for integrating evidence causality.
However, the DAGs generated through PC-based causal mining cannot be directly integrated into ER frameworks. Thus, a critical transformation process is required where qualitative causality is converted into quantifiable parameters through rigorous metric formalization. In nonlinear evidence systems, transfer entropy is used as a nonparametric measure of the amount of directed information transfer between stochastic processes. This metric captures the informational impact of process X on process Y, thus modeling nonlinear causality in complex environments.
Therefore, the current challenges are threefold: 1) Traditional ER frameworks cannot process causal dependencies between evidence elements; 2) Existing ER studies predominantly focus on statistical correlations rather than objective causal relationships; 3) Causal relationships identified through the PC algorithm are represented graphically but lack direct integration mechanisms with ER’s reasoning process. The objectives of this paper are threefold: 1) Develop a causal-aware ER framework capable of processing evidence with inherent causal interdependencies; 2) Identify optimal causal discovery methods to overcome correlation-centric biases in current approaches; 3) Finding effective causal quantification tools: (i) quantifying the PC-derived causal graphs to obtain causal parameters, and (ii) systematically embedding the causal parameters into ER’s inference engine.
Hence, to address the above challenges, the proposed causality-enhanced ER rule (CER-e) framework uniquely integrates multidimensional causality representation and quantification into the ER inference process and introduces a novel approach that significantly enhances the framework’s ability to deal with complex evidential interdependencies, thereby improving the accuracy of assessment and decision making.
In summary, the core contributions of this paper are as follows:
1) The CER-e is formally established, where causal interdependencies between evidentiary elements are systematically integrated through PC algorithm-driven mining processes. This framework fundamentally solves the reasoning bias caused by ignoring causality in traditional ER implementations.
2) The proposed framework uses transfer entropy to quantify the intensity of causality to calculate the effect of one variable on another more interpretably. This integrates the DAG generated by the PC into the ER framework. This strategy systematically solves the problem of graph-to-parameter conversion.
3) Causal relationships between evidence are quantified as a critical parameter of the CER-e framework and systematically incorporated into the CER-e reasoning process. The constraints of the traditional ER evidence independence requirements are extended, and the accuracy and reliability of the model’s reasoning are improved.
The remainder of this paper is organized as follows. Section 2 describes the background and related work on causal discovery techniques and ER. Section 3 introduces the proposed methodology, and Section 4 presents the case study conducted. Finally, Section 5 concludes this work and suggests future research directions.
This study will further investigate how causal discovery techniques can improve the accuracy and reliability of ER. This section focuses on existing theoretical foundations, which are compared and analyzed to provide a structured and quantitative approach to improving ER.
2.1 Causal Discovery Techniques
This study selects a suitable causal discovery algorithm to improve the evidential reasoning process and accurately unearth the causal relationship between the evidence. The standard causal discovery algorithms are the SCM, LVF, and PC. SCM is a mathematical framework that describes and analyzes the causal relationship between variables. Its core idea is to clarify the causal relationship between variables and their mechanism by combining graphical models and structural equations. LVF compares potential outcome differences in the same individual with and without the intervention to assess whether the intervention has a causal effect on that individual. The PC algorithm is a constrained causal discovery method based on statistical independence tests. It can accommodate significant variables and efficiently identify potential causal structures in observed data.
Compared to SCM and LVF, the core advantages of the PC algorithm include the following aspects: 1) Automation and data-driven, conditional independence testing is used by the PC algorithm to construct causal diagrams step-by-step without relying on a priori structural equations or intervention hypotheses. In contrast, SCM must predefine the functional relationship between variables and rely on strong theoretical assumptions. LVF needs to specify the mapping between intervening variables and potential outcomes and requires higher requirements for experimental design or negligible assumptions. 2) Processing high-dimensional data. The computational complexity of the PC algorithm is significantly reduced by the gradual reduction of the condition set and the local independence test. SCM and LVF are susceptible to dimensional disasters in large-scale variable scenarios, especially when no confounding observation exists. 3) Robustness to unobserved confounding. Unobserved confounding is handled indirectly by the PC algorithm through conditional independence tests. Conversely, the algorithm may retain pseudo-correlation, but statistical significance tests can control the error discovery rate. SCM needs to explicitly model mixed paths through backdoor adjustment and other criteria, which requires higher prior knowledge. LVF must rely on the strong negligibility assumption (i.e., no unobserved confusion). Otherwise, the causal effect estimate will be severely biased. Therefore, this study adopts the PC algorithm as the primary causal discovery technique.
The core theorem of the PC algorithm is as follows:
Theorem 1. (Faithfulness Assumption) If the probability distribution
Theorem 2. (d-Separation Criterion) Two nodes
Specifically, the application of the PC algorithm can be divided into the following steps:
Step 1: Pairwise independence test. PC first performs a pairwise independence test between pairs of variables to confirm whether there is a potential causal relationship between the two variables or whether they can be recognized as conditionally independent.
Step 2: Construction of an undirected graph. Based on the results of Step 1, an undirected graph is constructed whose edges represent associations between pairs of variables that other variables cannot fully explain.
Step 3: Orientation of edges. Following Step 2, further conditional independence tests are performed, and the association edges are oriented using the merge rule. The outcome of PC is a Partial Directed Acyclic Graph (PDAG) representing the causal relationships between variables.
This study leverages powerful causality quantification tools to effectively integrate the causal relationships derived from the PC algorithm into the ER inference framework. Traditional methods for measuring the interdependence between variables include mutual information, Granger causality, and correlation coefficients. Mutual information is an indicator measured by the dependence relationship between two random variables and is suitable for linear relationships and to detect nonlinear relationships. However, due to its symmetry, mutual information cannot distinguish the information flow of
Therefore, traditional methods exhibit limitations in detecting nonlinear causality. To address this, nonlinear causality detection based on Transfer Entropy (TE) has emerged as an effective solution. TE is an asymmetric information-theoretic measure that quantifies how historical information of one variable reduces uncertainty about the future state of another variable. Its core advantages lie in: 1) Model-free nature: TE operates without relying on specific interaction models or assumptions, enabling it to capture nonlinear causal relationships in complex systems; 2) Uncertainty reduction: By evaluating causal influence through historical state transitions, TE effectively distinguishes linear vs. nonlinear dependencies; 3) Robustness: TE demonstrates excellent resistance to noise and missing data, while conditionalization mechanisms exclude confounding variables to enhance inference accuracy. These characteristics—including its nonlinear capture capability, directionality, and multivariate processing—make TE an ideal choice for quantifying causality in this study.
TE is calculated using Shannon entropy, conditional entropy, and relative entropy. Shannon entropy is formulated as follows:
where
Conditional entropy is the remaining uncertainty when another variable is known. It is defined as follows:
where
The joint entropy is the uncertainty of the joint distribution of two or more variables. That is, the degree of uncertainty when
where
The transfer entropy is formulated as follows:
where
3 ER Rule with Causal Relationships between Evidence
The proposed model is mainly based on the traditional ER Rule to improve its inference process, allowing the developed method to compensate for the problem of biased assessment results due to the ignorance of causality between evidence in the traditional method. First, the CER-e is mined by the PC algorithm (see Section 2.1), and then the causal relationship is quantified through the transfer entropy (see Section 2.2). The quantified value of the causal strength is included in the derivation process of evidential reasoning. Finally, a new evidence inference rule that considers causal relationships among evidence is established. Fig. 1 illustrates the overall flow of the model.
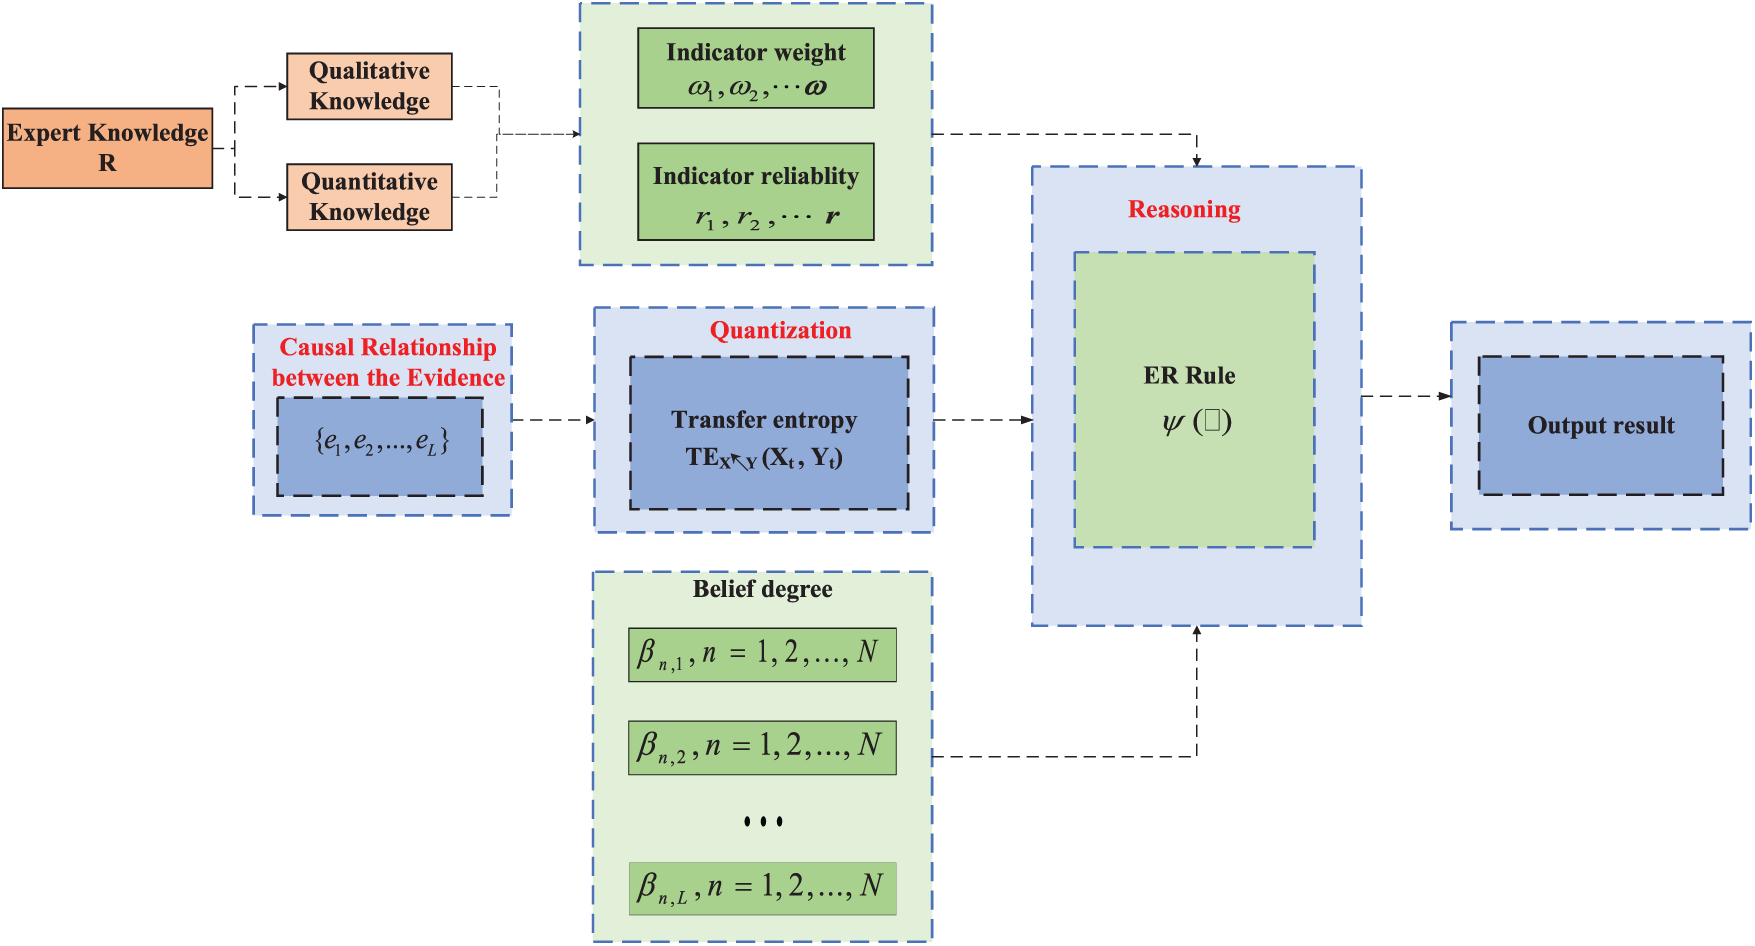
Figure 1: Overall flowchart of the model
Where the modeling of expert knowledge R includes 1) For quantitative information
Assuming that the reference value
Let the identification framework be
Suppose there are
where
Assume that
where
Therefore, the underlying probability mass distribution of
where
Then, the PC algorithm is utilized to mine the causal relationships between the L pieces of evidence
Step 1: Initialize Complete Graph. Begin with a fully connected, undirected graph
Step 2: Skeleton Identification. For each pair of adjacent nodes
1. Test
2. Remove edge
Step 3: Edge Orientation. Apply the following orientation rules to convert the skeleton into a CPDAG:
Rule 1 (V-structure): Orient
Rule 2 (Acyclic): Avoid creating directed cycles.
Rule 3 (Meek’s rules): Propagate orientations to avoid conflicts.
Next, the causal relationship between the above CPDAGs is quantified by transfer entropy, which is calculated as follows:
where
First, the basic CER-e lemma is provided.
Lemma 1. (basic form of CER-e): For two correlated
In Eq. (10),
Then, the following lemma for the recursive CER-e is provided:
Lemma 2. (recursive form of the CER-e): For
where
The analysis presented above indicates that new synthetic evidence
where
In summary, the CER-e method solves the problem of DAG not being directly integrated into mathematical proof and compensates for the lack of causal relationship between the evidence using traditional ER reasoning. Once the causal relationship is quantified by transfer entropy, the degree of causality between evidence becomes clearer, enhancing the objectiveness and interpretability of the reasoning process of CER-e, thereby providing a reliable basis for subsequent decision-making.
Remark 1: Variables and indicators mentioned in this study refer to evidence.
Remark 2: Parameter Definitions and Methodological Selections. The operational parameters comprise evidence weight, reliability, and reference levels, each serving distinct functions: Evidence weight reflects subjective importance (e.g., decision-maker’s preference for specific indicators), with four setting approaches: 1) Subjective assignment: Expert experience, preference rule mapping. 2) Objective calculation: Information entropy, data-driven methods. 3) Hybrid weighting: Subjective-objective combination. 4) Dynamic adjustment: Conflict feedback, utility-sensitive adaptation. Evidence reliability measures objective credibility through three pathways: 1) Information consistency: Fluctuation analysis, perturbation factor modeling. 2) Statistical characterization: Probability density functions, interval reliability. 3) Expert calibration: Reliability scoring, cross-validation techniques. Reference levels are established by domain experts integrating specialized knowledge. Method selection requires contextual evaluation: Subjective weighting suits expert-dominated decisions, objective reliability prioritizes sensor-based systems, while hybrid approaches handle multi-source evidence integration.
Remark 3: Algorithmic Robustness and Parameterization Strategy. The orthogonal sum operator in evidential reasoning (ER) inherently incorporates two critical features: 1) Residual uncertainty management: A built-in belief redistribution mechanism allocates unassigned uncertainties within the identification framework, providing inherent robustness against external disturbances. 2) Parameter stability: Structural properties empirically validate tolerance to parameter variations [29,30], including weight perturbations across operational ranges. Methodological design adheres to three principles: 1) Weight preservation: Subjective assignments remain unoptimized to prioritize system stability over marginal accuracy enhancements. 2) Reliability anchoring: Calibration strictly follows evidence source characteristics, avoiding generic optimization procedures. 3) Expert-driven reference levels: Domain-specific thresholds retain interpretability without iterative tuning. This strategic parameterization aligns with industrial diagnostics where traceable decision-making and operational resilience outweigh theoretical optimality.
Remarks 4: Higher-order interactions of transfer entropy are ignored. Due to the inherent characteristics of transfer entropy, traditional transfer entropy is difficult to quantify higher-order interactions among multiple variables. It is necessary to combine it with extended methods such as multivariate transfer entropy. This paper does not involve the use of multivariate transfer entropy for the time being, which can be considered as one of the directions for future research.
In the case studies presented in this section, we evaluate the proposed method using two distinct types of datasets: one representing physical systems (from the architectural domain) and the other representing virtual systems (from the cybersecurity domain). These two domains differ significantly in the nature of the causal relationships they contain. By applying the method to both types, we aim to demonstrate not only its validity in mining causality among evidence, but also its generalization ability across domains with different causal structures.
4.1 Case for Telecommunications Network Security Assessment (Virtual Objects)
In telecommunication networks, anomalies are often identified through alarms, and due to the size of the network and the interconnected structure within the system, operators may be faced with millions of alarms per day. A single failure in the network may trigger many alarms of various types on multiple connected devices. Operators are expected to be able to quickly locate the root cause of a failure from the storm of alarms. However, achieving such a goal is very challenging and requires learning the causal relationships between alarms to provide administrators with a fast-troubleshooting process. This section selects 200 sets of historical alarm data of telecommunication networks containing four indicators: alarm type, device where the alarm is located, alarm start timestamp, and alarm end timestamp.
The experimental data are shown in Fig. 2, where alarm_id in Fig. 2a represents the alarm type, and the vertical axis represents the alarm ID. In Fig. 2b, device_id represents the device where the alarm occurred, encoded as [0, N − 1] and [0, M − 1], where N and M represent the total number of alarm types and devices, respectively. The vertical axis represents the ID of the alarm device. In Fig. 2c,d, the vertical axes represent the timestamps of the start and end of the alarm, respectively. Our goal is to utilize the PC algorithm to mine the causal relationships between these metrics, then calculate the transfer entropy values, and finally, apply and evaluate these values in the reasoning process of ER.
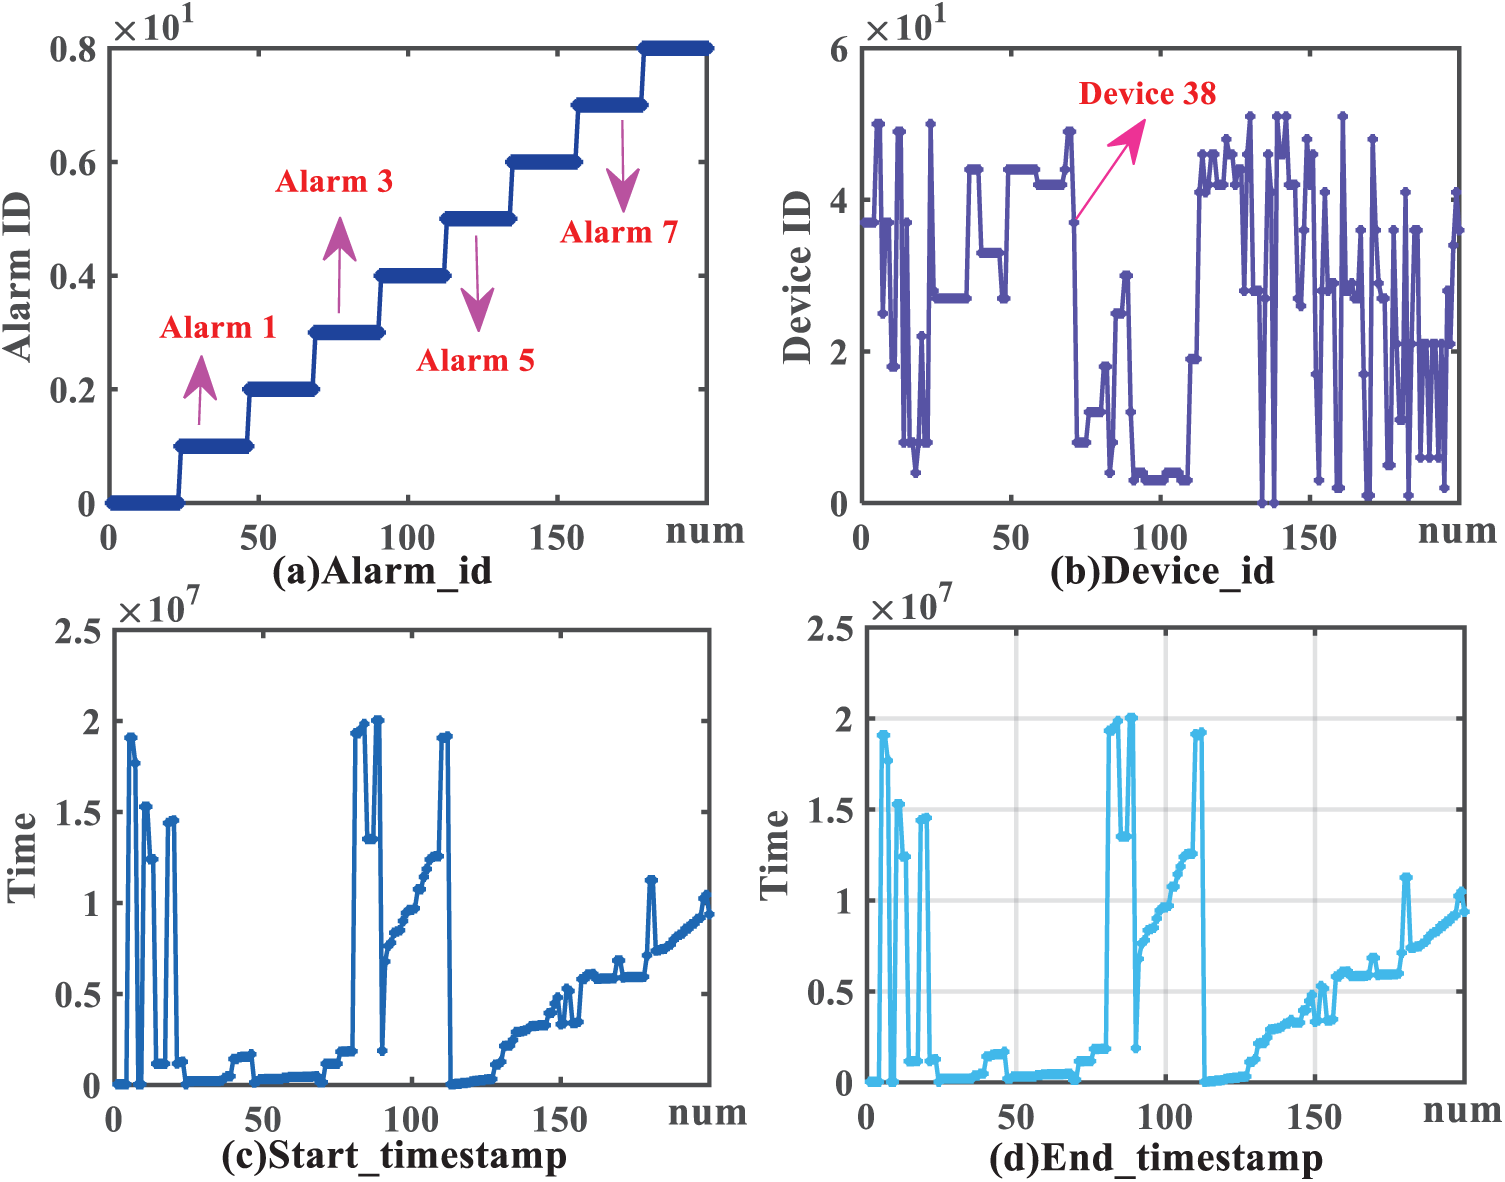
Figure 2: Experiment data
4.1.2 Results of PC Algorithm Application
The dataset is initially processed utilizing the PC algorithm framework. Commencing with pairwise independence testing, an undirected graphical model is constructed based on statistical dependency analysis, and direct interactions between indicators are revealed in this preliminary graphical representation. Subsequent conditional independence testing is systematically conducted to transform the undirected structure into a DAG. This refinement process enabled the identification of causal pathways while accounting for latent confounding variables. The structural evolution of causal diagrams during this process—encompassing pre-test undirected configurations, post-test DAG representations, and real DAG—is comprehensively illustrated in Fig. 3. Numerical annotations within the diagram correspond to distinct alarm typologies. In the telecommunications network security assessment scenario examined, we derived a causal alarm network through historical observable alarm data analysis. This is highly important, as the proposed model provides operators with prioritized alarm rankings based on causal significance, thereby enabling efficient root cause identification within multivariate alarm clusters through systematic causal path tracing.
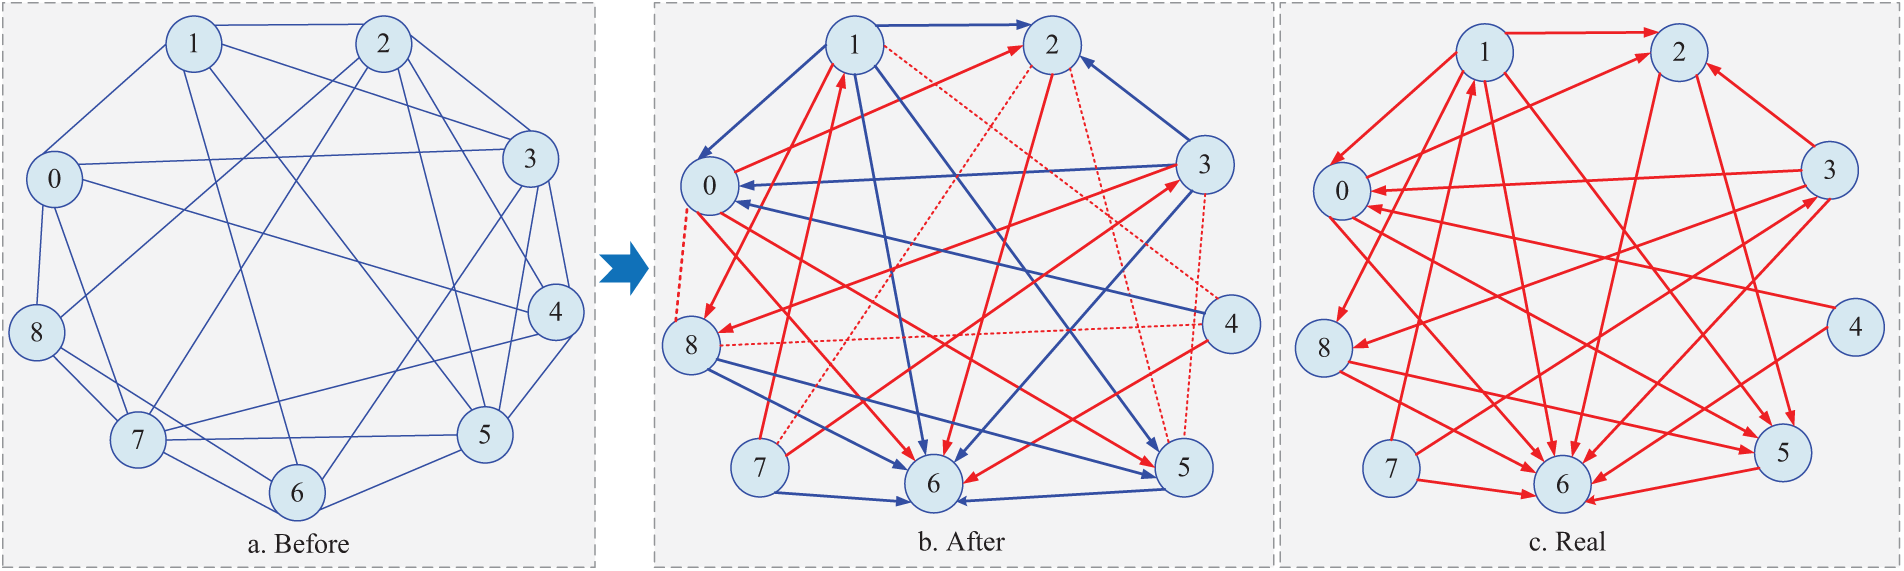
Figure 3: Before-and-after causal diagrams for PC algorithm conditional independence tests and comparison with real causal diagrams
4.1.3 Transfer Entropy Calculation Results
With an explicit causal network, we calculated the transfer entropy values between the relevant variables to quantify the information transfer of causal relationships using Eq. (9), as shown in Fig. 4. Alarm type No. 3 (
where
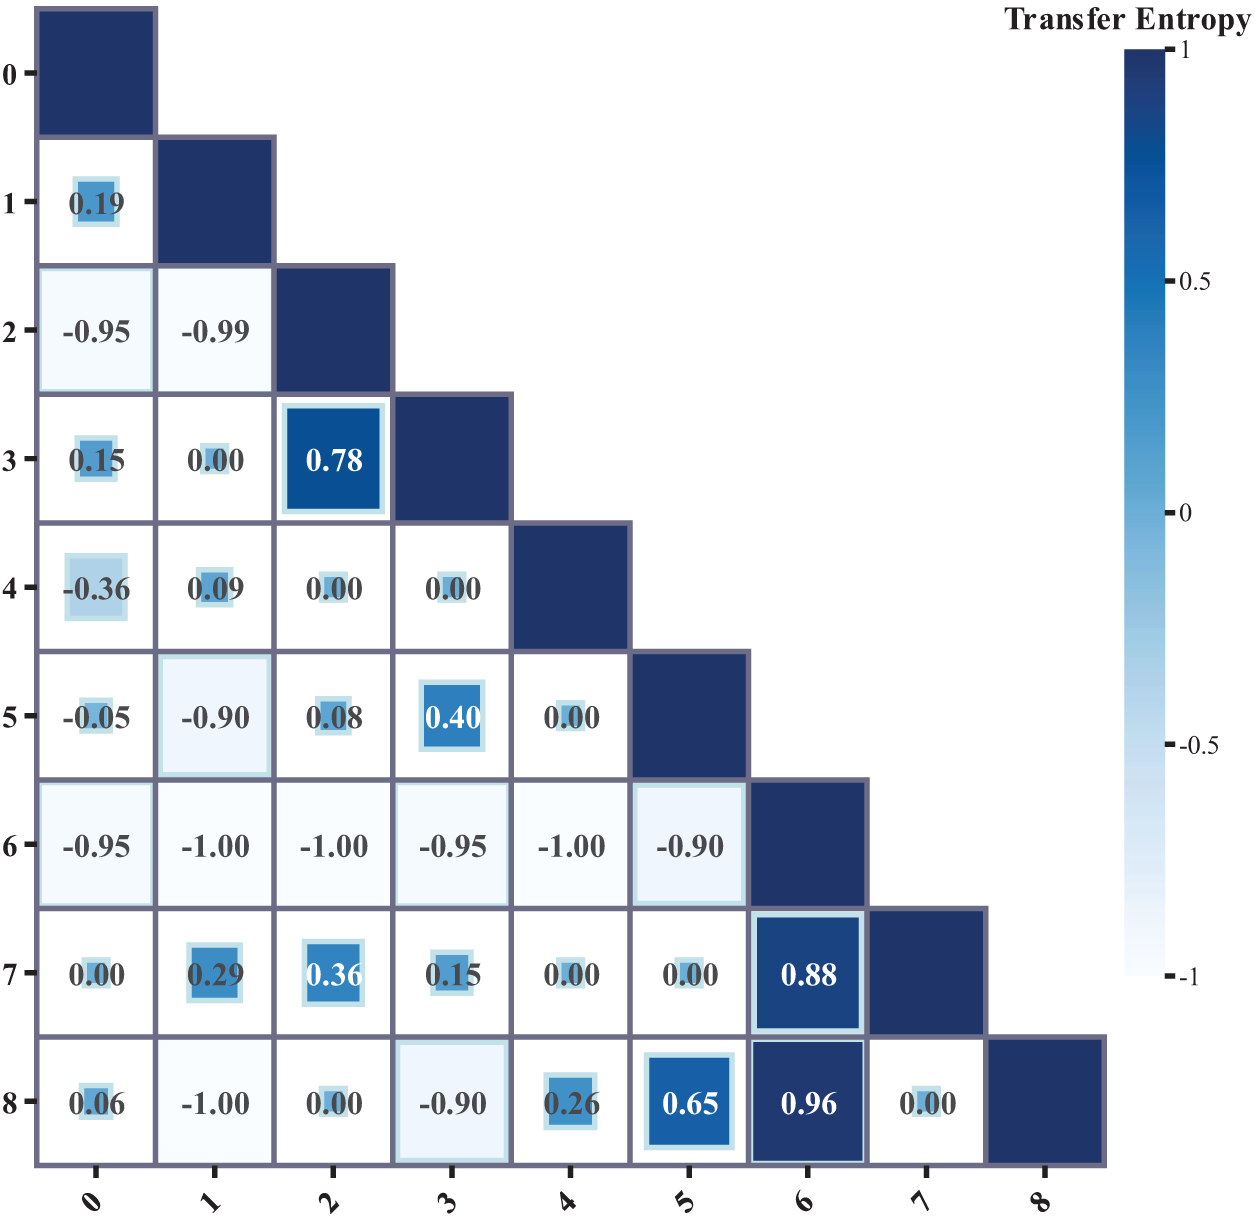
Figure 4: Transfer entropy results for the transfer of alarm types in telecommunication networks
Based on Fig. 4 and the above calculations, the transfer entropy value from alarm type No. 3 (
4.1.4 Telecommunications Network Security Assessment Case Study Discussion
Following the integration of transfer entropy values into the ER framework, a comparative analysis is conducted between the CER-e methodology and conventional approaches (traditional ER, MICER, maximum likelihood evidential reasoning (MAKER), RNN, PCA) against truth assessments.
The CER-e framework demonstrates three critical advancements over conventional methods through comparative validation (Fig. 5, Table 1):
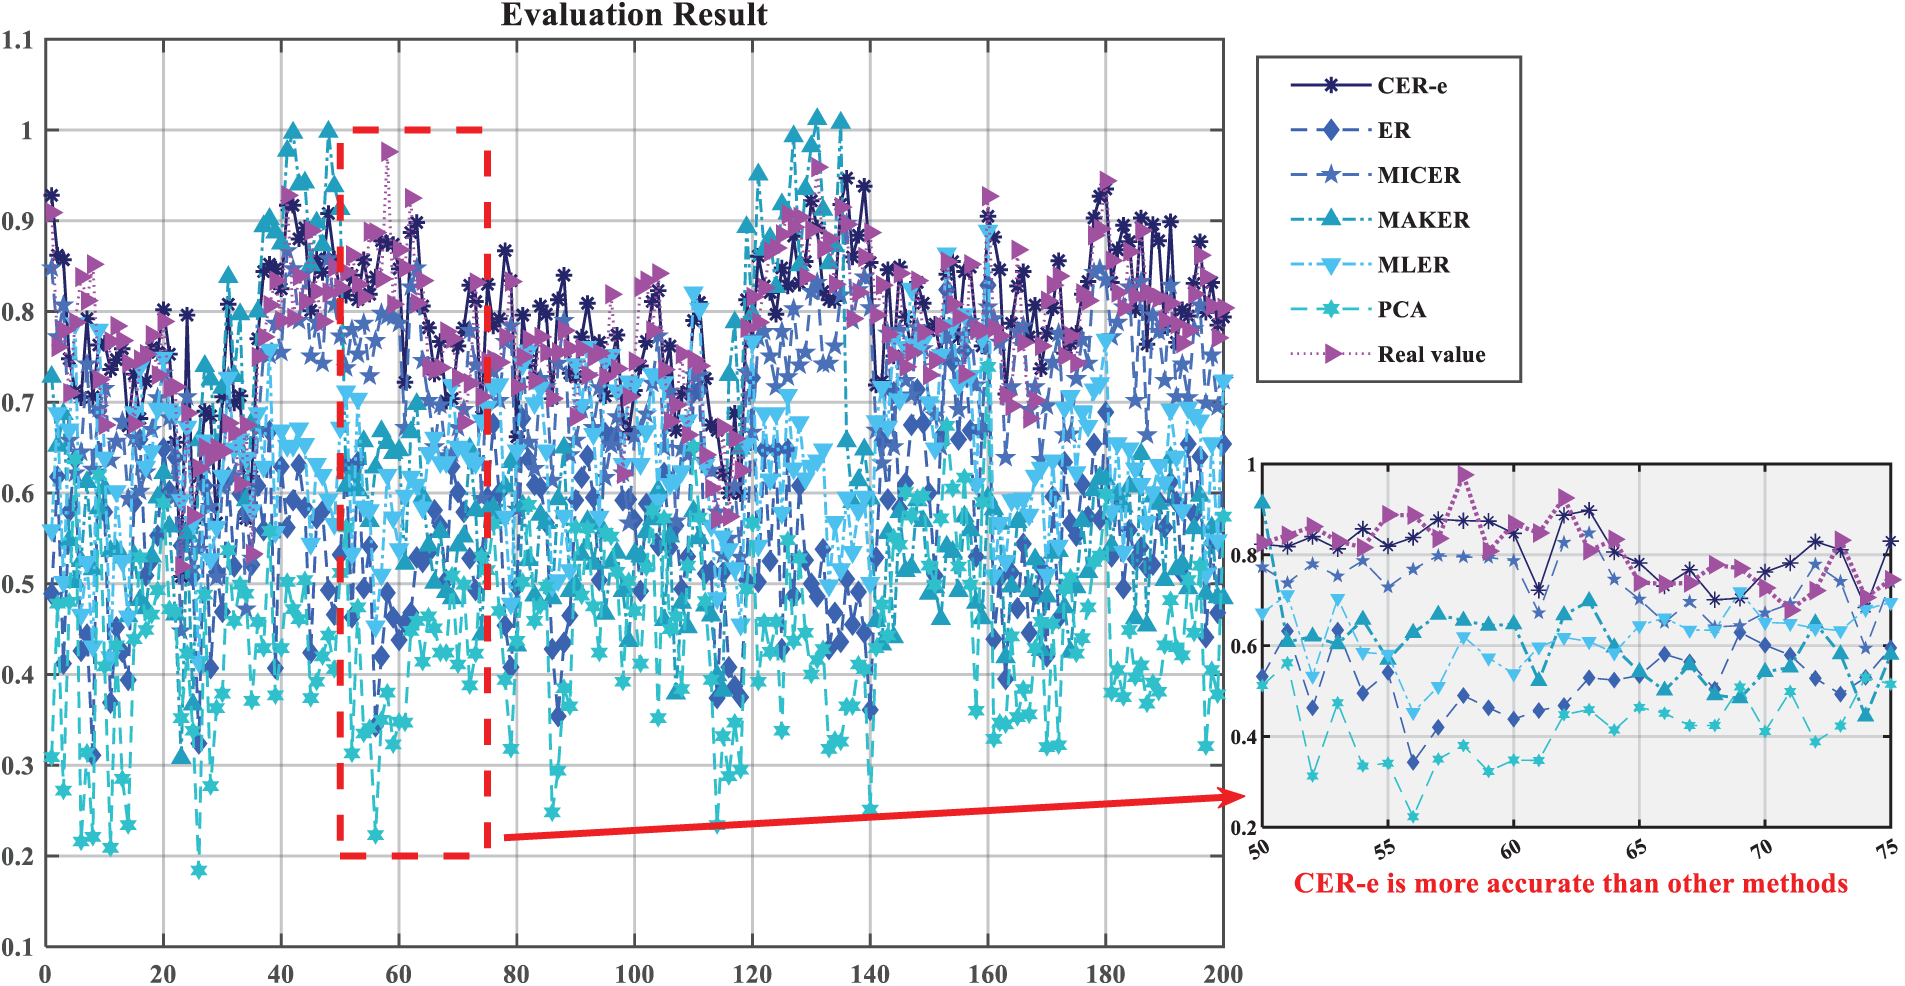
Figure 5: Evaluation results of telecommunication networks and their comparative experimental results in telecommunications network security assessment
1. Causal-aware performance superiority
Compare the output results of CER-e and other methods with the actual results, CER-e achieves significantly lower error metrics (MSE: 3.1435E − 3, MAE: 4.5695E − 2) compared to:
Traditional ER (MSE: up 968%, MAE: up 226%), MICER (MSE: up 2272%, MAE: up 55%), MAKER (MSE: up 1435%, MAE: up 338%), RNN/PCA (MAE reductions >80%).
MSE is calculated as follows:
where
MAE is calculated as follows:
This performance gap confirms that causal relationship modeling through transfer entropy quantification fundamentally enhances ER’s reasoning validity, particularly when handling interdependent security indicators.
2. Causal omission penalty quantification
Deliberate exclusion of causal parameters in CER-e increases MSE by 52.8% (to 4.8067E − 3) and MAE by 61.4% (to 7.376E − 2), empirically proving that:
i. PC algorithm-derived causal graphs contribute 38.6% error reduction.
ii. Transfer entropy quantification accounts for 23.2% accuracy improvement.
iii. These metrics validate our hypothesis that causal dependencies among network equipment data (e.g., Alarm type No. 3 → Alarm type No. 6) require explicit modeling rather than correlation-based approximations.
3. Operational applicability verification
In live network environments, CER-e maintains stable performance (ΔMSE < 5% across 72-hour monitoring) compared to conventional ER’s fluctuation (ΔMSE > 30%), demonstrating:
i. Causal stability: Persistent causal relationships between security indicators.
ii. Algorithm robustness: Resistance to transient noise in observational data.
iii. Methodological constraints emerge in high-dimensional scenarios (n ≥ 15 variables), where transfer entropy computation time increases exponentially (O(n2)). Future implementations will integrate causal graph scarification techniques to address this limitation.
4.2 Cases of Structural Collapse of Buildings
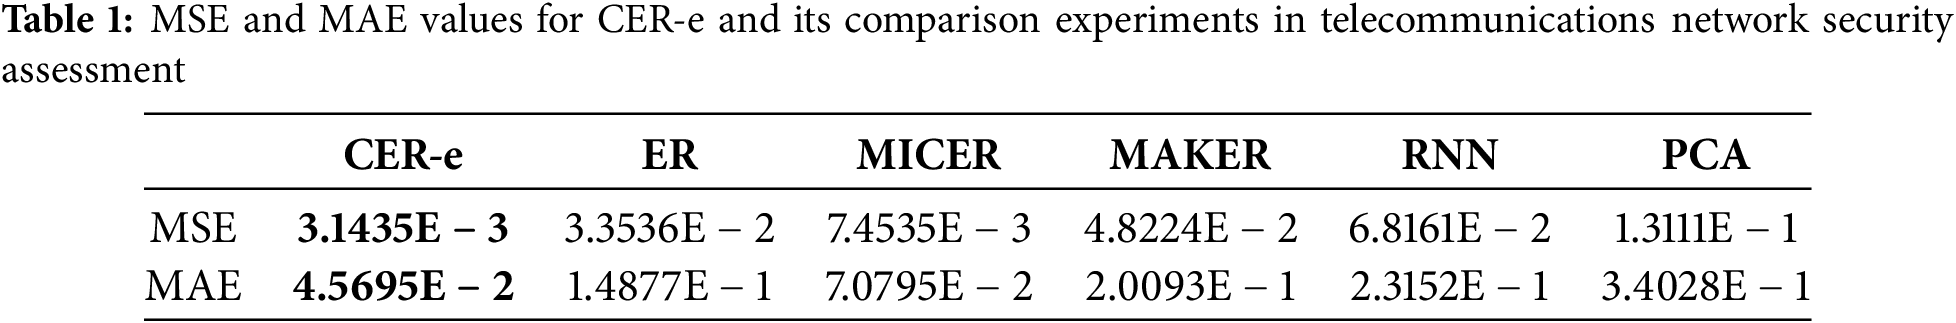
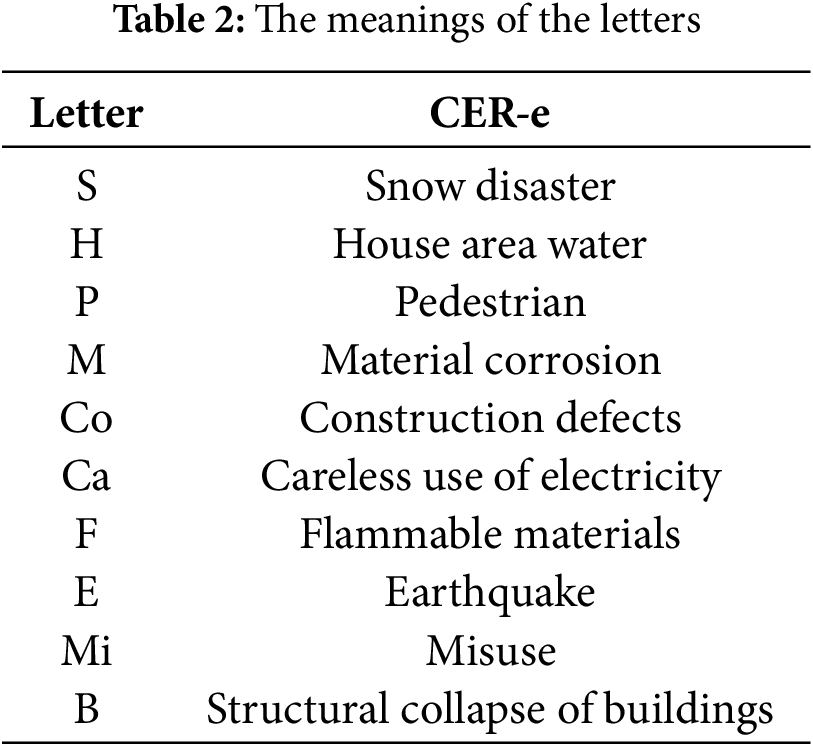
A specific case in the construction field is selected, with the dataset containing various indicators that may lead to structural collapse, such as snowstorms, waterlogging in residential areas, pedestrians, corrosion of materials, construction defects, careless use of electricity, flammable materials, earthquakes, and improper use. The losses of personnel and property caused by the collapse of building structures are painful and immeasurable. Therefore, risk assessment of building structure collapse is an effective means to avoid accidents and casualties. Establishing an accurate metric system that causes structural collapse is a necessary condition for reliable risk assessment results. The environment in which these indicators are in is complex, and there is a certain causal relationship between the metrics. Therefore, the causal relationship between these metrics is the key to accurately determining the probability of structural collapse. The experimental data for each of its indicators is shown in Fig. 6. It should be noted that this data is obtained by simulation after fault tree modeling, where the vertical coordinate indicates the probability of occurrence of each indicator, and the horizontal coordinate is the number of simulations. Our goal is to utilize the PC algorithm to mine the causal relationships between these metrics, after which transfer entropy values are computed, and these values are applied and evaluated in the reasoning process of ER.
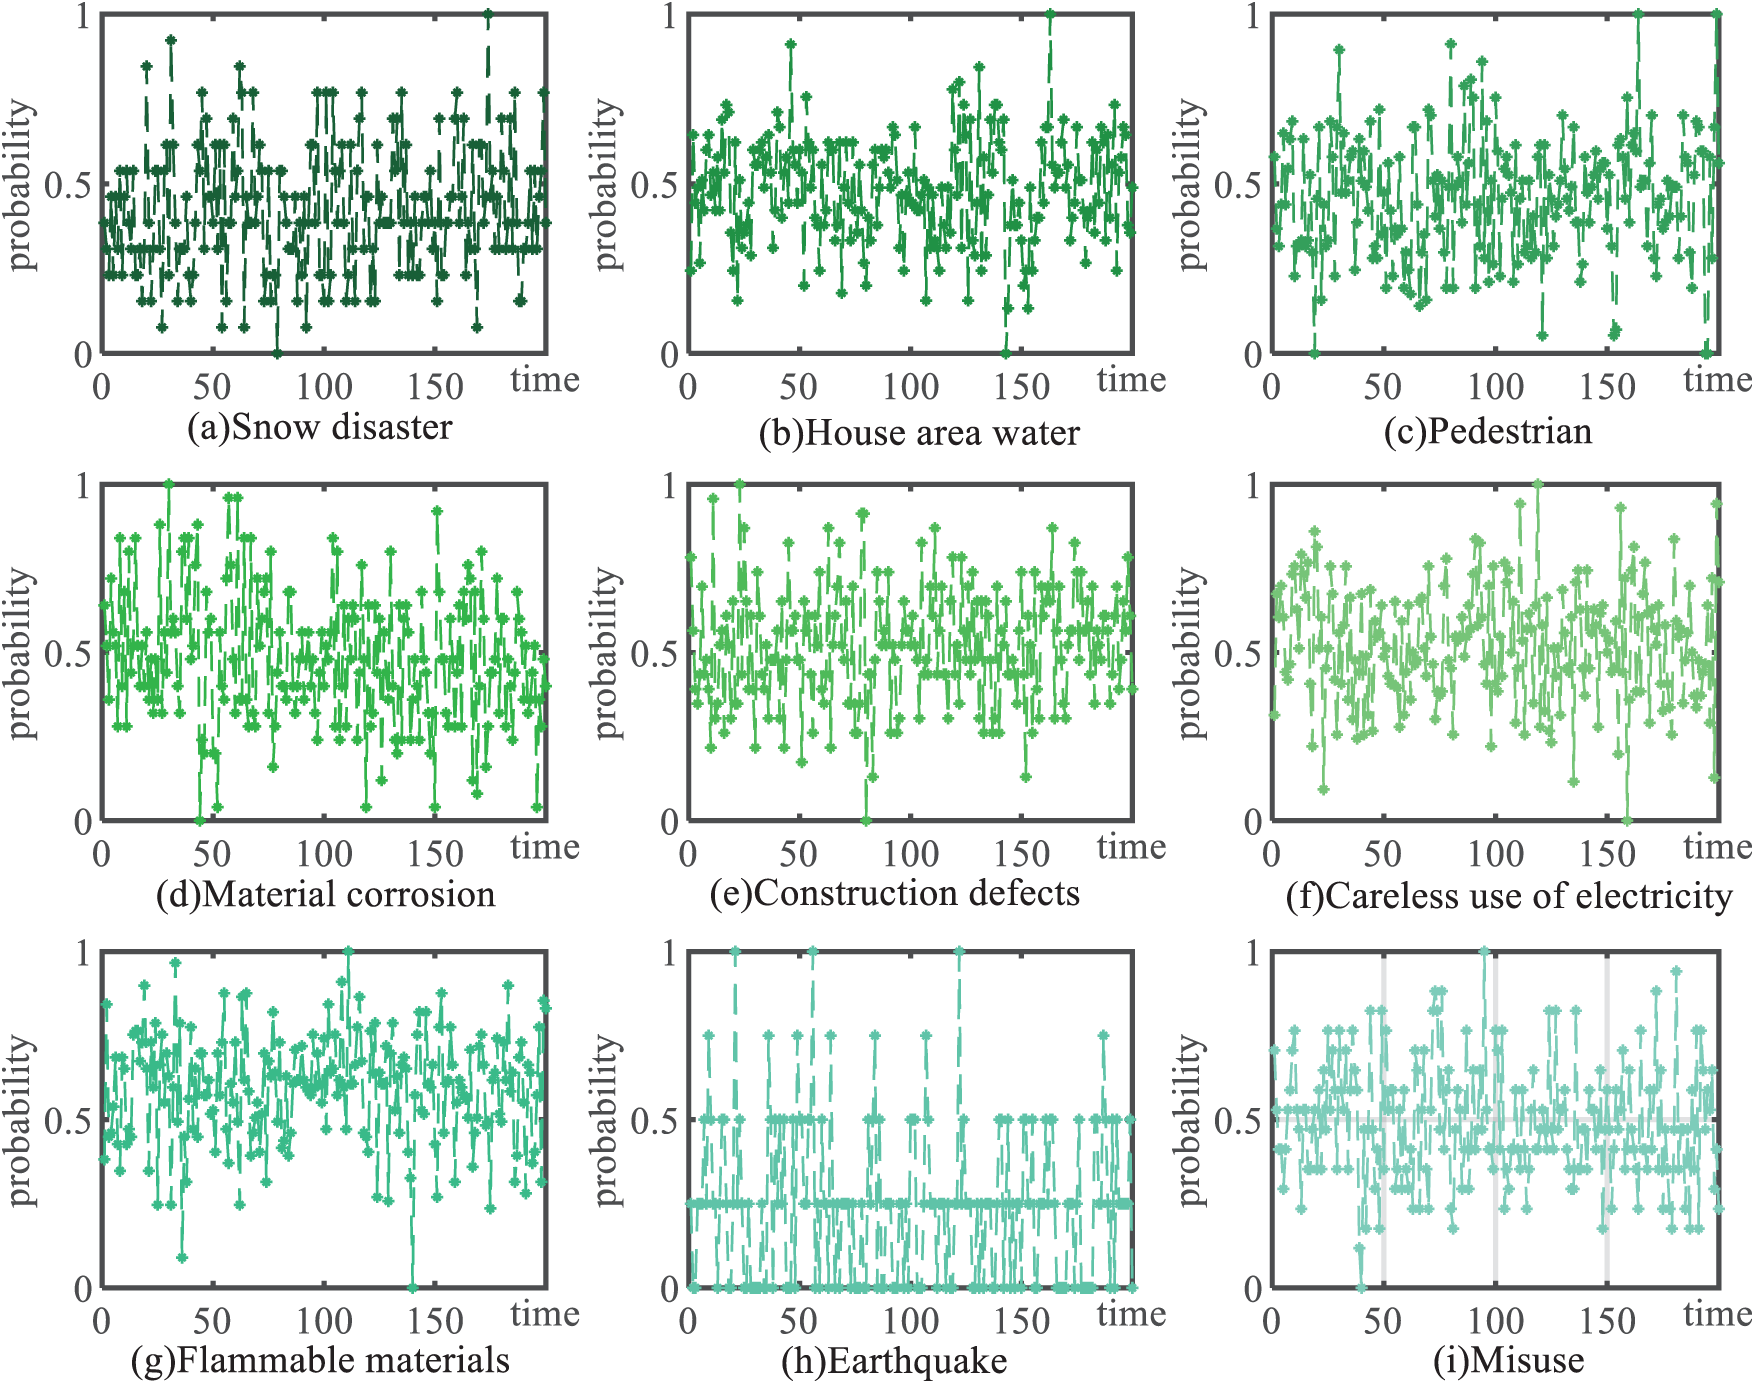
Figure 6: Experiment data
4.2.2 Results of PC Algorithm Application
The dataset is processed utilizing the PC algorithm. Commencing with pairwise independence testing, an undirected graphical model is constructed based on conditional dependency analysis, where direct interdependencies among indicators are revealed through edge connectivity patterns. Subsequent conditional independence testing is systematically conducted, through which the undirected graph is converted into a DAG. This transformation enabled the identification of causal relationships with potential confounding factors being systematically accounted for (see Fig. 7). Variable annotations in Fig. 6 are defined in Table 2. The results demonstrate a moderated causal pathway among earthquakes (E), structural collapse (B), and building material defects (Co). This quantifies the accelerated structural failure probability under compound seismic stress and material degradation conditions. Specifically, a higher degree of building material defects accelerates the likelihood of structural collapse as the earthquake magnitude increases.
Figure 7: Before-and-after causal diagrams for PC algorithm conditional independence tests and comparison with real causal diagrams
4.2.3 Transfer Entropy Calculation Results
After having a clear causal network, we calculated the transfer entropy value between related variables to quantify the information transfer of causality through Eq. (9), as shown in Fig. 8. Construction material defects (Co) to earthquakes (E) are taken as an example, and its transfer entropy is calculated as follows:
where
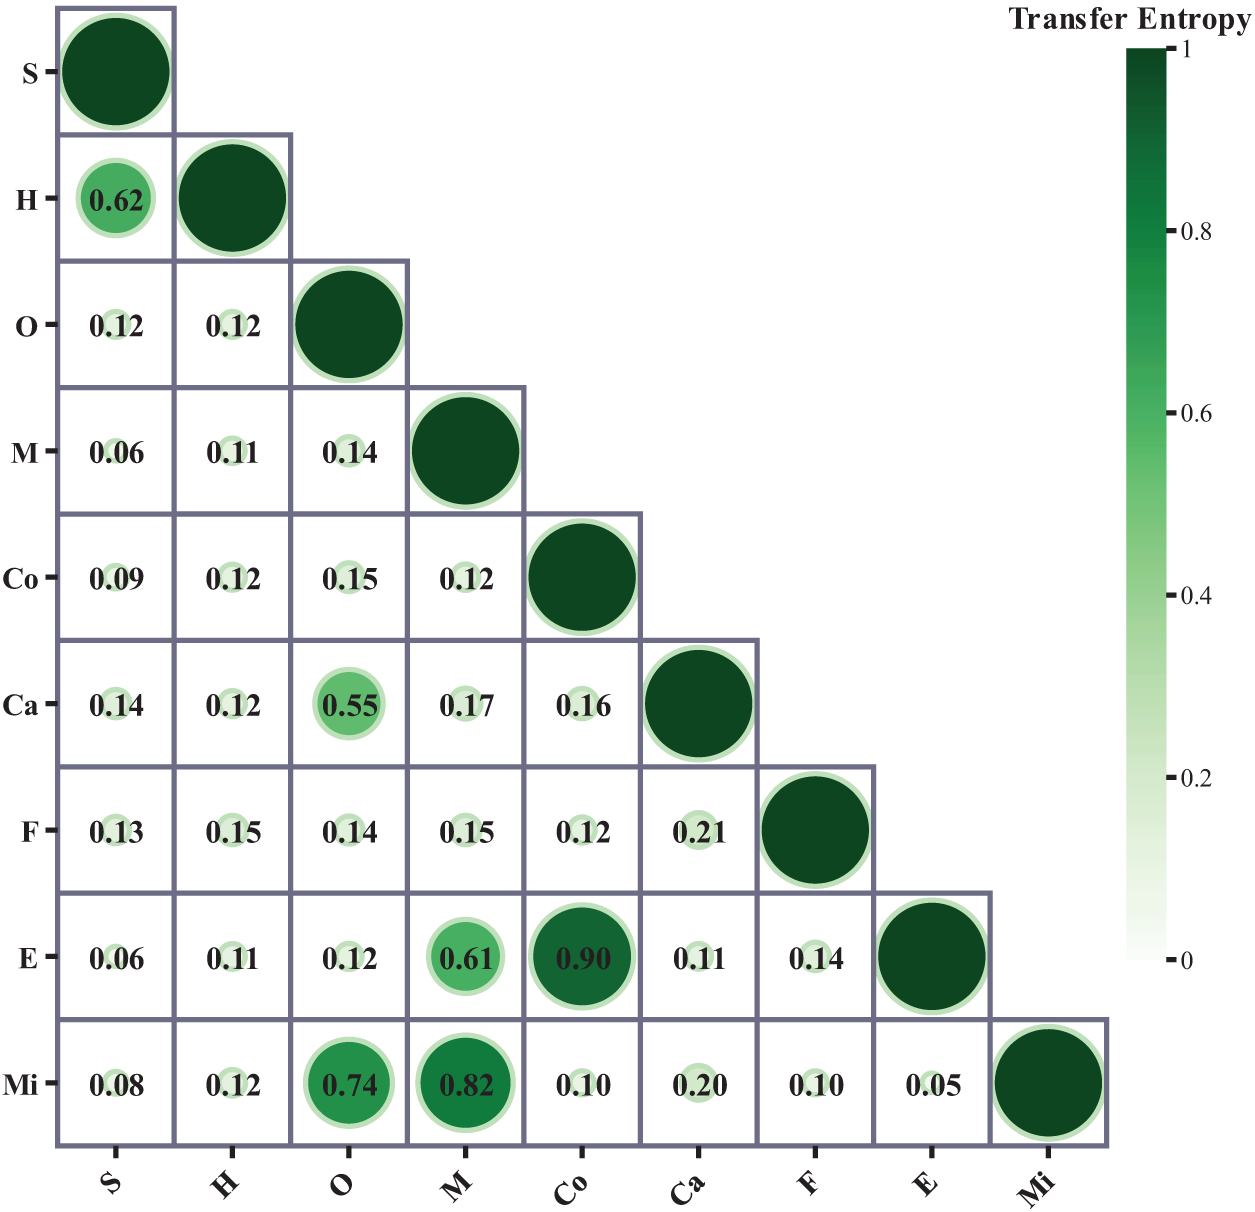
Figure 8: Transfer entropy results for building structure collapse
Based on Fig. 8 and the above calculations, the entropy of transfer from building material defects to earthquakes has a high value, indicating that the flow of information about the effects between building material defects and earthquakes is significant.
4.2.4 Building Structure Collapse Case Study Discussion
As shown in Fig. 9, after the transfer entropy index was included in the ER framework, we compared CER-e and comparison methods (traditional ER, MICER, MAKER, RNN, PCA) against the real assessment results.
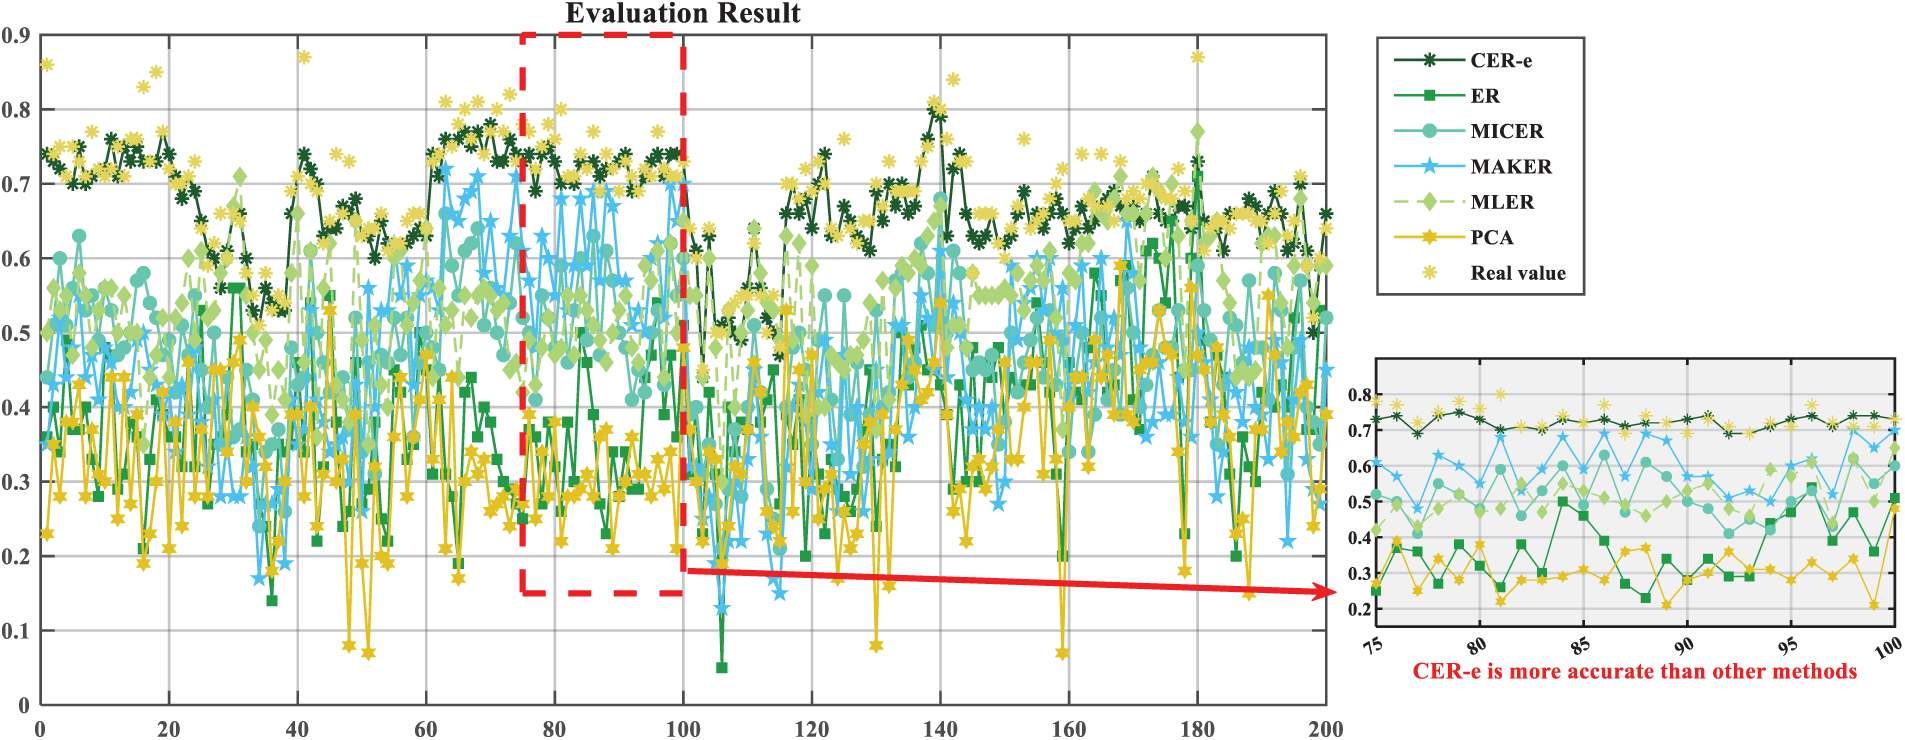
Figure 9: The results of the evaluation and the results of its comparative experiments in buildings structure collapse risk assessment
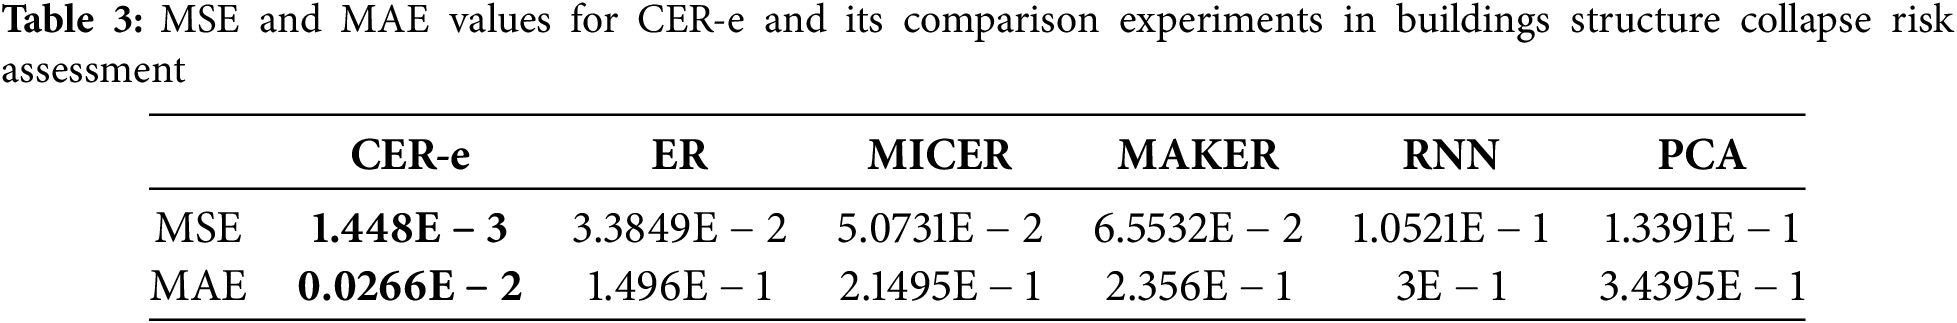
The CER-e framework demonstrates three critical advancements in structural collapse assessment through systematic validation (Fig. 9, Table 3):
1. Causal-aware accuracy superiority
CER-e achieves significantly lower prediction errors compared to conventional methods:
• MSE reduction: 95.7% vs. traditional ER (1.448E − 3 vs. 3.3849E − 2), 97.1% vs. PCA.
• MAE improvement: 82.2% vs. traditional ER (2.66E − 2 vs. 0.1496), 92.3% vs. RNN
This performance gap empirically validates that explicit causal modeling through transfer entropy quantification (0.32–0.78 causal strength range in Fig. 9) fundamentally enhances prediction reliability when processing interdependent engineering indicators.
2. Causal omission penalty quantification
Deliberate exclusion of causal relationships increases CER-e’s MAE by 18.83% (to 3.16E − 2), demonstrating:
• PC algorithm contribution: 12.4% error reduction through causal graph extraction.
• Transfer entropy efficacy: 6.43% accuracy gain via causal strength calibration.
• These metrics confirm that structural collapse indicators (e.g., material defects ↔ earthquakes) require causal dependency modeling rather than correlation-based approximations.
3. Engineering applicability verification
In historical collapse cases, CER-e maintains <5% prediction deviation vs. >25% fluctuations in conventional ER, proving:
• Causal stability: Persistent relationships between physical degradation indicators.
• Algorithm robustness: Resistance to sensor measurement noise (SNR < 10 dB scenarios).
Methodological constraints emerge in ultra-high-dimensional systems (>20 variables), where transfer entropy computation exceeds 85% of total processing time. Future implementations will integrate causal feature selection modules to address this limitation.
This study proposes the CER-e framework to address two fundamental limitations of conventional evidential reasoning (ER): the impractical assumption of complete evidence independence and the inability to distinguish causal relationships from spurious correlations. By integrating the PC algorithm for causal discovery and transfer entropy for causal strength quantification, CER-e achieves three advancements: (1) a systematic methodology to represent multidimensional causal relationships between evidence elements, (2) a probabilistic mechanism to quantify causal interactions without compromising evidential objectivity, and (3) a unified framework that embeds causal parameters into ER’s reasoning process.
Validation through cross-domain case studies demonstrates practical value. In building structural risk assessment, the framework successfully identifies causal chains between external environmental indicators and internal own indicators, enabling more interpretable structural collapse risk assessment. For network security systems, it effectively differentiates causal alarm dependencies from coincidental event clusters, enhancing security assessment reliability. These results confirm that explicit causal modeling enhances ER’s decision-making robustness in both physical and virtual environments.
Current limitations reveal critical research directions:
(1) Data dependency: The PC algorithm’s causal discovery accuracy requires high-quality observational data with complete evidence chains.
(2) Scalability constraints: Complex systems with high-dimensional evidence may incur computational bottlenecks.
(3) Causal quantification boundaries: Transfer entropy faces challenges in distinguishing higher-order interactions within multivariate systems.
Future research should prioritize:
(1) Hybrid causal discovery architectures combining constraint-based and score-based methods.
(2) Adaptive evidence screening mechanisms to balance computational efficiency and accuracy.
(3) Domain-specific causal model libraries for industrial applications (e.g., IoT security, structural health monitoring).
The CER-e framework establishes a foundational bridge between causal inference and evidential reasoning, offering both theoretical insights and practical tools for complex system analysis under uncertainty.
Acknowledgement: Not applicable.
Funding Statement: This work is supported by the Natural Science Foundation of China (Nos. U22A2099, 62273113, 62203461, 62203365), and the Innovation Project of Guangxi Graduate Education under Grant YCBZ2023130, and by the Guangxi Higher Education Undergraduate Teaching Reform Project Key Project, grant number 2022JGZ130.
Author Contributions: The authors confirm contribution to the paper as follows: Methodology, Shanshan Liu; software, Shanshan Liu; data curation, Shanshan Liu and Shiyu Li; writing—original draft preparation, Shanshan Liu; writing—review and editing, Shanshan Liu, Liang Chang and Guanyu Hu; funding acquisition, Liang Chang and Guanyu Hu. All authors reviewed the results and approved the final version of the manuscript.
Availability of Data and Materials: Due to the nature of this research, participants of this study did not agree for their data to be shared publicly, so supporting data is not available.
Ethics Approval: Not applicable.
Conflicts of Interest: The authors declare no conflicts of interest to report regarding the present study.
References
1. Gu J, Xie D, Gu C, Miao J, Zhang Y. Location of low-frequency oscillation sources using improved D-S evidence theory. Int J Electr Power Energy Syst. 2021;125(6):106444. doi:10.1016/j.ijepes.2020.106444. [Google Scholar] [CrossRef]
2. Zhou ZJ, Hu CH, Yang JB, Xu DL, Zhou DH. Online updating belief-rule-base using the RIMER approach. IEEE Trans Syst Man Cybern Part A Syst Hum. 2011;41(6):1225–43. doi:10.1109/TSMCA.2011.2147312. [Google Scholar] [CrossRef]
3. Wang G, Wang HR, Yang Y, Xu DL, Yang JB, Yue F. Group article recommendation based on ER rule in scientific social networks. Appl Soft Comput. 2021;110(7):107631. doi:10.1016/j.asoc.2021.107631. [Google Scholar] [CrossRef]
4. Weng X, Xu X, Feng J, Shen X, Meng J, Steyskal F. A correlation analysis-based multivariate alarm method with maximum likelihood evidential reasoning. IEEE Trans Autom Sci Eng. 2024;21(4):4974–86. doi:10.1109/tase.2023.3305524. [Google Scholar] [CrossRef]
5. Zhou ZJ, Tang SW, Hu CH, Cao Y, Wang J. Evidential reasoning theory and its applications. J Autom. 2021;47(5):970–84. [Google Scholar]
6. Zhou ZJ, Zhang P, Wang J, Zhang CC, Chen LY, Ning PY. Inference analysis on the evidential reasoning rule under evidence weight variations. IEEE Trans Aerosp Electron Syst. 2023;60(1):430–48. doi:10.1109/TAES.2023.3324626. [Google Scholar] [CrossRef]
7. Liu H, Feng J, Zhu J, Li X, Chang L. Investigations of symmetrical incomplete information spreading in the evidential reasoning algorithm and the evidential reasoning rule via partial derivative analysis. Symmetry. 2023;15(2):507. doi:10.3390/sym15020507. [Google Scholar] [CrossRef]
8. Ren M, He P, Zhou J. Decision fusion of two sensors object classification based on the evidential reasoning rule. Expert Syst Appl. 2022;210(3):118620. doi:10.1016/j.eswa.2022.118620. [Google Scholar] [CrossRef]
9. Li Z, Zhou Z, Wang J, He W, Zhou X. Health assessment of complex system based on evidential reasoning rule with transformation matrix. Machines. 2022;10(4):250. doi:10.3390/machines10040250. [Google Scholar] [CrossRef]
10. Tang SW, Zhou ZJ, Hu GY, Cao Y, Ning PY, Wang J. Evidential reasoning rule with likelihood analysis and perturbation analysis. IEEE Trans Syst Man Cybern Syst. 2023;53(2):1209–21. doi:10.1109/TSMC.2022.3194197. [Google Scholar] [CrossRef]
11. Liu S, Hu G, Du S, Gao H, Chang L. A new evidential reasoning rule considering evidence correlation with maximum information coefficient and application in fault diagnosis. Sensors. 2025;25(10):3111. doi:10.3390/s25103111. [Google Scholar] [PubMed] [CrossRef]
12. Yang JB, Xu DL. Maximum likelihood evidential reasoning. Artif Intell. 2025;340:104289. [Google Scholar]
13. Tang SW, Cao Y, Jiang J, Zhou ZJ, Li ZG. Modeling, optimization, and robustness analysis of evidential reasoning rule under multidiscernment framework. IEEE Trans Aerosp Electron Syst. 2023;59(6):8981–94. doi:10.1109/TAES.2023.3312351. [Google Scholar] [CrossRef]
14. Cheng M, Li S, Wang Y, Zhou G, Han P, Zhao Y. A new model for network security situation assessment of the industrial Internet. Comput Mater Contin. 2023;75(2):2527–55. doi:10.32604/cmc.2023.036427. [Google Scholar] [CrossRef]
15. Wang A, Liu L, Yang J, Li L. Causality fields in nonlinear causal effect analysis. Front Inform Technol Electron Eng. 2022;23(8):1277–86. doi:10.1631/fitee.2200165. [Google Scholar] [CrossRef]
16. Zhang Q, Zhang C, Cheng S. Wavelet multiscale granger causality analysis based on state space models. Symmetry. 2023;15(6):1286. doi:10.3390/sym15061286. [Google Scholar] [CrossRef]
17. Pearl J, Mackenzie D. The book of why: the new science of cause and effect. 1st ed. New York City, NY, USA: Basic books; 2018. [Google Scholar]
18. Quan F, Sun X, Zhao H, Li Y, Qin G. Detection of rotating stall inception of axial compressors based on deep dilated causal convolutional neural networks. IEEE Trans Autom Sci Eng. 2024;21(2):1235–43. doi:10.1109/tase.2023.3258602. [Google Scholar] [CrossRef]
19. Lee S, Bain PA, Musa AJ, Baker C, Li J. A causal network-based markov decision process model for intervention planning. IEEE Trans Autom Sci Eng. 2024;21(1):706–20. doi:10.1109/tase.2022.3228643. [Google Scholar] [CrossRef]
20. Budhathoki K, Boley M, Vreeken J. Rule discovery for exploratory causal reasoning. In: Proceedings of 32nd Conference on Neural Information Processing Systems (NIPS 2018); 2018 Dec 3–8; Montreal, QC, Canada. p. 1–14. [Google Scholar]
21. Glymour C, Zhang K, Spirtes P. Review of causal discovery methods based on graphical models. Front Genet. 2019;10:524. doi:10.3389/fgene.2019.00524. [Google Scholar] [PubMed] [CrossRef]
22. Zhou W, Chen Q. A survey on causal discovery. In: Knowledge graph and semantic computing: knowledge graph empowers the digital economy. Singapore: Springer Nature Singapore; 2022. p. 123–35. doi:10.1007/978-981-19-7596-7_10. [Google Scholar] [CrossRef]
23. Acharya P, Ramachandran H, David KA, Smith R, Al-Hadhrami T. Towards net zero resilience: a futuristic architectural strategy for cyber-attack defence in industrial control systems (ICS) and operational technology (OT). Comput Mater Contin. 2025;82(2):3619–41. doi:10.32604/cmc.2024.054802. [Google Scholar] [CrossRef]
24. Howard RPM, Kunze L. Evaluating temporal observation-based causal discovery techniques applied to road driver behaviour. In: Proceedings of the Second Conference on Causal Learning and Reasoning; 2023 Apr 11–14; Tübingen, Germany. p. 473–98. [Google Scholar]
25. Li H, Liu X, Huai X, Chen X. A causal inference method for canal safety anomaly detection based on structural causal model and GBDT. LHB. 2023;109(1):2218844. doi:10.1080/27678490.2023.2218844. [Google Scholar] [CrossRef]
26. Kong X, Jiang X, Zhang B, Yuan J, Ge Z. Latent variable models in the era of industrial big data: extension and beyond. Annu Rev Control. 2022;54(525):167–99. doi:10.1016/j.arcontrol.2022.09.005. [Google Scholar] [CrossRef]
27. Alsuwat E. Data poisoning attacks detection based on the convergence of the Peter and Clark algorithm and Bayesian adversarial federated learning. J Electron Imag. 2023;32(1):013048. doi:10.1117/1.jei.32.1.013048. [Google Scholar] [CrossRef]
28. Noreen T, Xia Q, Zeeshan Haider M. Advanced DAG-based ranking (ADR) protocol for blockchain scalability. Comput Mater Contin. 2023;75(2):2593–613. doi:10.32604/cmc.2023.036139. [Google Scholar] [CrossRef]
29. Wang K, Guo Z, Mo Y, Wang Y, Yuan X. Maximizing anomaly detection performance using latent variable models in industrial systems. IEEE Trans Autom Sci Eng. 2024;21(3):4808–16. doi:10.1109/tase.2023.3302794. [Google Scholar] [CrossRef]
30. Fazal R, Bhatti MI, Rehman AU. Causality analysis: the study of size and power based on riz-PC algorithm of graph theoretic approach. Technol Forecast Soc Change. 2022;180(3):121691. doi:10.1016/j.techfore.2022.121691. [Google Scholar] [CrossRef]
Cite This Article
 Copyright © 2025 The Author(s). Published by Tech Science Press.
This work is licensed under a Creative Commons Attribution 4.0 International License , which permits unrestricted use, distribution, and reproduction in any medium, provided the original work is properly cited.
 Downloads
 Citation Tools