
 Submit a Paper
 Propose a Special lssue
 Open Access
ARTICLE
SMOTE-Optimized Machine Learning Framework for Predicting Retention in Workforce Development Training
Faculty of Computer and Information Systems, Islamic University of Madinah, P.O. Box 170, Madinah, 42351, Saudi Arabia
* Corresponding Author: Abdulaziz Alshahrani. Email:
Computers, Materials & Continua 2025, 85(2), 4067-4090. https://doi.org/10.32604/cmc.2025.065211
Received 06 March 2025; Accepted 06 May 2025; Issue published 23 September 2025
 View Full Text
 Download PDF
Abstract
High dropout rates in short-term job skills training programs hinder workforce development. This study applies machine learning to predict program completion while addressing class imbalance challenges. A dataset of 6548 records with 24 demographic, educational, program-specific, and employment-related features was analyzed. Data preprocessing involved cleaning, encoding categorical variables, and balancing the dataset using the Synthetic Minority Oversampling Technique (SMOTE), as only 15.9% of participants were dropouts. six machine learning models—Logistic Regression, Random Forest, Support Vector Machine, K-Nearest Neighbors, Naïve Bayes, and XGBoost—were evaluated on both balanced and unbalanced datasets using an 80-20 train-test split. Performance was assessed using Accuracy, Precision, Recall, F1-score, and ROC-AUC. XGBoost achieved the highest performance on the balanced dataset, with an F1-score of 0.9200 and a ROC-AUC of 0.9684, followed by Random Forest. These findings highlight the potential of machine learning for early identification of dropout trainees, aiding in retention strategies for workforce training. The results support the integration of predictive analytics to optimize intervention efforts in short-term training programs.Keywords
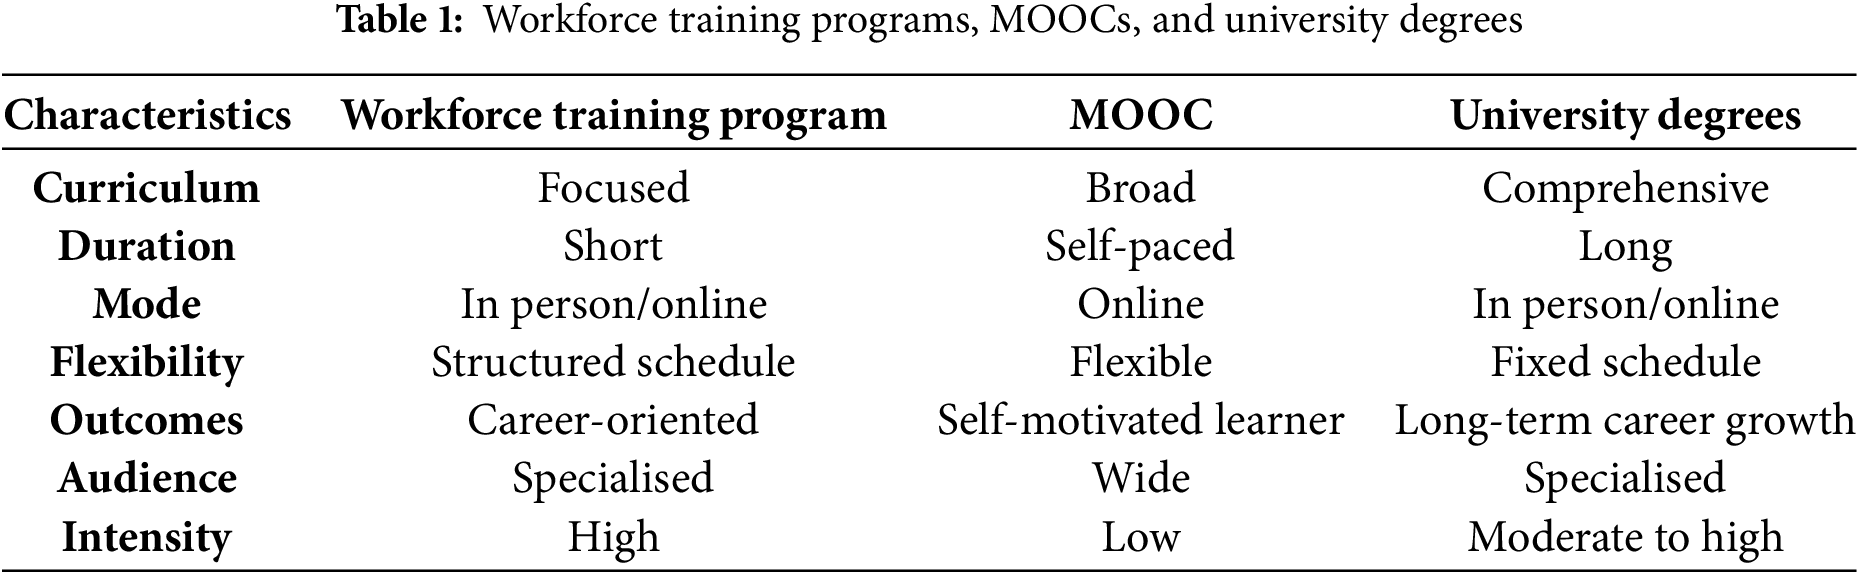
Workforce training programs play a crucial role in equipping individuals with skills tailored to evolving labor market demands. Short-term workforce training programs, lasting a few weeks or months, offer a fast and effective way to acquire job-specific competencies. These programs differ from Massive Open Online Courses (MOOCs) and university degree programs in their structure, intensity, and learner engagement. MOOCs are typically self-paced and flexible, designed for a broad audience with varying levels of interaction, whereas university degrees provide long-term, structured education aimed at foundational knowledge and career progression. Short-term workforce training programs, by contrast, are structured, intensive, and targeted to meet immediate labor market needs [1].
However, a persistent challenge in such programs is the high rate of non-completion. Unlike longer academic pathways that permit periodic feedback and intervention, short-term training requires early identification of at-risk learners to mitigate dropout. Traditional evaluation and intervention methods often fall short, and there remains limited empirical research dedicated to understanding or predicting attrition in this specific educational context [2].
One underlying issue is the use of a one-size-fits-all instructional model, which fails to account for diverse learning styles, life situations, and levels of engagement [3]. In response, machine learning (ML) and predictive analytics offer powerful tools for uncovering hidden patterns in learner data—enabling more tailored instructional design and proactive interventions. By analyzing program, demographic, and behavioral factors, ML can help institutions optimize resource allocation, ensuring that participants at higher risk of dropout receive additional support such as mentoring, financial assistance, or flexible scheduling [4]. These models not only improve retention outcomes but also enhance the overall efficiency and inclusivity of training initiatives [5,6]. Table 1 provides a comparative overview of workforce training programs, MOOCs, and university degrees, highlighting key differences in structure, duration, learner engagement, and educational objectives.
Moreover, predictive analytics extends beyond individual-level intervention. By linking dropout patterns to learner profiles and program design variables, institutions can make evidence-based refinements to curriculum delivery, instructional strategies, and program structure [7]. In doing so, they can improve program effectiveness, evaluate economic feasibility, and align educational offerings with current workforce demands [2].
Despite these opportunities, several challenges persist. A major barrier is the lack of large, public, and representative datasets focused specifically on short-term workforce training, which limits benchmarking and validation of predictive models. Furthermore, while ML has been successfully applied in higher education and MOOCs, its application in short-duration, skill-based training environments remains underexplored [4]. Additionally, structural inequalities—such as financial hardship, caregiving responsibilities, or limited digital access—continue to disproportionately affect underrepresented learners, yet these socio-economic dimensions remain insufficiently addressed in most dropout prediction models [8].
To address these gaps, this study makes four key contributions. First, it reviews existing literature on dropout prediction in workforce training to contextualize the unique challenges of short-term programs. Second, it introduces and analyzes a large-scale, domain-specific dataset tailored to vocational training in a Middle Eastern context. Third, it evaluates and compares multiple machine learning models in terms of their predictive effectiveness and response to class imbalance through SMOTE. Fourth, it uses SHAP (SHapley Additive exPlanations) analysis to identify and interpret the most influential predictors of dropout, offering interpretable insights for policy and intervention design.
Research Questions
Given the persistent challenge of dropout in short-term workforce training programs, this study adopts a data-driven approach to understanding and addressing retention. Drawing on previous literature, practical needs, and methodological considerations, the research is guided by the following three questions:
1. How effective are machine learning models in identifying early signs of dropout in short-term vocational training programs?This question seeks to evaluate the performance of various machine learning algorithms in predicting learner attrition. The goal is to determine which models offer reliable early detection, allowing institutions to act before disengagement leads to dropout.
2. How does class imbalance affect the performance of these models, and what techniques can improve prediction for the minority class?>Educational datasets often contain far fewer dropout cases than completions, which can skew predictive performance. This question addresses the methodological impact of class imbalance and explores whether resampling techniques, such as SMOTE, can improve model accuracy and sensitivity.
3. What are the key demographic, educational, and program-related predictors of dropout, and how do they align with existing research on learner retention?Beyond prediction, this question focuses on interpretability. Using model-based feature analysis, the study identifies which factors most influence dropout risk and examines how these findings compare with established retention literature. These questions structure the investigation from algorithmic evaluation to practical understanding, allowing the study to contribute both technically and conceptually to improving learner retention in vocational training settings.
Retention in workforce development training has become a key concern in both education and labor policy, particularly as governments and institutions seek to upskill diverse populations and respond to shifting labor market demands. While earlier studies often focused on individual-level dropout predictors or program design flaws, more recent approaches view retention as the outcome of a dynamic system—shaped by learner motivation, institutional strategy, labor market pressures, and the psychological demands placed on participants. Understanding retention through this multidimensional lens offers a more realistic foundation for developing effective interventions.
Emerging evidence highlights the importance of psychosocial alignment between learners and their vocational trajectories. Many participants in workforce training programs are adult learners navigating career transitions, economic displacement, or re-entry into education. For these individuals, persistence is often tied not only to skill development but to the perceived relevance and personal meaning of the training experience. Tyler et al. [9] emphasize that retention is strongest when training aligns with learners’ intrinsic values—such as contributing to a profession, re-establishing purpose, or achieving social mobility—and when these values are supported by structural elements like flexible delivery and clear career pathways. These findings underscore that retention is not merely a function of course completion but of affective engagement and future-oriented thinking.
Institutional responses play an equally critical role. Yamjal and Al-Sa’di [10] identify several institutional practices that enhance retention, including early identification of at-risk learners, formative feedback mechanisms, and the cultivation of peer learning communities. These strategies align with the Job Demands–Resources (JD-R) model, which conceptualizes retention as a balance between the cognitive and emotional demands placed on learners (e.g., upskilling, assessments, job insecurity) and the support structures made available to help manage those demands (e.g., academic guidance, mentoring, digital access, and financial assistance). When resources are lacking, even highly motivated learners are vulnerable to burnout and withdrawal. Conversely, well-supported learners demonstrate higher levels of resilience, engagement, and program completion.
At the systemic level, retention is shaped by labor market dynamics that often lie beyond the control of training providers or learners themselves. In sectors characterized by high turnover and rapidly evolving skill requirements, employers may be hesitant to invest in long-term staff development. As noted in [11] observe that firms in competitive service industries frequently recruit externally rather than invest in training, especially when the return on training is uncertain.
In recent years, there has been growing interest in data-driven approaches to improving retention, particularly through machine learning (ML) and predictive analytics.
Asselman et al. [8] enhanced the Probabilistic Factor Analysis (PFA) model using ensemble learning methods such as Random Forest, AdaBoost, and XGBoost. Their findings indicate that XGBoost significantly improves prediction accuracy. However, the study’s reliance on specific environmental conditions raises concerns about generalizability. Additionally, the computational requirements and scalability of the model were not extensively discussed, limiting its applicability to larger datasets.
Swacha and Muszyńska [12] examined demographic factors as predictors of dropout in two programming MOOCs. They found that age and education level were effective predictors in a Python MOOC but showed inconsistent results in a JavaScript MOOC. This suggests that demographic predictors may vary by course type, requiring further evaluation. However, the study was limited by its small sample size and lack of analysis on course design, which may also influence dropout rates.
Gharahighehi et al. [13] introduced a model that integrates Bayesian Personalized Ranking (BPR) with survival analysis to predict dropout in MOOCs. Their method, TBPR, demonstrated improved performance compared to standard models. However, the study primarily focused on relevance metrics, such as Normalized Discounted Cumulative Gain (NDCG) and Recall, without exploring alternative survival models or multi-task learning techniques, which could further enhance predictive accuracy.
Psathas et al. [14] addressed dropout prediction in MOOCs using oversampling techniques to handle class imbalance. They identified employment status, prior experiences, and self-regulated learning (SRL) as key predictors. However, the study relied on self-reported SRL data, which may not fully reflect actual learning behaviors. Additionally, the findings were based on a single MOOC dataset, making generalization to other contexts challenging.
Niyogisubizo et al. [15] proposed a stacking ensemble model, combining Random Forest, XGBoost, Gradient Boosting, and Feed-Forward Neural Networks to predict university dropout. While the model achieved higher prediction accuracy and AUC, it was limited by a small dataset and a lack of di.verse features. Socio-economic and psychological factors, which are crucial in dropout prediction, were not included. Additionally, the study did not address the risk of overfitting, as high-capacity models were applied to a limited dataset.
Mubarak et al. [16] developed predictive models using regularized Logistic Regression and an Input–Output Hidden Markov Model (IOHMM) to identify students at risk of dropping out from online courses. Their models achieved an accuracy of approximately 84% by analyzing weekly interaction logs and assignment scores. However, the study overlooked key factors such as student motivation and socio-economic conditions. Additionally, it did not discuss the feasibility of real-time interventions based on the model’s predictions.
Xing and Du [17] applied a deep learning framework to predict dropout in MOOCs, generating individual dropout probabilities for targeted interventions. Although their model outperformed traditional methods in predictive accuracy, it raised concerns about interpretability and scalability across different course contexts. Furthermore, there was no evidence provided on whether personalized interventions based on the model’s predictions could effectively reduce dropout rates
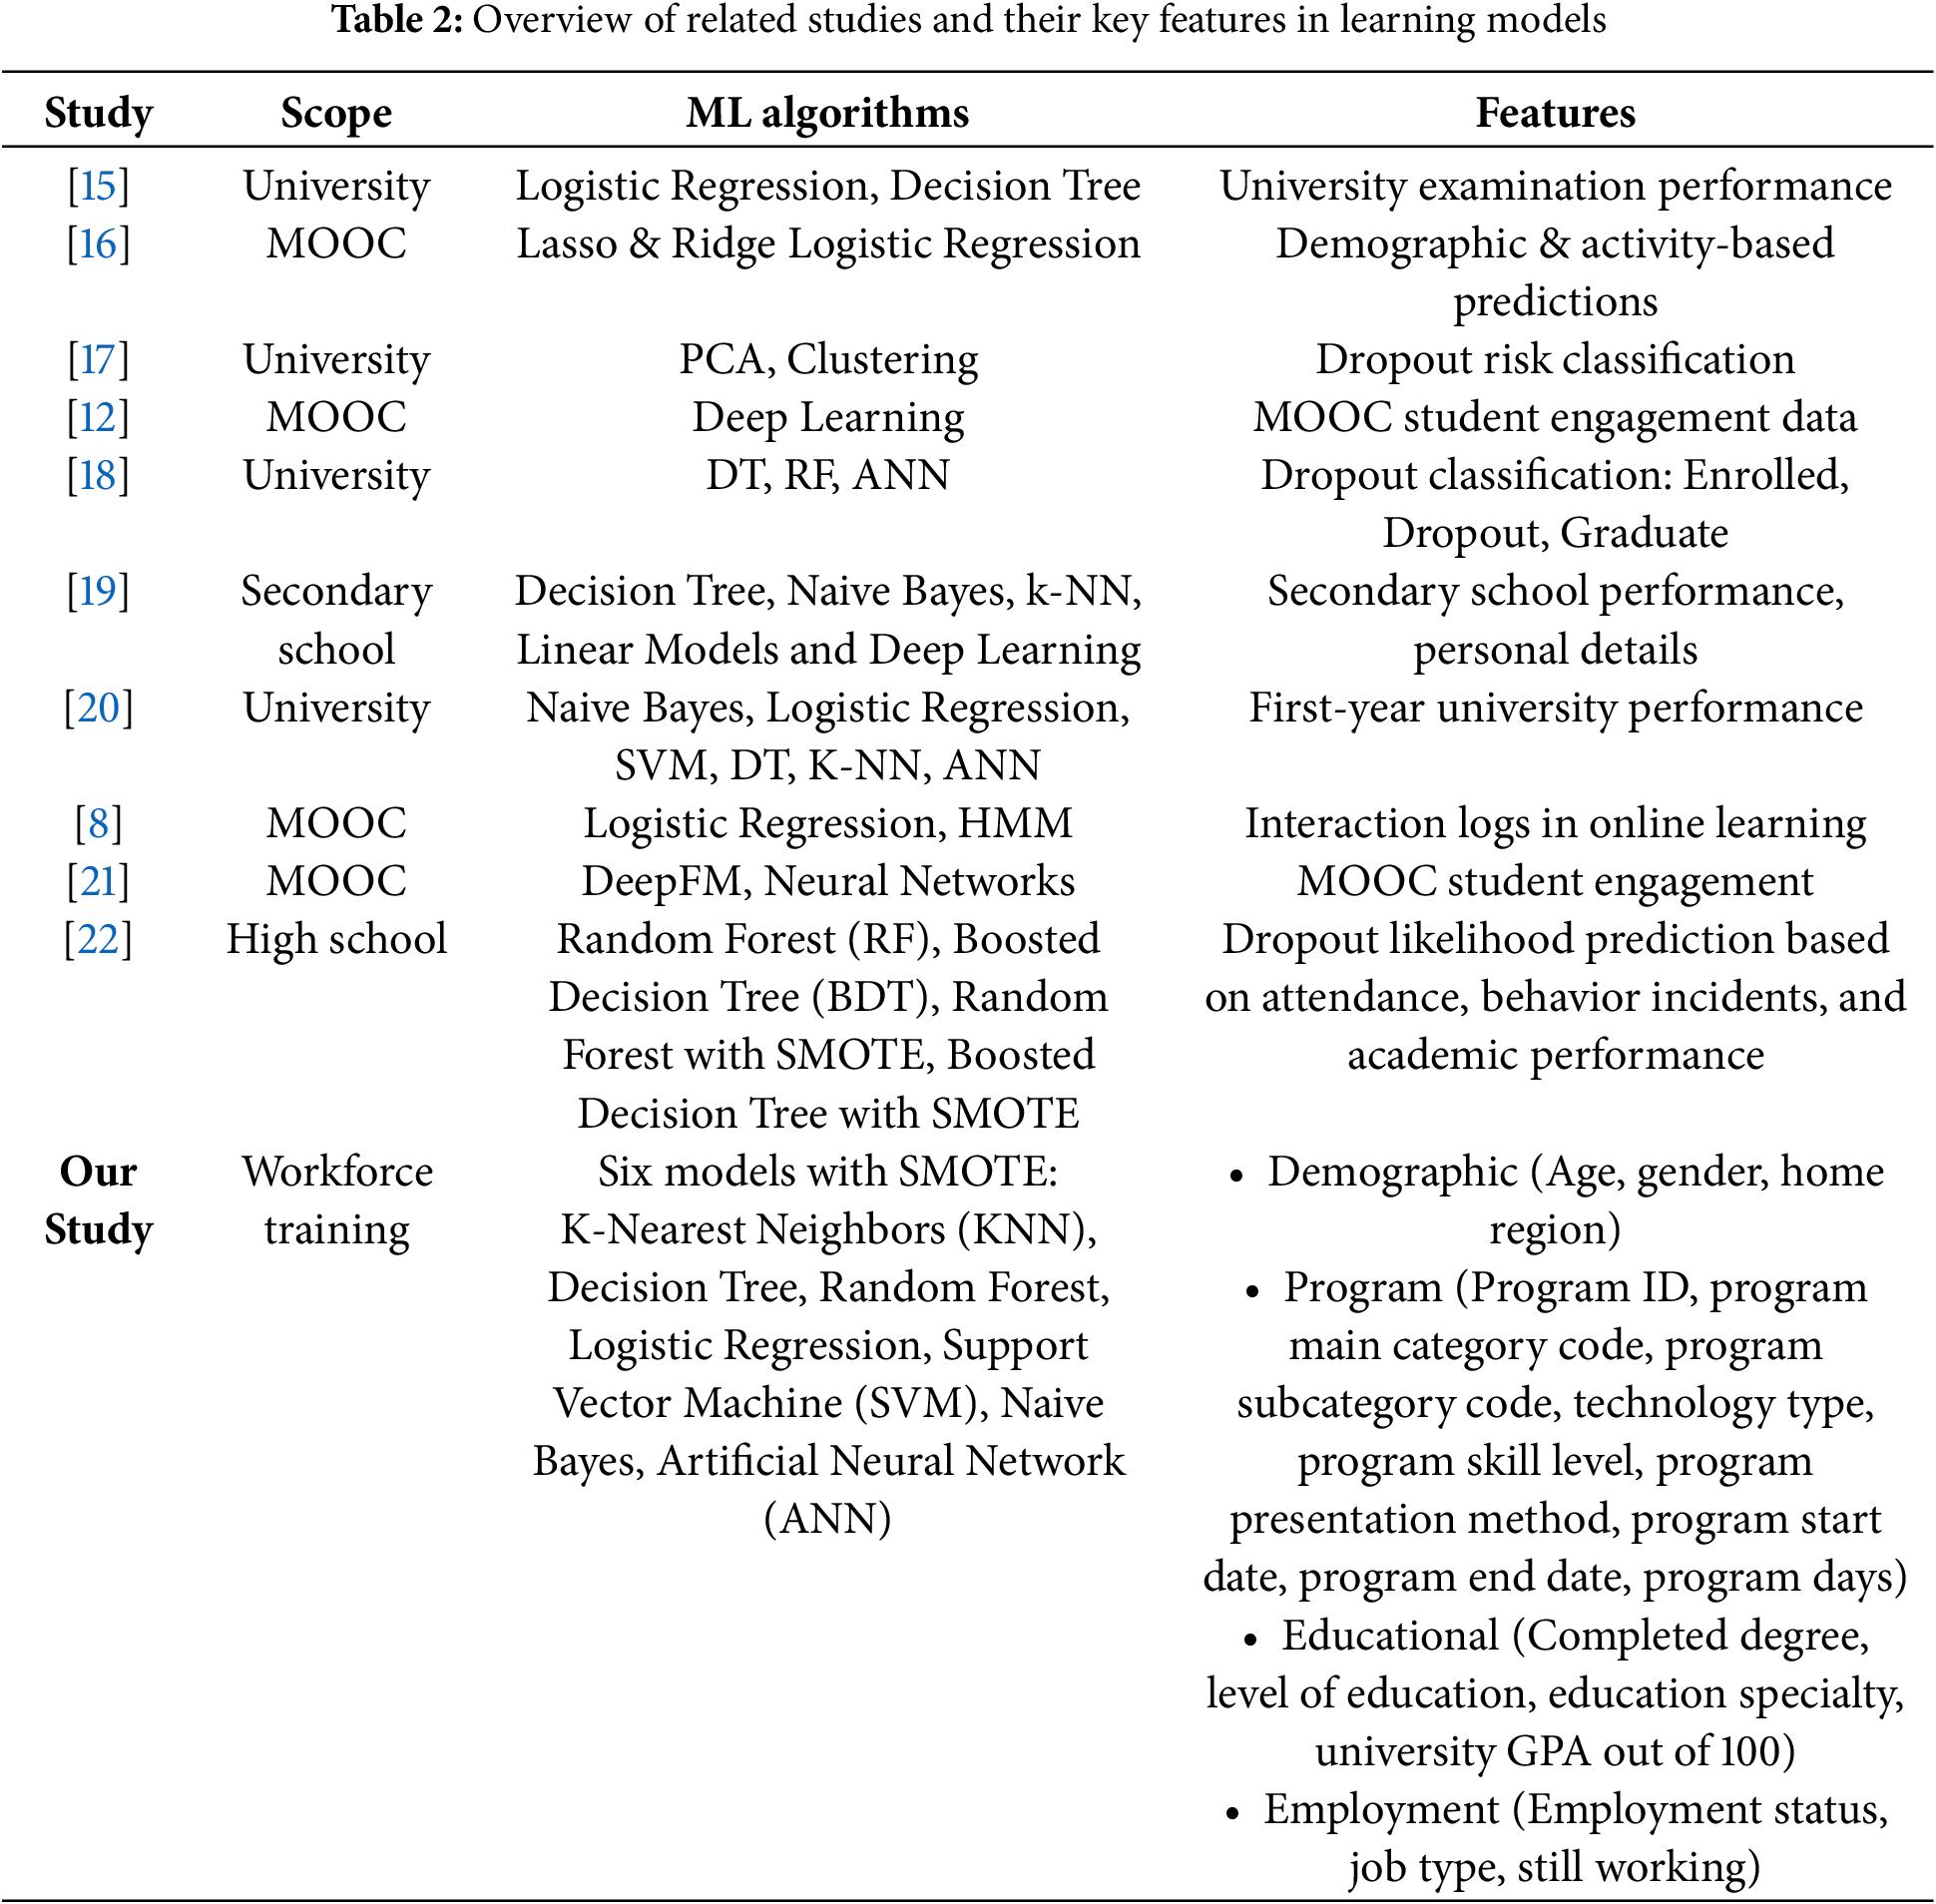
Table 2 presents a comparative overview of various studies to predict student success, dropout rates, and engagement across different educational contexts. It highlights the diversity in machine learning algorithms, ranging from traditional methods like logistic regression and decision trees to advanced techniques such as deep learning and neural networks. The studies span multiple educational settings, including universities, MOOCs, secondary schools, and high schools, with features encompassing demographic data, academic performance, and student engagement metrics. Our study uniquely focuses on workforce training, utilizing six machine learning models with SMOTE to balance data and enhance dropout prediction accuracy, incorporating a comprehensive set of demographics, educational, program-specific, and employment-related features.
A The methodology employed in this study follows a systematic and structured approach, as illustrated in Fig. 1. The process begins with data collection, where raw trainee data undergoes cleaning to ensure accuracy and consistency by addressing missing values and errors. The cleaned data is then explored to identify patterns and relationships among features, providing insights for subsequent stages.
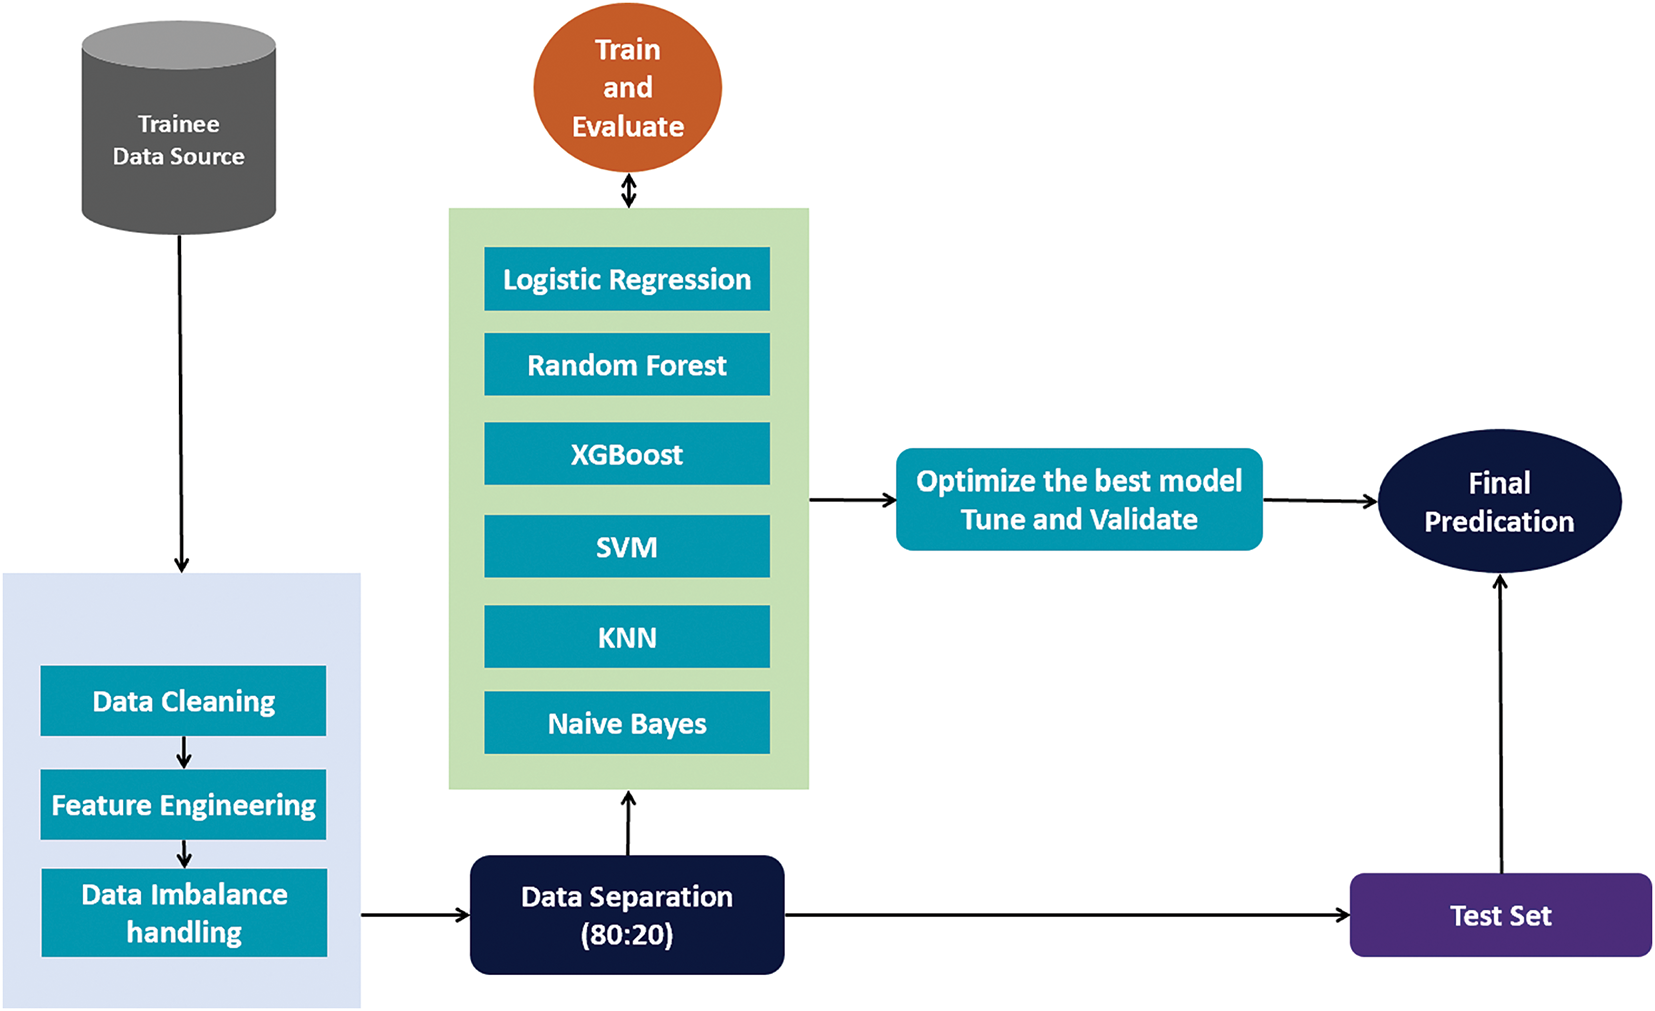
Figure 1: A framework for dropout prediction research in short-term training programs
Feature engineering is performed to enhance the dataset by creating or transforming features that improve the model’s predictive capabilities. Once feature engineering is complete, class imbalance handling is applied to ensure balanced representation of both completed and non-completed training cases, reducing the risk of biased model predictions.
The dataset is then split into training and test sets, facilitating reliable model evaluation by ensuring that the training data is used for model learning while the test data remains unseen during training, allowing for an unbiased evaluation.
Each algorithm is assessed to determine its effectiveness in predicting workforce training completion rates. The best-performing model is selected based on evaluation metrics, including accuracy, precision, recall, F1-score, and ROC-AUC. The best-performing model undergoes hyperparameter tuning to optimize performance, enhancing accuracy and generalization. Model interpretability is emphasized to ensure that predictions are comprehensible and actionable.
The dataset used in this study was collected from a national upskilling development initiative and includes detailed information about participants enrolled in short-term vocational training programs between 2022 and 2023 [23]. Each record represents an individual trainee and includes a wide range of features related to demographics, education, employment, and program structure.
Demographic attributes include the participant’s age, gender, home region, and home city, offering a broad view of socio-demographic diversity across different areas of the country. Each trainee is linked to a specific program through a unique Program ID, and additional program-related fields include the main category and subcategory codes, type of technology used, skill level (beginner, intermediate, or advanced), and delivery method (online or in-person). Temporal features such as program start and end dates, as well as the total number of program days, allow for analysis of program length and scheduling.
Educational background is captured through several variables, including whether the participant completed a degree, their highest level of education, area of specialization (e.g., IT, Business), and GPA—standardized to a 100-point scale to allow for comparability. Employment-related data includes current employment status, job type (e.g., full-time or part-time), and whether the participant was still employed at the time of program enrollment.
The target variable in the dataset is binary: a value of 0 indicates that the participant successfully completed the program, while a value of 1 denotes non-completion (i.e., dropout). The dataset also contains the necessary features to explore seasonality, cultural timing (e.g., Hijri calendar alignment), and regional distribution of dropout trends.
Participants included in this analysis were selected based on the completeness and quality of their records. Specifically, only records with valid and complete entries for core features—such as demographic, educational, and program-specific variables—were retained. Records with missing or inconsistent information, particularly in the target variable or key predictors, were excluded. This filtering step was essential to maintain the integrity of the models and to ensure that the outputs would be both accurate and interpretable.
Although the data comes from a single national system, it includes a wide range of program types and participant backgrounds, which supports the generalizability of the findings to similar vocational training settings. The sample represents a realistic and diverse snapshot of learners engaging in short-term skill development programs, making it a strong foundation for predictive modeling focused on completion outcomes.
Data preprocessing is a critical step in machine learning that involves transforming raw data into a clean and structured format suitable for analysis. This process enhances data quality by addressing issues such as missing values, noise, and inconsistencies, thereby improving the performance and accuracy of machine learning models [24]. The original dataset comprised 6548 rows and 24 columns, including a mix of demographic, educational, program-related, and employment attributes. The target variable, Y, was binary, representing whether a student successfully completed the program (0) or dropped out (1). Significant preprocessing was conducted to address issues with language inconsistencies, missing data, and feature relevance to ensure a clean and standardized dataset ready for predictive modeling.
All non-English fields were translated into English to standardize the dataset. For example, the Gender column was translated from Arabic terms such as “ ” to “male” and “
 ” to “female”. Similarly, other categorical fields, such as Program Presentation Method and Home Region, were translated and normalized for consistency. These translations ensured the dataset’s uniformity and compatibility with machine learning algorithms.
Missing data were handled comprehensively, including columns with substantial missing values. Rather than discarding data, imputations were performed to retain as much information as possible. For instance, missing values in Age were filled with the mean value (26.83), while missing categorical data, such as Education Specialty and Home Region, were imputed using the mode. The Education Specialty column was also simplified into two categories: cs (Computer Science-related) and non-cs (non-Computer Science-related), providing a clearer distinction for analysis.
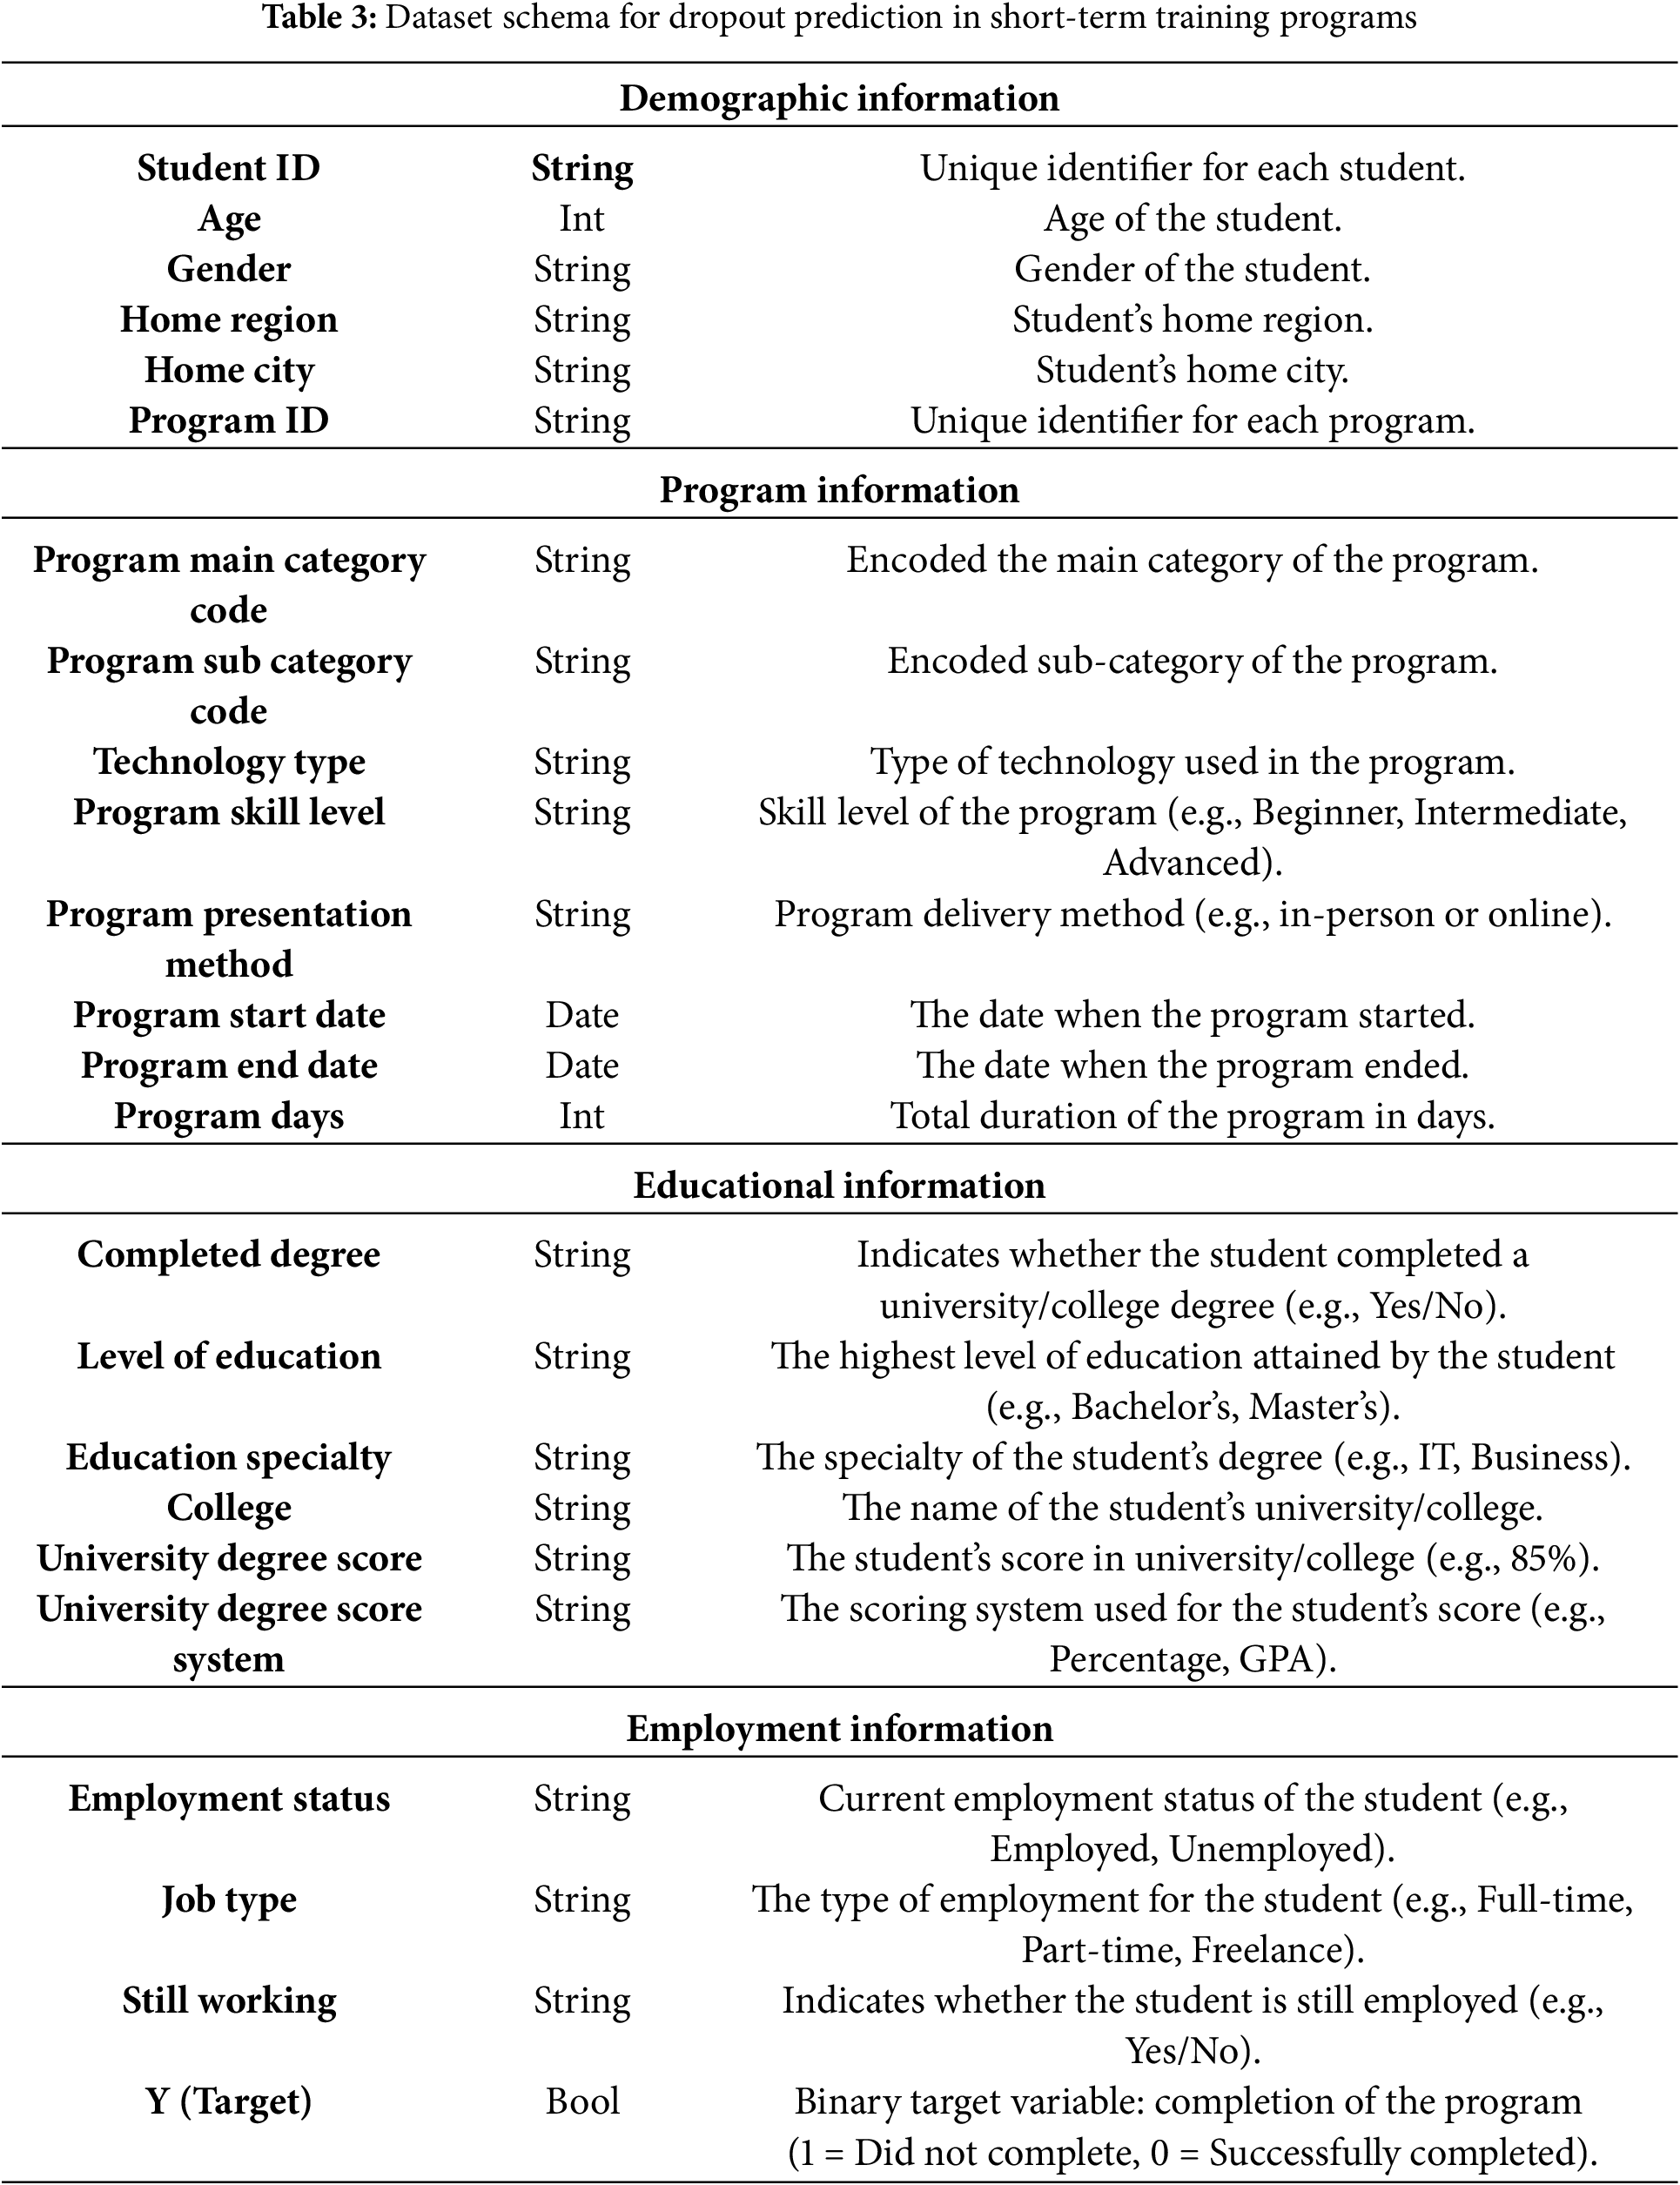
The dataset’s numeric features, such as University GPA, were standardized to a scale out of 100 to ensure uniformity across varying scoring systems. This transformation improved the comparability of scores across students from different educational institutions. Additionally, columns derived such as Course Code, which had low relevance to program completion, were removed to reduce noise in the dataset and focus on impactful features. After preprocessing, the dataset was streamlined to 16 columns, retaining essential information about demographics, education, and program characteristics. These steps eliminated all missing data and ensured the dataset was uniform, consistent, and ready for predictive analysis. The final dataset balanced pre-serving information with reducing complexity, providing a robust foundation for predictive modeling of program completion rates. Table 3 outlines the dataset schema used for dropout prediction in short-term training programs, detailing the key demographic, educational, and program-specific variables included in the analysis.
The dataset includes several categorical features that were transformed into numerical representations to ensure compatibility with machine learning algorithms. Encoding was applied systematically to preserve the semantic meaning of the data while converting textual and categorical values into a machine-readable format.
Gender, originally represented as “male” and “female”, was encoded using binary encoding, where “male” was mapped to 0 and “female” to 1. Home Region, which included categories such as “riyadh”, “Makkah”, and “Jeddah”, was transformed using one-hot encoding to create binary columns for each region, avoiding the introduction of ordinal relationships between the categories. Technology Type, with values such as “Traditional”, “Emerging”, and “Supportive”, was encoded using label encoding, mapping the categories to integers 0, 1, and 2, respectively, to facilitate compact representation.
Program Skill Level, which had an inherent progression among “beginner”, “me-dium”, and “advanced”, was encoded using ordinal encoding, assigning values 0, 1, and 2 in accordance with their natural order. Program Presentation Method, a binary feature with values “InClass” and “online”, was encoded as 0 and 1, respectively. Completed Degree, similarly binary with values “yes” and “no”, was encoded as 1 for “yes” and 0 for “no”.
Level of Education, representing hierarchical categories such as “Diploma”, “Bachelor”, “Master”, and “Doctorate”, was encoded ordinally as 0, 1, 2, and 3, reflecting the progression in educational attainment. Education Specialty was simplified into two categories, “cs” for Computer Science-related fields and “none cs” for other fields, and encoded as 1 and 0, respectively. Employment Status, a binary feature with values “employed” and “unemployed”, was encoded as 1 for “employed” and 0 for “unemployed”. Job Type, represented as “Full-time” and “Part-time”, was encoded similarly as 1 and 0. Still Working, which captured whether an individual was currently employed, was encoded as 1 for “Yes” and 0 for “No”.
These encoding transformations ensured that the categorical features were numerically represented in a manner compatible with machine learning algorithms, while maintaining the integrity and interpretability of the original data.
3.3 Handling Imbalanced Dataset
Handling imbalanced datasets is critical in machine learning to ensure that models effectively capture the characteristics of both the majority and minority classes. Common approaches include data-level techniques like oversampling the minority class [25]. In this study, the dataset exhibited a stark imbalance, where the majority class (students who successfully completed the program) significantly outweighed the minority class (students who dropped out). The class distribution was 5507 to 1039, respectively. This imbalance posed a risk of bias in the machine learning models, as they could become skewed toward the majority class, leading to suboptimal preditions for the minority class. To address this issue, the Synthetic Minority Oversampling Technique (SMOTE) was employed to balance the dataset.
SMOTE was selected as the primary approach because of its ability to generate synthetic samples for the minority class by interpolating between existing data points [26]. Unlike traditional oversampling methods that duplicate minority class samples, SMOTE creates new samples that are distinct yet aligned with the original data distribution. This approach reduces the likelihood of overfitting, a common issue when identical samples are repeatedly presented to the model. By generating synthetic samples, SMOTE enhances the diversity of the minority class, allowing the machine learning model to learn more nuanced decision boundaries.
Furthermore, SMOTE improves the overall performance of classification models by addressing the imbalance in the target variable. Imbalanced datasets often lead to models with high accuracy but poor recall for the minority class, as the model tends to favor the majority class. By balancing the dataset, SMOTE ensures that both classes are equally represented, enabling the model to achieve better generalization and improved performance metrics, particularly recall and F1-score for the minority class [26].
The choice of SMOTE also aligns with the goal of preserving feature relationships within the data. By interpolating between similar instances in the minority class, SMOTE maintains the underlying structure and relationships of the features, ensuring that the generated samples are consistent with the original data. This balance between synthetic sample generation and feature preservation makes SMOTE a robust and effective technique for addressing class imbalance in this study.
In In this study, several classification algorithms were applied to predict completion outcomes in short-term workforce development training programs. The selection of models was guided by their ability to handle different types of data—categorical, ordinal, and numerical—as well as their relevance to understanding real factors associated with dropout in a vocational context.
Given the complexity of the dataset, which includes a mix of demographic, educational, and employment features, it was important to include models that could both manage this structure and provide meaningful insights. Interpretability was also considered, especially since the findings are intended to support practical interventions by training providers and policymakers.
Logistic Regression and Naive Bayes were included due to their simplicity and interpretability. These models allow us to understand which variables are contributing most strongly to predictions, which is important for transparency and stakeholder communication.
Ensemble models like Random Forest and XGBoost were selected for their strength in modeling non-linear interactions and improving prediction accuracy, especially in cases where multiple features interact. These models are well-suited to the structure of our dataset and performed well in handling class imbalance, particularly after applying SMOTE.
In addition, Support Vector Machine (SVM) and K-Nearest Neighbors (KNN) were used for comparative purposes. While these models are less interpretable than logistic regression, they offer alternative approaches for classification and help assess the robustness of results across different modeling techniques.
Overall, the selected models reflect a balance between interpretability and predictive performance. This approach allows for identifying the best-performing algorithm and also the key features driving dropout. Below is a detailed description of the classification algorithms used:
Logistic Regression is a linear model widely used for binary classification tasks, such as predicting whether a trainee will complete a program. This model is particularly valued in this context for its simplicity and interpretability, allowing researchers to identify key predictors of program completion. The model predicts the probability that a given input belongs to a particular class (e.g., completing the program) by applying a logistic function to a linear combination of input features. The output probability is then used to classify the trainee based on a threshold, typically 0.5.
Mathematically, the logistic function is expressed as:
Random Forest is an ensemble learning method that builds multiple decision trees and combines their outputs to improve predictive performance. In the context of predicting program completion, Random Forest is particularly valuable for its ability to handle large datasets with many features, such as demographic information, program characteristics, and performance metrics. By averaging the results of multiple trees, Random Forest reduces the risk of overfitting and enhances the model’s generalization ability, making it robust across different subsets of the data.
The output of the Random Forest model is expressed as:
where Tb(x) is the prediction of the b-th tree for input x, and B is the total number of trees.
XGBoost (Extreme Gradient Boosting) is a powerful and efficient implementation of the gradient boosting framework, optimized for performance in complex predictive tasks. In the context of predicting training program completion, XGBoost is particularly effective at handling imbalanced classes, where there may be significantly more trainees who complete the program than those who do not. XGBoost builds an ensemble of decision trees sequentially, where each tree corrects the errors of its predecessors, leading to a highly accurate model. Regularization in XGBoost helps prevent overfitting, ensuring the model remains generalized to new data.
The objective function in XGBoost includes both the loss function and a regularization term:
where
3.4.4 Support Vector Machine (SVM)
Support Vector Machine (SVM) is a robust classification algorithm that excels in high-dimensional spaces, making it suitable for scenarios where multiple predictors are used to determine program completion. SVM aims to find the hyperplane that best separates the classes (e.g., completing or not completing the program) by maximizing the margin between the nearest data points of each class. For non-linearly separable data, SVM can apply a kernel trick to transform the input space into a higher-dimensional space, allowing for a more effective classification.
The decision function for SVM is defined as:
where w is the weight vector, x is the input vector, and b is the bias term.
3.4.5 K-Nearest Neighbors (KNN)
K-Nearest Neighbors (KNN) is a simple, instance-based learning algorithm that classifies a trainee based on the majority class among its K-Nearest Neighbors. This algorithm is particularly useful in the context of training programs where the behavior of similar trainees (in terms of demographics, prior education, etc.) might be indicative of an individual’s likelihood to complete the program. The model does not make any assumptions about the underlying data distribution, which can be advantageous in scenarios where the data is complex or not well understood.
The classification decision in KNN is given by:
where
Naive Bayes
Naive Bayes is a probabilistic classifier based on Bayes’ theorem, with the assumption that the features are conditionally independent given the class label. Despite its simplicity, Naive Bayes can perform well in predicting program completion, particularly when the assumptions hold true. The model calculates the posterior probability for each class and assigns the class with the highest probability to the input.
The probability of a data point x belonging to class y is calculated as:
Naive Bayes is efficient and scales well to high-dimensional data, making it suitable for large datasets with many features.
The random hold-out method was used as an approach for validating machine learning models. The dataset was randomly split into two subsets, with 80% of the data allocated for training and 20% for testing. The training set was used to build and tune the models, while the testing set was reserved for evaluating their performance on unseen data. This method provided a straightforward way to assess the models’ generalization capabilities.
In this study, we evaluate and validate the performance of various machine learning models in predicting the completion rates of short-term workforce development training programs. Given the nature of the dataset, where the distribution of completed and non-completed cases may be imbalanced, relying solely on the accurate metric could be misleading. For instance, if the majority of students complete the program, a model that predicts completion for all students could achieve high accuracy yet fail to identify those at risk of not completing.
Therefore, while accuracy provides a general measure of model performance, it is insufficient for evaluating models trained on datasets with imbalanced classes. To address this, we employed a set of four evaluation metrics: classification accuracy, precision, recall, and the F1-score. These metrics collectively offer a more nuanced assessment of the models’ effectiveness, particularly in contexts where the minority class (students who do not complete the program) is of significant interest:
Accuracy: The ratio of correct predictions (both true positives and true negatives) to the total number of predictions, defined as:
Precision: The proportion of true positive predictions among all positive predictions, defined as:
Recall: The proportion of true positive instances correctly identified by the model, defined as:
F1 Score: The harmonic means of precision and recall, providing a balanced metric that accounts for both false positives and false negatives:
4 Experimental Results and Discussion
Environment
This study was conducted using a laptop with a Ryzen 7-5800X processor, 16 GB of RAM, and a 1 TB hard drive. The source code was implemented in Python using Jupyter Notebook for interactive development. The study utilized Python libraries such as NumPy for numerical computations, Pandas for data preprocessing and manipulation, Matplotlib for visualizing results, Scikit-Learn for machine learning model training and evaluation, and XGBoost for advanced gradient boosting
4.1 Class Distribution Analysis and Balancing
Balancing the dataset is essential to mitigate model bias toward the majority class. It enhances the ability of machine learning models to accurately predict both outcomes. This step is particularly critical for improving recall and F1-scores for the minority class, which corresponds to students who did not complete the training program.
Fig. 2 presents the class distribution of the target variable (“Completed” vs. “Not Completed”) before and after balancing the dataset. The bar chart on the left illustrates the original distribution, where the majority class (“Completed”) dominates with over 5000 records. In contrast, the minority class (“Not Completed”) has significantly fewer instances, slightly above 1000. This stark imbalance indicates that the majority class constitutes approximately 85% of the data, while the minority class represents only 15%. Such an imbalance poses challenges for machine learning models. These models may become biased toward predicting the majority class, resulting in poor performance for the minority class.
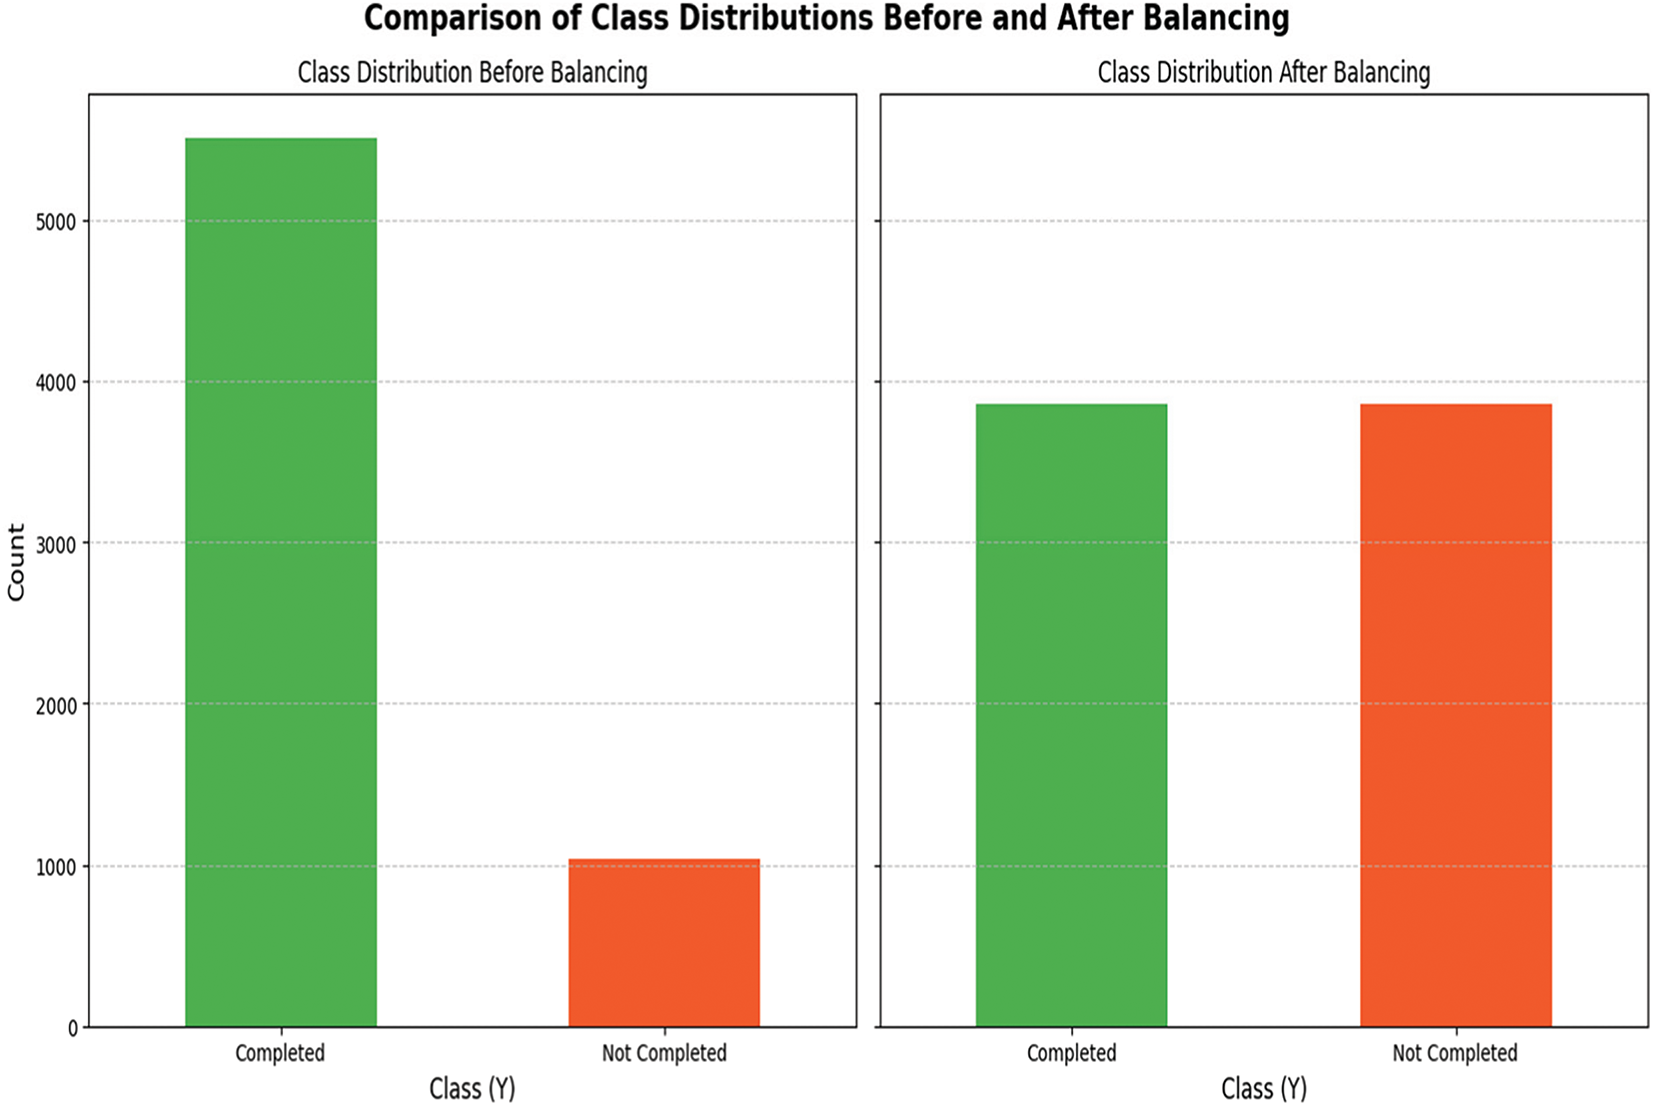
Figure 2: Class distribution of the target variable (“Completed” vs. “Not Completed”) before and after balancing the dataset
The bar chart on the right shows the balanced distribution, achieved through SMOTE. SMOTE addresses the imbalance by generating synthetic instances for the minority class through interpolation between existing data points. This process ensures equal representation of both classes in the dataset.
4.2 Performance Evaluation on the Unbalanced Dataset
The evaluation of six machine learning classifiers on the unbalanced dataset provides insights into the impact of class imbalance on model performance. Table 3 summarizes the key performance metrics, including Accuracy, Precision, Recall, and F1-Score.
Logistic Regression and Random Forest achieved the highest accuracy (0.8641) on the unbalanced dataset. However, this metric alone does not reflect their performance in the minority class (“Not Completed”). Logistic Regression showed moderate precision (0.5987) but suffered from low recall (0.4375), resulting in an F1-score of 0.5056. Similarly, Random Forest slightly outperformed Logistic Regression in recall (0.4904) and F1-score (0.5340) but had a lower precision of 0.5862.
XGBoost delivered the highest F1-score (0.5691) and recall (0.5144) on the unbalanced dataset, demonstrating its capability to handle class imbalance better than other classifiers. In contrast, SVM performed poorly, with an F1-score of just 0.1126 due to an extremely low recall of 0.0625. While K-Nearest Neighbors and Naive Bayes achieved acceptable accuracy, their recall values were insufficient for reliably predicting the minority class. Table 4 presents the performance of various classifiers on the original unbalanced dataset, illustrating differences in accuracy, precision, recall, and F1-score prior to applying resampling techniques.
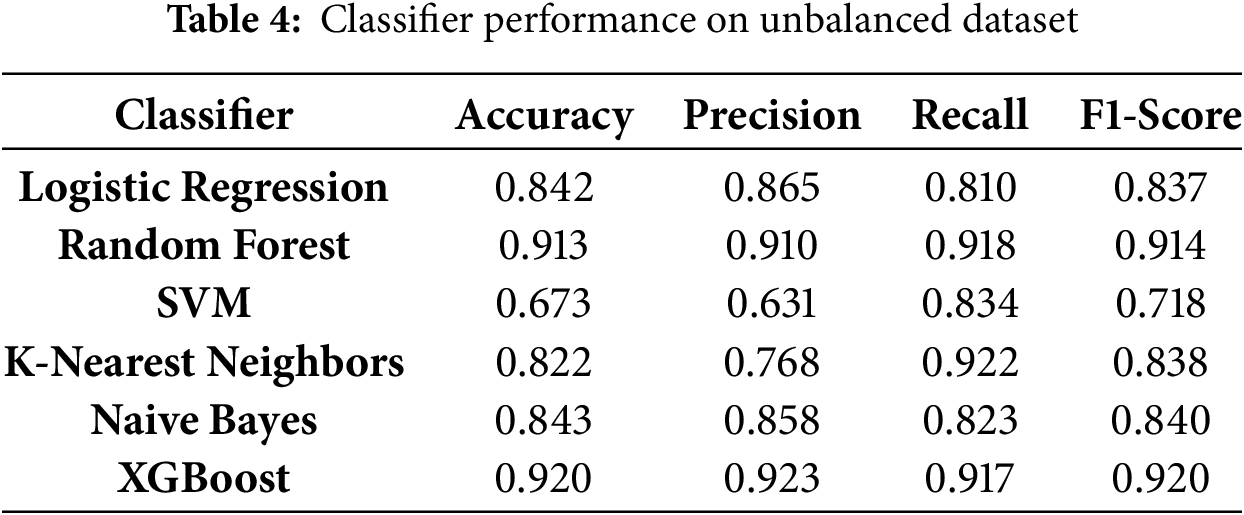
These results underscore the importance of addressing class imbalance. High accuracy, as seen with Logistic Regression and Random Forest, does not necessarily indicate effective performance on minority classes, which are often of primary interest.
4.3 Performance Evaluation on the Balanced Dataset
After applying SMOTE to balance the dataset, the classifiers exhibited significant improvements in recall and F1-score, particularly for the minority class. Table 4 presents the performance metrics of the classifiers on the balanced dataset. Table 5 shows the performance of the classifiers after applying data balancing techniques, demonstrating improvements in recall and overall classification metrics for the minority class.

Balancing the dataset resulted in substantial performance improvements, particularly for ensemble methods such as XGBoost and Random Forest. XGBoost achieved the highest overall performance, with an F1-score of 0.9200, precision of 0.9230, recall of 0.9170, and accuracy of 0.9202. Random Forest closely followed with an F1-score of 0.9141, demonstrating its robustness in handling balanced datasets.
Logistic Regression and Naive Bayes also performed well on the balanced dataset, with F1-scores of 0.8372 and 0.8405, respectively. Both models maintained strong recall and precision, indicating their suitability for balanced datasets. K-Nearest Neighbors showed notable improvement, achieving an F1-score of 0.8384 and the highest recall among all classifiers (0.9222). However, its precision was slightly lower than that of ensemble models.
SVM displayed better recall (0.8340) compared to its performance on the unbalanced dataset but still lagged behind other classifiers, with an F1-score of 0.7188. This result reflects its sensitivity to parameter tuning and its limitations in handling complex class distributions, even after balancing.
The accuracy metric reflects an improvement across most classifiers when evaluated on the balanced dataset. XGBoost consistently achieved the highest accuracy, improving from 0.8763 on the unbalanced dataset to 0.9202 on the balanced dataset. Random Forest also showed strong performance, increasing from 0.8641 to 0.9137. These results indicate that balancing the dataset enhances the classifiers’ ability to predict both classes correctly (Fig. 3).
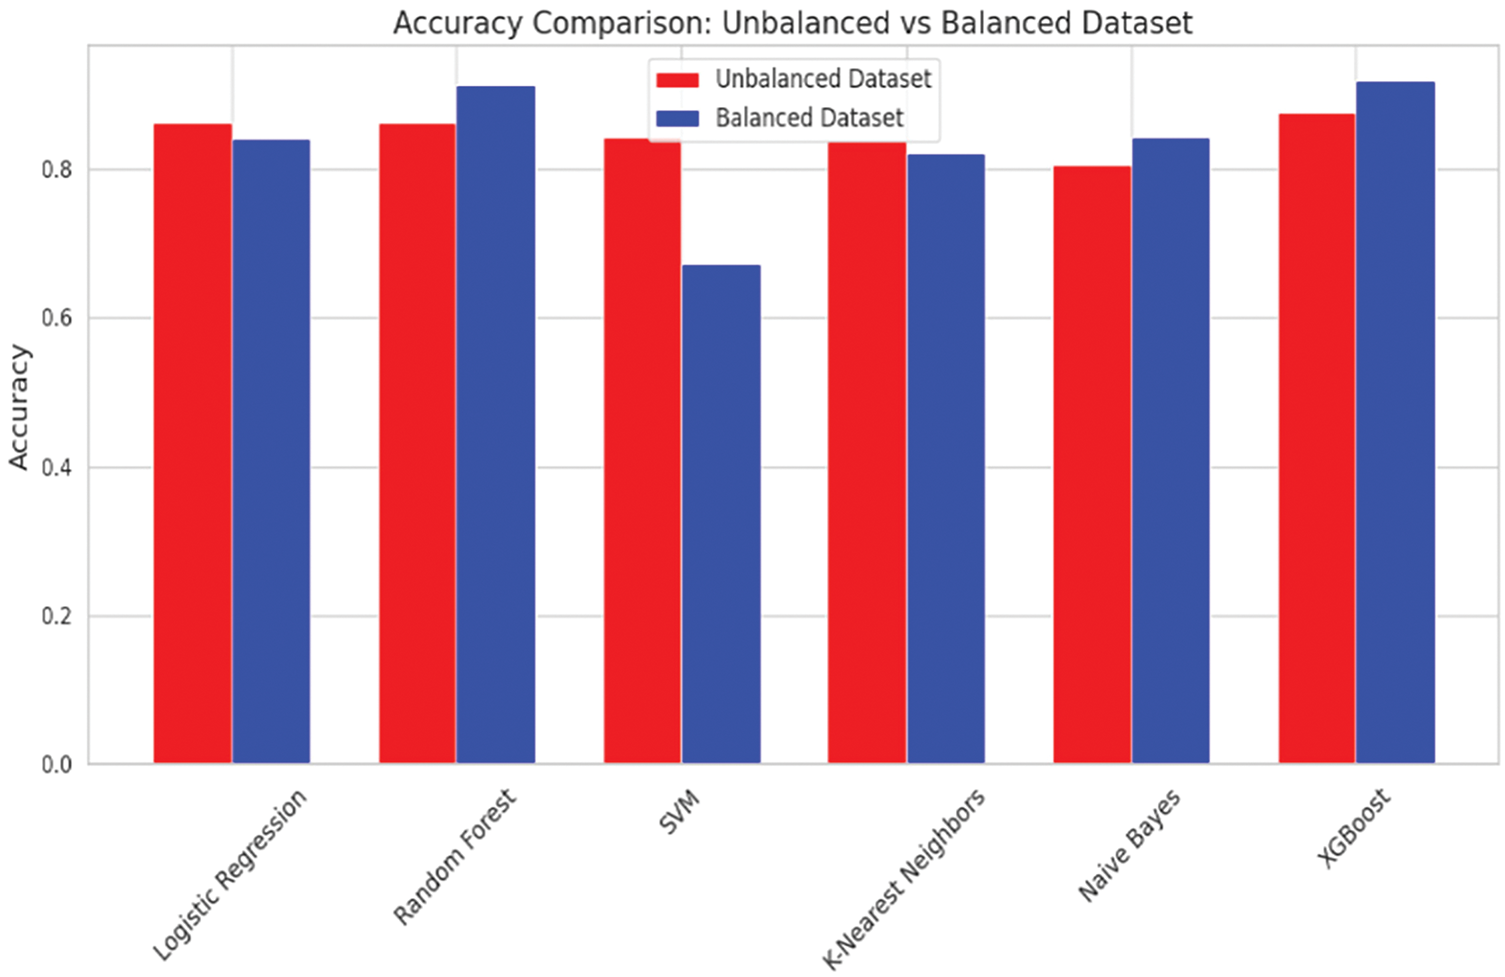
Figure 3: Accuracy comparison: Unbalanced vs. Balanced
Balancing the dataset significantly increased the precision of all classifiers. XGBoost exhibited the highest precision, rising from 0.6369 to 0.9230, suggesting a substantial reduction in false positives. Logistic Regression and Naive Bayes also showed noticeable gains in precision after balancing, further confirming the effectiveness of balancing in addressing majority class bias (Fig. 4).

Figure 4: Precision comparison: Unbalanced vs. Balanced
Recall, which measures the model’s ability to correctly identify positive cases, showed the most dramatic improvements after balancing. K-Nearest Neighbors recall increased from 0.1298 to 0.9222, reflecting a significant enhancement in its capacity to detect minority class instances. SVM also demonstrated improved recall, with its performance increasing from 0.0625 to 0.8340. XGBoost and Random Forest maintained high recall values, further emphasizing their robustness (Fig. 5).

Figure 5: Recall comparison: Unbalanced vs. Balanced
The F1-Score, a harmonic means of precision and recall, demonstrated consistent improvement for all classifiers when applied to the balanced dataset. XGBoost achieved the highest F1-Score, improving from 0.5691 to 0.9200, followed closely by Random Forest at 0.9141. These improvements highlight the overall reliability of these models on balanced datasets. Logistic Regression and Naive Bayes also benefited from dataset balancing, achieving competitive F1-Scores of 0.8372 and 0.8405, respectively (Fig. 6).
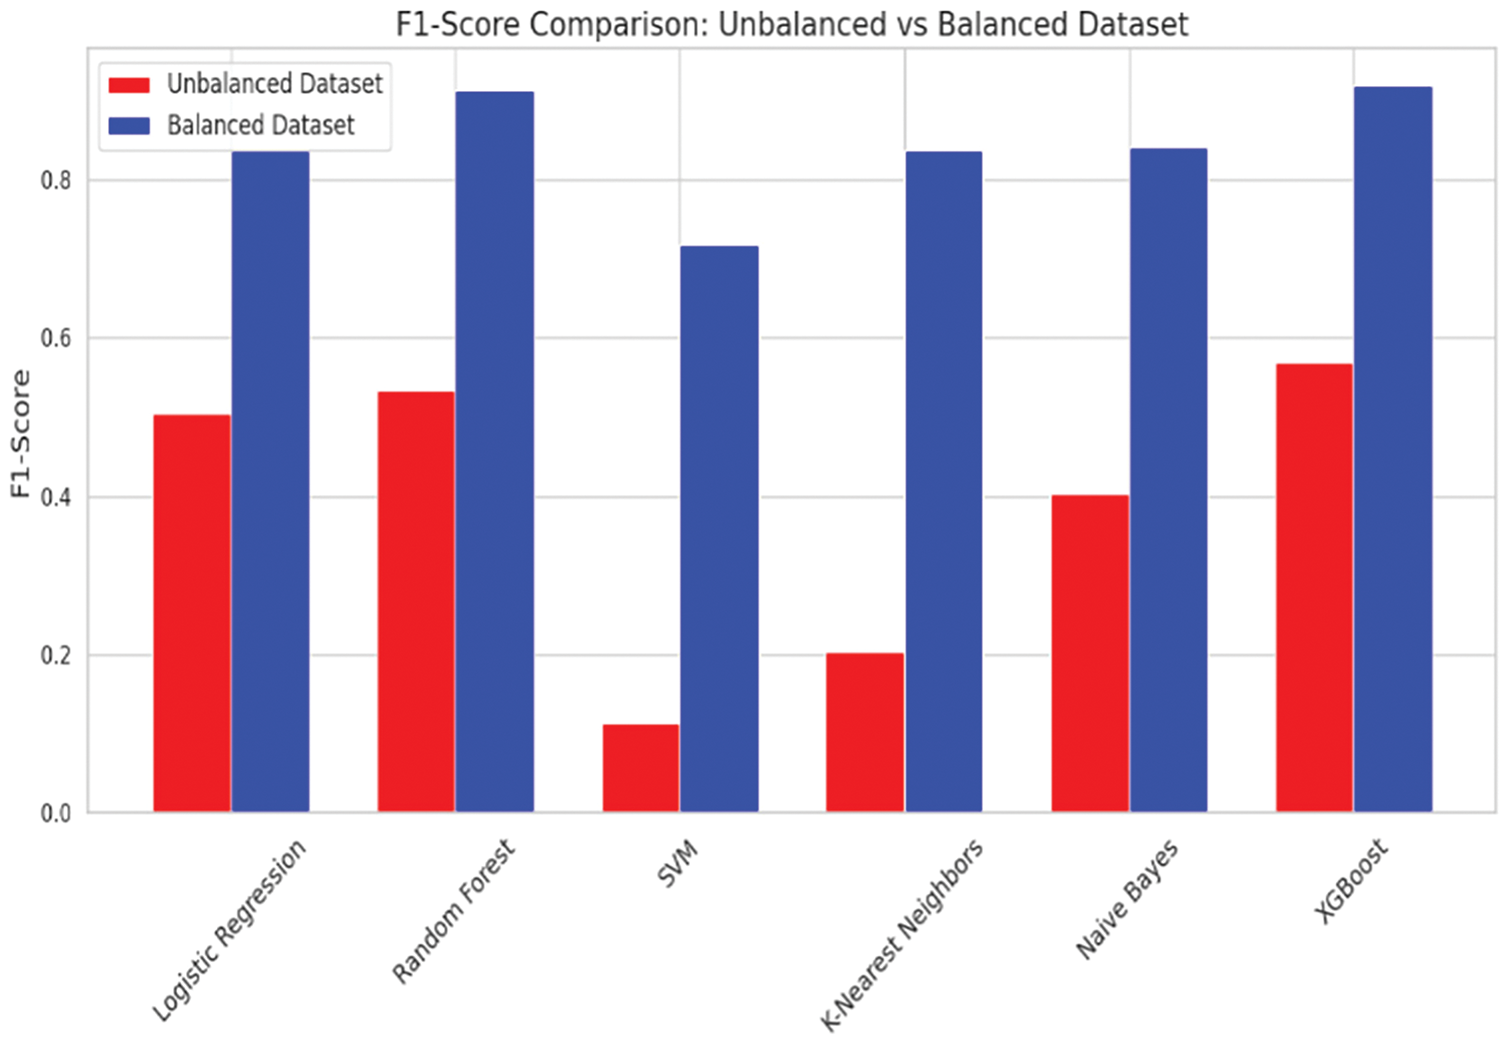
Figure 6: F1-Score comparison: Unbalanced vs. Balanced
The results indicate that balancing the dataset significantly enhances classifier performance across all metrics. XGBoost and Random Forest consistently outperformed other models, demonstrating their robustness and ability to handle balanced datasets effectively. This study underscores the critical importance of addressing class imbalance in machine learning to improve predictive performance, particularly for real-world applications where minority class identification is crucial. Future work may focus on hyperparameter optimization and testing additional balancing techniques to further improve model performance.
The Receiver Operating Characteristic (ROC) curves for the classifiers were evaluated on both unbalanced and balanced datasets to assess their ability to distinguish between the “Completed” and “Not Completed” classes. The Area Under the Curve (AUC) values provide a comprehensive measure of each classifier’s performance under varying class distribution conditions.
On the unbalanced dataset, as shown in Fig. 1, XGBoost achieved the highest AUC value of 0.84, followed closely by Random Forest with an AUC of 0.83. These results demonstrate the robustness of ensemble methods in handling significant class imbalance. Logistic Regression and SVM showed moderate performance with AUC values of 0.73 and 0.74, respectively, while Naive Bayes achieved an AUC of 0.71. K-Nearest Neighbors (KNN) performed the least effectively, with an AUC of 0.68, reflecting its difficulty in managing imbalanced data (Fig. 7).

Figure 7: ROC curves for unbalanced dataset
On the balanced dataset, presented in Fig. 2, all classifiers demonstrated substantial improvements in AUC values. Both XGBoost and Random Forest achieved the highest AUC values of 0.97, highlighting their strong capability to leverage balanced class distribution. KNN improved significantly to an AUC of 0.91, while Logistic Regression and Naive Bayes reached competitive AUC values of 0.90 and 0.87, respectively. SVM, despite showing improvement, recorded the lowest AUC among the classifiers at 0.79 (Fig. 8).
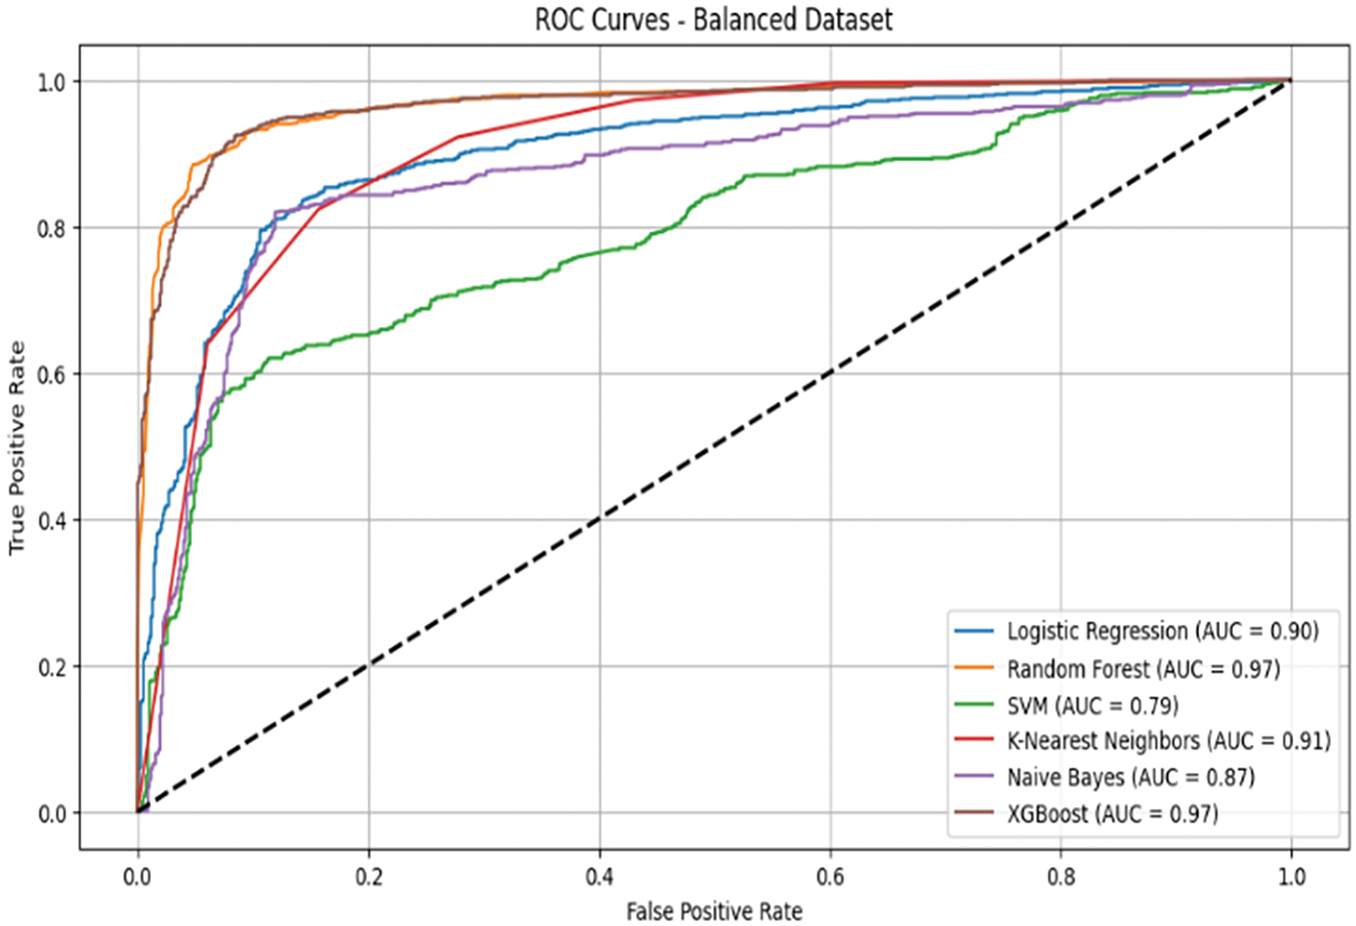
Figure 8: ROC curves for balanced dataset
The analysis reveals that ensemble methods, particularly XGBoost and Random Forest, excel in both imbalanced and balanced datasets, maintaining superior discriminatory power across conditions. Balancing the dataset using SMOTE notably enhanced the performance of simpler models, such as Logistic Regression and Naive Bayes, demonstrating the effectiveness of preprocessing techniques in improving model robustness. Overall, the ROC curve analysis highlights the importance of both algorithm selection and data preprocessing in achieving optimal classification performance, especially in datasets with skewed class distributions.
4.5 Feature Importance in Workforce Training Retention Prediction
The feature importance analysis, conducted using SHapley Additive exPlanations (SHAP), provides insight into the variables most strongly associated with dropout in short-term workforce training programs. The SHAP summary plot for the best-performing model (Fig. 5) shows how each predictor contributes to the probability of non-completion. Positive SHAP values indicate a higher likelihood of dropout, while negative values are linked to successful program completion. Fig. 9 presents the SHAP summary plot, illustrating the relative importance of each feature in predicting dropout and highlighting the most influential variables in the model.

Figure 9: SHAP summary plot showing feature importance
Among all predictors, the most influential was whether a participant had completed a degree. Learners with prior degrees were more likely to complete the training, while those without were at greater risk of dropping out. This suggests that prior academic experience plays a central role in retention, possibly due to better preparation or familiarity with structured learning environments. Age also emerged as a key factor. Younger participants showed higher completion rates, while older learners had a greater tendency to withdraw. This may reflect the additional responsibilities often carried by adult learners, including work and family obligations, which can interfere with consistent participation in training.
Program duration—measured in days—was another strong predictor. Longer programs were linked to higher dropout risk, while shorter formats were associated with better retention. This finding points to the difficulty some learners face in maintaining extended commitments, particularly those balancing training with employment or other personal demands.
University GPA was also influential, with higher GPAs correlating with better outcomes. Participants with lower academic performance may find training more challenging, potentially leading to early disengagement. These learners may benefit from additional academic support or early intervention strategies. Employment status and whether a participant remained employed during training also played a role. Those who were unemployed were more likely to complete the program, while those who continued working—particularly full-time—faced higher dropout risk. The competing demands of work and study appear to be a significant factor influencing retention.
Skill level of the program also contributed to dropout. Higher-skill programs were linked to increased attrition, possibly due to the more advanced content and the greater effort required to keep up, especially for learners whose background may not fully align with the program’s expectations. Program delivery mode showed a moderate influence. In-person programs had slightly higher retention rates than online offerings, likely due to greater structure, more opportunities for interaction, and fewer distractions. Gender differences were observed but were not as pronounced; further investigation may be needed to understand specific gender-related challenges in workforce training.
Other features such as home region, education specialty, technology type, and job type showed smaller but still notable effects. Learners from IT and business-related fields, for instance, tended to have slightly better retention outcomes. Full-time employment was again associated with higher dropout risk, compared to part-time or flexible roles.
Overall, the SHAP analysis suggests that retention in workforce training is influenced by a combination of academic history, program structure, employment context, and personal circumstances. These results highlight the importance of designing support strategies that are responsive to individual needs—such as offering more flexible formats for working learners, academic support for those with lower GPAs, and adaptive pathways for participants at different skill levels. Incorporating these insights into program design can help improve retention and make workforce training more accessible and effective.
The study explored the use of machine learning to predict dropout in short-term workforce training programs. These programs are designed to provide fast, targeted upskilling, yet many face persistent challenges with learner retention. Non-completion carries costs at multiple levels—lost opportunities for participants, inefficient use of resources, and reduced alignment between training outputs and labor market needs. Although dropout has been studied in academic and online education contexts, vocational training environments remain less well understood. This study aimed to address that gap by evaluating predictive models using real-world data and identifying the key factors that influence training outcomes.
In RQ1: The findings show that machine learning models, particularly Random Forest and XGBoost, can effectively identify participants at risk of dropout. These models demonstrated strong recall and F1-scores, which are essential in contexts where early intervention is a priority. Their ability to capture non-linear interactions and account for diverse learner profiles makes them suitable for vocational training, where participants often vary widely in background and readiness. This supports the broader potential for machine learning to contribute to early warning systems within training programs. By integrating model predictions into enrollment or advising processes, institutions can take a more proactive approach to learner support. These findings contribute to the growing body of work on predictive analytics in education, extending it into the short-term training context, which remains underrepresented in the literature.
In RQ2: One of the main technical challenges in the study was class imbalance, with most learners completing their training and only a small percentage dropping out. This imbalance, if unaddressed, can lead models to favor the majority class, masking those most in need of support. To mitigate this, the SMOTE, which significantly improved the models’ ability to detect dropouts. The results confirm the importance of addressing class imbalance in predictive modeling, particularly in education and workforce training, where at-risk learners often represent a small but critical segment. From a methodological standpoint, this reinforces the value of preprocessing techniques in enhancing model fairness and utility. It also highlights the need for practitioners to be aware of imbalanced data risks when implementing predictive tools in real-world settings.
In RQ3: The SHAP analysis identified several variables that had the greatest influence on dropout predictions. These included completed degree status, GPA, program duration, age, and employment status. Learners with lower academic performance, no prior degree, longer training commitments, and full-time employment were more likely to withdraw before completing the program. These results reflect existing literature, which emphasizes the role of academic readiness, time constraints, and competing obligations in learner attrition.
From a theoretical standpoint, this study builds on the existing literature by grounding dropout prediction in a vocational context. While many prior studies have focused on longer academic programs or digital platforms, this work demonstrates how similar modeling techniques can be adapted to settings with shorter timeframes, more diverse learners, and different structural constraints.
Practically, the findings offer several applications. For training providers, predictive models offer a way to anticipate and address risk before it leads to disengagement. These tools can support personalized interventions—such as early advising, flexible scheduling, or added academic resources—based on the characteristics most associated with non-completion. The models’ ability to adjust thresholds also allows institutions to tailor their approach depending on available resources and program priorities.
For policymakers, the study provides evidence to support more targeted and responsive funding strategies. Rather than relying on a single-size-fits-all approach to workforce development, models such as these can provide direct support to the learners and programs where the need is greatest, and the potential impact is greatest.
Importantly, the findings also reinforce the need to design interventions that reflect the realities of vocational learners. Many participants are adults balancing training with employment, family responsibilities, or other obligations. Retention strategies that work in traditional academic settings may not be effective here. More appropriate solutions may include modular course design, evening or weekend offerings, and access to support services that are available outside of standard classroom hours.
The modeling process itself was grounded in best practices: consistent preprocessing, careful attention to overfitting, and validation against a baseline. These steps helped ensure that the models are not only accurate but also generally fit for use beyond the dataset used in this study.
The results offer useful insights for training providers and decision-makers. Being able to identify learners who are likely to drop out gives institutions the opportunity to take action early. This might include offering more flexible scheduling, additional academic support, or adjusting how programs are delivered. The SHAP feature importance analysis added value by highlighting which factors—such as GPA, program length, and previous education—have the strongest impact on completion. These findings can be used to design more targeted interventions and refine program content and structure.
From a theoretical perspective, this study contributes to a growing area of research focused on dropout prediction, but within the relatively underexplored setting of short-term vocational training. Unlike studies centered on traditional academic programs or MOOCs, our work focuses on learners engaged in fast-paced, practical skills training. The findings reinforce the importance of understanding how individual background, delivery format, and program design influence retention in these environments.
That said, there are some limitations. The dataset used in this study was based on static, pre-enrollment information. While this is helpful for making early predictions, it does not account for what happens during the program—such as engagement levels, attendance, or performance over time. In addition, although the dataset covers a wide range of learners and training types, it is drawn from a single national system, which may affect how well the findings apply to other countries or settings.
Looking ahead, future research could benefit from including real-time data and behavioral indicators during the training period. This would allow for the development of adaptive models that update risk predictions as the program progresses. There is also room to explore how different types of learners respond to various intervention strategies, which would help tailor support even more precisely. Finally, incorporating novel evaluation methods such as Deep ROC Analysis [27] could strengthen model fairness and help ensure that predictive tools are used responsibly in educational contexts.
Acknowledgement: The author gratefully acknowledges all individuals who provided feedback and constructive suggestions that contributed to the improvement of this study.
Funding Statement: The author received no specific funding for this study.
Availability of Data and Materials: The dataset used in this study is publicly available at: https://www.kaggle.com/competitions/measuring-student-persistence-and-completion-rate/data (accessed on 01 May 2025).
Ethics Approval: This study did not involve human participants, interventions, or access to confidential data. The dataset used is publicly available and fully anonymized, and therefore ethics approval was not required.
Conflicts of Interest: The author declares no conflicts of interest to report regarding the present study.
References
1. Liu H, Chen X, Zhao F. Learning behavior feature fused deep learning network model for MOOC dropout prediction. Educ Inf Technol. 2024;29(3):3257–78. doi:10.1007/s10639-023-11960-w. [Google Scholar] [CrossRef]
2. Specht-Boardman R, Chalasani S, Kostka K, Kite L, Brower A. The university of wisconsin flexible option is an effective model to prepare students for a recovering economy. J Competency Based Educ. 2021;6(1):e1235. doi:10.1002/cbe2.1235. [Google Scholar] [CrossRef]
3. Vogelsang B, Pilz M. Conditional factors for training activities in Chinese, Indian and Mexican subsidiaries of German companies. Eur J Train Dev. 2021;4(5):419–35. doi:10.1108/ejtd-04-2020-0066. [Google Scholar] [CrossRef]
4. Davis C, Bush T, Wood S. Artificial intelligence in education: enhancing learning experiences through personalized adaptation. Int J Cyber Serv Manag. 2024;4(1):26–32. doi:10.34306/ijcitsm.v4i1.146. [Google Scholar] [CrossRef]
5. Khalil M, Slade S, Prinsloo P. Learning analytics in support of inclusiveness and disabled students: a systematic review. J Comput High Educ. 2024;2023(1):1–18. doi:10.1007/s12528-023-09363-4. [Google Scholar] [PubMed] [CrossRef]
6. Lee S, Chung JY. The machine learning-based dropout early warning system for improving the performance of dropout prediction. Appl Sci. 2019;9(15):3093. doi:10.3390/app9153093. [Google Scholar] [CrossRef]
7. de Oliveira CF, Sobral SR, Ferreira MJ, Moreira F. How does learning analytics contribute to prevent students’ dropout in higher education: a systematic literature review. Big Data Cogn Comput. 2021;5(4):64. doi:10.3390/bdcc5040064. [Google Scholar] [CrossRef]
8. Asselman A, Khaldi M, Aammou S. Enhancing the prediction of student performance based on the machine learning XGBoost algorithm. Interact Learn Environ. 2023;31(6):3360–79. doi:10.1080/10494820.2021.1928235. [Google Scholar] [CrossRef]
9. Tyler M, Dymock D, Le AH. Retaining teachers and trainers in vocational education and training (VETmotivating career-changers to remain as VET educators. Res Post Compuls Educ. 2024;29(2):281–301. doi:10.1080/13596748.2024.2330782. [Google Scholar] [CrossRef]
10. Yamjal P, Al-Sa’di A. Strategies for retention and completion in vocational education: faculty perspec-tives. J Manag Bus Educ. 2022;5(4):247–65. doi:10.35564/jmbe.2022.0015. [Google Scholar] [CrossRef]
11. Bellmann L, Janik F. To recruit skilled workers or to train one’s own? Vocational training in the face of uncertainty as to the rate of retention of trainees on completion of training. Z Für ArbeitsmarktForschung-J Labour Mark Res. 2007;2(3):205–20. [Google Scholar]
12. Swacha J, Muszyńska K. Predicting dropout in programming MOOCs through demographic insights. Electronics. 2023;12(22):4674. doi:10.3390/electronics12224674. [Google Scholar] [CrossRef]
13. Gharahighehi A, Venturini M, Ghinis A, Cornillie F, Vens C. Extending Bayesian personalized ranking with survival analysis for MOOC recommendation. In: Proceedings of the 31st ACM Conference on User Modeling, Adaptation and Personalization; 2023 Jun 26–29; Limassol, Cyprus. p. 56–9. doi:10.1145/3563359.3597394. [Google Scholar] [CrossRef]
14. Psathas G, Chatzidaki TK, Demetriadis SN. Predictive modeling of student dropout in MOOCs and self-regulated learning. Computers. 2023;12(10):194. doi:10.3390/computers12100194. [Google Scholar] [CrossRef]
15. Niyogisubizo J, Liao L, Nziyumva E, Murwanashyaka E, Nshimyumukiza PC. Predicting student’s dropout in university classes using two-layer ensemble machine learning approach: a novel stacked generalization. Comput Educ Artif Intell. 2022;3(4):100066. doi:10.1016/j.caeai.2022.100066. [Google Scholar] [CrossRef]
16. Mubarak AA, Cao H, Zhang W. Prediction of students’ early dropout based on their interaction logs in online learning environment. Interact Learn Environ. 2022;30(8):1414–33. doi:10.1080/10494820.2020.1727529. [Google Scholar] [CrossRef]
17. Xing W, Du D. Dropout prediction in MOOCs: using deep learning for personalized intervention. J Educ Comput Res. 2019;57(3):547–70. doi:10.1177/0735633118757015. [Google Scholar] [CrossRef]
18. Bhurre S, Prajapat S. Analyzing supervised learning models for predicting student dropout and success in higher education. In: Advances in computational intelligence systems. Cham, Switzerland: Springer Nature; 2024. p. 234–48. doi:10.1007/978-3-031-47508-5_19. [Google Scholar] [CrossRef]
19. Nagy M, Molontay R. Predicting dropout in higher education based on secondary school performance. In: Proceedings of the 2018 IEEE 22nd International Conference on Intelligent Engineering Systems (INES); 2018 Jun 21–23; Las Palmas de Gran Canaria, Spain. p. 389–94. doi:10.1109/INES.2018.8523888. [Google Scholar] [CrossRef]
20. Kemper L, Vorhoff G, Wigger BU. Predicting student dropout: a machine learning approach. Eur J High Educ. 2020;10(1):28–47. doi:10.1080/21568235.2020.1718520. [Google Scholar] [CrossRef]
21. Radovanovic S, Delibasic B, Suknovic M. Predicting dropout in online learning environments. ComSIS. 2021;18(3):957–78. doi:10.2298/csis200920053r. [Google Scholar] [CrossRef]
22. Kim S, Choi E, Jun YK, Lee S. Student dropout prediction for university with high precision and recall. Appl Sci. 2023;13(10):6275. doi:10.3390/app13106275. [Google Scholar] [CrossRef]
23. TUWAIQ ACADEMY. Unlocking potential for elite training programs [Internet]. [cited 2025 May 1]. Available from: https://kaggle.com/competitions/measuring-student-persistence-and-completion-rate. [Google Scholar]
24. Osemwegie EE, Amadin FI. Student dropout prediction using machine learning. Fudma J Sci. 2023;7(6):347–53. doi:10.33003/fjs-2023-0706-2103. [Google Scholar] [CrossRef]
25. Salmi M, Atif D, Oliva D, Abraham A, Ventura S. Handling imbalanced medical datasets: review of a decade of research. Artif Intell Rev. 2024;57(10):273. doi:10.1007/s10462-024-10884-2. [Google Scholar] [CrossRef]
26. Chawla NV, Bowyer KW, Hall LO, Kegelmeyer WP. SMOTE: synthetic minority over-sampling technique. J Artif Intell Res. 2002;16:321–57. doi:10.1613/jair.953. [Google Scholar] [CrossRef]
27. Carrington AM, Manuel DG, Fieguth PW, Ramsay T, Osmani V, Wernly B, et al. Deep ROC analysis and AUC as balanced average accuracy, for improved classifier selection, audit and explanation. IEEE Trans Pattern Anal Mach Intell. 2023;45(1):329–41. doi:10.1109/tpami.2022.3145392. [Google Scholar] [PubMed] [CrossRef]
Cite This Article
 Copyright © 2025 The Author(s). Published by Tech Science Press.
This work is licensed under a Creative Commons Attribution 4.0 International License , which permits unrestricted use, distribution, and reproduction in any medium, provided the original work is properly cited.
 Downloads
 Citation Tools