
 Submit a Paper
 Propose a Special lssue
 Open Access
ARTICLE
Deep Learning-Based NLP Framework for Public Sentiment Analysis on Green Consumption: Evidence from Social Media
1 College of Economics and Management, Nanjing Forestry University, Nanjing, 210037, China
2 School of Information and Communication Engineering, Beijing University of Posts and Telecommunications, Beijing, 100876, China
* Corresponding Authors: Luyu Ma. Email: ; Xiu Cheng. Email:
Computers, Materials & Continua 2025, 85(2), 3921-3943. https://doi.org/10.32604/cmc.2025.067786
Received 12 May 2025; Accepted 11 August 2025; Issue published 23 September 2025
 View Full Text
 Download PDF
Abstract
Green consumption (GC) are crucial for achieving the Sustainable Development Goals (SDGs). However, few studies have explored public attitudes toward GC using social media data, missing potential public concerns captured through big data. To address this gap, this study collects and analyzes public attention toward GC using web crawler technology. Based on the data from Sina Weibo, we applied RoBERTa, an advanced NLP model based on transformer architecture, to conduct fine-grained sentiment analysis of the public’s attention, attitudes and hot topics on GC, demonstrating the potential of deep learning methods in capturing dynamic and contextual emotional shifts across time and regions. Among the sample (N = 188,509), 53.91% expressed a positive attitude, with variation across different times and regions. Temporally, public interest in GC has shown an annual growth rate of 30.23%, gradually shifting from fulfilling basic needs to prioritizing entertainment consumption. Spatially, GC is most prevalent in the southeast coastal regions of China, with Beijing ranking first across five evaluated domains. Individuals and government-affiliated accounts play a key role in public discussions on social networks, accounting for 45.89% and 30.01% of user reviews, respectively. A significant positive correlation exists between economic development and public attention to GC, as indicated by a Pearson correlation coefficient of 0.55. Companies, in particular, exhibit cautious behavior in the early stages of green product adoption, prioritizing profitability before making substantial investments. These findings provide valuable insights into the evolving public perception of GC, contributing to the development of more effective environmental policies in China.Keywords
According to the Intergovernmental Panel on Climate Change (IPCC)’s Sixth Assessment Report, there is more than 95% certainty that human activities have been the primary driver of the global rise in surface temperature1. As a result, GC, recognized as a sustainable consumption model, has gained international prominence and become a critical policy priority [1]. In response, the United Nations Environment Programme (UNEP) introduced the 10-Year Framework of Programmes (10YFP) to promote sustainable consumption globally, while the U.S. Energy Earthshots initiative aims to accelerate technological innovation in key energy sectors over the next 10–15 years2. Thus, advancing GC is essential for achieving long-term sustainability objectives [2].
Accordingly, Song et al. (2024) [3] show that environmental attitudes exert a significant positive influence on the intention to engage in environmental behavior, with a confidence level of 99%. Therefore, it is necessary for us to study public attitudes toward green consumption [4]. Existing research has emphasized identifying the determinants of GC and the factors that influence them. For instance, Nascimento and Loureiro (2024) [5] identified factors that shape people’s perceptions of GC, which can be categorized into several types. At the individual level, central issues include personal values, environmental awareness, consumption patterns, and lifestyle orientations [6]. In terms of social culture, social influences, reference groups, cultural contexts, and social norms are key factors [7]. Information availability and media campaigns, as environmental factors, have a significant impact on public attitudes. Economic factors, such as product prices and personal income, also affect perceptions. However, little research exists on the dynamics and evolution of public attitudes toward GC, which is the focus of the present study to help build momentum toward carbon neutrality.
With the development of Internet technology, online platforms have become an ideal space for expressing opinions. According to a report released by CNNIC3, there were approximately 1.1 billion Internet users in China, reflecting an Internet penetration rate of 78.0%. Traditional data collection methods, such as questionnaires and interviews, are often hindered by constraints like cost and inherent subjectivity [8]. Web-crawling technology has made it possible to efficiently extract large-scale textual data from social media, significantly reducing the time needed for data collection and enabling timelier, more thorough analysis of public opinions. This results in more effective policy-making. For example, Razzaq and Yang (2023) [9] employed web-crawling technology to extract 48 high-frequency terms from conferences and news in the field of digital finance as core explanatory variables, such as “internet finance” and “big data”. Additionally, as noted by Roumeliotis et al. (2024) [10], natural language processing (NLP) demonstrates nearly perfect predictive accuracy in small sample learning, with a maximum accuracy of 86.7%. With the support of web crawlers and NLP, large-scale datasets can be prepared for immediate analysis, allowing for a more detailed understanding of public sentiment, market trends, and social opinions, which supports improved decision-making [11].
In reviewing the literature on green consumption behavior, sustainable development, and text sentiment analysis, we identified a lack of research addressing the temporal and spatial dynamics of public attitudes toward green consumption, as well as the underlying causes of such variations. This paper presents the results of an exploratory web-scraping study aimed at assessing how public sentiment and attention toward green consumption fluctuate over time, across regions, and within social media networks [12]. The primary innovations of this study are as follows: First, web-crawling technology is employed as an objective data extraction method, improving statistical reliability by reducing the impact of outliers. Second, NLP is used for sentiment analysis, employing models like RoBERTa due to their good transfer learning and generalization capabilities, enabling a more accurate assessment of public attitudes. Finally, this study creatively proposes the “Government-Enterprises-Consumers Green Governance Initiative”, a policy framework grounded in the collaborative perspective of government, enterprises, and consumers, aiming to enhance the precision and effectiveness of environmental policymaking.
GC is a rational consumption pattern with ecological consciousness that aims to instill in consumers an awareness of their choices, encouraging them to select green goods and services while paying attention to recycling [8]. Studies on attitudes toward GC have shown that attitude is one of the most important factors influencing GC. Huang et al. (2022) [8] argued that changing public attitudes is key to promoting GC. Analyzing public attitudes is useful for identifying the sources of negative sentiments and the propagation path of public emotions [13]. Attitudes have become an important predictor of public intentions to reduce food waste in the theory of planned behavior [14]. In addition to attitude, other factors that impact public GC include perceived behavioral control and subjective norms, which have also been shown to be significant factors affecting GC [15]. Therefore, an in-depth investigation into public attitudes toward GC and the underlying mechanisms shaping them will provide critical insights for improving green consumption behaviors.
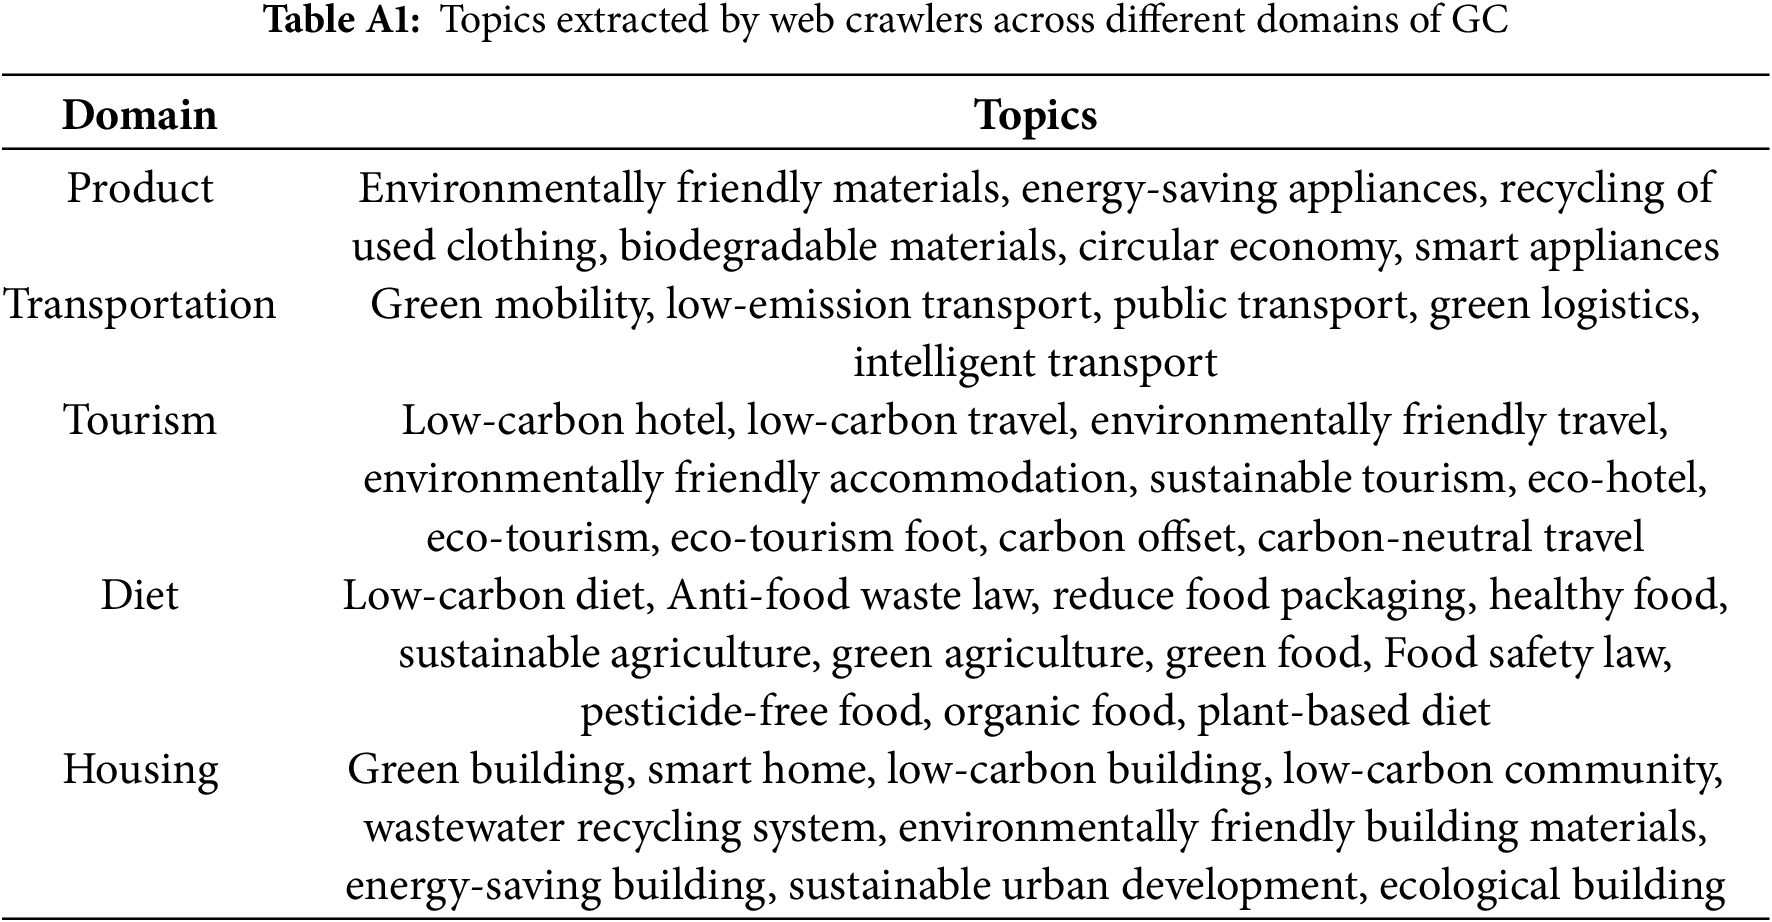
Earlier studies examined the impact of key aspects of consumption, such as green diets, green housing, green transportation, green products, and green tourism, on various consumption behaviors. For instance, research on green diets has addressed large policy issues, including anti-food waste legislation [16], strategies to garner customer support for green food, and food policies to promote healthy and sustainable diets. Green housing studies have prioritized occupant health and comfort, particularly focusing on lighting, ventilation, and other building design features that contribute to a healthy built environment. These studies also adhere to sustainability, low-carbon impact, and environmental responsibility principles throughout the building’s life cycle. Studies on green transportation have explored research on new energy vehicle adoption and the effect of social externality information on stimulating the adoption of green travel modes. Different aspects of green products examined in the literature include green packaging, sustainable procurement strategies, and subsidy policies through digital platforms aimed at promoting GC. In green tourism, previous studies have investigated initiatives aimed at encouraging low-carbon travel and consumer perceptions of eco-friendly hotels. Drawing upon the classification framework of the green consumption domain (see Table A1), this study systematically examines public attitudes within specific domains. The findings serve as a basis for proposing more targeted and actionable policy recommendations.
Grounded in stakeholder theory, resource dependency theory, and the key characteristics of GC, this study classifies all stakeholders involved in GC-related communication into four categories: government, media, companies, and individuals. Similar classifications have been proposed by several scholars. Huang et al. (2023b) [16] examined the Anti-Food Waste Law and classified stakeholders within the same four categories. Studies that recognize the government as a key stakeholder include research on China’s waste classification policies and the Anti-Food Waste Law [16]. The media plays a vital role in disseminating policies and shaping public opinion. They have been examined in studies on “greenwashing” debates and corporate sustainability practices.
Moreover, the Social Exchange Theory (SET) provides an appropriate theoretical framework for studying how GC is engaged on social media through the involvement of different stakeholders. As an influential theoretical standpoint, SET explains how stakeholders interact, communicate, and share sustainable consumption practices. Social network analysis constitutes a vital component of this study, facilitating a network-level examination of public attitudes toward green consumption, rather than focusing on individuals in isolation.
2.2 Sentiment Analysis on Social Media Platforms
Text sentiment analysis is a widely used text mining technique in social media research to extract and interpret user sentiments and opinions from textual data [17]. Early studies mostly relied on rule-based approaches and standard machine learning models. The NLPIR-Parser platform, powered by the Latent Dirichlet Allocation (LDA) model, was used to analyze public sentiment trends and the reasons behind different emotional responses [18]. While these methods performed well with smaller datasets, they struggled to scale effectively with larger datasets and more complex analytic tasks. Others employed emotion lexicons and scoring techniques for sentiment analysis. For example, Chen et al. (2022) [19] proposed a lexicon-based approach to summarize public responses to the policy on mandatory waste separation. Although relatively easy to apply, this method required considerable effort and lacked scalability for accommodating new vocabulary. Over the past few years, the emergence of deep learning has significantly advanced text sentiment analysis, yielding greater accuracy and more context-informed evaluations. Civil society has adopted a hybrid CNN-LSTM model for text classification on Weibo to investigate public attitudes toward GC [8]. Earlier sentiment analysis models extracted static word representations from word segments, combining them with embedding methods such as Word2Vec or GloVe. However, the development of Bidirectional Encoder Representations for Transformers (BERT) by Google AI in 2018 radically transformed the state of NLP, leading to significant improvements across various tasks. At the same time, BERTopic was developed to address the limitations of LDA and probabilistic latent semantic analysis, which were less effective for feature extraction in texts and particularly inadequate for short texts. Huang et al. (2023) [20] introduced further fine-tuning of BERT as GCP-BERT, adapted to cluster topics from comments on GCP posts. Additionally, a hybrid model combining BERT and RoBERTa-based architectures was trained on the Trofi dataset and underwent five iterations, resulting in a 2% performance gain in both the F score and overall accuracy (Briskilal and Subalalitha, 2022 [21]). Nowadays, Li and Zou (2024) [22] introduced a hybrid model named PLASA, which achieved micro-F1 scores of 93.94%, 90.34%, and 88.79% on three newly curated sentiment analysis datasets. Similarly, Chandra et al. (2025) [23] employed RoBERTa as a large language model (LLM) to examine sentiment dynamics during different phases of the COVID-19 pandemic. In another study, Ahamad and Mishra (2025) [24] proposed the ESIHE_AML framework, combining emotion sentiment insight with handwriting-electronic text analysis, and reported consistently high accuracy rates above 90%. Despite these developments, there has been little research using RoBERTa to study public sentiment. Therefore, RoBERTa was employed in this study to investigate public attitudes toward GC.
This study adopts a structured methodological framework consisting of the following key steps. This study employs web crawler techniques to collect GC-related text data from the Sina Weibo platform. It applies the RoBERTa model to perform three-way sentiment classification on user-generated content. By incorporating user profile information, the analysis explores public attitudes toward green consumption from multiple dimensions, including temporal evolution, spatial distribution, key issues, and social network structures. Based on these findings, the study proposes targeted policy recommendations from a tripartite collaborative perspective involving governments, enterprises, and consumers, aiming to effectively promote the development of green consumption practices. The detailed process is illustrated in Fig. 1.
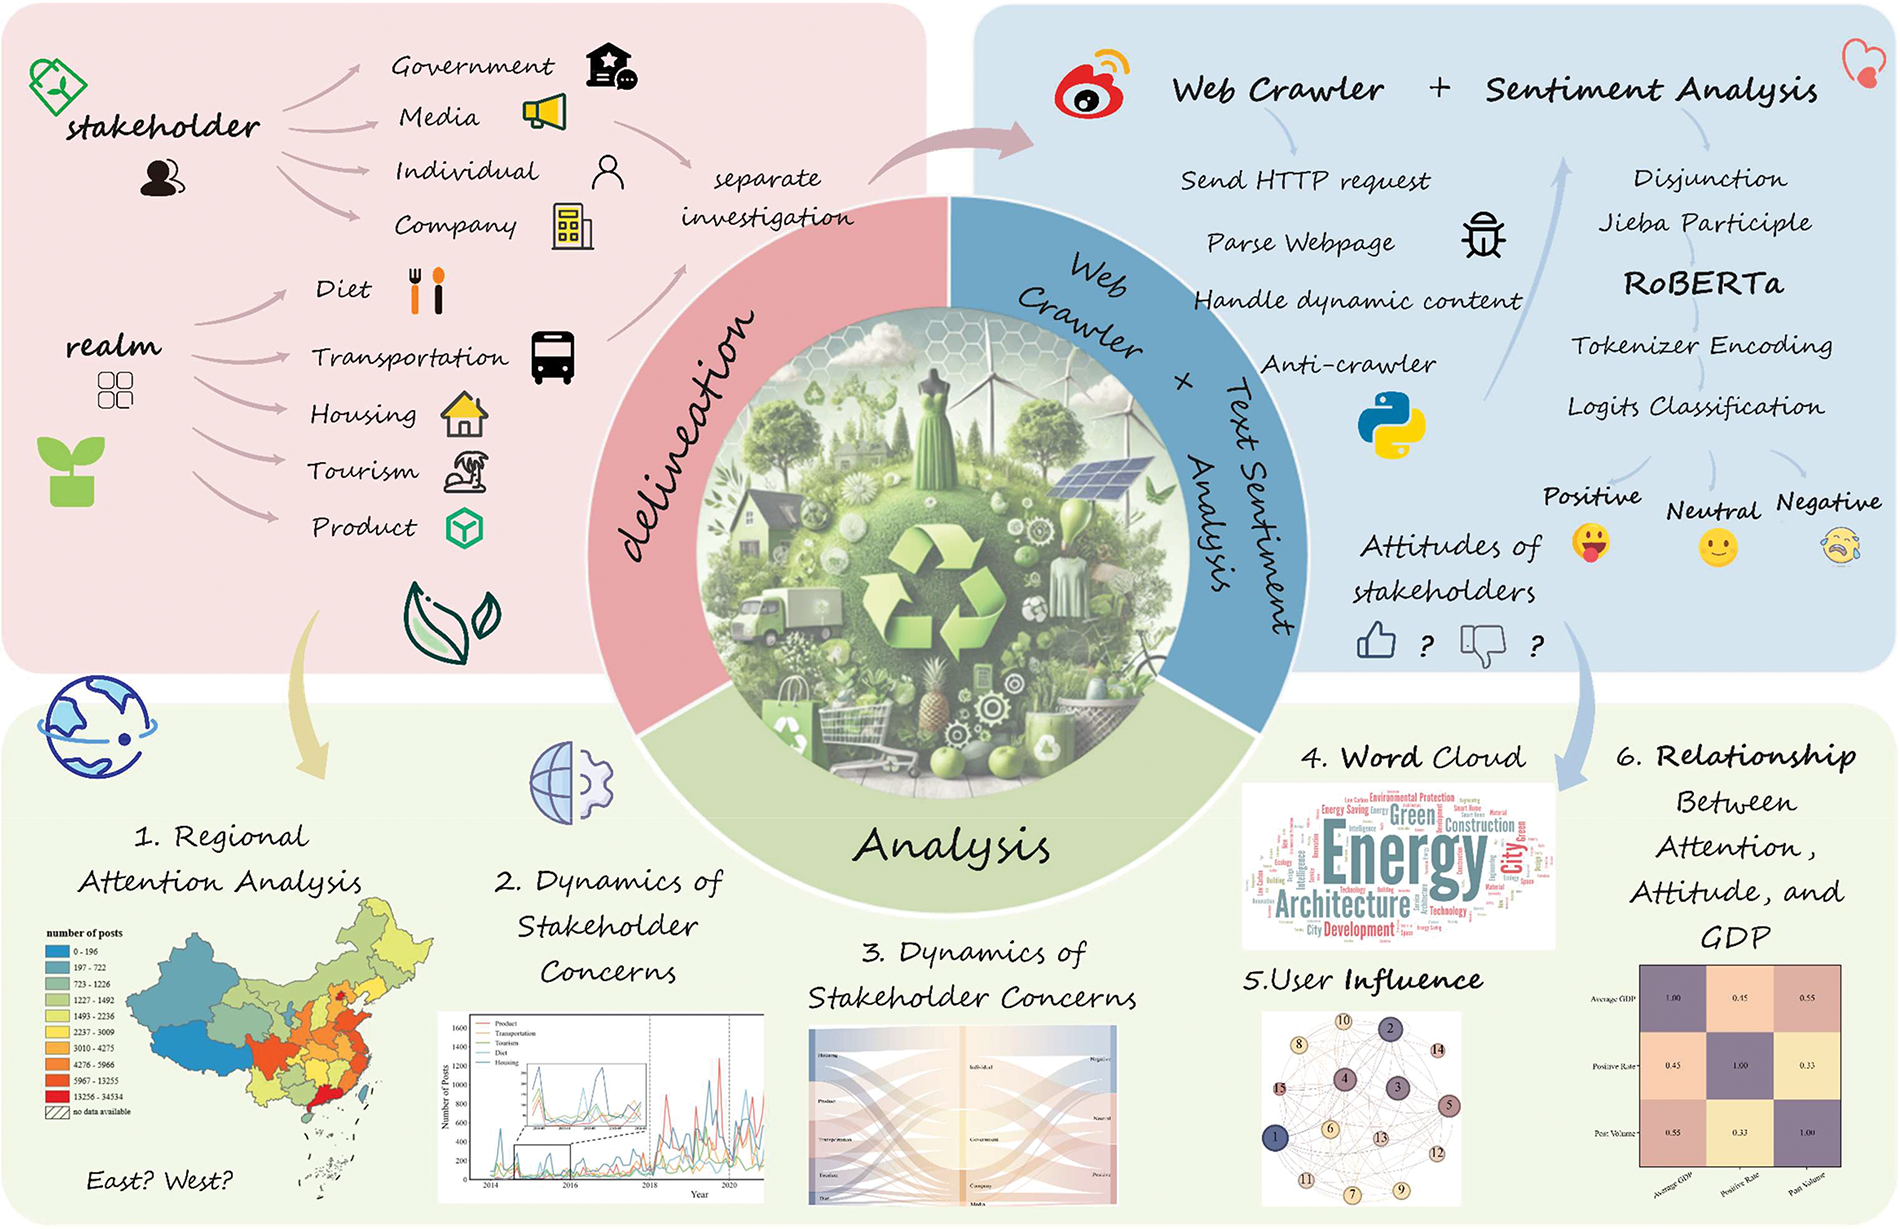
Figure 1: Research framework
This study selects Sina Weibo (Weibo) as the primary data source for several reasons. First, as of 2023, Weibo boasts over 590 million monthly active users (MAU), providing a high-frequency and real-time stream of public opinion data. In comparison, other popular social media platforms, such as Xiaohongshu (260 million MAU) and Zhihu (110 million MAU), have lower update frequencies, making them less effective for capturing evolving public sentiment in real time. Second, Weibo’s text-based structure, with an average post length of 50–100 words, is particularly well-suited for sentiment analysis. In contrast, platforms like Xiaohongshu and TikTok focus primarily on video content with limited textual data, while Zhihu’s long-form Q&A format, although useful for in-depth discussions, is less effective for tracking real-time trends. Finally, Weibo demonstrates strong dissemination capabilities, with trending topics often exceeding 100,000 retweets within 24 h. This rapid spread of information encourages large-scale public engagement and facilitates widespread discourse.
We employed web crawler technology to extract posts from Weibo that contained specific domain topics related to GC (detailed in Table A1), covering the period from 23:00 on 1 January 2014, to 23:00 on 31 July 2024. The collected data included usernames, follower counts, IP addresses, authentication names, post content, release time, and engagement metrics such as retweets, comments, and likes. In compliance with the robots.txt protocol and legal regulations, a Python program was developed to simulate user access to webpages for extracting both structured and unstructured information. This data was then processed using a parsing library. Traditional statistical methods often struggle with timely updates, making it difficult to capture nuanced market behaviors and individual decisions. In contrast, web crawler technology enables real-time and automated extraction of vast amounts of data from diverse online sources. Notably, Weibo’s NASDAQ listing in April 2014 marked a significant shift toward mobile usage, with mobile active users surpassing 70% of the total user base. Given this shift, 1 January 2014, at 23:00 was selected as the study’s starting point. Meanwhile, 31 July 2024, at 23:00 was chosen as the cut-off date to ensure data completeness, as it represents the most recent full month available at the time of collection. In total, 189,742 posts were retrieved, covering discussions on GC.
First, the raw data were preprocessed by removing invalid characters, such as emoticons, special symbols, and HTML tags, as well as eliminating duplicate records and entries with missing values in the ‘post content’ field. A total of 1233 entries (0.65% of the dataset) were discarded to maintain data integrity. Next, timestamps were standardized, as the time representations (e.g., ‘just now,’ ‘1 h ago’) on Weibo could not be directly utilized for analysis. The original ‘release time’ data, recorded with minute-level granularity, presented challenges due to its high temporal resolution. To address this, all timestamps were converted into a uniform date-time format (YYYY-MM-DD), making it easier to conduct subsequent dynamic temporal analysis. The ‘post content’ was tokenized into short phrases or lexical units using Jieba, a Chinese text segmentation tool in Python’s standard library. Afterward, stop words were filtered out using a comprehensive stop-word list, cross-referenced with Baidu’s stop-word list, the Machine Intelligence Laboratory of Sichuan University’s deactivated thesaurus, and resources from the CSDN and GitHub communities. This process effectively reduced noise in the textual data, improving both data quality and processing efficiency. After completing these preprocessing steps, 188,509 valid post records remained for further analysis.
3.3 Text Sentiment Analysis Based on RoBERTa Model
RoBERTa is an enhanced variant of the BERT model developed by the Facebook AI Research (FAIR) team. It retains many features of BERT’s transformer architecture while introducing several key improvements. First, it uses a much larger dataset and is trained for a longer duration, ensuring more stable training [25]. Second, RoBERTa employs dynamic masking [26], discarding the Next Sentence Prediction [25] task to accelerate the acquisition of contextual knowledge. Third, it adopts significantly larger batch sizes and higher learning rates [21], enhancing the model’s ability to capture complex linguistic patterns. These adjustments enable RoBERTa to achieve greater accuracy and robustness in natural language processing tasks, as it excels in capturing contextual dependencies. Specifically, we implemented a transformer-based NLP pipeline with dynamic masking and contextual attention learning via RoBERTa. The model was trained on our labeled dataset to optimize cross-entropy loss across sentiment categories, effectively capturing nuanced semantic contexts and improving classification performance. After the preprocessed text is input into the RoBERTa model, subword-level tokenization is automatically performed to segment the text into subword units. Then, a built-in stop-word list is used to filter out semantically weak tokens, retaining only key inputs. These subwords are subsequently passed into the Transformer encoder to model contextual semantic dependencies. Finally, the model classifies the text sentiment into three categories: positive, neutral, and negative. The structure of the Transformer mechanism is illustrated in Fig. 2.
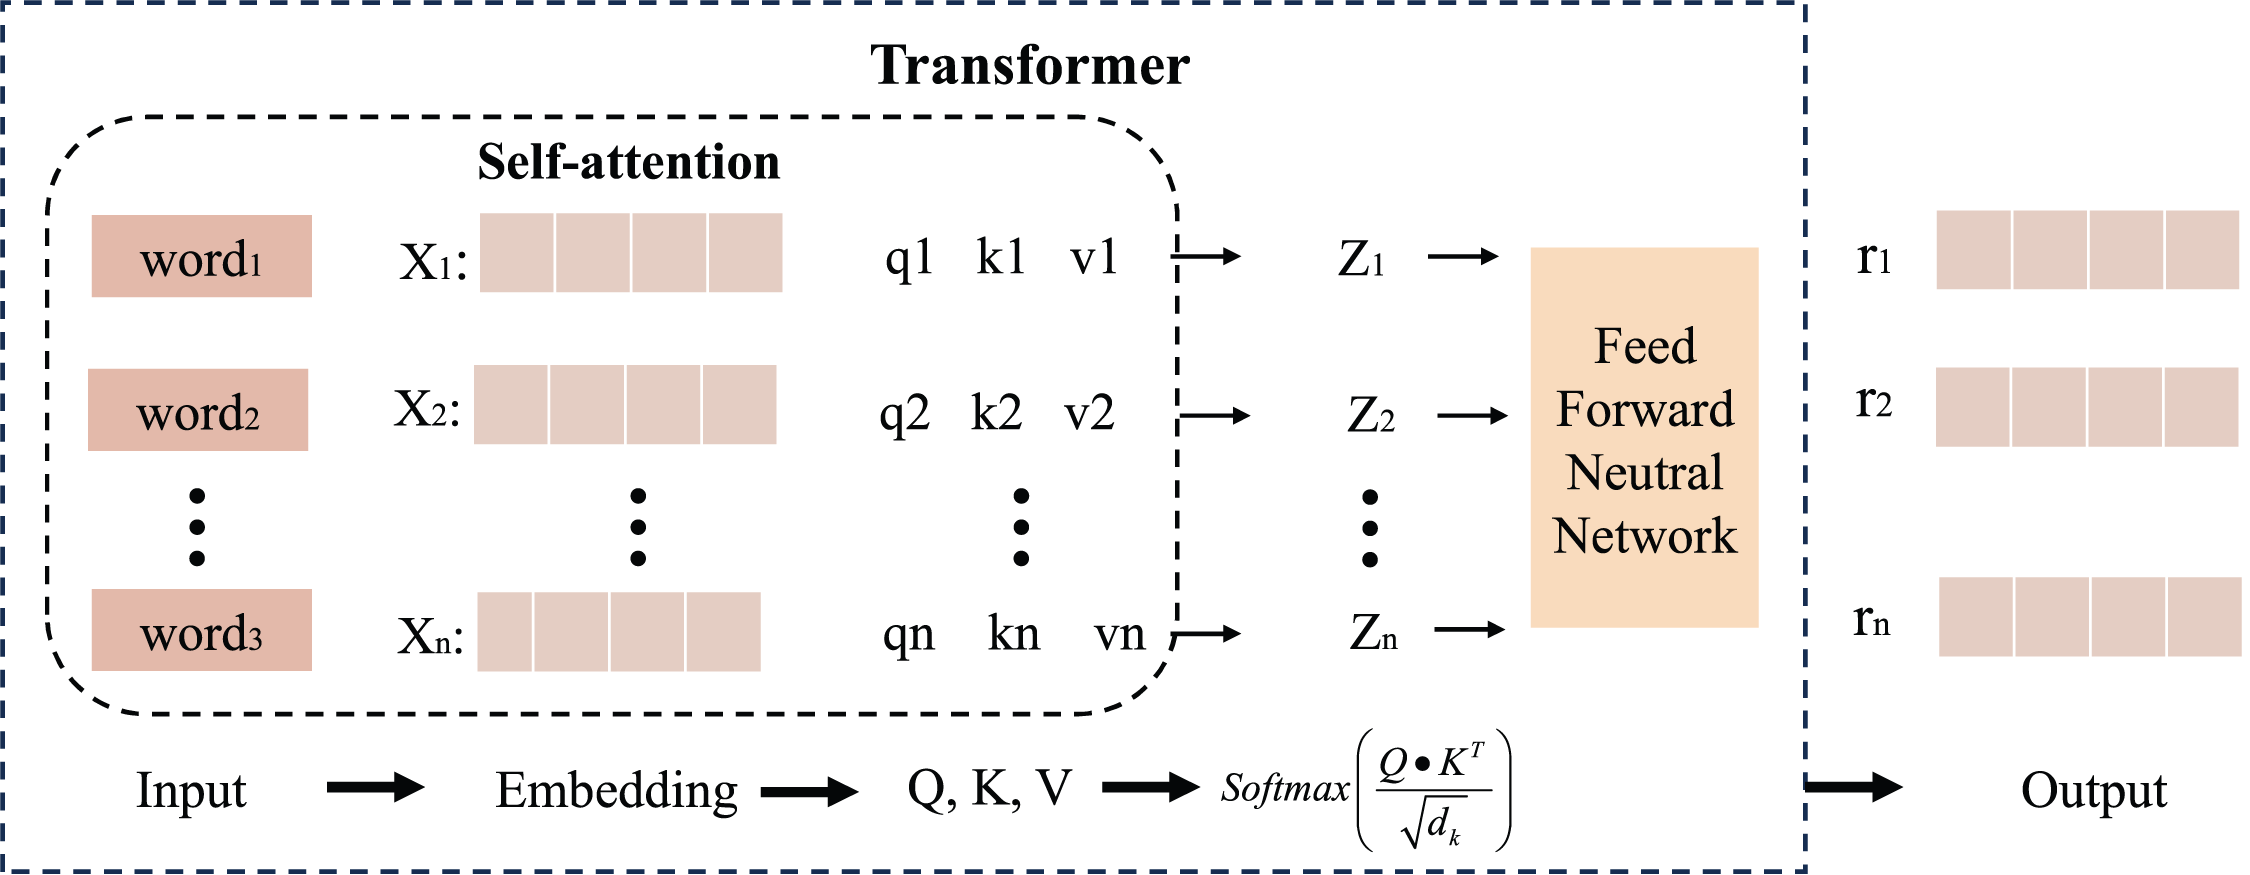
Figure 2: Transformer structure of the RoBERTa model
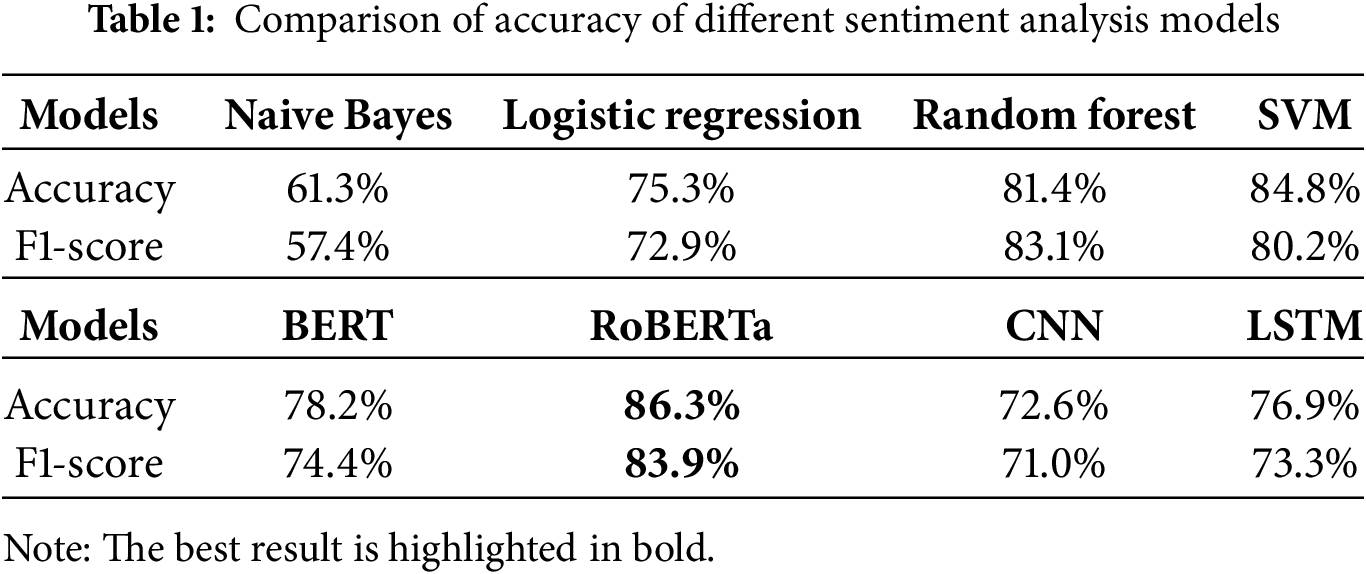
To evaluate the classification accuracy of the RoBERTa model in sentiment analysis, we randomly sampled 500 posts from the collected social media dataset and manually annotated their sentiment labels (positive, neutral, or negative) to construct a test set. A set of representative sentiment analysis models, including Support Vector Machine (SVM), Random Forest, Convolutional Neural Network (CNN), Long Short-Term Memory (LSTM), BERT, and RoBERTa, were employed for performance comparison. Table 1 presents a comprehensive quantitative comparison across eight models (e.g., BERT, CNN, SVM), confirming RoBERTa’s superior performance with an accuracy of 86.3% and an F1-score of 83.9%, thereby validating its effectiveness in sentiment classification tasks.
A social network refers to a structured system comprising social actors and the relationships among them (Li et al., 2023) [27]. Social Network Analysis (SNA) is a quantitative research methodology designed to identify and interpret patterns of interaction between these actors (Shen and Wang, 2023b) [28]. Gephi has been widely employed by scholars for the visualization of complex networks, owing to its capabilities in interactive modeling and structural analysis. In this study, Gephi is utilized to map the social relationships among users on Sina Weibo, allowing for the identification of key actors and the analysis of their interaction dynamics. Following the methodological framework proposed by Li et al. (2023), we computed the in-degree, out-degree, and total degree of each node in the network. Based on these metrics, users with the highest degree values were identified as potentially influential actors. This analytical approach facilitated the detection of central participants in the network and enabled a deeper examination of their roles within the overall structural configuration.
4.1 Trends in Information Dissemination on Microblogs on the Theme of GC
This study quantified the total number of posts (NP) across five key domains-green diet, green transportation, green housing, green tourism, and green products-on a monthly basis from 1 January 2014, to 31 July 2014, to assess fluctuations in public attention to GC over time. By integrating major events with evolving trends in public sentiment, four distinct stages emerge: the budding stage, the rising stage, the fluctuation stage, and the boom stage. The temporal variations in attention across these stages are shown in Fig. 3.
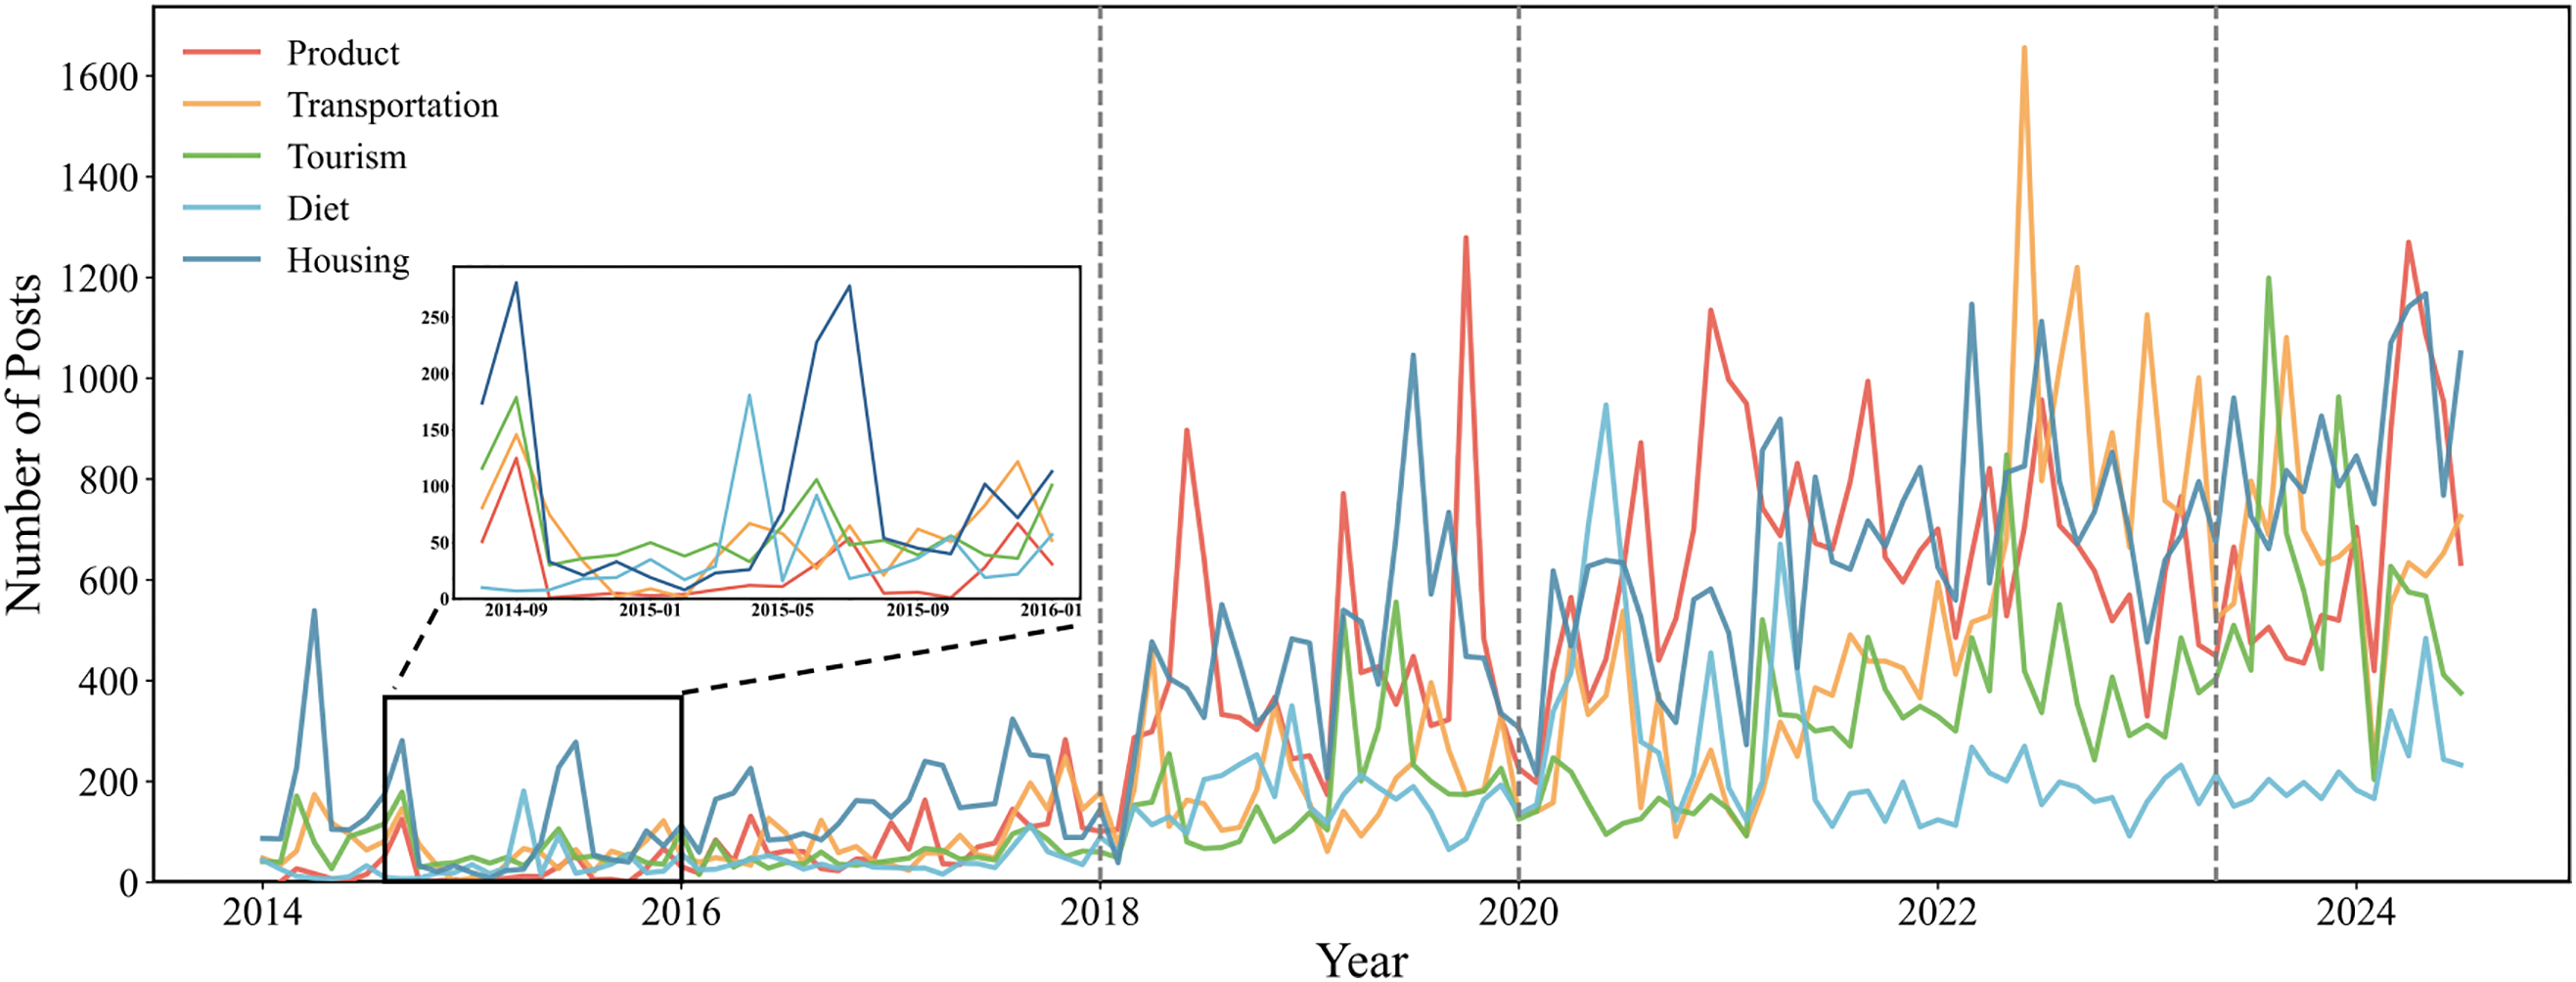
Figure 3: Temporal trends in public attention across five green consumption domains
During the budding stage (January 2014–January 2018), the low NP and minimal fluctuations across all five domains suggest limited user engagement in GC discussions during the early years of the platform. A notable surge in green housing posts occurred in April 2014, with an increase of 539 posts, primarily driven by two key events: the National Energy Conservation Center (NEC) announced on 22 April 2014, the ranking of U.S. cities by energy-efficient buildings, and the Ministry of Housing and Urban-Rural Development (MOHURD) reported on 29 April 2014, highlighting the construction of 1.44 billion square meters of energy-efficient buildings in China in 2013. These events drew significant public attention to green housing. Furthermore, a moderate increase in discussions on green housing was observed in July 2015, when the total NP by Weibo users reached 278, surpassing discussions in other domains. This can be attributed to the fundamental necessity of housing, indicating that early GC discourse primarily focused on essential topics. In contrast, green tourism, green products, and green diet received relatively low engagement during this period. Overall, discussions across all domains remained sparse, reflecting the platform’s nascent user base and the absence of significant discussion hotspots at this stage.
The rising stage continued from February 2018 until January 2020, triggered by a brief decline in public attention to all areas in early 2018, possibly due to the rise of competing social issues towards the end of 2017, which momentarily diverted public interest away from GC. Beginning in early 2018, all domain areas experienced fluctuating upward trends in NP, driven by the enhancement of global environmental awareness and increased participation in environmental advocacy. Among these domains, green products grew the fastest, with an average annual growth rate of 26.4% and three separate peaks, the most noticeable occurring in June 2018 (897 posts) and October 2019 (1279 posts). The results indicate a growing preference for green products among consumers, influenced by factors such as product prices, education levels, environmental awareness, and demographic characteristics. Green tourism and green transportation displayed pronounced seasonal spikes, particularly during holidays, reflecting their association with vacation planning and travel-related discussions. Meanwhile, discussions on green housing remained steady but showed slower growth compared to tourism and products, indicating a shift in public discourse from essential needs to topics oriented toward entertainment and consumption.
The fluctuation stage (February 2020–May 2023) was significantly shaped by the economic disruptions caused by the COVID-19 pandemic. Between 2020 and 2022, the cumulative global economic loss exceeded $10.4 trillion, with the European Union, the United States, and China accounting for 30.44%, 18.74%, and 15.44% of the total loss, respectively. Notably, these economic disruptions had a marked impact on GC discussions. A decline in NP across green products, green tourism, and green transportation was observed in early 2020, coinciding with the implementation of travel restrictions. At the same time, public attention shifted toward housing improvements and dietary habits due to prolonged home confinement, leading to noticeable peaks in diet-related discussions, with 947 posts in June 2020 and 671 posts in April 2021. The global agri-food system was particularly fragile during the COVID-19 pandemic, yet food remained a fundamental necessity. As a result, discussions in this domain remained relatively stable and even exhibited an increasing focus on food-related issues. From 2021 to 2022, as pandemic-related restrictions eased, discussions on green transportation, tourism, and products rebounded, reflecting post-pandemic recovery in consumption.
The boom stage (June 2023–July 2024) was characterized by a substantial increase in GC discussions, with a sharp rise in NP across all five domains. In May 2024, green housing reached a peak of 1168 posts, while discussions on green products remained consistently high. Similarly, green tourism recorded 1199 posts in August 2023, suggesting that the COVID-19 pandemic had reinforced public environmental consciousness. Additionally, engagement in green diet discussions surged in late 2023, reflecting its emergence as a mainstream trend. A significant increase in posts was observed across all domains except transportation in April and May 2024. The Green Consumption High-Quality Development forum, held on 26 April 2024, with the theme ‘Adhering to Green Development and Promoting Green Consumption’, likely played a central role in this surge4.
Despite uncertainties surrounding GC trends, NP exhibited an average annual growth rate of 30.23%, underscoring the continued expansion of public engagement in sustainable consumption. This growth has been driven by policy incentives, rising health consciousness, and heightened environmental awareness, suggesting a sustained upward trajectory in GC discussions.
4.2 Analysis of Regional Attention in Different Areas
Section 4.1 provides a detailed analysis of the temporal dynamics and evolving trends in public attention toward GC. It also examines the spatial distribution of public interest by using the number of posts (NP) related to GC topics as a key measure of engagement. To explore regional differences in interest, users’ IP addresses are geographically categorized according to China’s 34 provinces. This classification allows for an evaluation of the relative importance of GC in different regions, as shown in Fig. 4.
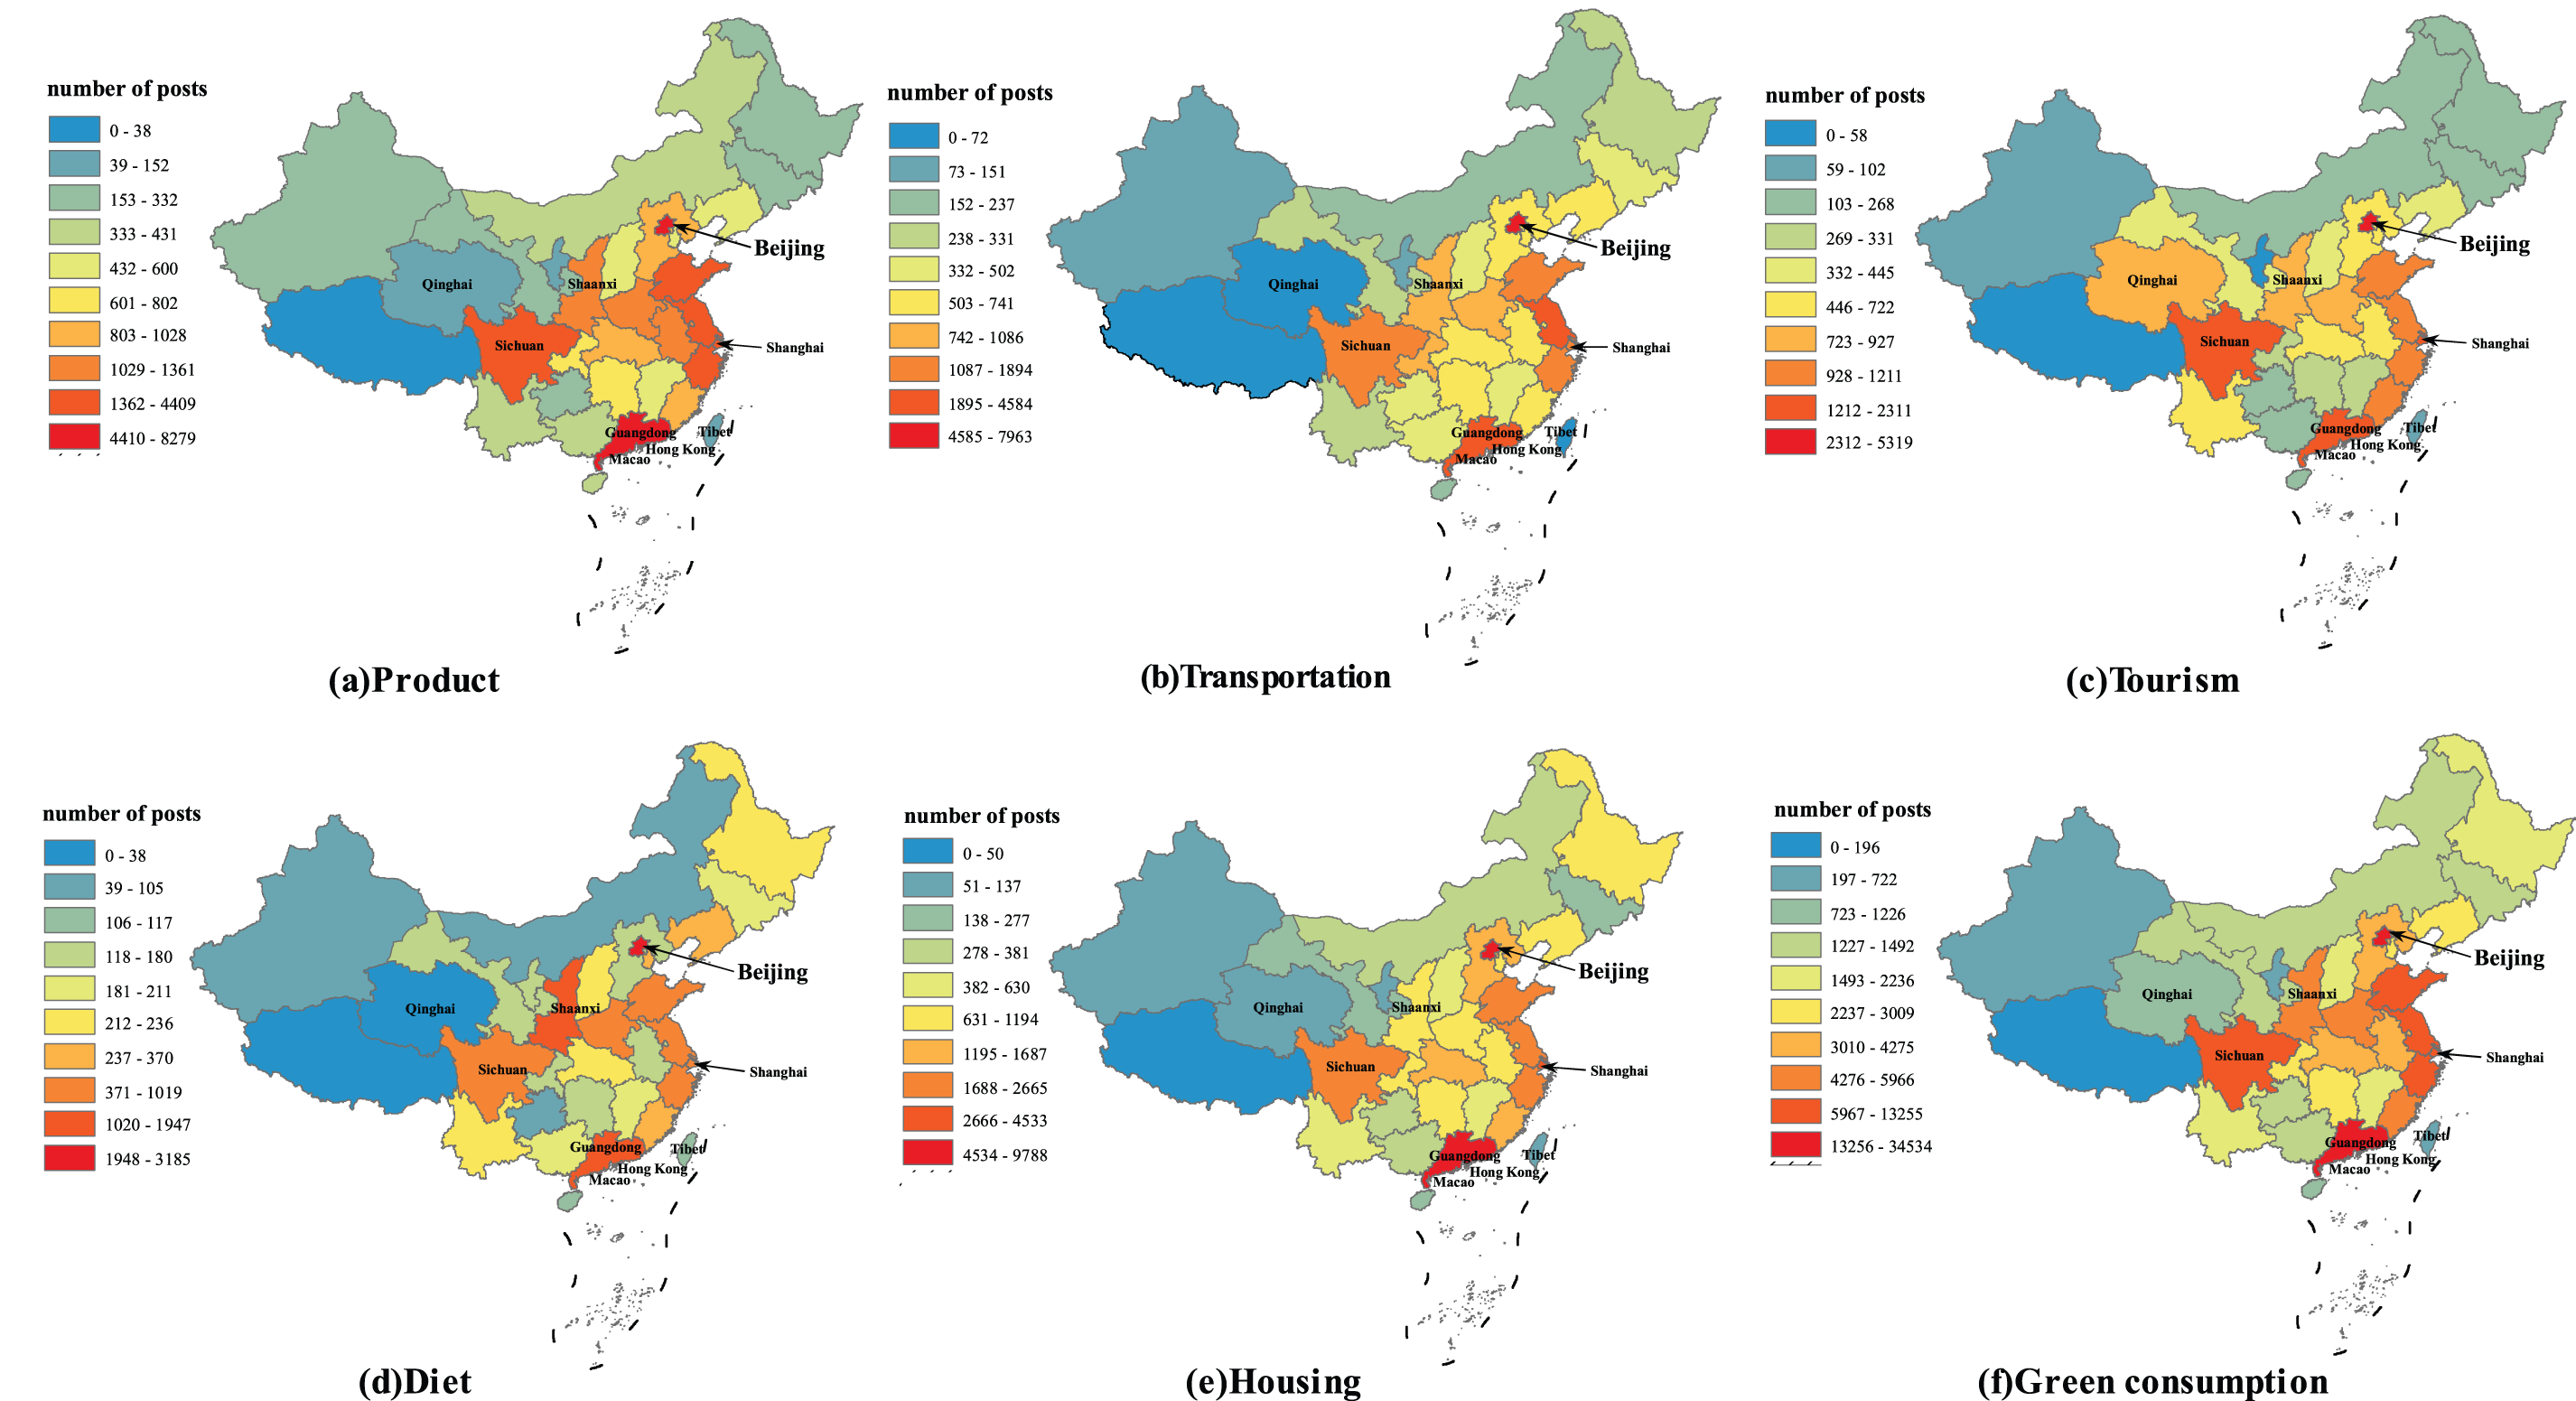
Figure 4: Provincial distribution of public attention across five green consumption domains
Beijing leads the nation in NP across all domains, with a total of 34,534 posts, which accounts for 20.89% of China’s total volume. To understand the factors driving this dominance across the five domains, this study first focuses on Beijing as a case study. The NP for green housing in Beijing reached 9788, a figure largely driven by the tendency of some local governments to strictly follow the minimum requirements set by the central government’s strategic objectives [20]. Nevertheless, Beijing has demonstrated a strong ability to implement policies effectively, particularly in the areas of green housing, green diet, and green transportation [16]. The increased public engagement with green diet (3185 posts) can largely be attributed to the integration of green development into the core goals of agricultural supply-side structural reform. Beijing also plays a key role in reducing food waste and promoting sustainable agricultural supply chains, further reinforcing its commitment to green development. Additionally, the city’s long-standing efforts to promote new energy vehicles align with national policies, while the need to address traffic congestion has further fueled public interest in green transportation [29].
After analyzing the key province, the study explores the spatial distribution characteristics across various domains. Economically advanced regions, especially Beijing, Guangdong, and Shanghai, dominate NP in green transportation, green housing, green tourism, and green diet. These regions show substantial advantages in infrastructure-related topics. For instance, green transportation posts in Beijing totaled 7963, while most provinces had fewer than 1000. Similarly, green housing posts in Beijing, Guangdong, and Shanghai were 9788, 7796, and 4533, respectively, far surpassing the national average of 1393. The high economic levels of these three cities suggest that economic growth and sustainable development are closely intertwined. In first-tier cities, governments not only focus on enacting targeted policies but also regulate public behaviors, which leads to regional disparities in attention levels, a finding consistent with Huang et al. (2022) [8]. In contrast, public concern for GC in central and western regions is much lower. For example, Sichuan and Shaanxi exhibited moderate engagement with specific GC topics, with 1571 posts on green tourism in Sichuan and 1683 posts on green diet in Shaanxi. However, their overall engagement was still lower than in the more developed regions in the east and south. Meanwhile, Tibet, Qinghai, Macao, and Hong Kong exhibited minimal activity across all topics, with Hong Kong recording zero or nearly zero posts. This reflects the generally low level of social media engagement with GC topics in the mid-western and peripheral regions [30].
The spatial distribution of public concern for GC reveals significant regional disparities. The southeastern coastal region and its surrounding provinces account for 81.6% of the total posts, a figure far exceeding that of the central and western regions. This trend is consistent with Huang et al. (2022) [8]. One possible explanation for this pattern is the higher level of economic development in the southeastern coastal region, where public attention to GC policies tends to correlate positively with local economic development. Additionally, differences in local government priorities for GC and variations in policy enforcement are closely tied to differences in education levels and technological development. Discussions related to infrastructure are concentrated in the southeastern coastal region, while topics such as tourism and diet show a more balanced distribution across China. This difference can be largely explained by the well-developed transportation and real estate sectors in the southeastern coastal areas, as well as the strong food culture and tourism industry in the central and western regions. Green housing discussions are most prominent in eastern China, followed by central China, and least so in the western region, as shown by Huang et al. (2023) [16]. This trend emphasizes the importance of policy support, economic incentives, public acceptance, technological innovations, and creative thinking in advancing green building initiatives. Likewise, in the case of green transportation, the distribution of charging infrastructure for new energy vehicles remains highly uneven, with much higher coverage in the eastern region compared to the central and western regions. This disparity is strongly linked to financial incentives and research and development (R&D) support measures. When implementing global policies at the local level, governments can address region-specific challenges by tailoring policies to local conditions, thus playing a crucial role in advancing GC initiatives.
4.3 Dynamic Evolutionary Analysis from a Stakeholder Perspective
Different stakeholders-including the government, media, companies, and individuals-prioritize distinct domains of GC. To further explore the distribution of stakeholder perspectives, this subsection divides the timeline into four key stages (consistent with Section 4.1): budding, rising, fluctuating, and booming. Fig. 5 illustrates the evolutionary trajectory of stakeholder attitudes across these stages.
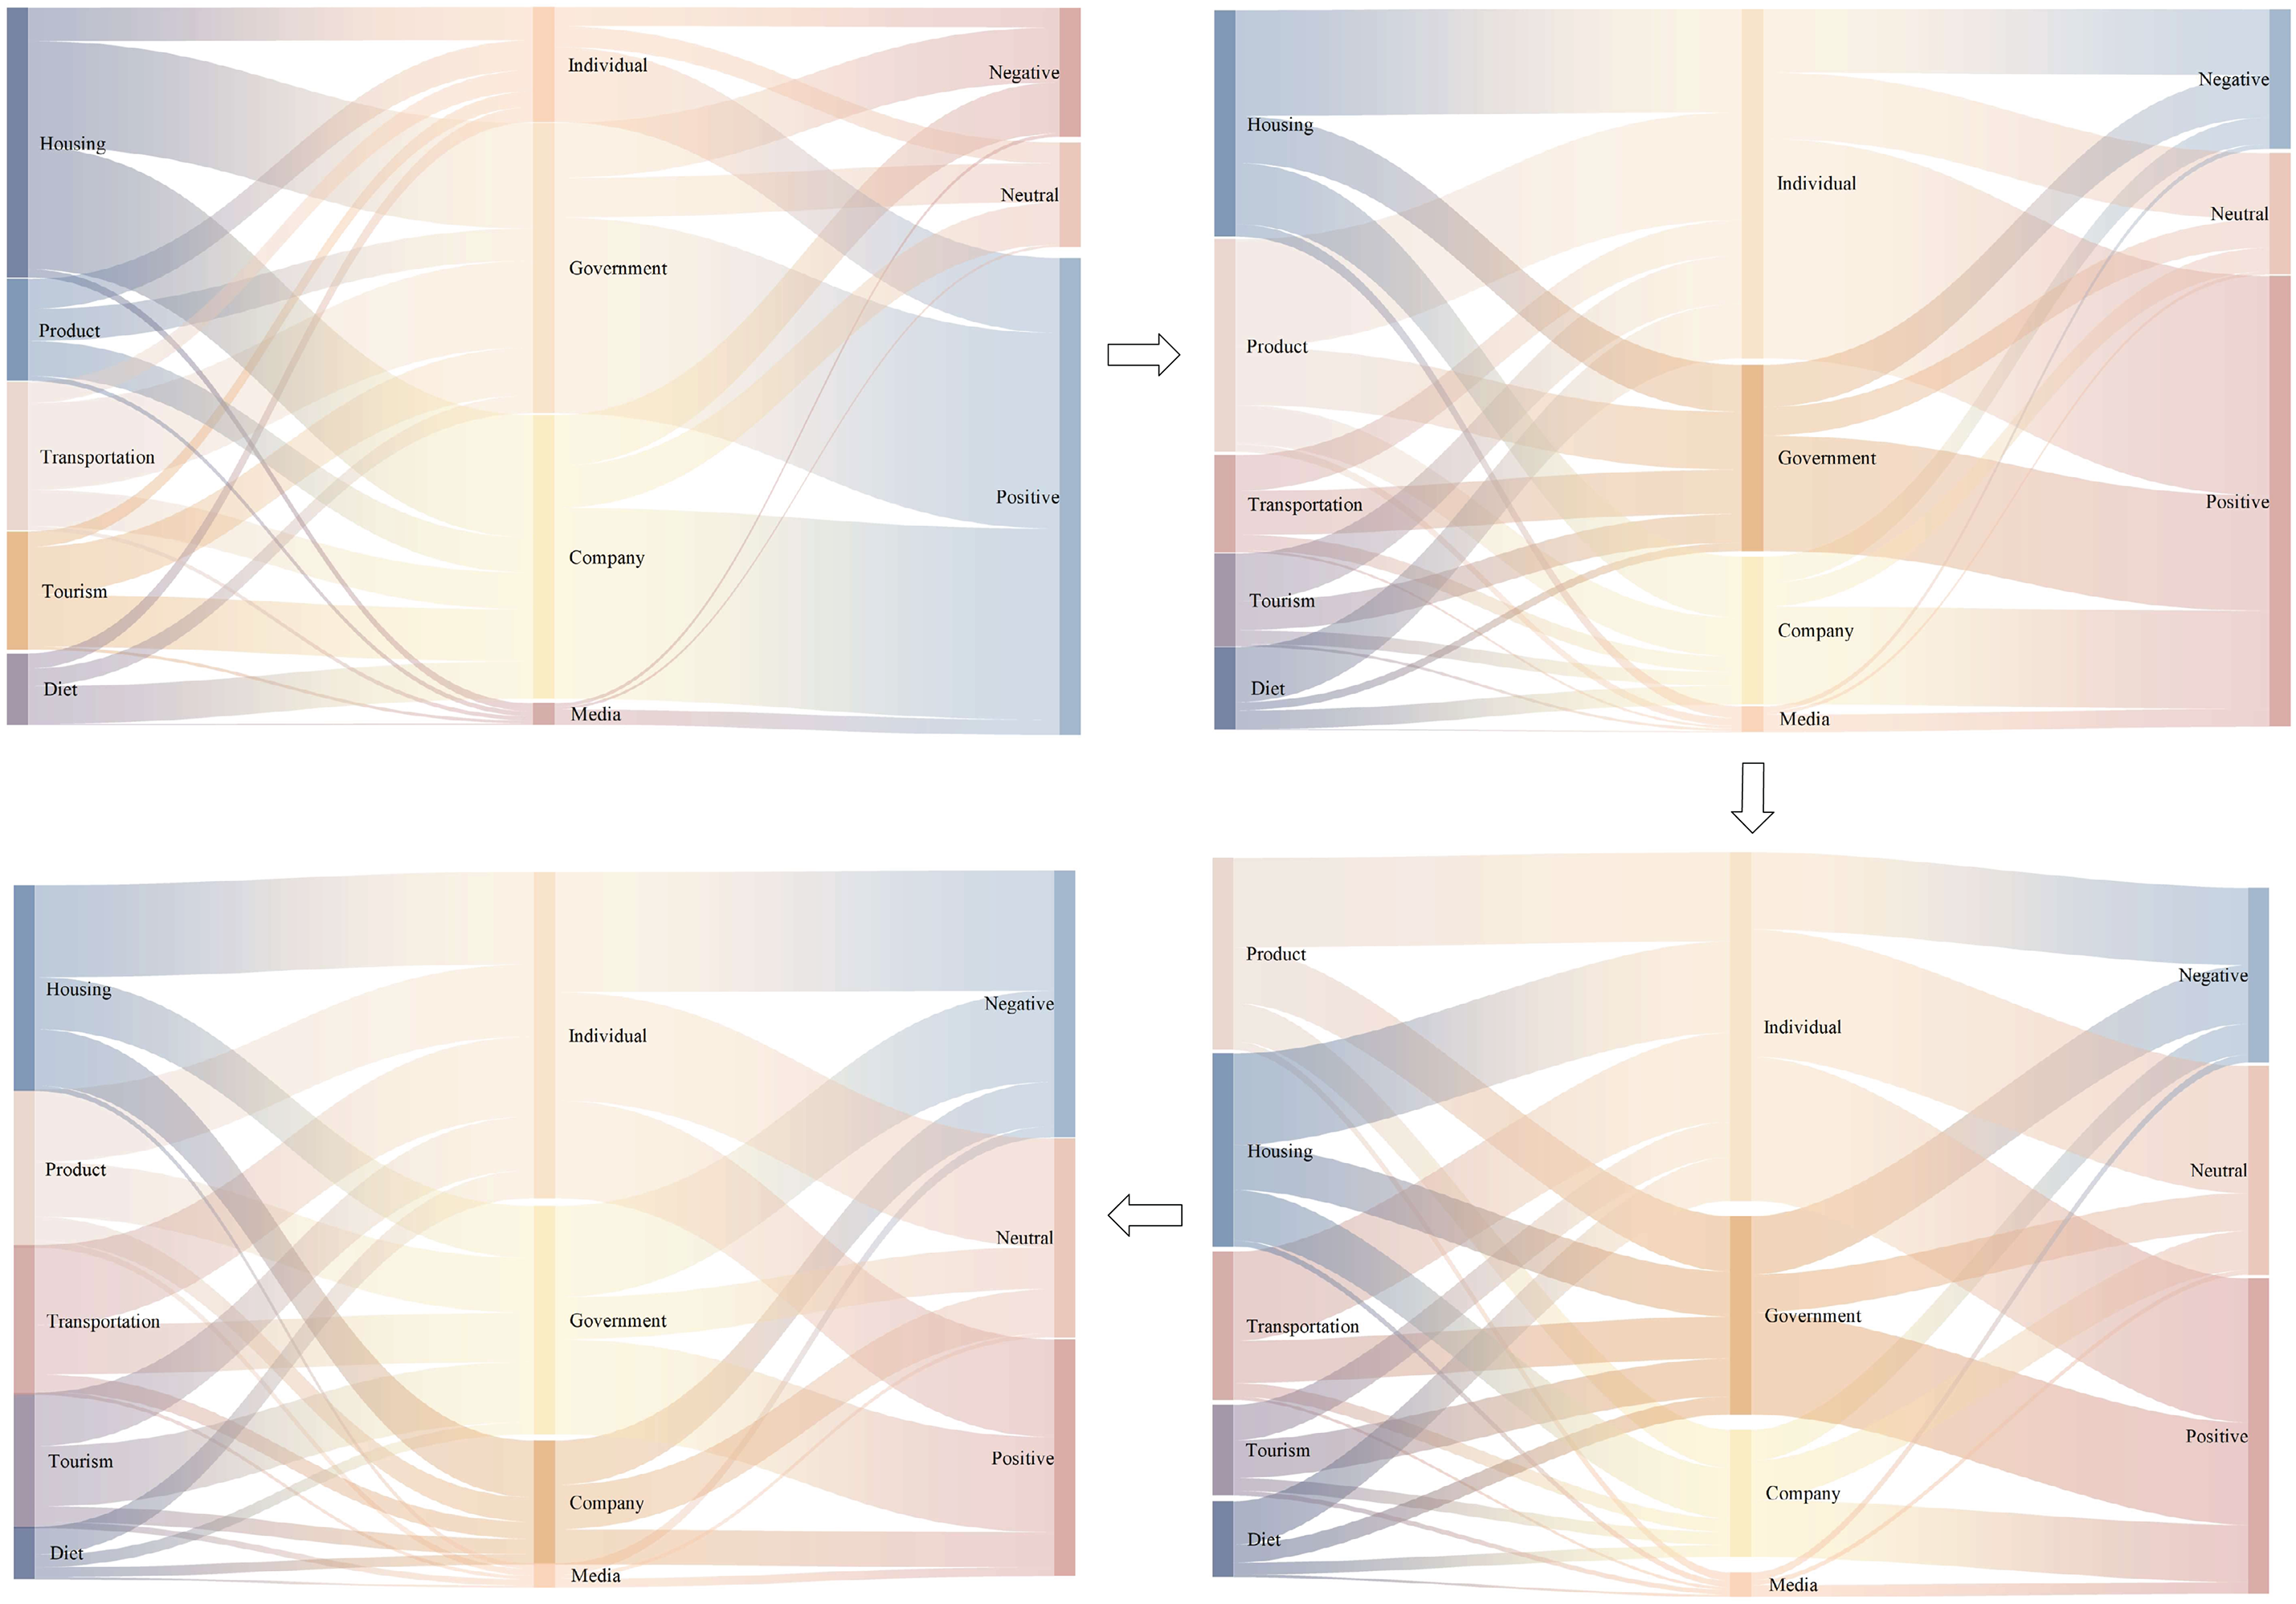
Figure 5: Dynamic presentation of stakeholder sentiments across different green consumption domains
During the budding stage, the process was primarily driven by policy, with strong support from all stakeholders. Positive sentiment toward housing and transportation reached 88.9% and 76.3%, respectively, while negative sentiment remained below 10% in both areas. At this early stage of GC promotion, public awareness was limited, making people particularly receptive to policy guidance. The Green Building Action Plan introduced by the State Council sparked increased discussions around green housing. Additionally, green transportation gained substantial public attention, largely due to the government’s strong support for adopting new energy vehicles.
In the rising period, the market gradually adapted to the green transition. Negative sentiment toward green tourism increased to 65.8%, largely due to perceived discrepancies between service costs and user experience. Business engagement rose significantly during this time, as enterprises expressed a high level of concern about the associated costs of green products. Environmentally friendly investments with low profitability were less likely to be accepted by businesses.
During the fluctuating period, the green diet domain emerged as the focal point of public attention. The proportion of neutral sentiment rose to 29.9%, while positive sentiment declined to 45.1%. Public attitudes toward green diet remained ambivalent, partly due to disruptions caused by the COVID-19 pandemic, which impacted traditional food trading channels and global food production and supply chains [16]. The lack of understanding about COVID-19 triggered neurotic behaviors linked to negative emotions, such as depression, anxiety, loneliness, fear of the unknown, and concern about product shortages. Notably, negative sentiment in green housing increased to 25.03% during the pandemic, attributed to emotional instability and an elevated risk of depression caused by prolonged home confinement. In the green tourism domain, negative sentiment reached an even higher level of 79.1%, as health concerns led individuals to reconsider travel plans, thereby hindering the development of sustainable tourism.
Finally, during the boom period, GC entered a phase of marketization and stabilization, with the three types of sentiment-positive, negative, and neutral-remaining largely balanced. Green tourism experienced a resurgence as public attention in the post-pandemic era increasingly focused on health, safety, and environmental sustainability [16]. Positive sentiment toward green products rose to 58.0%, while negative sentiment (9.8%) and neutral sentiment (32.2%) among businesses remained high, indicating that market acceptance of GC had not yet reached an optimal level. Therefore, more incentive-driven policies should be introduced to strengthen business confidence and encourage active investment in green product development, sustainable production, and environmental technology innovation. The high construction costs associated with green housing, combined with the sluggish economy, have contributed to the highest proportion of negative sentiment, exceeding 60%. In response, the 14th Five-Year Plan for the Development of Building Energy Efficiency and Green Buildings, issued by the Ministry of Housing and Urban-Rural Development of China, aims to improve public attitudes toward green housing in the future5.
Overall, government regulation plays a crucial role in shaping and guiding resident GC behavior. Moreover, the proportion of positive sentiment in all stages exceeds 85%. Individual participation in the budding stage remained limited, reflecting a lack of societal awareness and understanding of GC. However, the base of individual participation grew substantially in the latter three stages, forming a large group that influences public opinion and guides intervention policies. Although COVID-19 shook stakeholders’ attitudes toward GC, the overall recognition of GC by the public has continued to rise. Our findings suggest that companies often remain cautious until ROI is clear. Future work may adopt panel data analysis to assess transitions and quantify policy impact on investment behavior.
4.4 Analysis of High-Frequency Vocabulary of Users’ Concern under Each Domain
In Section 4.3, the emotional dynamics of different stakeholders toward GC across various stages were analyzed. To further refine the segmentation of public engagement with GC and provide a visual representation of key thematic domains, this study employs word cloud visualizations (Fig. 6) to highlight the most frequently occurring terms across five domains: products, transportation, tourism, food, and housing.
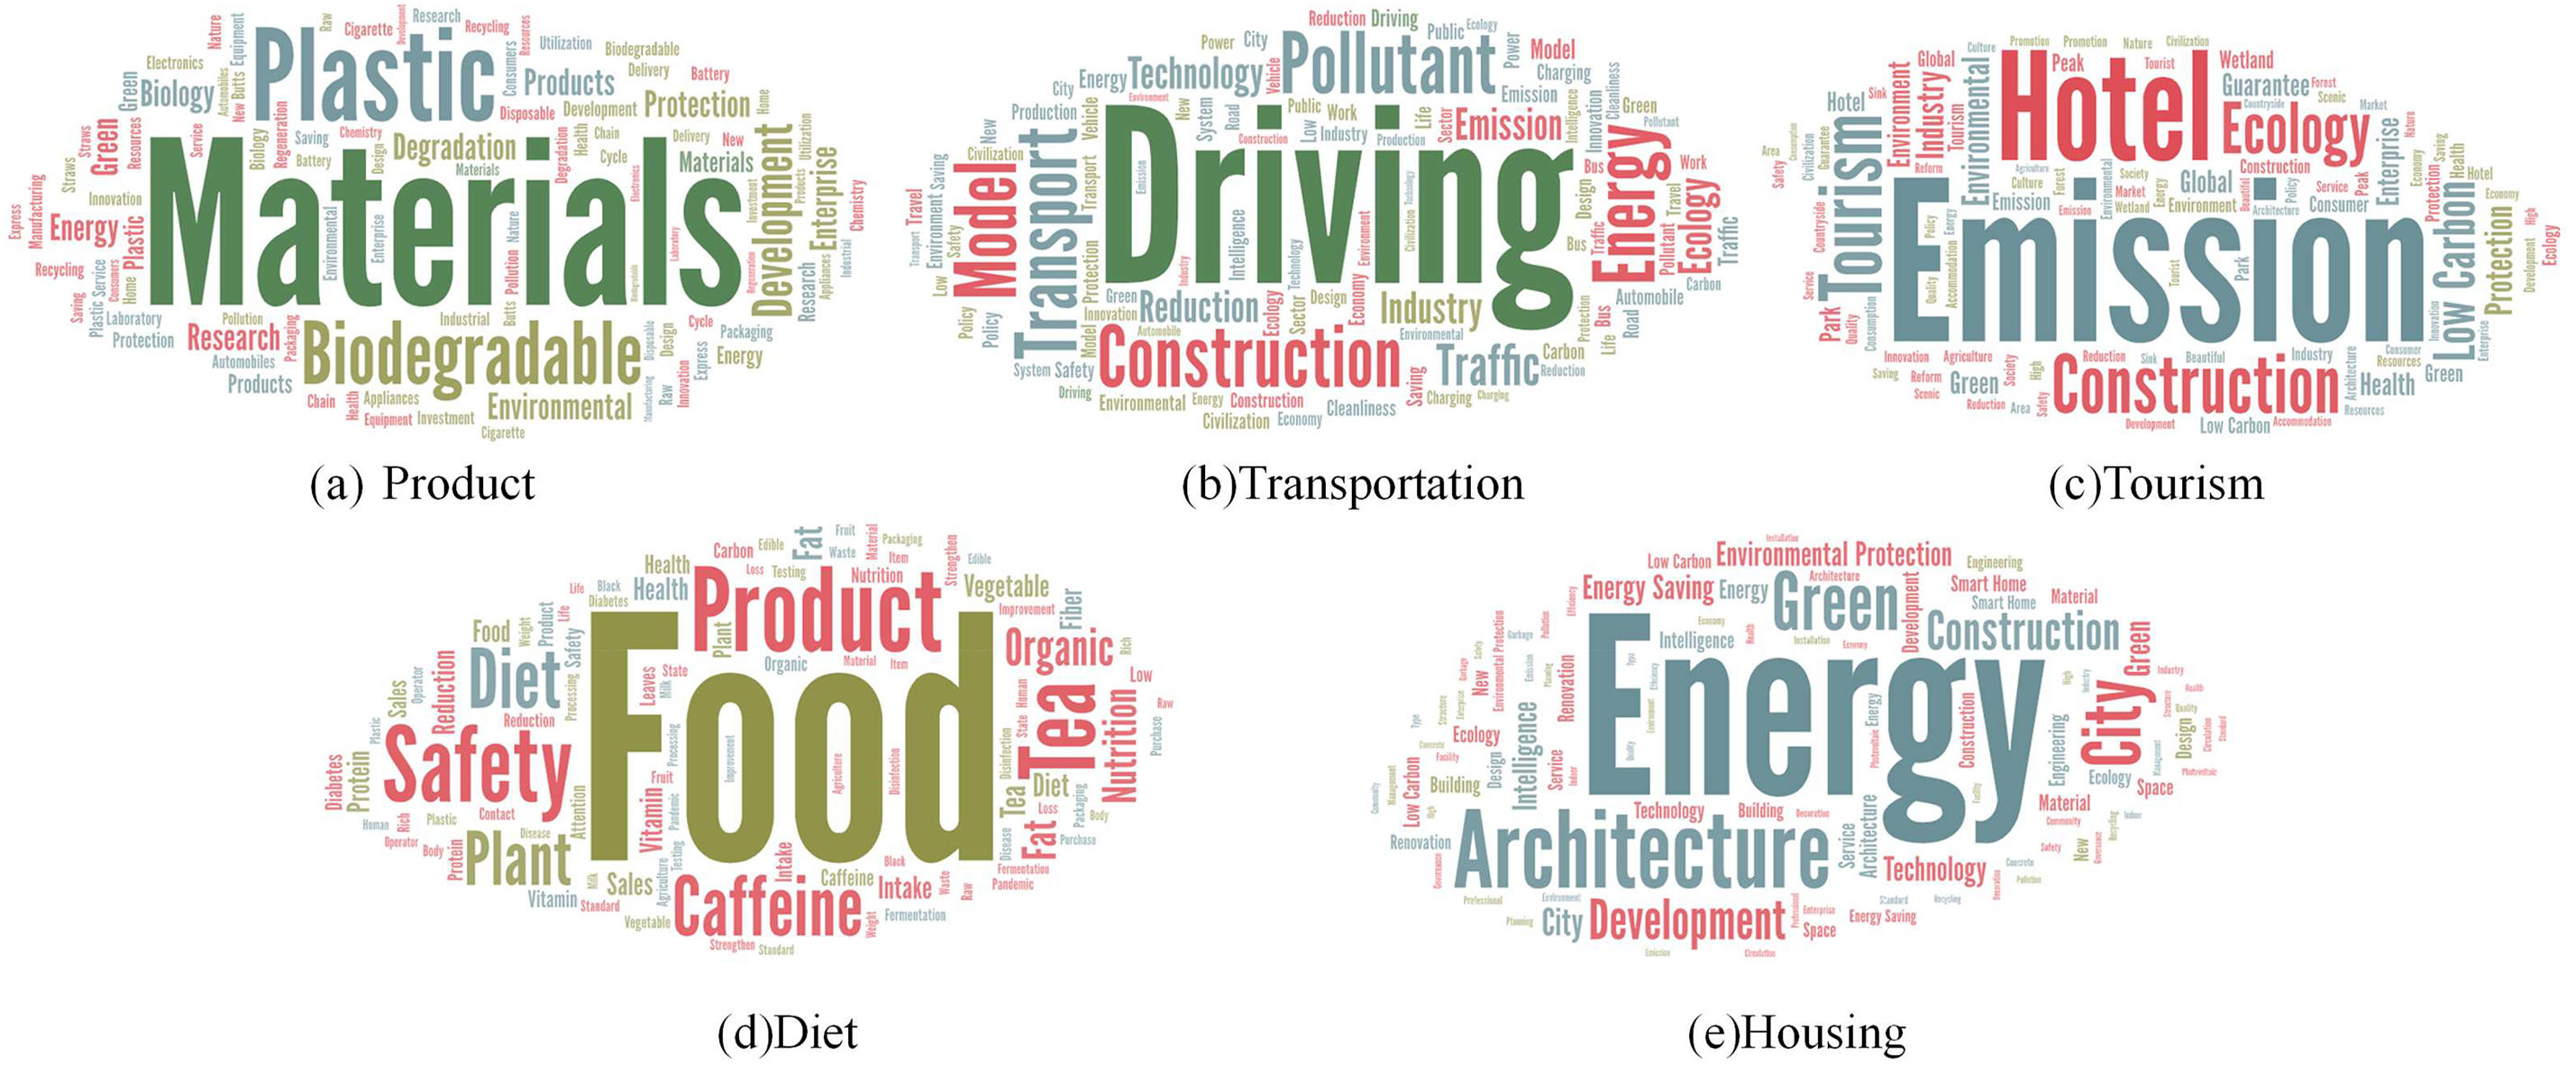
Figure 6: Word clouds of high-frequency public discussion topics across five green consumption domains
The word clouds reveal that most high-frequency words are closely related to their respective domains, such as materials, plastics, emissions, health, and construction. Additionally, recurring terms like green, low carbon, energy, and emissions appear across multiple domains, underscoring their strong association with environmental sustainability. This suggests that the public generally links these concepts to GC and environmental protection, reinforcing a positive discourse on sustainability across different sectors.
In Fig. 6a, words such as material, biodegradable, plastic, and environmental protection frequently appear, indicating that public attention is primarily focused on the packaging materials of green products and their disposal at the end of their life cycle. This highlights broader concerns about their environmental impact.
Fig. 6b illustrates that terms such as driving, energy, emission, ecology, and technology are highly relevant to green transportation. The prevalence of these terms suggests a shift in public perception from passive environmental awareness to the active adoption of new energy technologies. This implies that the future development of green transportation is likely to be driven more by technological advancements than by policy interventions. Furthermore, research has shown that increased knowledge and awareness of renewable energy technologies significantly enhance consumer acceptance of new energy transportation modes.
As depicted in Fig. 6c, public discussions on green tourism primarily revolve around themes such as emission, low carbon, ecology, environmental protection, and hotels. This indicates that green tourism is no longer solely associated with emission reduction but has expanded to include a broader preference for eco-friendly travel and sustainable accommodations. Previous studies highlight that ecotourism is widely recognized as a key strategy for promoting sustainable development and environmental conservation. Ecotourism significantly contributes to environmental sustainability and socio-economic development by preserving natural destinations and promoting responsible tourist behavior.
Fig. 6d highlights that terms such as safety, organic, nutrition, and health are prevalent in discussions about green diets, underscoring the public’s growing interest in pollution-free food and the intersection of human health with environmental sustainability.
In Fig. 6e, high-frequency terms such as energy, development, green, environmental protection, and low carbon reflect significant public attention to the environmental impact of housing throughout its life cycle. Specifically, the role of housing in reducing emissions and carbon footprints is a major factor influencing sustainable urban development. Additionally, the frequent appearance of terms like smart, new, and high quality suggests that public discourse extends beyond sustainability to include the development of an integrated housing ecosystem that optimizes resource efficiency-essential for long-term environmental and economic prosperity. Moreover, public perceptions of green housing remain largely favorable, primarily due to its environmental benefits. Key concerns revolve around ecological impact mitigation, energy efficiency, and emissions reduction, aligning with the findings of Shen and Li (2023) [18]. The overall trend indicates that society is becoming increasingly aware of sustainable housing as a cornerstone of future urban development.
4.5 Analysis of the Influence of Key Communication Users in Social Networks
Most previous studies primarily focus on analyzing public attitudes toward GC across various dimensions. However, attention to these attitudes should also extend to their evolving trends over time. Additionally, further research is needed to deepen our understanding of the influence of key nodes within social networks. This subsection introduces four key indicators of public influence within social networks: ‘number of retweets’ (NR), ‘number of comments’ (NC), ‘number of likes’ (NL), and ‘follower count’ (FLC). Among these, FLC reflects an individual’s influence, while NR, NC, and NL represent the dissemination power of GC-related topics. Together, these factors shape the overall capacity for GC-related information to spread within social networks. Given the large dataset-comprising 188,509 posts from a diverse user base-visualizing all users within the social network graph is impractical. Since follower count significantly impacts information dissemination, we selected 429 users with more than 5 million followers to specifically analyze their role in spreading GC-related content.
To identify key users within social networks, we utilized Gephi, a software capable of complex network analysis, to generate a network cloud diagram representing user interactions within the ‘Green Consumer’ social network. The ‘Fruchterman-Reingold’ layout was applied to visualize potential connections between users, as illustrated in Fig. 7. In this network, nodes represent Weibo users, while edges indicate user engagement within the same domain, defined by at least one posting record in a shared field. Higher engagement across multiple domains or increased activity strengthens a user’s connectivity within the network. The size of each node reflects its influence in information dissemination, with particular emphasis on the top 15 most influential users, as detailed in Table 2. The network consists of 429 nodes and 84,219 edges, forming an undirected graph with a diameter of 4. The layout reveals a distinct center-periphery structure, where larger node clusters at the center represent core user groups with stronger dissemination capabilities. This suggests that more influential users engage across multiple domains, resulting in significantly greater dissemination influence than non-core nodes.
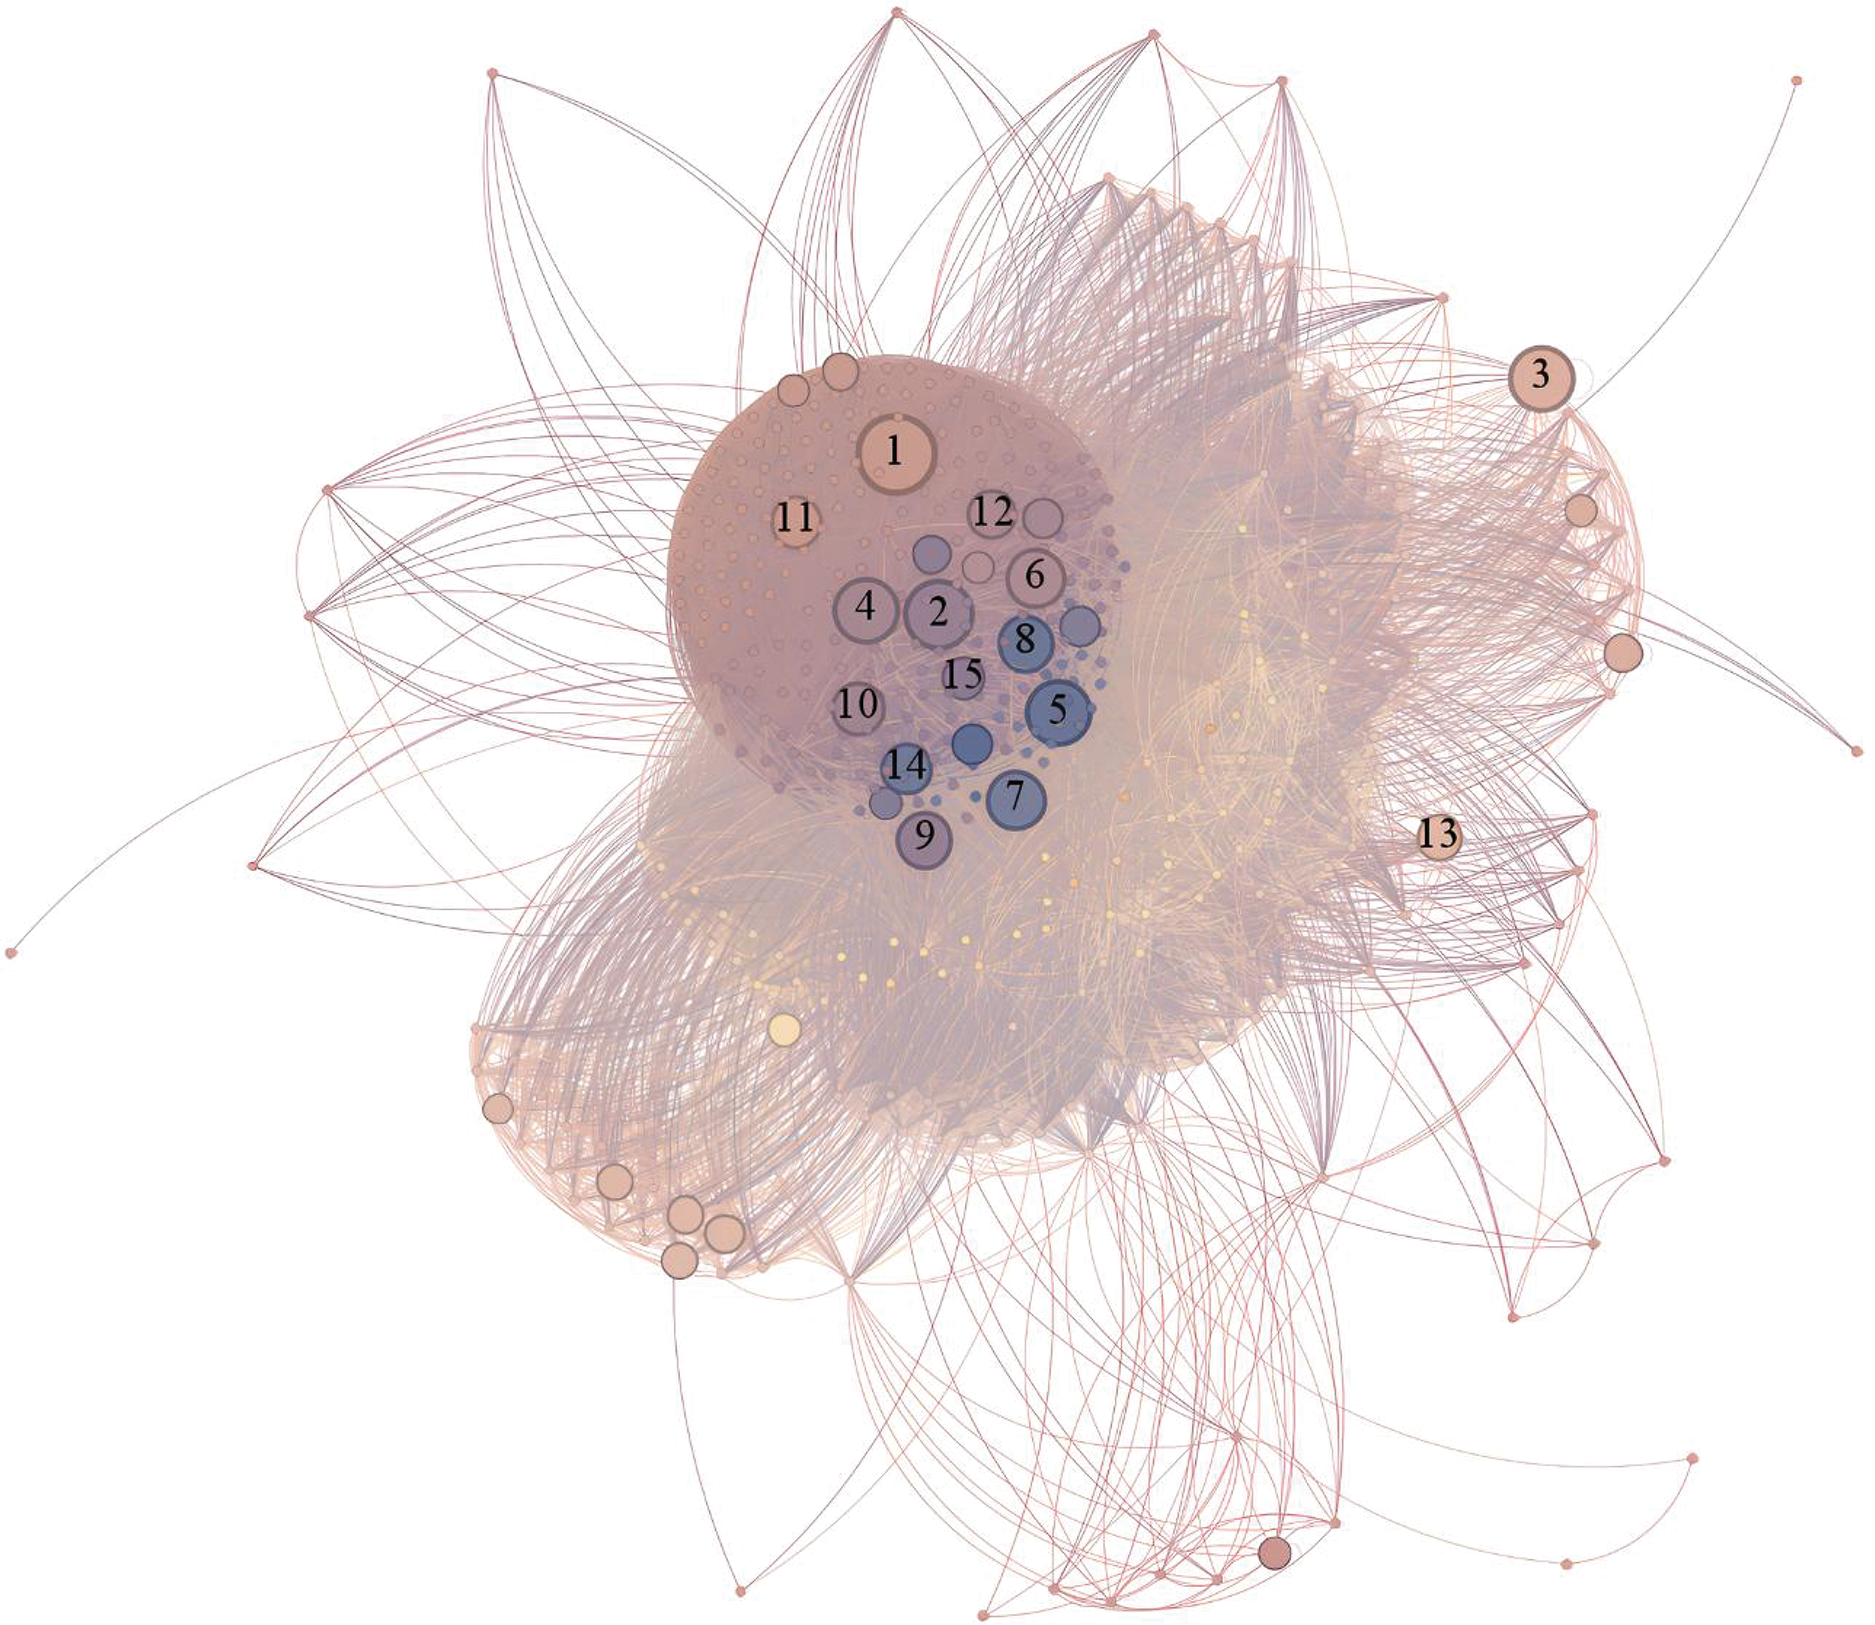
Figure 7: Social network graph of Weibo users discussing GC
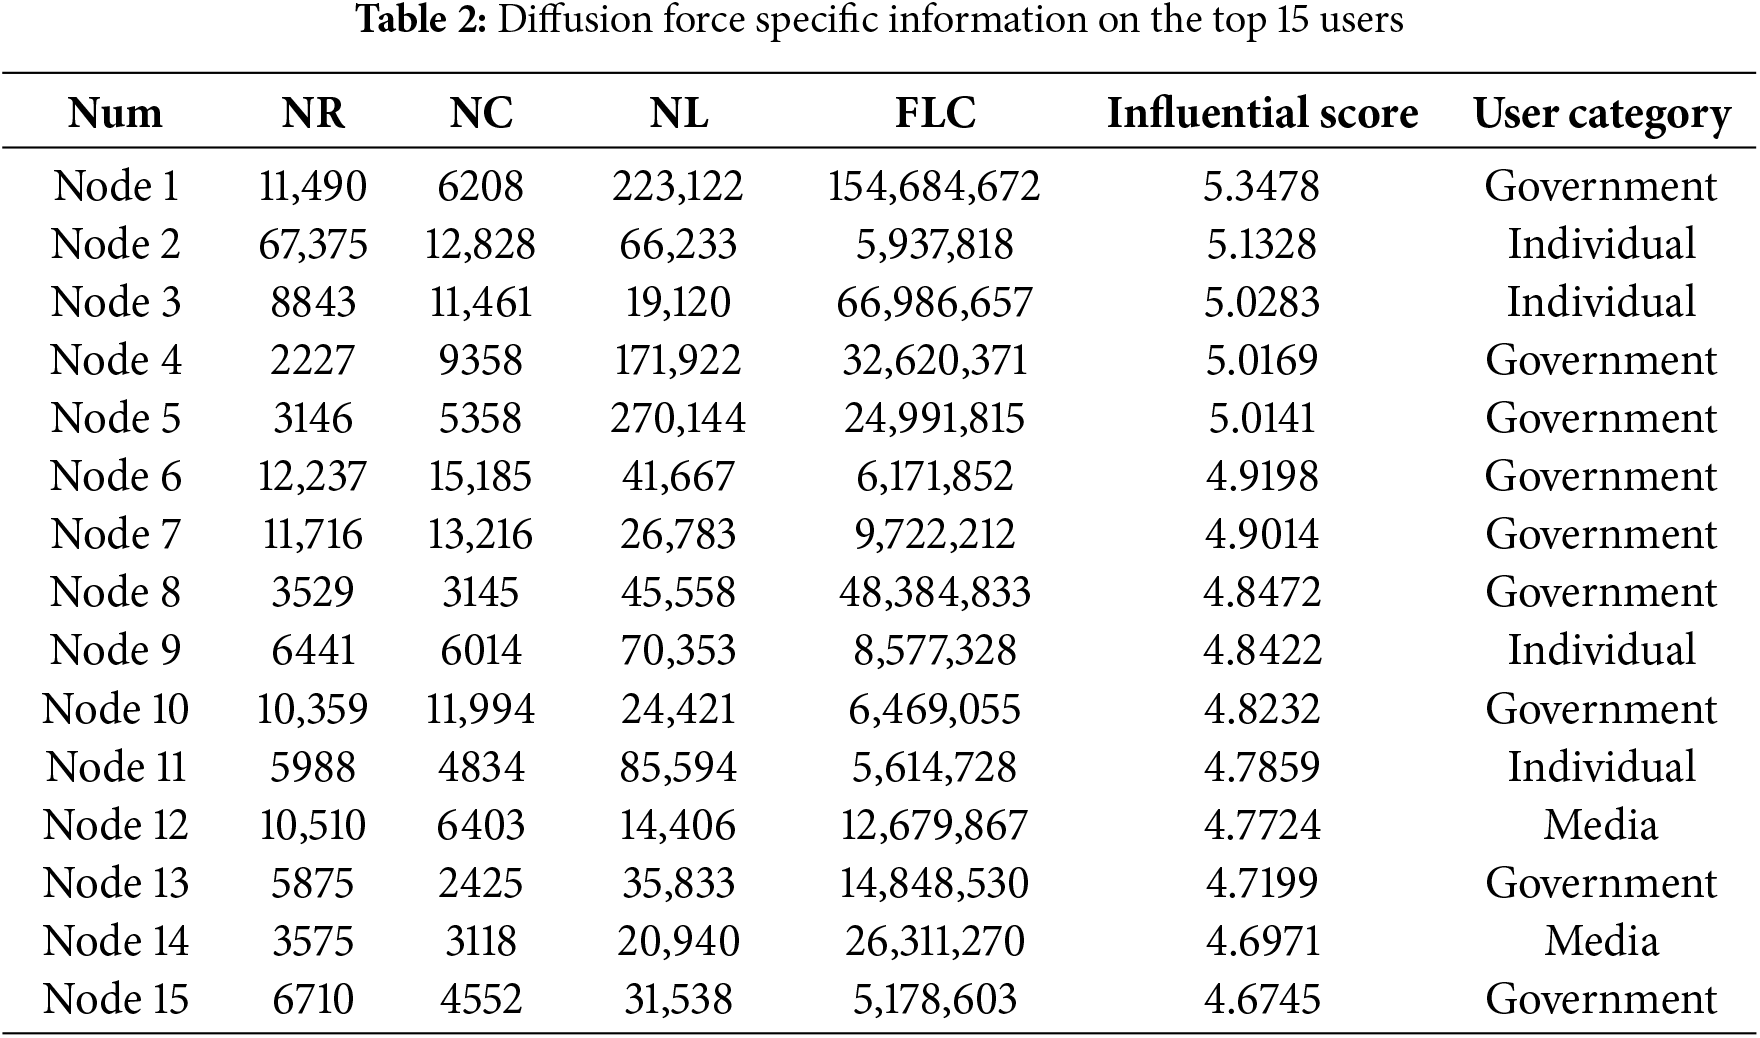
The 15 nodes depicted in Fig. 7 represent the most influential microblog users within the network, with their details provided in Table 1. Notably, 9 of these top 15 users are affiliated with government entities, underscoring their critical role in shaping and disseminating discussions on GC. This finding supports the argument presented in Section 4.3. Individual users rank second, making up four of the top 15 nodes. Although their overall visibility is lower than that of verified government accounts (30.01%), companies (20.55%), and media accounts (3.55%), individual users account for 45.89% of the total user base. The relatively high influence of individual users stems from their sheer numbers, increasing the likelihood of highly influential figures (such as celebrities and prominent bloggers) emerging. Node 1, operated by China Media Group (CMG), stands out as one of the most authoritative, influential, and credible official media platforms in China, playing a central role in guiding public discourse and shaping policy directions. This account holds significant prominence in GC-related discussions, with a total of 154,684,672 followers and 223,122 likes. Its final Influence Score reached 5.3478, significantly surpassing other users, positioning it as the most influential entity in the network. Both government entities and individual users typically maintain extensive follower bases, and their content enjoys high credibility due to their official authority or personal influence, enabling them to quickly capture public attention and shape discourse. Meanwhile, companies and media organizations contribute to the dissemination of GC-related content, albeit to a lesser extent.
The ‘Fruchterman-Reingold’ layout highlights the cross-domain dissemination effect of the core user group. As shown in Fig. 7, 13 of the 15 most influential users are concentrated within the network’s core, indicating their extensive influence across multiple domains. This classifies them as multi-domain influencers. To further examine their structural characteristics, we mapped their specific social network circles (Fig. 8). Notably, while Node 15 has a relatively modest follower count of 5,178,603 and limited individual influence, it demonstrates a strong diffusion capability for GC, as evidenced by its dense network connections in Fig. 8. In contrast, Node 3, despite having a massive follower base of 66,986,657, exhibits fewer network connections, suggesting weaker diffusion ability. However, its strong personal influence significantly contributes to content dissemination within the social network. Additionally, the relatively isolated Nodes 3 and 13 hold considerable influence within their respective domains but lack cross-domain impact, categorizing them as domain-specific disseminators.
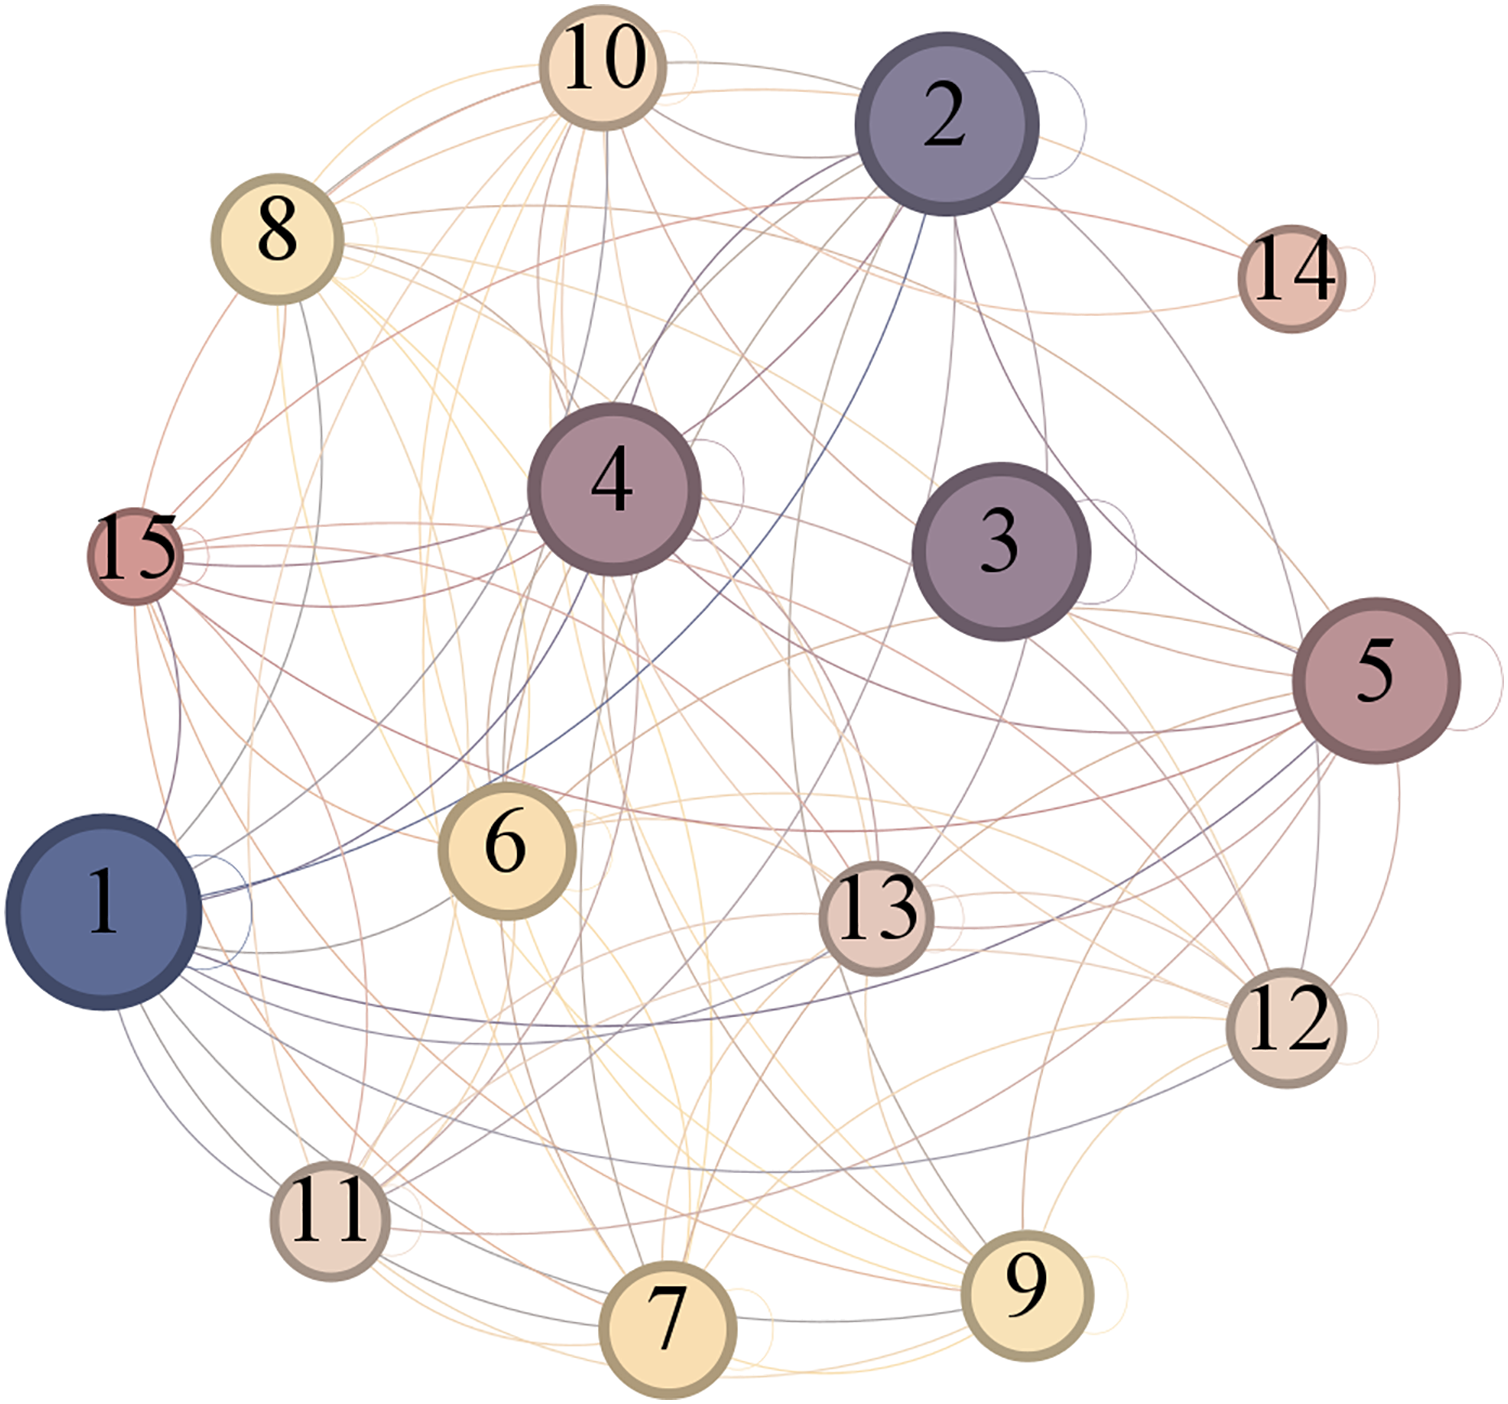
Figure 8: Top 15 Users in green consumption social network
4.6 Analysis of the Correlation between Regional Economic Level and Public Attitudes
The preceding analysis explored the evolution of stakeholder attitudes toward GC and the role of key network nodes. Specifically, Section 4.2 identified a positive correlation between economic development and public concern for GC, which is further quantified in this section. Using 32 provinces with posting records as a study sample, this analysis examines the relationship between Average GDP, Positive Rate, and Number of Posts from 2014 to 2024. The results are presented in Fig. 9.
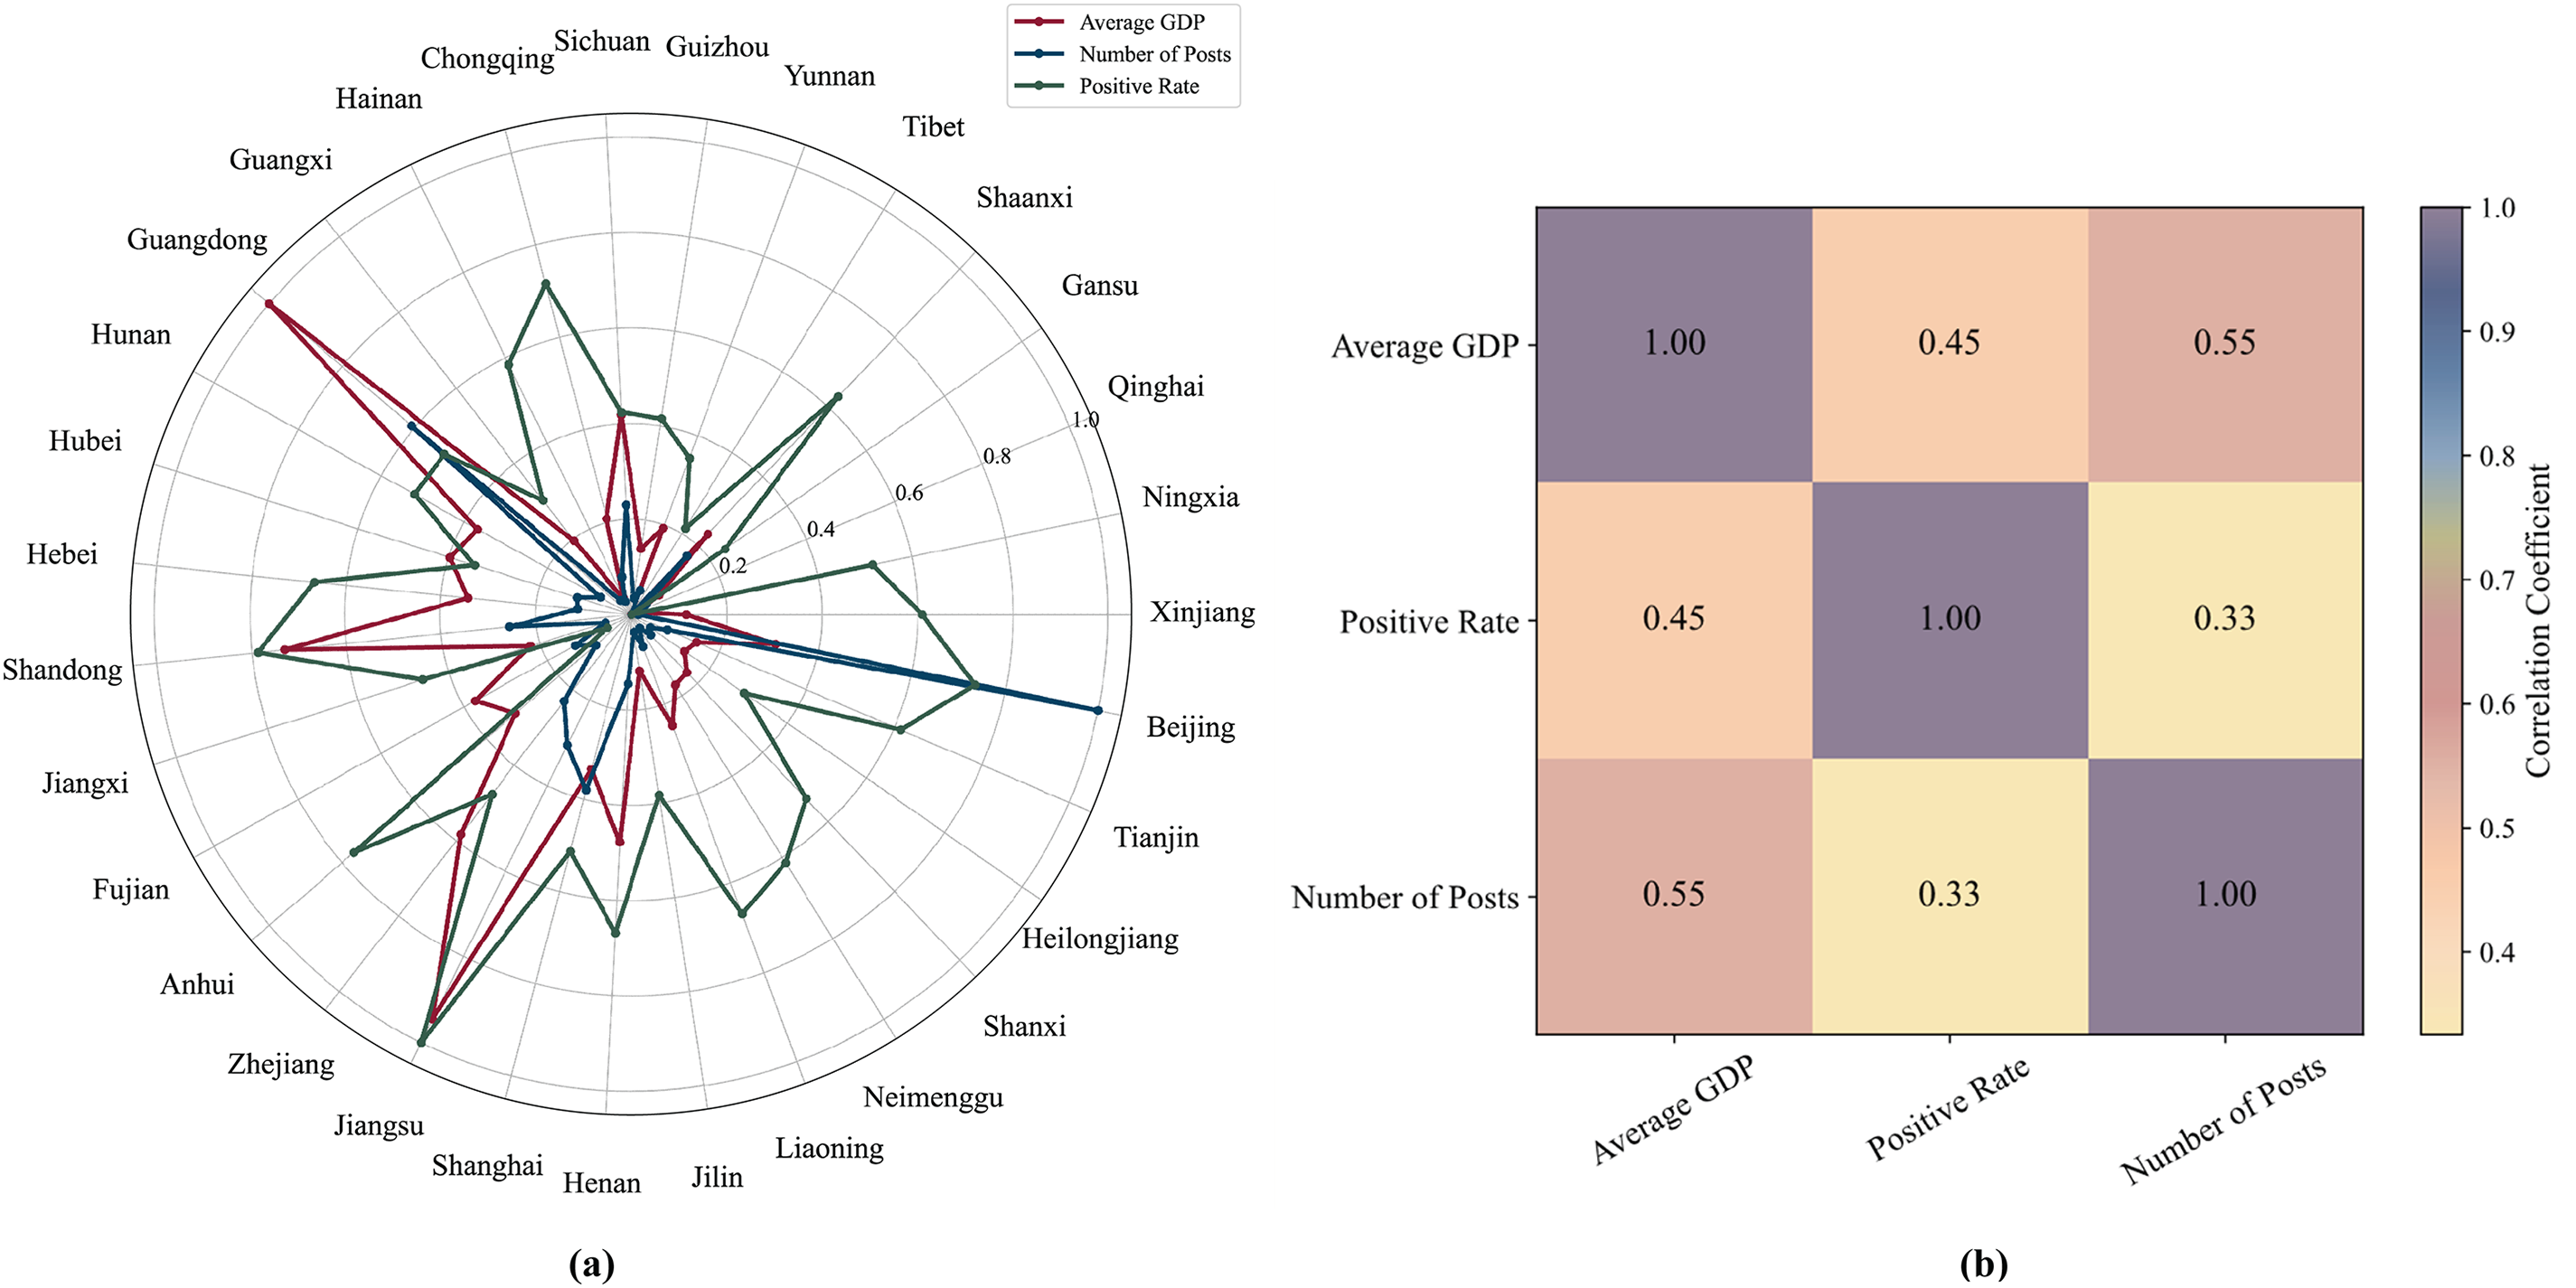
Figure 9: Pairwise correlations among average GDP, positive sentiment rate, and number of post
To facilitate comparison, Average GDP, Positive Rate, and Number of Posts are standardized and visualized using polar coordinates (Fig. 9a). Additionally, a thermodynamic matrix (Fig. 9b) quantifies the relationships between socio-economic development, public interest, and attitudes toward GC. The results indicate a significant positive correlation among the three variables. Notably, the correlation between Average GDP and Number of Posts is approximately 0.55, suggesting that more economically developed regions tend to have higher educational standards, fostering greater environmental awareness among the public.
Several key factors contribute to this correlation. First, the widespread adoption of social media in economically advanced regions provides scalable channels for raising public awareness of GC, thereby influencing consumer behavior. Second, higher education levels in developed regions promote stronger environmental awareness and a heightened sense of communal moral responsibility. As a result, consumers in these regions are more actively engaged in GC. Moreover, economically developed regions typically have more advanced carbon trading markets, where carbon quota mechanisms incentivize
5 Conclusions and Policy Recommendations
GC has become a global priority. Understanding how public perceptions of GC evolve is crucial for shaping policies and determining sectoral priorities for further regulatory actions and sustainability initiatives. By collecting Weibo post data from various spheres and classifying sentiments in user-generated content, this study analyzes the dynamic evolution of public concerns and sentiments toward GC across different timeframes, geographic regions, and stakeholder groups. These insights provide a deeper understanding of stakeholder engagement, sentiment trends, and information dissemination within social networks, offering valuable guidance for future policy development.
The findings indicate that public interest in GC has shifted from basic necessities to broader lifestyle and entertainment consumption. Based on sentiment patterns, GC development can be categorized into four stages: the budding stage, rising stage, fluctuation stage, and boom stage, with public attention increasing sharply over time. Additionally, China’s southeastern coastal region exhibits significantly higher concern for GC compared to western regions, largely due to economic development disparities. While the COVID-19 pandemic caused fluctuations in public sentiment, environmental awareness and the emphasis on green safety have notably increased in the post-pandemic era. Public attitudes toward GC remain predominantly positive, with government policies playing a pivotal role in shaping public discourse. However, profit-driven companies often hesitate to invest heavily in green products until profitability is assured. Key topics frequently discussed by the public include ‘low-carbon,’ ‘energy,’ ‘emissions,’ ‘materials,’ ‘green,’ and ‘food,’ offering critical insights for policy formulation. Moving forward, GC is expected to be increasingly driven by technological advancements rather than relying solely on policy incentives. GC also exhibits cross-sectoral dissemination effects, as evident from the distinct core-periphery structure within social networks. Core clusters consist of highly engaged users with strong individual influence, primarily government entities and key opinion leaders. Moreover, economic development is positively correlated with GC awareness and sentiment positivity, with education levels and promotional efforts further shaping public perceptions. Based on these findings, this study proposes policy recommendations from a triadic collaborative perspective involving the government, enterprises, and consumers, aiming to jointly promote the development and implementation of green consumption (GC).
5.1 Government: Institutional Safeguards and Strategic Guidance
The government plays a critical role in establishing an institutional environment conducive to sustainable consumption. In promoting the development of green consumption (GC), the government is not only responsible for ensuring basic public needs and reducing institutional uncertainty, but also for guiding market expectations, enhancing public awareness, and advancing technological innovation. We propose the following five recommendations specifically targeted at governmental actions.
1) Develop tailored policies
This study indicates that GC awareness is significantly higher in China’s southeastern coastal region, where economic development level exhibits a positive correlation with both GC attention and sentiment positivity. Thus, policies should be customized to accommodate varying economic development levels while fostering regional economic growth. In economically developed regions (e.g., southeastern coastal areas): Efforts should focus on further enhancing public recognition of GC through sustained awareness campaigns and gradual integration into routine consumption behavior. In less economically developed regions (e.g., western areas): Government initiatives should prioritize education and public awareness campaigns to gradually strengthen understanding and participation in GC, ultimately facilitating its widespread adoption.
2) Ensure the fulfillment of the public’s fundamental needs for GC
This study reveals a shift in public interest toward GC, moving from essential needs to lifestyle and entertainment-related consumption. To support this transition, policymakers must refine and implement comprehensive social security measures that ensure fundamental needs-such as food, housing, and healthcare-are adequately met. Once these basic necessities are secured, higher-level GC behaviors, such as eco-friendly tourism and transportation, are more likely to gain public traction. This approach promotes the balanced development of GC across diverse sectors.
3) Leverage influential users in social networks to disseminate the concept of GC
Government entities and high-profile individuals as key influencers in spreading awareness and shaping public perceptions of GC. These influencers play a critical role in motivating consumers to adopt sustainable consumption behaviors. Hence, strengthening policy guidance for high-impact individuals, as well as government-led initiatives, is essential for enhancing the effective and widespread promotion of GC values. Government agencies and other influential organizations can utilize their platforms to amplify positive messages about sustainability, making GC more accessible and appealing to the public. Moreover, effective policy interventions such as collaborations with local influencers, incentives for sustainability-focused content, and public education campaigns play a crucial role in fostering meaningful public engagement with GC. By leveraging government credibility, these influencers can generate a ripple effect, inspiring broader societal participation in sustainable practices.
4) Develop sector-specific policies and technological investment
Public interest in green consumption has expanded beyond policy considerations, with increasing emphasis on technological advancements. Therefore, it is essential for authorities to swiftly address technological challenges and increase investments in innovation to enhance both the sustainability and effectiveness of green consumption. While interest in green consumption varies across sectors, common concerns include key themes such as ‘low-carbon,’ ‘energy,’ ‘emissions,’ ‘materials,’ ‘green,’ and ‘food’, To ensure effective integration, governments should develop targeted and practical policies tailored to specific domains, including diet, tourism, transportation, housing, and consumer products. Furthermore, these policies should establish sector-specific models for green consumption and environmental protection, using key terms to shape public awareness and foster widespread adoption. By implementing tailored measures, the government can drive positive transformations in GC across various domains, thereby avoiding imbalanced development.
5) Stabilize the GC market for enterprises
Enterprises typically adopt a cautious approach toward green consumption in the early stages, prioritizing profitability before scaling up investments. Therefore, the government bears the responsibility for maintaining the stability of the carbon economy and carbon trading markets while reinforcing policy support for enterprises engaged in green consumption and services. By mitigating uncertainties within the green consumption market and addressing corporate concerns regarding green consumption, the government can create a more conducive business environment. Furthermore, increasing financial investment in green technologies and products, coupled with the utilization of market-based mechanisms, will provide enterprises with a stable green consumption market. As a result, these will support the sustainable growth of the green industry.
5.2 Enterprises: Technological Investment and Market Incentives
Enterprises are key stakeholders in green consumption, playing a critical role in the supply of green products and the shaping of consumer behavior. Their actions significantly influence public choices regarding sustainable products and practices. Accordingly, this study proposes the following policy recommendations to enhance enterprise engagement in promoting green consumption.
1) Increase investment in green technologies and products.
Enterprises tend to adopt a cautious approach toward green consumption, especially in its early stages, primarily due to profitability concerns. However, on the path toward sustainable development, economic returns should not take precedence over environmental responsibility. Therefore, enterprises are encouraged to strengthen their commitment to green development by increasing investments in sustainable technologies and eco-friendly product design. Such efforts will not only fulfill environmental obligations but also help build long-term market confidence in green consumption.
5.3 Consumers: Awareness Enhancement and Behavioral Transition
1) Strengthen environmental awareness and promote behavioral transformation.
Our study found that the enhancement of public environmental awareness and social responsibility contributes to the effective implementation of green consumption policies and promotes active public participation. Therefore, consumers, as the group with the largest base and widest coverage in the green consumption system, should enhance their understanding of sustainable consumption at the cognitive level and gradually realize green transformation at the behavioral level.
2) Promote green discourse in online communities.
From the perspective of social network structure, among the nodes with strong influence, ordinary individual users occupy a larger proportion. These consumers not only have high exposure in the network, but also have the potential to guide the direction of public opinion. Therefore, consumers should actively disseminate the concept of green consumption in cyberspace and take the initiative to express positive and constructive views, so as to create a favorable green public opinion environment in the virtual community.
This study primarily relies on data collected from Sina Weibo. Although the platform possesses a broad user base and a high degree of openness, its user demographics may still exhibit certain structural biases, potentially limiting the generalizability of the findings. To address this limitation, future research could incorporate data from a wider range of social media platforms, such as Twitter and Facebook, thereby enabling the inclusion of users across diverse age groups, geographic regions, and socioeconomic backgrounds. This approach would enhance the representativeness and robustness of subsequent analyses. Moreover, to enhance cross-cultural robustness, future work could collect multilingual datasets from platforms like Twitter or Reddit to examine variations in green consumption (GC) discourse across different cultural contexts.
Additionally, while this study adopts the pre-trained RoBERTa model for sentiment analysis—given its proven effectiveness in various classification tasks—its generic architecture may constrain its capacity to capture subtle and context-specific emotional expressions. Future studies could consider developing customized sentiment analysis models tailored to the characteristics of the collected dataset, such as employing the PLASA model or integrating hybrid deep learning frameworks, to improve both accuracy and contextual sensitivity. In particular, further fine-tuning of the model using domain-specific corpora, including vocabulary such as “circular economy” and “carbon footprint,” is recommended to enhance semantic accuracy and sentiment classification performance.
Moreover, while the current analysis primarily examines annual trends and provincial averages, future research could adopt finer-grained temporal and regional analyses. For instance, analyzing seasonal or event-driven fluctuations (e.g., Earth Day campaigns or major environmental forums) could help capture short-term behavioral shifts more accurately. Similarly, district-level or city-level economic indicators and green consumption metrics could be employed to identify subtle regional differences, thus providing more detailed and actionable insights into localized GC trends.
Furthermore, although the present study identifies a significant positive Pearson correlation between economic development and public attitudes toward GC, causal inferences cannot be robustly established from correlation analyses alone. Therefore, future research should employ econometric models, such as the difference-in-differences (DID) approach, to better isolate the causal impacts of economic growth, policy interventions (e.g., carbon taxes), and cultural factors on GC adoption. Incorporating such econometric methods would allow for a more precise understanding of the drivers behind green consumption behaviors.
In addition, this research has focused primarily on text-based sentiment analysis. However, future studies could extend the analytical framework by incorporating multimodal data sources, such as images or videos from social media platforms, to capture implicit attitudes and visual representations of GC behaviors (e.g., sustainable packaging, zero-waste lifestyles). Combining textual sentiment analysis with visual content would enhance the robustness and comprehensiveness of public attitude assessments.
Lastly, the current cross-sectional analysis highlights that companies often adopt cautious behaviors toward GC investment due to profitability concerns. To better understand the factors influencing corporate investment transitions, future research should adopt longitudinal panel data analyses. Such approaches could identify specific barriers (e.g., unfavorable cost-benefit ratios) and incentives (e.g., policy subsidies, market dynamics) influencing corporate behaviors, thus providing a more nuanced perspective on how and when businesses shift toward proactive green investment strategies.
Acknowledgement: Not applicable.
Funding Statement: This research is supported by the National Nature Foundation of China under Grants (No. 72104108) and the College Students’ Innovation and Entrepreneurship Training Program (No. 202410298155Y).
Author Contributions: Luyu Ma: Writing—original draft, Writing—review & editing, Investigation, Visualization, Methodology, Formal analysis, Data curation, Conceptualization, Validation, Project administration. Xiu Cheng: Writing—review & editing, Validation, Supervision, Project administration, Methodology, Conceptualization, Funding acquisition. Zongyan Xing: Writing—original draft, Writing—review & editing, Data curation, Project administration. Yue Wu: Writing—original draft, Writing—review & editing, Data curation, Project administration. Weiwei Jiang: Writing—original draft, Writing—review & editing, Data curation, Project. All authors reviewed the results and approved the final version of the manuscript.
Availability of Data and Materials: The data that support the findings of this study are subject to confidentiality agreements and cannot be shared publicly.
Ethics Approval: This study analyzed publicly available social media content and did not involve human subjects directly; thus, ethics approval was not required.
Conflicts of Interest: The authors declare no conflicts of interest to report regarding the present study.
Appendix A
1Sixth Assessment Report. https://www.ipcc.ch/assessment-report/ar6/ (accessed on 13 September 2024).
2DOE announces $264 million for Energy Earthshots. https://ess.science.energy.gov/doe-announces-264-million-energy-earthshots/ (accessed on 21 October 2024).
3Report on Internet development in China. https://www.199it.com/archives/1718242.html (accessed 16 November 2024).
4People’s Daily, 2024. Green Consumption High-Quality Development Forum held in Beijing. https://www.peopleapp.com/column/30044687150-500005363157 (accessed on 27 November 2024).
5Ministry of Housing and Urban-Rural Development of China, 2022. 14th Five-Year Plan for the Development of Building Energy Efficiency and Green Buildings. Chinese Government Official Web Portal.
References
1. Xu C, Wang M, Ren Y, Zhu S. Enhancing aspect-based sentiment analysis in tourism using large language models and positional information. Tsinghua Sci Technol. 2024;2025:1–19. [Google Scholar]
2. Huang X, Sun H, Liu X, Wu J, He L. Text-dominant speech-enhanced for multimodal aspect-based sentiment analysis network. Inf Fusion. 2025;126:103543. doi:10.1016/j.inffus.2025.103543. [Google Scholar] [CrossRef]
3. Song E, Lee MS, Park J, Lee H. Translating pro-environmental intention to behavior: the role of moral licensing effect. Sustainable Product Cons. 2024;52:527–40. doi:10.1016/j.spc.2024.11.018. [Google Scholar] [CrossRef]
4. Šmíd J, Kral P. Cross-lingual aspect-based sentiment analysis: a survey on tasks, approaches, and challenges. Inf Fusion. 2025;120:103073. doi:10.1016/j.inffus.2025.103073. [Google Scholar] [CrossRef]
5. Nascimento J, Loureiro SMC. Understanding the desire for green consumption: norms, emotions, and attitudes. J Bus Res. 2024;178:114675. doi:10.1016/j.jbusres.2024.114675. [Google Scholar] [CrossRef]
6. Yang L, Zhong J, Wen T, Liao Y. CCIN-SA: composite cross modal interaction network with attention enhancement for multimodal sentiment analysis. Inf Fusion. 2025;123:103230. doi:10.1016/j.inffus.2025.103230. [Google Scholar] [CrossRef]
7. Omuya EO, Okeyo G, Kimwele M. Sentiment analysis on social media tweets using dimensionality reduction and natural language processing. Eng Rep. 2023;5(3):e12579. doi:10.1002/eng2.12579. [Google Scholar] [CrossRef]
8. Huang H, Long R, Chen H, Sun K, Li Q. Exploring public attention about green consumption on Sina Weibo: using text mining and deep learning. Sustainable Product Cons. 2022;30:674–85. doi:10.1016/j.spc.2021.12.017. [Google Scholar] [CrossRef]
9. Razzaq A, Yang X. Digital finance and green growth in China: appraising inclusive digital finance using web crawler technology and big data. Technol Forecast Soc Change. 2023;188:122262. doi:10.1016/j.techfore.2022.122262. [Google Scholar] [CrossRef]
10. Roumeliotis KI, Tselikas ND, Nasiopoulos DK. LLMs and NLP models in cryptocurrency sentiment analysis: a comparative classification study. Big Data Cogn Comput. 2024;8(6):63. doi:10.3390/bdcc8060063. [Google Scholar] [CrossRef]
11. Bifulco I, Cirillo S, Esposito C, Guadagni R, Polese G. An intelligent system for focused crawling from Big Data sources. Expert Syst Appl. 2021;184:115560. doi:10.1016/j.eswa.2021.115560. [Google Scholar] [CrossRef]
12. Zhu L, Zhao H, Zhu Z, Zhang C, Kong X. Multimodal sentiment analysis with unimodal label generation and modality decomposition. Inf Fusion. 2025;116:102787. doi:10.1016/j.inffus.2024.102787. [Google Scholar] [CrossRef]
13. Mmbayi II, Gakii C, Musyoka FM. Sentiment analysis-based model for monitoring user engagement with mental health chatbots. Eng Rep. 2025;7(6):e70247. doi:10.1002/eng2.70247. [Google Scholar] [CrossRef]
14. Al Mamun A, Ma Y, Reza MNH, Ahmad J, Wan HWMH, Lili Z. Predicting attitude and intention to reduce food waste using the environmental values-beliefs-norms model and the theory of planned behavior. Food Qual Prefer. 2024;120:105247. doi:10.1016/j.foodqual.2024.105247. [Google Scholar] [CrossRef]
15. Wei J, Zhao X, Yang X. Measuring purchase intention towards green power certificate in a developing nation: applying and extending the theory of planned behavior. Resourc Conservat Recycl. 2021;168:105363. doi:10.1016/j.resconrec.2020.105363. [Google Scholar] [CrossRef]
16. Huang H, Long R, Chen H, Sun Q, Sun K, Ma W, et al. Do stakeholders have the same concerns about anti-food waste law in China? Using big data from social media. Environ Impact Assess Rev. 2023;100:107071. doi:10.1016/j.eiar.2023.107071. [Google Scholar] [CrossRef]
17. Taha K, Yoo PD, Yeun C, Taha A. Text classification techniques: a holistic review, observational analysis, and experimental investigation. Big Data Min Anal. 2025;8(3):624–60. doi:10.26599/bdma.2024.9020092. [Google Scholar] [CrossRef]
18. Shen C, Li P. Green housing on social media in China: a text mining analysis. Build Environ. 2023;237:110338. doi:10.1016/j.buildenv.2023.110338. [Google Scholar] [CrossRef]
19. Chen F, Hou J, Gu X, Hou J, Pan Q, Tang Z. Research on temporal and spatial evolution of public’s response to the mandatory waste separation policy based on big data mining. Sustainable Product Cons. 2022;31:236–48. doi:10.1016/j.spc.2022.02.013. [Google Scholar] [CrossRef]
20. Huang H, Long R, Chen H, Sun K, Sun Q, Li Q. Why don’t more people engage in green practices in China? A policy-oriented approach to promoting green transformation in five consumption areas. Environ Impact Assess Rev. 2023;101:107099. doi:10.1016/j.eiar.2023.107099. [Google Scholar] [CrossRef]
21. Briskilal J, Subalalitha C. An ensemble model for classifying idioms and literal texts using BERT and RoBERTa. Inform Process Manage. 2022;59(1):102756. doi:10.1016/j.ipm.2021.102756. [Google Scholar] [CrossRef]
22. Li Z, Zou Z. Punctuation and lexicon aid representation: a hybrid model for short text sentiment analysis on social media platform. J King Saud Univ-Comput Inf Sci. 2024;36(3):102010. doi:10.1016/j.jksuci.2024.102010. [Google Scholar] [CrossRef]
23. Chandra R, Zhu B, Fang Q, Shinjikashvili E. Large language models for newspaper sentiment analysis during COVID-19: the guardian. Appl Soft Comput. 2025;171:112743. doi:10.1016/j.asoc.2025.112743. [Google Scholar] [CrossRef]
24. Ahamad R, Mishra KN. Exploring sentiment analysis in handwritten and E-text documents using advanced machine learning techniques: a novel approach. J Big Data. 2025;12(1):11. doi:10.1186/s40537-025-01064-2. [Google Scholar] [CrossRef]
25. Birjali M, Kasri M, Beni-Hssane A. A comprehensive survey on sentiment analysis: approaches, challenges and trends. Knowl Based Syst. 2021;226:107134. doi:10.1016/j.knosys.2021.107134. [Google Scholar] [CrossRef]
26. Liao W, Liu Z, Dai H, Wu Z, Zhang Y, Huang X, et al. Mask-guided BERT for few-shot text classification. Neurocomputing. 2024;610:128576. doi:10.1016/j.neucom.2024.128576. [Google Scholar] [CrossRef]
27. Li L, Du Y, Ma S, Ma X, Zheng Y, Han X. Environmental disaster and public rescue: a social media perspective. Environ Impact Assess Rev. 2023;100:107093. doi:10.1016/j.eiar.2023.107093. [Google Scholar] [CrossRef]
28. Shen C, Wang Y. Order from chaos: deconstructing the interactions of multiple online stakeholders in NIMBY conflicts. Environ Sci Policy. 2023;145:29–39. doi:10.1016/j.envsci.2023.03.020. [Google Scholar] [CrossRef]
29. Sayed MA, Hossain MA, Rahman MM, Ali GMN, Islam MA, Paul KC, et al. Public sentiment analysis of roadway work zones using social media data and machine learning models. Data Sci Manage. 2025;55:351. doi:10.1016/j.dsm.2025.04.001. [Google Scholar] [CrossRef]
30. Cheng X, Gan W, Zhang K, Xu Z, Gou X. A dynamically updated consensus model for large-scale group decision-making driven by the evolution of public sentiment in emergencies. Inf Fusion. 2025;126:103484. doi:10.1016/j.inffus.2025.103484. [Google Scholar] [CrossRef]
Cite This Article
 Copyright © 2025 The Author(s). Published by Tech Science Press.
This work is licensed under a Creative Commons Attribution 4.0 International License , which permits unrestricted use, distribution, and reproduction in any medium, provided the original work is properly cited.
 Downloads
 Citation Tools