iconOpen Access

ARTICLE

Length Dependent Crystallization of Linear Polymers under Different Cooling Rates: Molecular Dynamics Simulations

Dan Xu1,2, Chuanfu Luo1,2,3,*

1 State Key Laboratory of Polymer Science and Technology, Changchun Institute of Applied Chemistry, Chinese Academy of Sciences, Changchun, 130022, China
2 CAS Key Laboratory of High-Performance Synthetic Rubber and Its Composite Materials, Changchun Institute of Applied Chemistry, Chinese Academy of Sciences, Changchun, 130022, China
3 School of Applied Chemistry and Engineering, University of Science and Technology of China, Hefei, 230026, China

* Corresponding Author: Chuanfu Luo. Email: email

(This article belongs to the Special Issue: Molecular Simulations of Polymer Materials)

Computers, Materials & Continua 2025, 85(2), 2807-2818. https://doi.org/10.32604/cmc.2025.069471

Abstract

The crystallization behavior of polymers is significantly influenced by molecular chain length and the dispersion of varying chain lengths. The complexity of studying crystallization arises from the dispersity of polymer materials and the typically slow cooling rates. Recent advancements in fast cooling techniques have rendered the investigation of polymer crystallization at varying cooling rates an attractive area of research; however, a systematic quantitative framework for this process is still lacking. We employ a coarse-grained model for polyvinyl alcohol (CG-PVA) in molecular dynamics simulations to study the crystallization of linear polymers with varying chain lengths under variable cooling rates. Monodisperse, bidisperse and polydisperse samples are simulated. We propose two formulae based on a two-phase assumption to fit the exothermal curves obtained during cooling. Based on these formulae, better estimations of crystallization temperatures are obtained and the effects of chain lengths and cooling rates are studied. It is found that the crystallization temperature increases with chain length, similar to the Gibbs-Thomson relation for melting temperature, indicating a strong relation between fast crystallization and glass formation in linear polymers. Extrapolation to the infinitely slow cooling rate provides an easy way in simulations to estimate the equilibrium crystallization temperature. The effective chain lengths of polydisperse and bidisperse samples are found to be the number-averaged chain lengths compared to the weight-averaged ones. The chain length-dependent crystallization exhibits crossover behavior near the entanglement length, indicating the effects of entanglements under fast cooling conditions. The effect of chain length dispersity on crystallization becomes more obvious under fast cooling conditions.

Keywords

Molecular dynamics; polymer crystallization; chain length; cooling rate; glass transition

1  Introduction

Polymer crystallization is a central issue in the field of polymer science [15]. Most linear polymers can crystallize when the temperature is below their crystallization temperatures, Tc. Generally, for specified linear polymers with the same chemical structure, their Tc increases with the molar mass or chain length for short chains (oligomers), and reaches a constant value for long chains (polymers) [68]. The crystallization behavior of linear polymers, which depends on molecular length, exhibits a continuous transition from small molecules to macromolecules and plays a crucial role in industrial processes such as polymer blending [9]. It is notable that the polymer materials in engineering and the samples in experiments have dispersity, such as those with Schulz distribution, and are usually subjected to slow cooling rates [10]. Polymers with bidisperse and polydisperse molecular weight distributions demonstrate significant advantages, particularly in improving mechanical properties and crystallization behaviors [1113]. Motivated by these benefits, researchers have investigated various aspects, including the viscoelastic characterization of bidisperse polyethylene [14], the influence of high molecular weight components on mechanical performance [15], and the relationship between polymer chain size and topology with recyclability [16]. Using narrow-disperse or monodisperse polymers is costly in engineering. However, monodisperse samples are ideal systems for studying length-dependent crystallization in theoretical or simulation studies [1719]. Most simulation studies of polymer crystallization in the literature use monodisperse samples [2023]. It is interesting to explore whether the crystallization dependent on chain length is sensitive to dispersity. In other words, is there a significant difference in crystallization between monodisperse and polydisperse samples?

In dilute or semi-dilute solutions, the crystallization behavior of polymer chains is significantly influenced by the polymer concentration and the interactions between the polymer chains and the solvent. As the concentration increases, the increased nucleation probability and intermolecular interactions can promote crystallization [2426]. Ions in the solution or hydrogen bonds interacting with the polar groups on the polymer chains can enhance or inhibit the mobility of the chains, thereby affecting the adsorption phenomenon of polymer chains on the surface of minerals [27]. Polymer crystallization is a typical nonequilibrium process, as it is highly dependent on thermal history and cooling rate. The measured Tc of polymers can change with varying cooling rates. For most polymers, Tc decreases with the increase of cooling rate (faster cooling). If the cooling rate is high enough, the system will not crystallize and will instead form a glass state. Cooling rates can be varied in experiments to study the crystallization or glass transition of polymers. With the recent advancements in fast cooling techniques, such as flash DSC, the crystallization of polymers under fast cooling rates has become an appealing field [2830]. The crystallization at different cooling rates can provide a joint viewpoint between the polymer crystallization and glass transition and might shed light on both fields. A simple yet important question that could be addressed through a systematic study is how quickly the cooling rate leads to the glass transition from crystallization. However, such a systematic study is still lacking, i.e., a quantitative rule of crystallization under different cooling rates has not yet been established.

Simulations, such as Monte Carlo (MC) or Molecular Dynamics (MD), can precisely control the dispersity of chain lengths and provide detailed conformations of individual polymer chains directly at the molecular scale. A sample with precisely defined distribution of chain lengths can be created in simulations, which is impossible for experiments. The studied systems in most simulations are pure polymers and there is no impurity. Thus, the crystallization in simulations is not affected by uncontrollable impurity as in experiments. Homogeneous nucleation prevails in simulations, resulting in many small and unstable crystallites that are prone to rapid reorganization [24,31]. Based on the above advantages, simulations are ideal methods for studying length-dependent crystallization of linear polymers under different cooling rates. Many previous simulations have studied the crystallization at constant temperatures or under continuous cooling with varying cooling rates [3134].

In this work, we perform MD simulations using a coarse grained model for Polyvinyl alcohol (CG-PVA), which was utilized in our previous studies [3537]. We simulate the crystallization of linear polymers with varying chain lengths. The chain lengths vary from N=10 to 500, spanning the regime of untangled oligomers to that of entangled polymers. The cooling rates vary by 50 times, from a fast cooling rate close to that of forming glass states. The exothermal curves and specific heat are fitted using two formulae based on a two-phase assumption, and empirical formulae are proposed to fit the chain length-dependent and cooling rate-dependent simulation results.

2  Model and Simulation Details

The coarse-grained model for Polyvinyl alcohol (CG-PVA) proposed by Meyer and Müller-Plathe [18,38] using our patch code for LAMMPS [36,39] is used. The parameters related to the melt state in this model have been detailed in previous studies [36,38]. In this model, each coarse-grained bead represents a monomeric unit of PVA. The non-bonded interactions are approximated using a Lennard-Jones 9-6 potential. To simulate a dense melt, only the repulsive component of the potential is considered. The length scales are determined through a mapping process from atomistic simulations. Here, the length unit is denoted as λ=1, equivalent to approximately 0.52 nm, which roughly corresponds to the diameter of a PVA chain. Reduced units are employed in the simulations, where temperatures and energies are expressed in terms of reduced units with mass (m) and Boltzmann’s constant (kB) set to 1. In this system, a temperature of T=1 corresponds to 550 K, representing the high-temperature phase of the amorphous melt. The time unit is estimated to be 3.5 ps, based on the equivalent Rouse relaxation time. The time step for MD integration is 0.01 (35 fs). Periodic boundary condition and the NPT ensemble at a pressure of 8 (1 atm ) are applied using the Berendsen barostat with a damping time of 1000 MD steps and the Nosé-Hoover thermostat with a damping time of 100 MD steps. The entire system consists of about 105 monomers (with small difference between the distributions of chain lengths), and the sizes of simulation boxes are approximately 36 (18.7 nm).

The initial structures are prepared through random walks, followed by relaxation at T=1.0 and T=0.9 for 5×10⁷ MD steps. The relaxed systems are then continuously cooled from T=0.9 (495 K) using different cooling rates, q. Six cooling rates, {qA,qB,,qF}, are used, corresponding to {200,100,40,20,10,4}×107 (equivalently {314,157,62.9,31.4,15.7,6.29}×107 K/s), respectively. The temperature profiles of the simulated systems are shown in Fig. 1a. In comparison to experiments, MD simulations are limited by time and spatial scales, resulting in much faster velocities in simulations than those observed in experiments. During the crystallization process of polymers, especially with coarse-grained models, there may be numerical discrepancies compared to experiments. The work by Vettorel and Meyer [32] indicates that for the cooling process of CG-PVA, when the simulated cooling rate is 7×10⁸ K/s, the crystallization temperature (Tc) is approximately 400 K. During the heating process, when the simulated heating rate is 3×10⁹ K/s, the melting temperature is around 480 K.

images

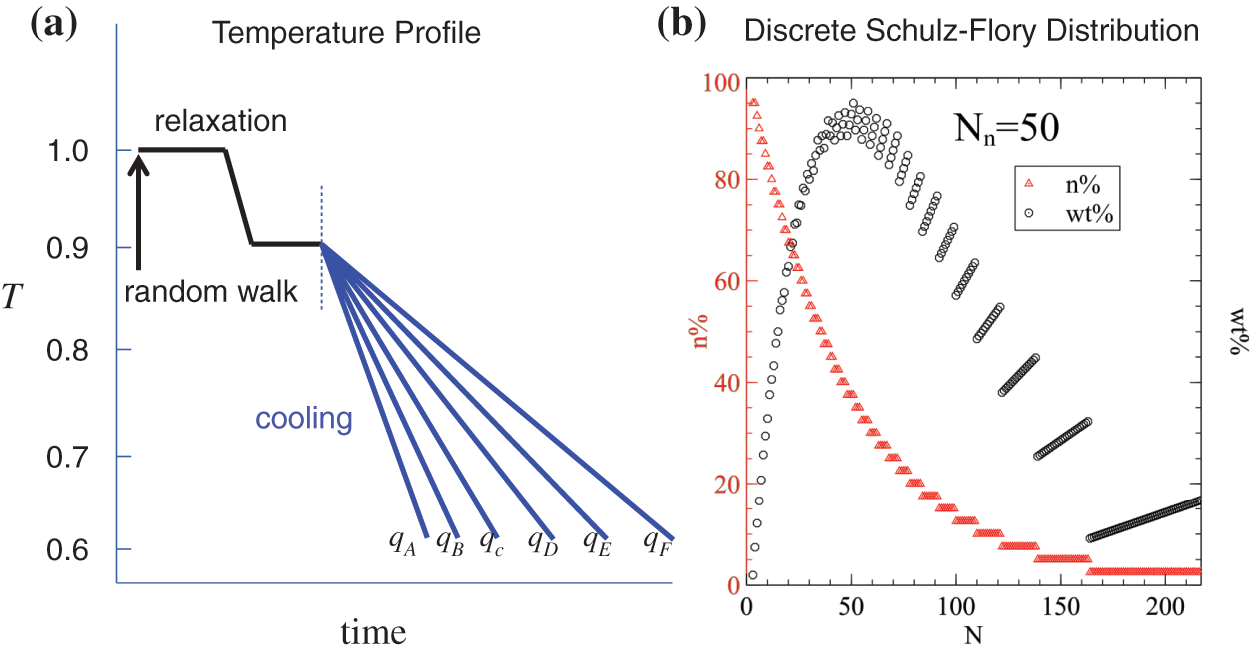
Figure 1: (a): Sketch of temperature profile used in our simulations. (b): An example of the discrete Schulz distribution (most probable distribution) of Nn=50, where the left axis is the number fraction (n%) and the right axis is the weight fraction (wt%)

To study the effect of chain length on crystallization behavior, both monodisperse and polydisperse systems of different chain lengths are used. For monodisperse systems, we select N={10,15,20,30,40,50,100,200,500}. For bidisperse systems, the studied samples are the binary mixing of N=10and100. For polydisperse systems, we utilize samples with the most probable distribution (Schulz distribution) of chain lengths [10]. The binary mixtures contain different fractions of long chains (N=100) to adjust the average chain length. Both the number-averaged length (Nn) and weight-averaged length (Nw) will be used in the following analysis. The polydisperse systems exhibit the most-probable distribution of chain lengths, described by the Schulz distribution. The Schulz distribution for a number-averaged length (Nn) is given by

ni=1Nn(11Nn)Ni1,(1)

where ni represents the number fraction of chain length Ni. In this case, the dispersity index Ð equals 2. In our simulations, the systems have limited chain numbers, and the Schulz distribution must be discretized according to the simulated configurations. As the total number of monomers in the simulation systems is targeted around 105, the distribution is not smooth when Ni is large, making it challenging to precisely control the average length as expected. Instead, we calculate the average length Nn from the final distribution. The calculated number-average lengths in our simulations are Nn={22,31,41,50,91}, corresponding to the targeted Nn={20,30,40,50,100}. An example of the discrete Schulz distribution for Nn=50 is shown in Fig. 1b.

3  Results and Discussions

3.1 Monodisperse Samples

The crystallization of linear polymers is strongly dependent on cooling rate or thermal history and chain length. Longer chains have higher crystallization temperatures and slower crystallization processes with larger temperature windows of transition. Slower cooling also leads to higher crystallization temperatures but with smaller temperature windows of transition. In general, longer chains have slower dynamics which leads to higher degrees of nonequilibrium processes, similar to that of faster cooling. Such general crystallization behavior can be demonstrated by two samples from our simulations with N=10 and 100 under different cooling rates, as shown in Fig. 2a,b.

images

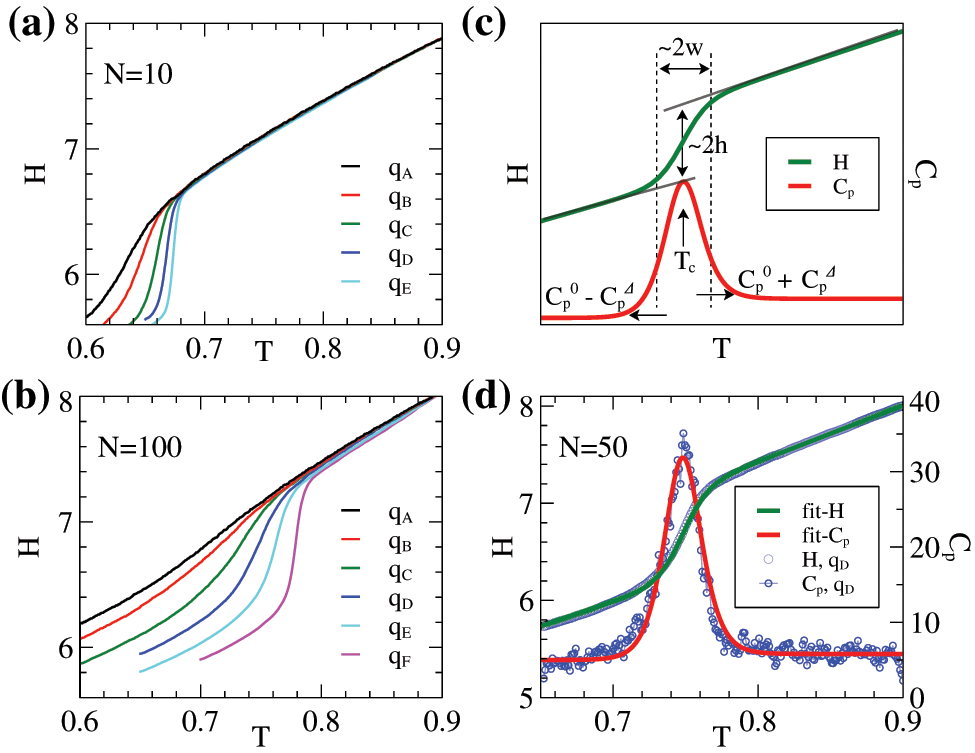
Figure 2: (a)–(b): Enthalpies (H) per monomer of two samples (N=10 and N=100) vs. temperature (T) at different cooling rates. (c): Sketch of Eqs. (2) and (3). The physical meanings of some parameters (h, w, Tc, Cp0CpΔ, and Cp0+CpΔ) are marked. (d): An example of the calculated data of H and Cp and the fitting curves with Eqs. (2) and (3). The sample is of N=50 at the cooling rate of qD

Similar to experiments, the phase transition of crystallization can be identified by the peaks of exothermal curves. The values obtained from simulations can validate the method’s feasibility through comparison with experimental data. Meyer and Müller-Plathe [18,38] discussed the variations in enthalpy (or volume per monomer) under different conditions during cooling and heating cycles in detail. Regarding the structural characteristics of the crystals, our previous work addressed the structure factor of the crystalline structure during the cooling process [36]. In MD simulations, the enthalpy (H) and specific heat (Cp ) can be calculated by H=E+pV and Cp=dE/dT+pdV/dT, where E represents the internal energy, p is pressure and V denotes the volume of the simulation box. The measured values of H and Cp depend on temperature and cooling rates. The phase transition temperature can be estimated under slow cooling. However, under the fastest cooling conditions for long polymers (e.g., N=100 at qA=2×10⁵, equivalently 3.14×10⁹ K/s), the crystallization behavior resembles a glass transition, which makes the crystallization temperature difficult to identify. We note that even at such a fast cooling rate, a small fraction of crystalline structures is still found. Due to the fast cooling rate, which results in low crystallinity, defining the crystalline regions is challenging, and a new method may provide an effective solution to this problem [40].

The phase transitions in simulations are rather slow due to the limited simulation time compared to experiments. Therefore, it is not easy to precisely estimate the Tc when the changes of exothermal curves at the phase transition are not as sharp as in experiments. To better estimate the Tc, we propose a fitting formula for Cp by

Cp=h/wsech2(t)+Cp0+CpΔtanh(t),(2)

where t=(TTc)/w is the reduced temperature around Tc. The first term, h/wsech2(t), comes from the phase transition (structural change), and the prefactor, h/w, is the peak height in specific heat due to this phase transition. The second and third terms are from steady mixing of melt and crystalline phases (we assume that there are only two phases for simplicity). The parameters 2h and 2w represent the enthalpy change and the width of the temperature window of the phase transition. The parameters, Cp0+CpΔ, and Cp0CpΔ, are the specific heats before and after phase transition. The meanings of these parameters are sketched in Fig. 2c. We have CpΔ=(CpmCpc)ϕc/2 and Cp0=CpmCpΔ. Where Cpm and Cpc are the specific heats of a pure melt and a perfect crystal, and ϕc is the final crystallinity after the phase transition. Integration of Cp with temperature gives the enthalpy as

H=H0+htanh(t)+wtCp0+wCpΔln[cosh(t)],(3)

where H0 is the enthalpy at T=Tc.

These two formulae fit the simulation data well, as shown in Fig. 2d for an example of the sample of N=50. The errors are slightly larger near the beginning and the end of the phase transition, especially during very slow cooling. We can observe that the first term of Eq. (2) is symmetric, while the calculated Cp is slightly asymmetric (with a more gradual left shoulder and a steeper right one). We attribute the main reason of these errors to the simple assumptions of two phases mixing. For polymers, there are precursor states before crystallization and significant reorganization after crystallization [41]. Therefore, the simple assumptions lead to larger errors at the beginning and end of crystallization, particularly under slow cooling rates. However, the behavior near T=Tc is fitted quite well in both H and Cp. The Tc and w obtained by fitting are in good agreement with the values obtained from the simulations, and they are insensitive to the changes of other parameters such as Cp0 and CpΔ.

In simulations, and even in experiments, the crystallization of polymers is a rather slow and continuous process, and the measured Tc and w are strongly dependent on cooling rates. For polymers with high molar mass, the temperature window of transition, w, is always large even under very slow cooling rates. By fitting Eqs. (2) and (3) to the simulation results, we can estimate the two key parameters Tc and w quite well, which describe the temperature location and window of the phase transition. We can then compare the effect of different chain lengths and cooling rates on the crystallization behavior.

It is interesting whether we can approach the limit of w0 by extrapolating the data at different cooling rates (as q0), or if we can determine how slow a cooling rate should be to satisfy a phase transition with a certain value of w. We show the relations of q and w for monodisperse samples in Fig. 3a. It is found that there is a power law:

wαqβ,β=0.68,(4)

where the parameter α is a constant for a specific sample. The value of α for longer polymers is larger than that for shorter ones, indicating that the crystallization rates of longer polymers are slower than those of shorter ones. This observation is consistent with experiments. It is noted that the scaling relation is almost length independent, i.e., the exponent β is almost the same for all different chain lengths. However, the physical mechanisms behind this power law and the exponent remain unclear.

images

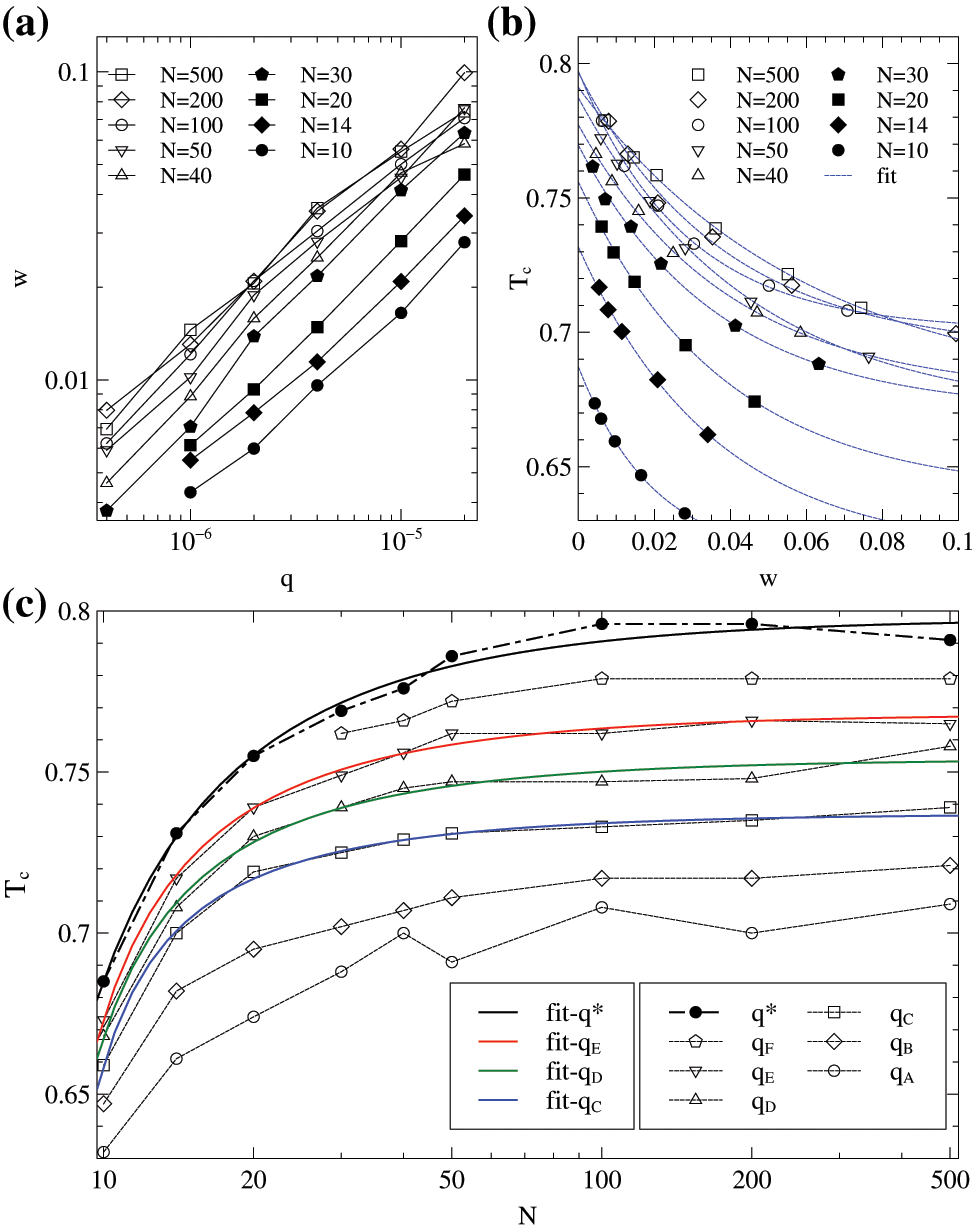
Figure 3: Results of monodisperse samples. (a): Relation of w vs. q at different cooling rates. It is found that wq0.68. (b): Relation of Tc vs. w at different cooling rates and the fitting curves. The fitting function is Tc=Tc+a[exp(w/b)1]. (c): Tc as a function of N for some fitting curves. The fitting function is Tc=TcKNN0. The cooling rate q means the data is from extrapolation of fitting function by letting w0, see (b). The fitting parameters of (K,N0) are (0.680,3.95), (0.421,5.56), (0.367,5.75), and (0.271,6.53) for q, qE, qD, and qC, respectively

In Fig. 3b, we present the results of measured Tc and w. It is observed that the data can be fitted by

Tc=Tc+a[exp(w/b)1],(5)

where Tc, a, and b are fitting parameters. In the limit of w0 (or q0), the measured value of Tc is expected to be Tc. Thus we can obtain the theoretical equilibrium crystallization temperature Tc at the limit of infinitely slow cooling, by fitting the data at different cooling rates with Eq. (5). This extrapolation is particularly useful in simulations because polymer crystallization is a slow process, and computer simulations can only be conducted under very rapid cooling conditions.

The crystallization temperature Tc increases with the chain length N, as illustrated in Fig. 3c. We find that there is an empirical relation between Tc and N as

Tc=TcKNN0,(6)

where the N0, K, and Tc are parameters. Tc represents the crystallization temperature of infinitely long chains. This formula is adapted from the Flory-Fox equation, used to fit the glass transition temperature (Tg) of polymers [42,43]. It is observed to fit our simulation data well. In experimental settings, an empirical relation between Tc and Tg is found as Tc=γTg,γ=0.50.8. This similarity suggests a strong connection between the crystallization and glass transition of linear polymers.

It is noteworthy that Eq. (6) is also similar to the Gibbs-Thomson equation for the melting temperature Tm=Tm(12σ/lρcΔh) of crystalline polymers [2]. This analogy arises when we consider l=(NN0)/f as the effective crystalline thickness and set K=2σf/ρcΔh. Here, Tm represents the equilibrium melting temperature, l denotes the lamella thickness, σ is the surface free energy per unit area, Δh is the increase in enthalpy per unit mass upon melting for an infinitely thick crystal, ρc is the density of the crystalline state and f is the average folding number. It is observed that N0 increases with the rise in cooling rate, aligning with the increase in the amorphous fraction under faster cooling conditions. However, the effective K increases with the cooling rate, as indicated in the caption of Fig. 3c. This suggests that the average folding numbers of crystalline chains f decreases with the cooling rate. This phenomenon can be attributed to the fact that the formation of chain folds requires sufficien time, while the chains do not have enough time to form well folded structures under fast cooling.

The chain lengths range from N=10 to 500, crossing the entanglement length of the melt systems of long chains, estimated to be Ne3050 depending on the temperature and methods of PPA or Z1, as demonstrated in our previous studies [44]. The crystallization temperatures Tc reaches a rough constant at the chain lengths of N>100, and the deviations between measured Tc and Eq. (6) are observable, see Fig. 3c. We note that there are lager fluctuations in Tc-N curves near N=4050, particularly under fast cooling conditions. During fast cooling in the crystallization process, polymer chains lack adequate time to slide and rearrange. This limitation can lead to a reduction in crystallinity, which subsequently results in fluctuations in Tc. Furthermore, this restricted movement is compounded by entanglement effects. These observations indicate entanglement effects in the crystallization of linear polymers under fast cooling.

3.2 Bidisperse and Polydisperse Samples

As mentioned above in the Introduction section, bidisperse and polydisperse samples also hold significant value in industry, and it is interesting that whether the above empirical formulae found for monodisperse samples stand for polydisperse samples.

We carry out MD simulations using the same parameters for the polydisperse samples with chain lengths following a Schulz distribution, as well as bidisperse samples with N=10 and 100, as detailed in the Model and Simulation Details section. In Fig. 4a, we present the relationship between w and q for both the bidisperse samples and polydisperse samples. We find that the power law described by Eq. (4) remains consistent across most samples, with the exponent β remaining unchanged. This can be attributed to the fact that β is independent of chain length. Consequently, there appears to be no distinction between bidisperse, polydisperse, and monodisperse samples. However, the parameter α is dependent on N, and it appears that the behavior of α is more likely dependent on Nw rather than Nn comparing with the results of monodisperse systems, as the data are more close to that of N=100, as indicated by the red solid triangles in Fig. 4a.

images

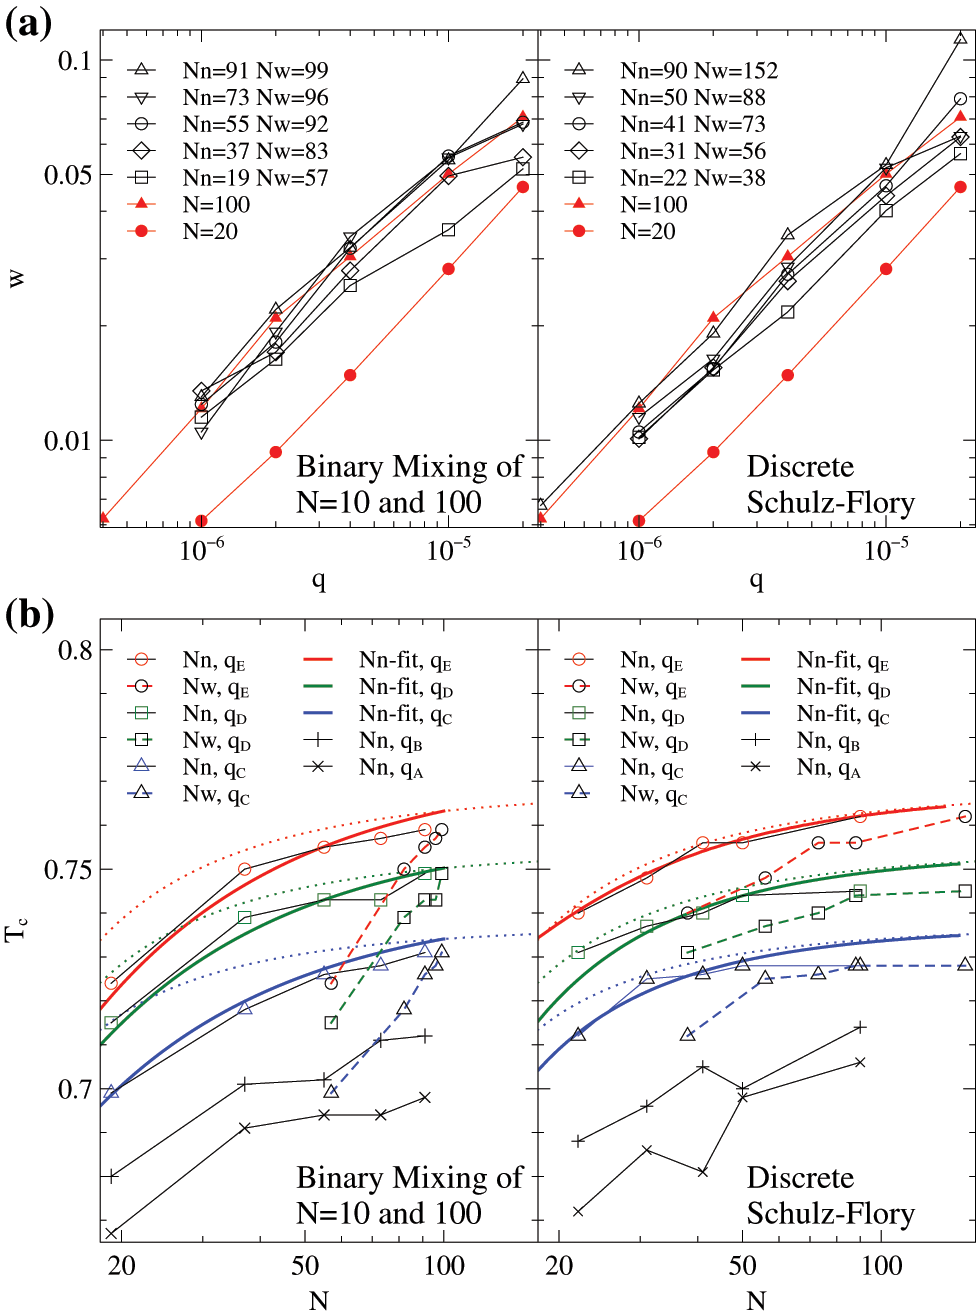
Figure 4: Results of the bidisperse samples of N=10 and 100, and of the polydisperse samples with most-probable distribution of chain lengths. Here, Nn and Nw are number-averaged and weight-averaged chain lengths, respectively. (a): Relation of w vs. q at different cooling rates. (b): Tc as a function of N. Both measured data and the fitting curves are plotted. The solid red, green, and blue lines are of the fitting function, Tcpd(N,q)=iniNi2Tc(Ni,q)iniNi. The dotted red, green, and blue lines are fitting curves for monodisperse systems, which are the same as the curves in Fig. 3c

The crystallization temperatures of different chain lengths at various cooling rates, Tc(Ni,q), are obtained from Fig. 3c. Consequently, a simple expectation of the crystallization temperature for polydisperse samples, Tcpd(N,q), might be the weight-averaged value as

Tcpd(N,q)=iniNi2Tc(Ni,q)iniNi.(7)

Here, ni is the number of polymer chains with a length of Ni, where Ni10,100 for the bidisperse samples. The ni values for the polydisperse samples satisfy the discrete Schulz distribution shown in Fig. 1b, derived from Eq. (1). N is the effective chain length of the polydisperse systems. The simulated data and fitting curves based on Eq. (7) are shown in Fig. 4b. For the bidisperse samples, we can see that Eq. (7) fits the data fairly well under cooling rates of qC, qD, and qE. However, for samples with most probable distribution of chain lengths, Eq. (7) only fits the data well at slow cooling (qE). For the fast cooling rates such as qA and qB, neither the binary nor the polydisperse samples satisfy Eq. (7), indicating that the impact of distribution of chain lengths on crystallization becomes more pronounced under rapid cooling conditions.

It is noted again that significant fluctuations in the Tc-N curves under fast cooling conditions are concentrated in the N=4050 range, coinciding with the entanglement length region of the CG-PVA model systems in the molten state (Ne3050). Unlike the monodisperse samples with N=3050, both the bidisperse samples with N=10 and 100 and the polydisperse samples, contain long chains exceeding Ne. The mixing of long chains with N>Ne and short chains N<Ne leads to a more complex crystallization behavior, as disentanglement processes may occur but are heavily reliant on relaxation times and exhibit greater stochasticity. Therefore the effects of entanglement restriction should be considered for long chains, particularly under fast cooling, which is consistent with our previous studies of the crystallization of entangled polymers [37,45].

Interestingly, although the fitting formula of Eq. (7) implies a weight averaged assumption, the effective chain lengths N of the polydisperse systems are found to be number-average values, i.e., the effective chain length would be N=Nn rather than Nw. The difference between the fitting using Nn and Nw is illustrated in Fig. 4b by the solid and dashed lines.

We display the snapshots at the final cooled state in Fig. 5. Specifically, we select three samples with Nn50 following fast cooling at qA and slow cooling at qF. Observing the results, we notice that all three samples exhibit the formation of small crystallites after the rapid cooling rate of qA, while they all develop lamellar structures following the slower cooling of qF. As the number-averaged chain lengths of the three samples are nearly the same, the differences between the crystalline structures give a visualization of the effect of chain length distribution on the crystallization. It is obvious that the lamella thicknesses are different after the slow cooling of qF, while their Tc are almost the same, as shown in Fig. 4b. This distribution dependent crystallization at almost the same Nn and Tc demonstrates a contradiction to the classical theory and needs further investigations.

images

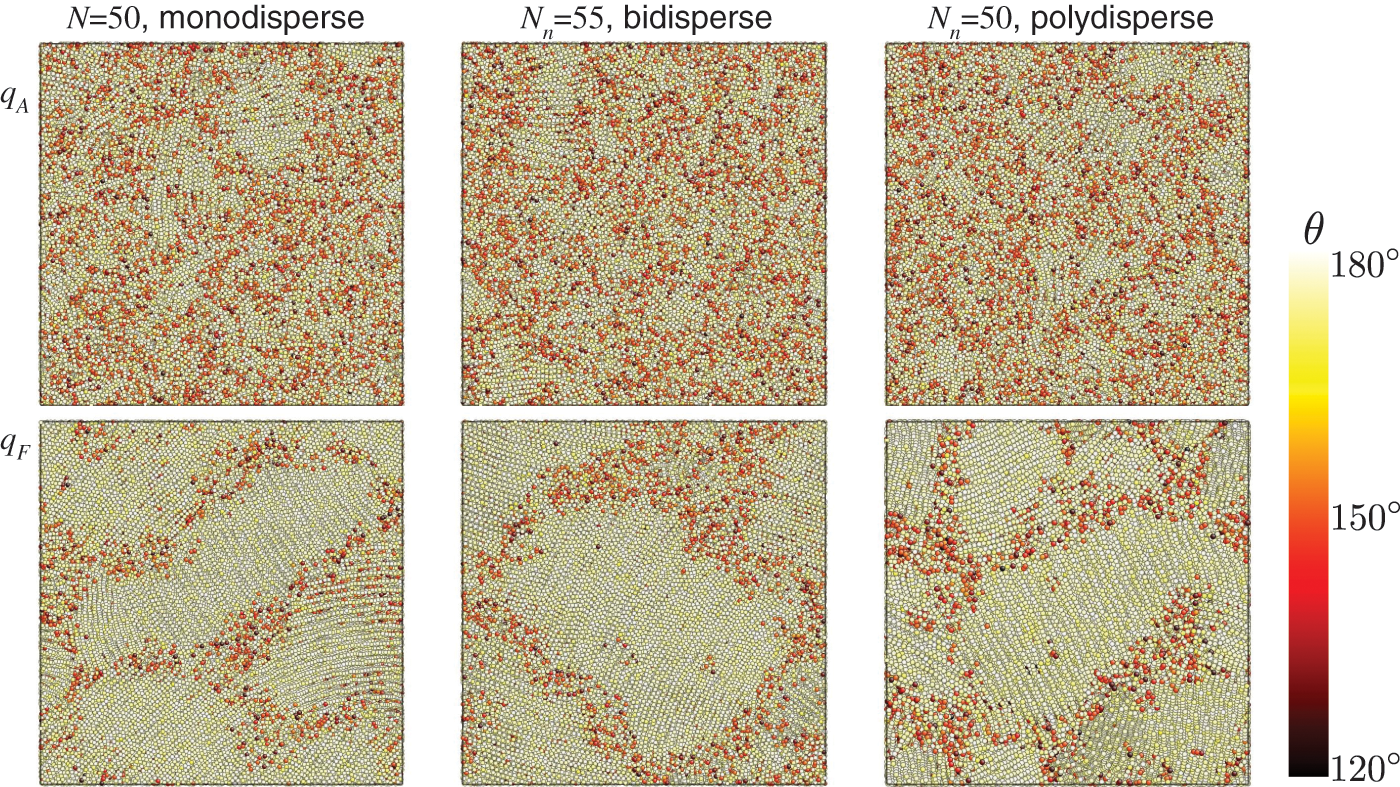
Figure 5: Snapshots of three selected samples after cooling of qA and qF with a section view. The three columns are corresponding to the monodisperse sample of N=50, the bidisperse sample with Nn=55, and the polydisperse sample with Nn=50, respectively. The two rows are corresponding to the cooling rates of qA and qF, respectively. The monomer beads are colored by the bending angles (θ) and the color map is shown at the right

4  Conclusions

In this study, we conduct a systematic investigation into the chain length-dependent crystallization of linear polymers under varying cooling rates using MD simulations. Formulae for enthalpy (H) and specific heat (Cp) based on a two-phase assumption are proposed to fit the simulation results of monodisperse samples with chain lengths from N=10 to 500. Based on the two formulae, the crystallization temperatures (Tc) can be better estimated under different cooling rates, which provides an easy way to estimate the equilibrium crystallization temperatures under finite cooling rates in simulations. The relation between crystallization temperature (Tc) and chain length (N) is found similar to the relation between glass transition temperature Tg and N, and also similar to the Gibbs-Thomson relation between melting temperature Tm and N. The similarity of chain length dependence between the Tc, Tg and Tm suggests a potential connection between crystallization, glass transition, and melting of linear polymers. Unfortunately, we do not reveal the physical relations among them currently.

For the bidisperse samples of N=10 and N=100 or the polydisperse samples featuring a most-probable distribution of chain lengths (the Schulz distribution), the crystallization temperatures Tcpd are determined to be the weight-averaged values of individual chains. However, the effective chain lengths of the polydisperse systems are found to be the number-averaged chain lengths Nn, rather than the weight-averaged ones Nw. The chain length-dependent crystallization exhibits a crossover behavior near the entanglement length (NNe), indicating the influence of entanglements under fast cooling. The dispersity of chain lengths on crystallization is found more obvious under fast cooling. We also propose two formulae based on the fittings of simulation results. However, their physical significance remains unclear and requires further investigation. Our results provide a clue to relate the studies of crystallization, glass transition and melting of linear polymers, which are traditionally considered separately. In addition to these discussed chain length distributions, we recognize the importance of exploring other types of dispersity, such as bimodal molecular weight distributions characterized by two overlapping distributions. We believe that this is a significant topic worthy of further investigation and discussion.

Acknowledgement: The authors acknowledge the financial support of the National Natural Science Foundation of China.

Funding Statement: National Natural Science Foundation of China No. 22341302.

Author Contributions: The authors confirm contribution to the paper as follows: conceptualization and methodology: Chuanfu Luo; investigation: Chuanfu Luo and Dan Xu; manuscript preparation: Dan Xu; review: Chuanfu Luo. All authors reviewed the results and approved the final version of the manuscript.

Availability of Data and Materials: Not applicable.

Ethics Approval: Not applicable.

Conflicts of Interest: The authors declare no conflicts of interest to report regarding the present study.

References

1. Hoffman JD, Miller RL. Kinetics of crystallization from the melt and chain folding in polyethylene fractions revisited: theory and experiment. Polymer. 1997;38(13):3151–212. doi:10.1016/s0032-3861(97)00071-2. [Google Scholar] [CrossRef]

2. Strobl G. The physics of polymers. 3rd ed. Berlin, Germany: Springer; 2007. [Google Scholar]

3. Ma B, Wang X, He Y, Dong Z, Zhang X, Chen X, et al. Effect of poly(lactic acid) crystallization on its mechanical and heat resistance performances. Polymer. 2021;212(7):123280. doi:10.1016/j.polymer.2020.123280. [Google Scholar] [CrossRef]

4. Hu W. Personal perspective on strain-induced polymer crystallization. J Phys Chem B. 2023;127(4):822–7. [Google Scholar] [PubMed]

5. Nie C, Peng F, Cao R, Cui K, Sheng J, Chen W, et al. Recent progress in flow-induced polymer crystallization. J Polym Sci. 2022;60(23):3149–75. doi:10.1002/pol.20220330. [Google Scholar] [CrossRef]

6. Wunderlich B,editor. Macromolecular physics: 2. Crystal nucleation, growth, annealing. New York, NY, USA and London, UK: Academic Press; 1978. [Google Scholar]

7. Reiter G, Strobl G,editors. Progress in understanding of polymer crystallization. In: Lecture notes in physics. Vol. 714. Berlin, Germany: Springer; 2007. [Google Scholar]

8. Hu W. The physics of polymer chain-folding. Phys Rep. 2018;747:1–50. [Google Scholar]

9. Wang Y, Zhang Q, Fu Q. Compatibilization of immiscible poly(propylene)/polystyrene blends using clay. Macromol Rapid Commun. 2003;24(3):231–5. doi:10.1002/marc.200390026. [Google Scholar] [CrossRef]

10. Rubinstein M, Colby RH. Polymer physics. Oxford, UK: Oxford University Press; 2003. [Google Scholar]

11. Gentekos DT, Sifri RJ, Fors BP. Controlling polymer properties through the shape of the molecular-weight distribution. Nat Rev Mater. 2019;4(12):761–74. doi:10.1038/s41578-019-0138-8. [Google Scholar] [CrossRef]

12. Long C, Dong Z, Yu F, Wang K, He C, Chen ZR. Molecular weight distribution shape dependence of the crystallization kinetics of semicrystalline polymers based on linear unimodal and bimodal polyethylenes. ACS Appl Polym Mater. 2023;5(4):2654–63. doi:10.1021/acsapm.2c02236. [Google Scholar] [CrossRef]

13. Fall WS, Baschnagel J, Benzerara O, Lhost O, Meyer H. Molecular simulations of controlled polymer crystallization in polyethylene. ACS Macro Lett. 2023;12(6):808–13. doi:10.1021/acsmacrolett.3c00146. [Google Scholar] [PubMed] [CrossRef]

14. Kwakye-Nimo S, Inn Y, Yu Y, Wood-Adams PM. Linear viscoelastic behavior of bimodal polyethylene. Rheol Acta. 2022;61(6):373–86. doi:10.1007/s00397-022-01340-5. [Google Scholar] [CrossRef]

15. Kida T, Tanaka R, Hiejima Y, Nitta K-H, Shiono T. Improving the strength of polyethylene solids by simple controlling of the molecular weight distribution. Polymer. 2021;218:123526. doi:10.1016/j.polymer.2021.123526. [Google Scholar] [CrossRef]

16. Sun Z, Dong Z, Yu F, Feng S, Chen ZR. Untangling polymer chains: size, topology, processing, and recycling. Acc Mater Res. 2025;6(5):538–43. doi:10.1021/accountsmr.5c00057. [Google Scholar] [CrossRef]

17. Doye JPK, Frenkel D. Mehanism of thickness determination in polymer crystals. Phys Rev Lett. 1998;81(10):21603. doi:10.1103/physrevlett.81.2160. [Google Scholar] [CrossRef]

18. Meyer H, Müller-Plathe F. Formation of chain-folded structures in supercooled polymer melts. J Chem Phys. 2001;115(17):7807–10. doi:10.1063/1.1415456. [Google Scholar] [CrossRef]

19. Muller M, Abetz V. Nonequilibrium processes in polymer membrane formation: theory and experiment. Chem Rev. 2021;121(22):14189–231. doi:10.1021/acs.chemrev.1c00029. [Google Scholar] [PubMed] [CrossRef]

20. Jin F, Yuan S, Wang S, Zhang Y, Zheng Y, Hong Y-L, et al. Polymer chains fold prior to crystallization. ACS Macro Lett. 2022;11(3):284–8. doi:10.1021/acsmacrolett.1c00789. [Google Scholar] [PubMed] [CrossRef]

21. Schmid F. Understanding and modeling polymers: the challenge of multiple scales. ACS Polym Au. 2022;3(1):28–58. doi:10.1021/acspolymersau.2c00049. [Google Scholar] [CrossRef]

22. Di Lorenzo ML. Crystallization of poly(ethylene terephthalatea review. Polymers. 2024;16(14):1975. [Google Scholar] [PubMed]

23. Hagita K, Yamamoto T, Saito H, Abe E. Chain-level analysis of reinforced polyethylene through stretch-induced crystallization. ACS Macro Lett. 2024;13(2):247–51. doi:10.1021/acsmacrolett.3c00554. [Google Scholar] [PubMed] [CrossRef]

24. Hu WB. Polymer features in crystallization. Chin J Polym Sci. 2022;40(6):545–55. [Google Scholar]

25. Kos PI, Ivanov VA, Chertovich AV. Crystallization of semiflexible polymers in melts and solutions. Soft Matter. 2021;17(9):2392–403. doi:10.1039/d0sm01545h. [Google Scholar] [PubMed] [CrossRef]

26. Deshchenya VI, Gerke KM, Kondratyuk ND. Microsecond-scale sucrose conformational dynamics in aqueous solution via molecular dynamics methods. J Chem Phys. 2025;163(4):044502. doi:10.1063/5.0266322. [Google Scholar] [PubMed] [CrossRef]

27. Belghazdis M, Hachem EK. Experimental and theoretical study of PEG/natural clay-based hybrids properties: role of molecular weight. Mater Today Commun. 2023;37:107422. doi:10.1016/j.mtcomm.2023.107422. [Google Scholar] [CrossRef]

28. Mathot V, Pyda M, Pijpers T, Poel GV, van de Kerkhof E, van Herwaarden S, et al. The Flash DSC 1, a power compensation twin-type, chip-based fast scanning calorimeter (FSCfirst findings on polymers. Thermochim Acta. 2011;522(1–2):36–45. doi:10.1016/j.tca.2011.02.031. [Google Scholar] [CrossRef]

29. Toda A, Androsch R, Schick C. Insights into polymer crystallization and melting from fast scanning chip calorimetry. Polymer. 2016;91(3):239–63. doi:10.1016/j.polymer.2016.03.038. [Google Scholar] [CrossRef]

30. Schawe JEK. Influence of processing conditions on polymer crystallization measured by fast scanning DSC. J Therm Anal Calorim. 2014;116(3):1165–73. doi:10.1007/s10973-013-3563-8. [Google Scholar] [CrossRef]

31. Gee RH, Lacevic NM, Fried LE. Atomistic simulations of spinodal phase separation preceding polymer crystallization. Nat Mater. 2006;5(1):39–43. doi:10.1038/nmat1543. [Google Scholar] [PubMed] [CrossRef]

32. Vettorel T, Meyer H. Coarse graining of short polythylene chains for studying polymer crystallization. J Chem Theory Comput. 2006;2(3):616–29. doi:10.1021/ct0503264. [Google Scholar] [PubMed] [CrossRef]

33. Zhang J, Hu W. Roles of specific hydrogen-bonding interactions in the crystallization kinetics of polymers. Polymer. 2023;283(49):126278. doi:10.1016/j.polymer.2023.126278. [Google Scholar] [CrossRef]

34. Yamamoto T. Chiral selecting crystallization of helical polymers: a molecular dynamics simulation for the POM-like bare helix. J Chem Phys. 2022;157(1):014901. doi:10.1063/5.0097112. [Google Scholar] [PubMed] [CrossRef]

35. Luo C, Sommer JU. Growth pathway and precursor states in single lamellar crystallization. Macromolecules. 2011;44(6):1523–9. doi:10.1021/ma102380m. [Google Scholar] [CrossRef]

36. Luo C, Sommer JU. Coding coarse grained polymer model for LAMMPS and its application to polymer crystallization. Comp Phys Comm. 2009;180(8):1382–91. doi:10.1016/j.cpc.2009.01.028. [Google Scholar] [CrossRef]

37. Luo C, Sommer JU. Frozen topology: entanglements control nucleation and crystallization in polymers. Phys Rev Lett. 2014;112(19):195702. doi:10.1103/physrevlett.112.195702. [Google Scholar] [PubMed] [CrossRef]

38. Meyer H, Müller-Plathe F. Formation of chain-folded structures in supercooled polymer melts examined by MD simulations. Macromolecules. 2002;35(4):1241–52. doi:10.1021/ma011309l. [Google Scholar] [CrossRef]

39. Plimpton S. Fast parallel algorithms for short-range molecular dynamics. J Chem Phys. 1995;177(1):1–9. [Google Scholar]

40. Bhardwaj A, Sommer JU, Werner M. Nucleation patterns of polymer crystals analyzed by machine learning models. Macromolecules. 2024;57(20):9711–24. doi:10.1021/acs.macromol.4c00920. [Google Scholar] [CrossRef]

41. Strobl G. Colloquium: laws conrolling crystallization and melting in bulk polymers. Rev Mod Phys. 2009;81(3):1287. doi:10.1103/revmodphys.81.1287. [Google Scholar] [CrossRef]

42. Fox TG, Flory PJ. Second-order transition temperatures and related properties of polystyrene. J Appl Phys. 1950;21(6):581–91. doi:10.1063/1.1699711. [Google Scholar] [CrossRef]

43. O’Driscoll K, Sanayei RA. Chain-length dependence of the glass transition temperature. Macromolecules. 1991;24(15):4479–80. doi:10.1021/ma00015a038. [Google Scholar] [CrossRef]

44. Luo C, Kröger M, Sommer JU. Entanglements and crystallization of concentrated polymer solutions: molecular dynamics simulations. Macromolecules. 2016;49(23):9017–25. doi:10.1021/acs.macromol.6b02124. [Google Scholar] [CrossRef]

45. Luo C, Sommer JU. Role of thermal history and entanglement related thickness selection in polymer crystallization. ACS Macro Lett. 2016;5(1):30–4. doi:10.1021/acsmacrolett.5b00668. [Google Scholar] [PubMed] [CrossRef]


Cite This Article

APA Style
Xu, D., Luo, C. (2025). Length Dependent Crystallization of Linear Polymers under Different Cooling Rates: Molecular Dynamics Simulations. Computers, Materials & Continua, 85(2), 2807–2818. https://doi.org/10.32604/cmc.2025.069471
Vancouver Style
Xu D, Luo C. Length Dependent Crystallization of Linear Polymers under Different Cooling Rates: Molecular Dynamics Simulations. Comput Mater Contin. 2025;85(2):2807–2818. https://doi.org/10.32604/cmc.2025.069471
IEEE Style
D. Xu and C. Luo, “Length Dependent Crystallization of Linear Polymers under Different Cooling Rates: Molecular Dynamics Simulations,” Comput. Mater. Contin., vol. 85, no. 2, pp. 2807–2818, 2025. https://doi.org/10.32604/cmc.2025.069471


cc Copyright © 2025 The Author(s). Published by Tech Science Press.
This work is licensed under a Creative Commons Attribution 4.0 International License , which permits unrestricted use, distribution, and reproduction in any medium, provided the original work is properly cited.
  • 1129

    View

  • 829

    Download

  • 0

    Like

Share Link