
 Submit a Paper
 Propose a Special lssue
 Open Access
ARTICLE
Machine Learning Based Prediction of Creep Life for Nickel-Based Single Crystal Superalloys
1 School of Materials Science and Engineering, Shenyang Ligong University, Shenyang, 110159, China
2 Institute of Metal Research, Chinese Academy of Sciences, Shenyang, 110016, China
* Corresponding Author: Xiaoming Du. Email:
(This article belongs to the Special Issue: Machine Learning Methods in Materials Science)
Computers, Materials & Continua 2025, 85(2), 3787-3803. https://doi.org/10.32604/cmc.2025.070696
Received 22 July 2025; Accepted 01 September 2025; Issue published 23 September 2025
 View Full Text
 Download PDF
Abstract
The available datasets provided by our previous works on creep life for nickel-based single crystal superalloys were analyzed through supervised machine learning to rank features in terms of their importance for determining creep life. We employed six models, namely Back Propagation Neural Network (BPNN), Gradient Boosting Decision Tree (GBDT), Random Forest (RF), Gaussian Process Regression (GPR), XGBoost, and CatBoost, to predict the creep life. Our investigation showed that the BPNN model with a network structure of “24-7(20)-1” (which consists of 24 input layers, 7 hidden layers, 20 neurons, and 1 output layer) performed better than the other algorithms. Its accuracy is 1.82% higher than that of the second-best CatBoost regression model, with a mean absolute error reduction of 93.07% and a root mean square error reduction of 88.12%.Keywords
Nickel-based superalloys are crucial in aerospace due to their superior high-temperature strength, oxidation resistance, fatigue resistance [1], and creep resistance [2]. These properties make them ideal for components like aero-engine blades, turbine disks, and combustion chambers [3]. The creep rupture life, a key measure of creep resistance, is influenced by factors such as alloy composition, processing parameters, experimental conditions, and microstructure, and serves as a vital performance metric in high-temperature environments [4].
Several theoretical approaches have been developed to accelerate the prediction of creep rupture life in engineering alloys. For instance, Dang et al. [5] proposed a method to estimate the long-term creep rupture life of alloys under low-temperature conditions. Similarly, the isothermal extrapolation method [6] developed an empirical correlation between stress and rupture time, enabling the prediction of long-term creep behavior through extrapolation. However, these time-temperature parameter (TTP) methods rely on empirical analysis of experimental data. These methods not only lack a robust theoretical foundation but also involve complex development processes, face significant delays in transitioning from research to practical application, and frequently fail to achieve the anticipated performance outcomes. In recent years, data-driven machine learning approaches have been effectively utilized for predicting material properties [7–9], accelerating the discovery of novel materials [10], and addressing a wide range of other applications [11]. These approaches have shown significant advantages in both time efficiency and predictive accuracy [12]. Zou et al. [13] utilized the composition, thermodynamic parameters, and phase structure of cobalt-based superalloys as inputs to construct classification and regression models using gradient boosting trees, respectively. Ultimately, they successfully designed a novel cobalt-nickel-based superalloy featuring a γ′ strengthening phase volume fraction of 79.8%, which exhibited no detrimental phase precipitation after aging at 1000°C for 24 h. Artificial neural networks (ANNs) simulate biological neural networks and are widely used in machine learning and cognitive science. Various statistical models have been applied to predict the creep rupture life of superalloys [14–18]. Venkatesh et al. [19] utilized a Back Propagation Neural Network (BPNN) to predict the creep rupture life of INCONEL 690 alloy at 1000°C and 1100°C, achieving 100% and 90% accuracy within a ±2-h error range. Yoo et al. [20] applied a Bayesian neural network integrated with the Markov Chain Monte Carlo (MCMC) method to analyze the mechanistic drivers of creep behavior. Key input parameters included chemical composition, applied stress, and testing temperature, with the model accuracy of 93.2%. Islam et al. [21] utilized a neural network model to classify and predict the phase selection of multi-principal element alloys (MPEAs) based on experimental datasets. The accuracy of the trained neural network model surpassed 99%. However, the accuracy of phase prediction in alloys may vary depending on the specific algorithm used. For instance, Hou et al. [22] proposed integrating empirical knowledge models into the prediction process, achieving a prediction accuracy for high-entropy alloys that exceeds 83.3%. Zhou et al. [23] employed an ANN model to predict the amorphous (AM), intermetallic compound (IM), and single-phase solid solution (SS) phases for high-entropy alloy phase design, achieving accuracies of 98.9%, 95.6%, and 97.8%, respectively.
In this study, a Back-Propagation Neural Network (BPNN) was employed to develop a creep life prediction model for nickel-based single-crystal superalloys. The model overcomes the limitations of analytical and empirical descriptions of nonlinear interactions among high-dimensional variables in engineering, enabling accurate creep life prediction while reducing experimental costs.
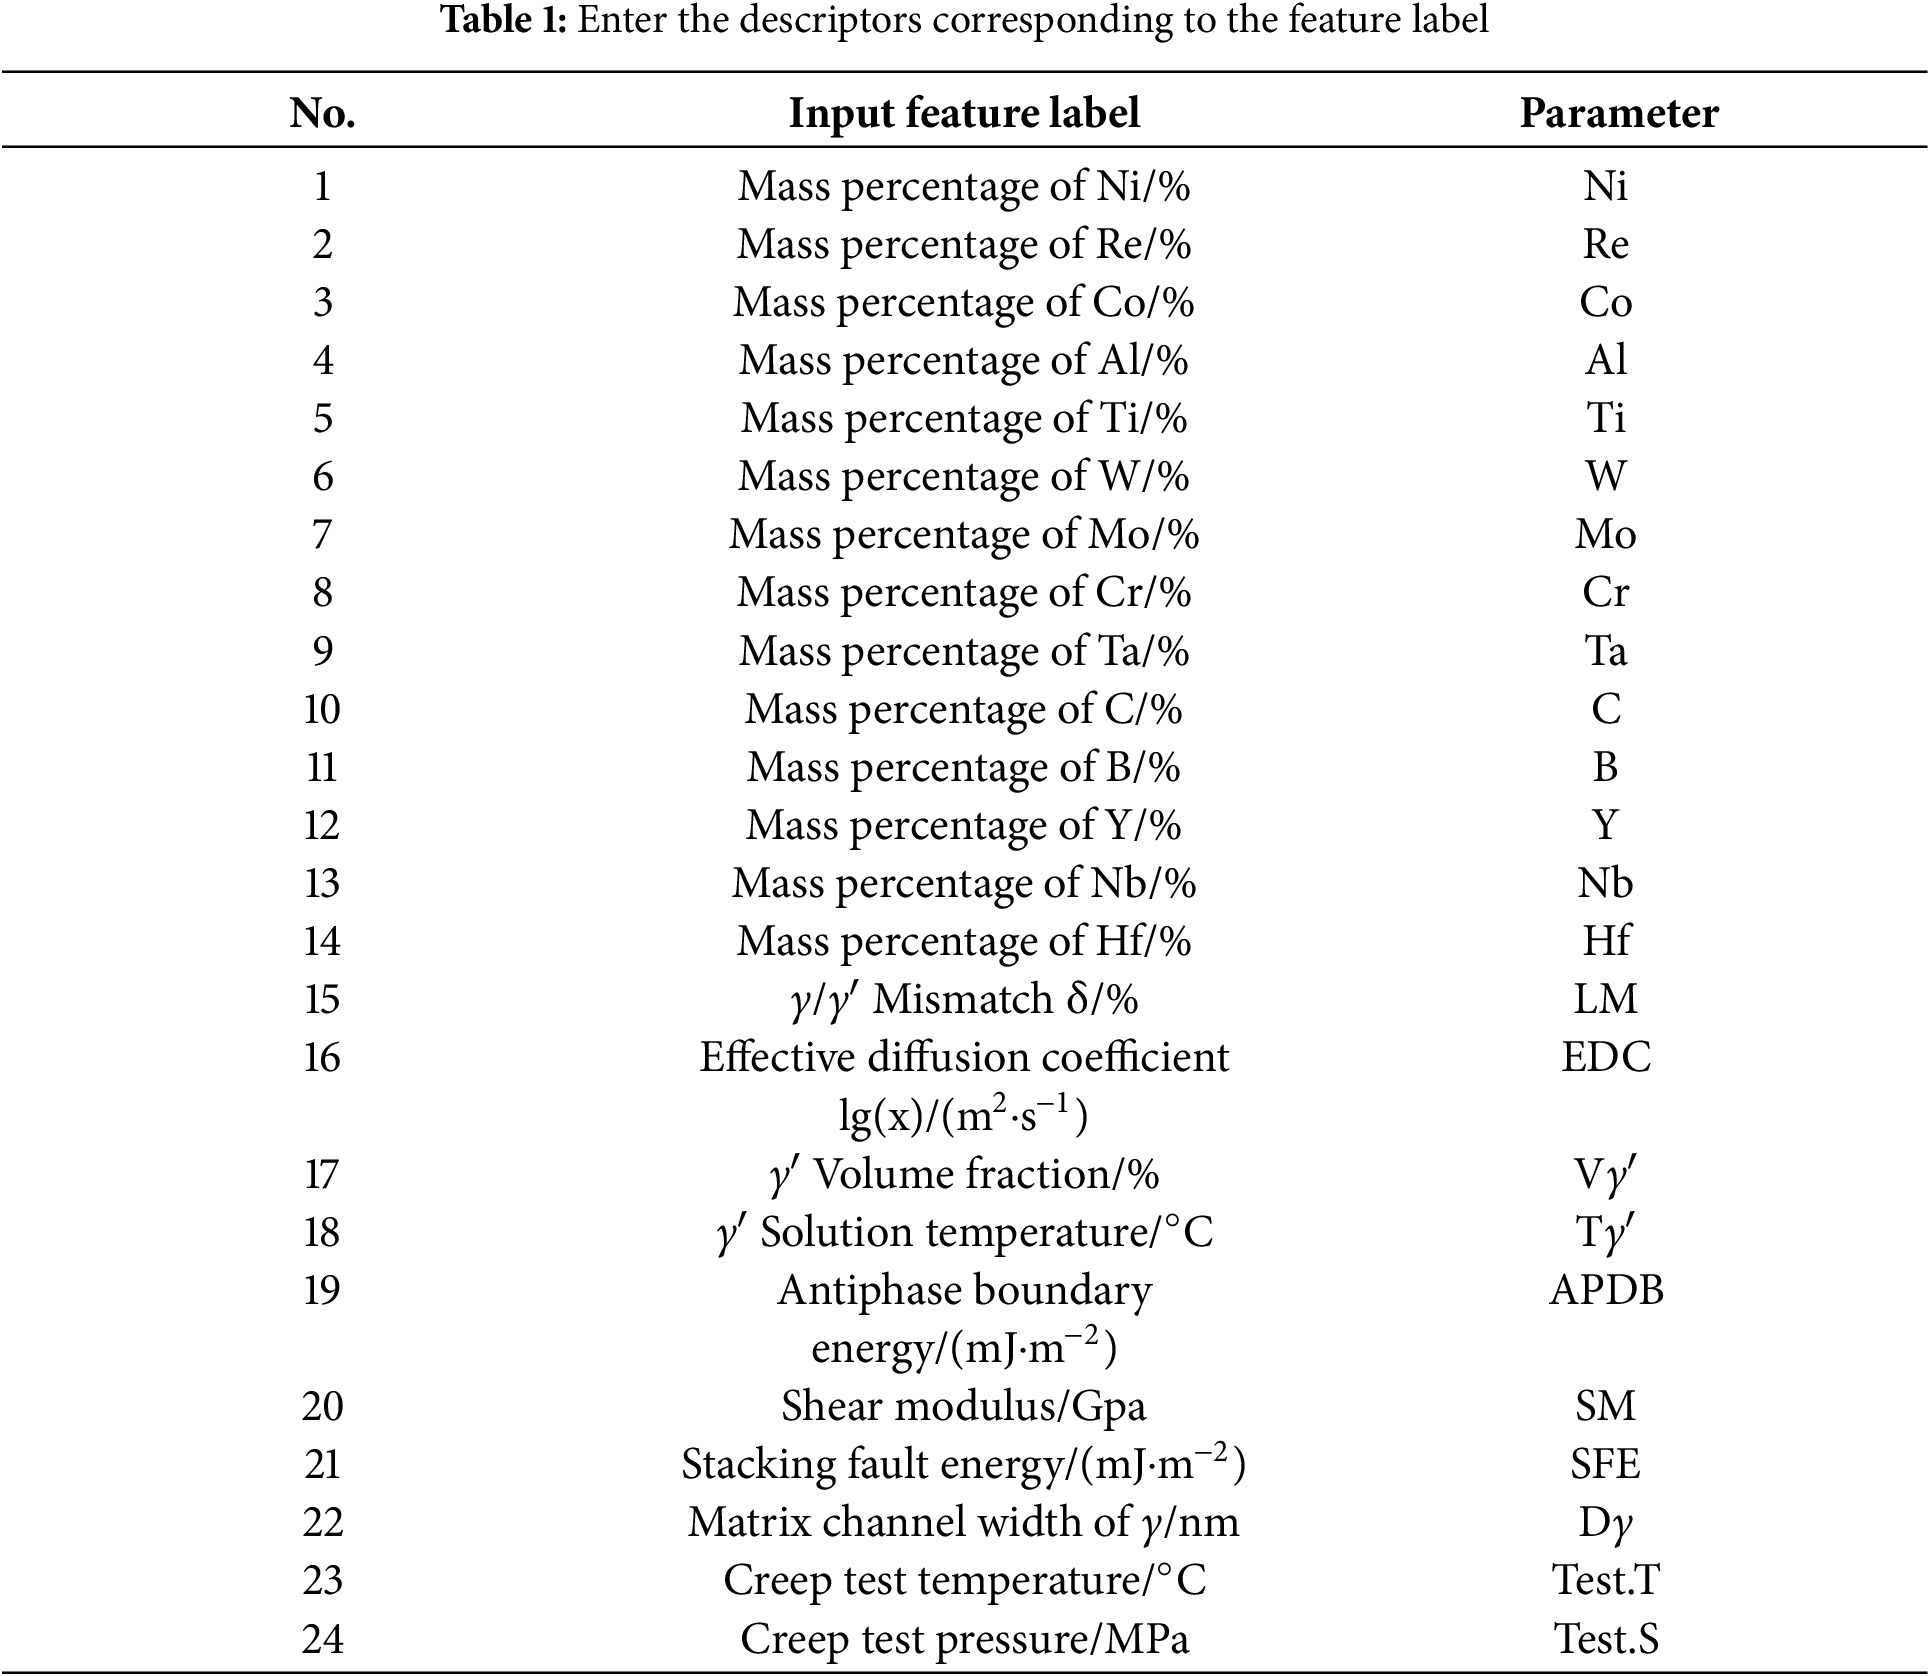
The experimental data utilized in this study comprises a 550-item dataset derived from my previous research [24]. Table 1 presents the 24 input features included in the dataset sample, which encompasses 14 alloy elements (Ni, Re, Co, Al, Ti, W, Mo, Cr, Ta, C, B, Y, Nb, Hf), 8 microscopic parameters (γ/γ′ mismatch, effective diffusion coefficient, γ′ volume fraction, γ′ solid solution temperature, antiphase domain boundary energy, shear modulus, stacking fault energy, and γ matrix channel width), and 2 processing parameters (creep test temperature and creep test pressure). The output parameter is creep life. Consequently, the BPNN model’s input and output layers contain 24 and 1 neuron nodes, respectively.
Dataset segmentation plays a vital role in machine learning and data preprocessing. In this study, the “10-fold cross-validation” method was employed for data segmentation. A total of 550 samples were considered, with 495 randomly assigned to the training set and the remaining 55 reserved for testing.
The artificial neural network (ANN) model is a computational system inspired by how neurons in the human brain process information. It is capable of processing vast amounts of data simultaneously across multiple threads [25]. The BPNN is a commonly used artificial neural network that adjusts weights and thresholds to minimize total error. Fig. 1 shows a schematic representation of the BPNN [26].
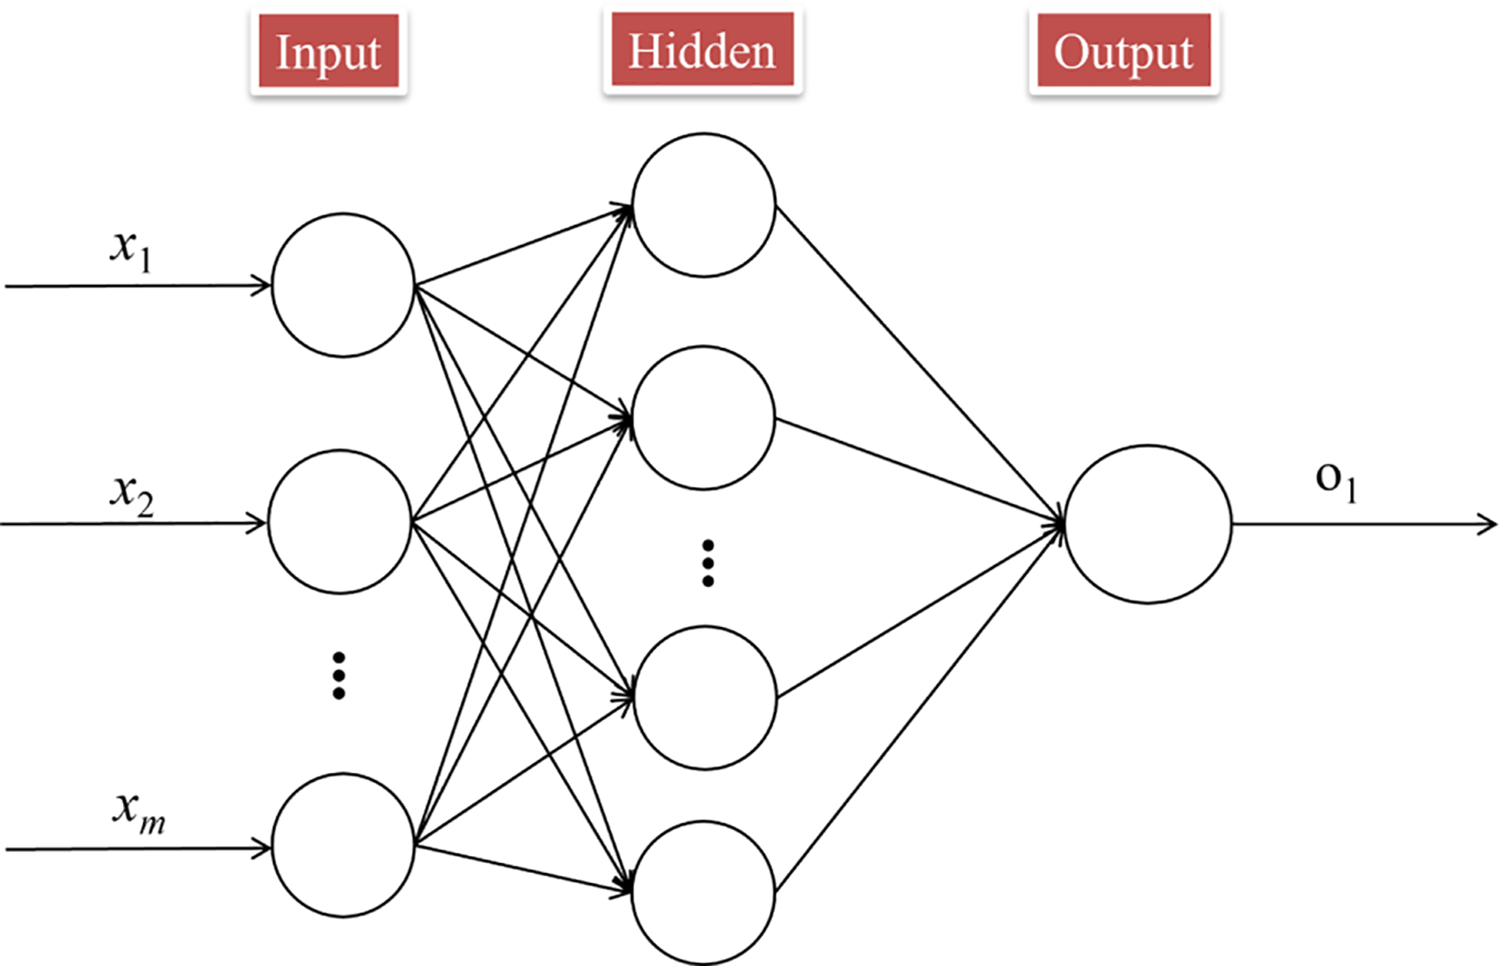
Figure 1: BPNN network diagram
The BPNN is composed of input, hidden, and output units, each playing a crucial role in the network’s structure and function. The output can be expressed as follows: y = f(b + ∑nxiwi). In this formula, xi represents the input, wi denotes the weight, which indicates the influence of the input on the neuron’s output, b is the bias parameter that adjusts the neuron’s decision threshold, and the final output y is obtained through an activation function f. The ReLU activation function is classified as a “non-saturated function”, which effectively addresses the issue of gradient vanishing, enhances the sparsity of the neural network, significantly improves computational speed, and reduces parameter interdependence, thereby mitigating the risk of overfitting. Therefore, the creep life prediction model for nickel-based single-crystal high-temperature alloys utilizes the ReLU activation function within the BPNN architecture.
The Gradient Boosting Decision Tree (GBDT) algorithm utilizes decision trees as base learners and iteratively combines the predictions from a sequence of trees to improve model accuracy. In each iteration, a new tree is trained to minimize the residuals between the actual values and the current predictions [26]. The Random Forest (RF) algorithm has become a widely used nonparametric method for both classification and regression tasks. It generates predictive models by leveraging diverse predictor variables without imposing any prior assumptions regarding the form of their relationship with the response variable [27]. Gaussian Process Regression (GPR) is a nonlinear, nonparametric regression method that is particularly effective for interpolation tasks involving data points distributed across a high-dimensional input space [28]. GPR addresses the modeling challenge by incorporating a priori assumptions about the smoothness of the underlying function, thereby allowing explicit and quantitative control over the locality of the interpolation. XGBoost significantly enhances both the training speed and predictive performance of models through system optimizations, such as distributed computing and cache-aware algorithms, as well as algorithmic improvements, including second-order optimization and multi-objective regularization. It is widely utilized in both industrial and academic settings [29]. CatBoost is a gradient boosting framework specifically designed to optimize the processing of categorical features. It mitigates data leakage through its sequential statistics technology for target encoding and enhances training speed and model stability by employing an efficient structure based on symmetric trees. Additionally, its unique gradient bias correction method effectively addresses the issue of gradient estimation bias, thereby improving the model’s generalization capability [30].
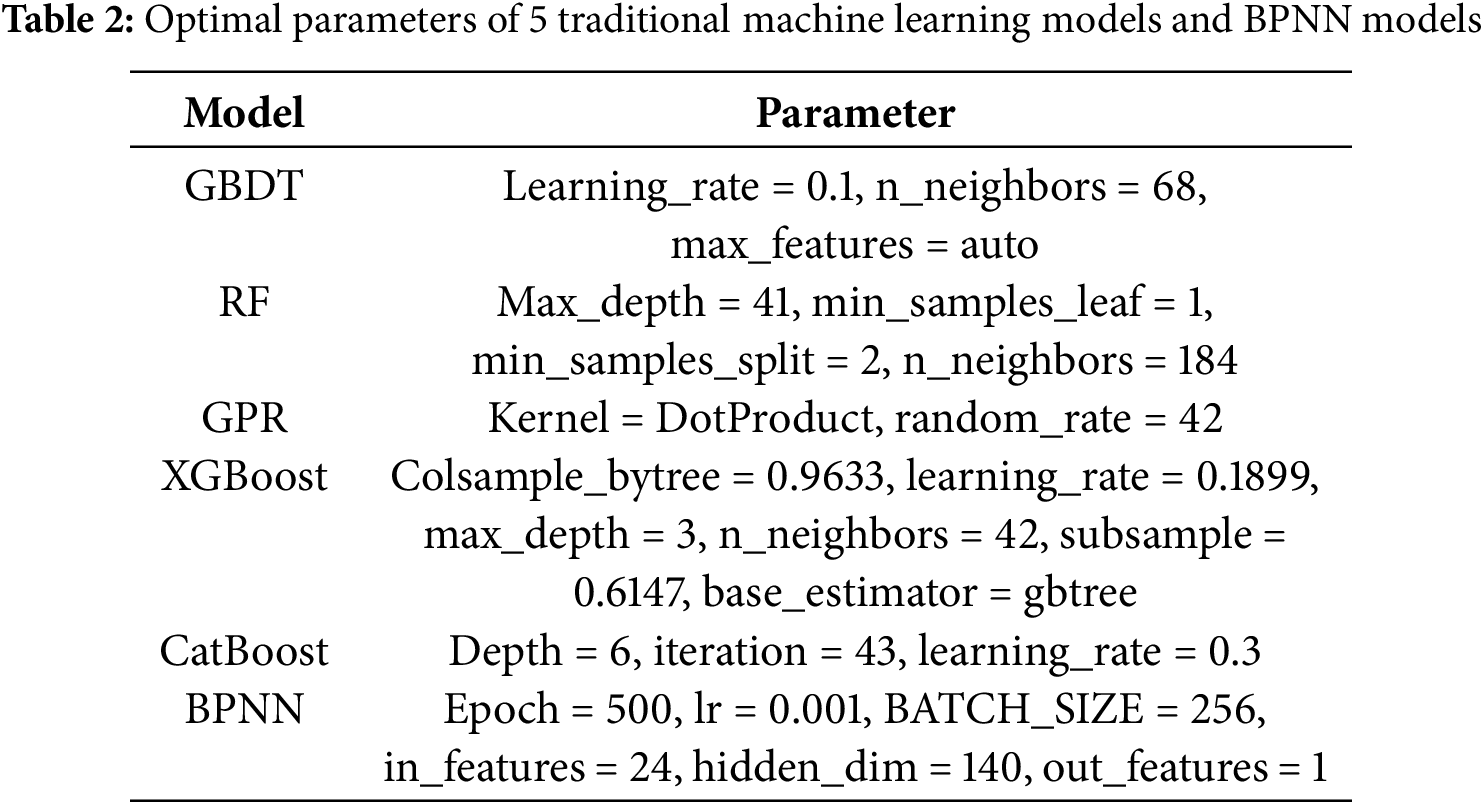
For all six models (GBDT, RF, GPR, XGBoost, CatBoost, and BPNN), hyperparameter optimization was conducted via grid search and cross-validation. The optimal parameters (Table 2) were selected to minimize the RMSE on the validation set, ensuring the weight coefficients and model structures are optimized for creep life prediction.
2.3 Construction and Evaluation of Creep Life Prediction Model Based on BPNN
Fig. 2 illustrates the process of predicting creep life using a BPNN. Initially, the creep life dataset is analyzed, followed by the preprocessing of input data and feature extraction. Subsequently, various combinations of hidden layers and neurons within those layers are employed to modify the network structure, resulting in different neural network models tailored to process the creep life data of complex structures. Finally, the weights of each model are fused, the results are evaluated, and the neural network structure that demonstrates the best performance is selected.
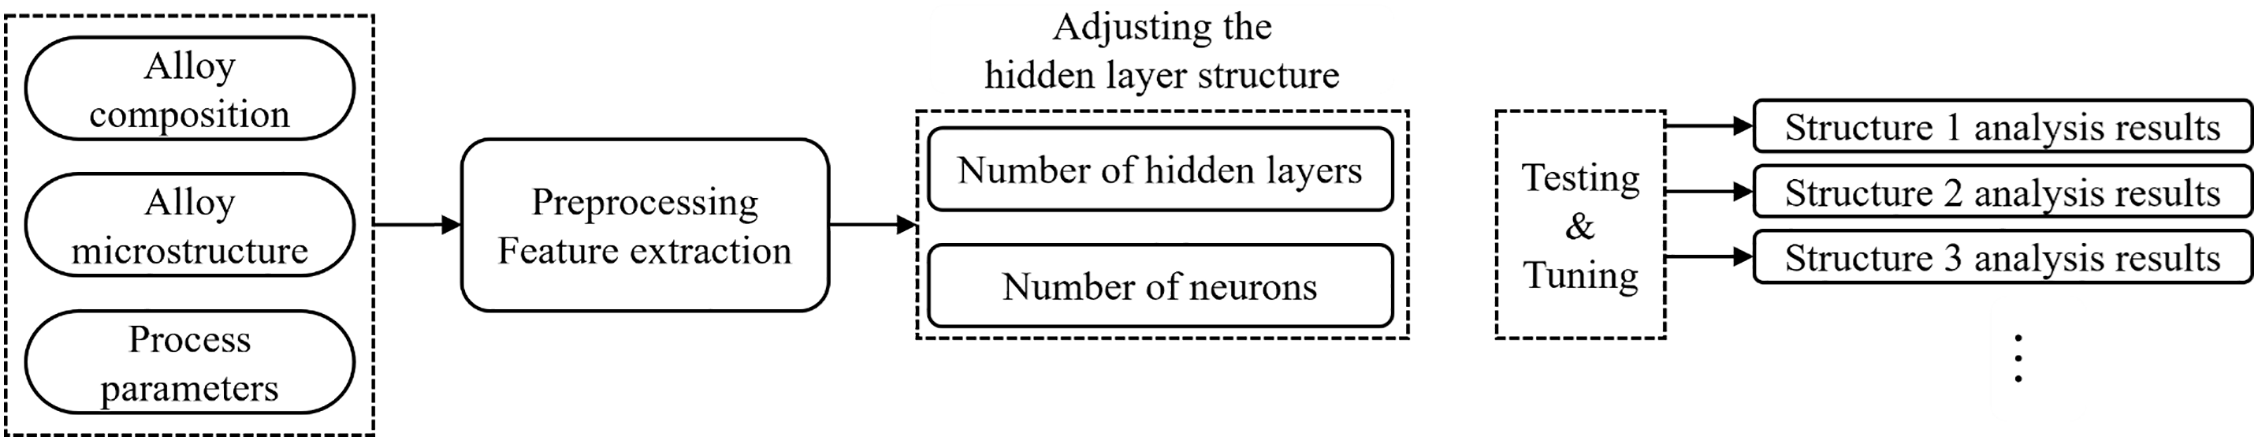
Figure 2: BPNN creep life prediction process
Fig. 3 illustrates the structure of the BPNN developed using the creep life data. The preparatory work before establishing the BPNN model primarily involves determining the network architecture and various parameters based on the creep life data.
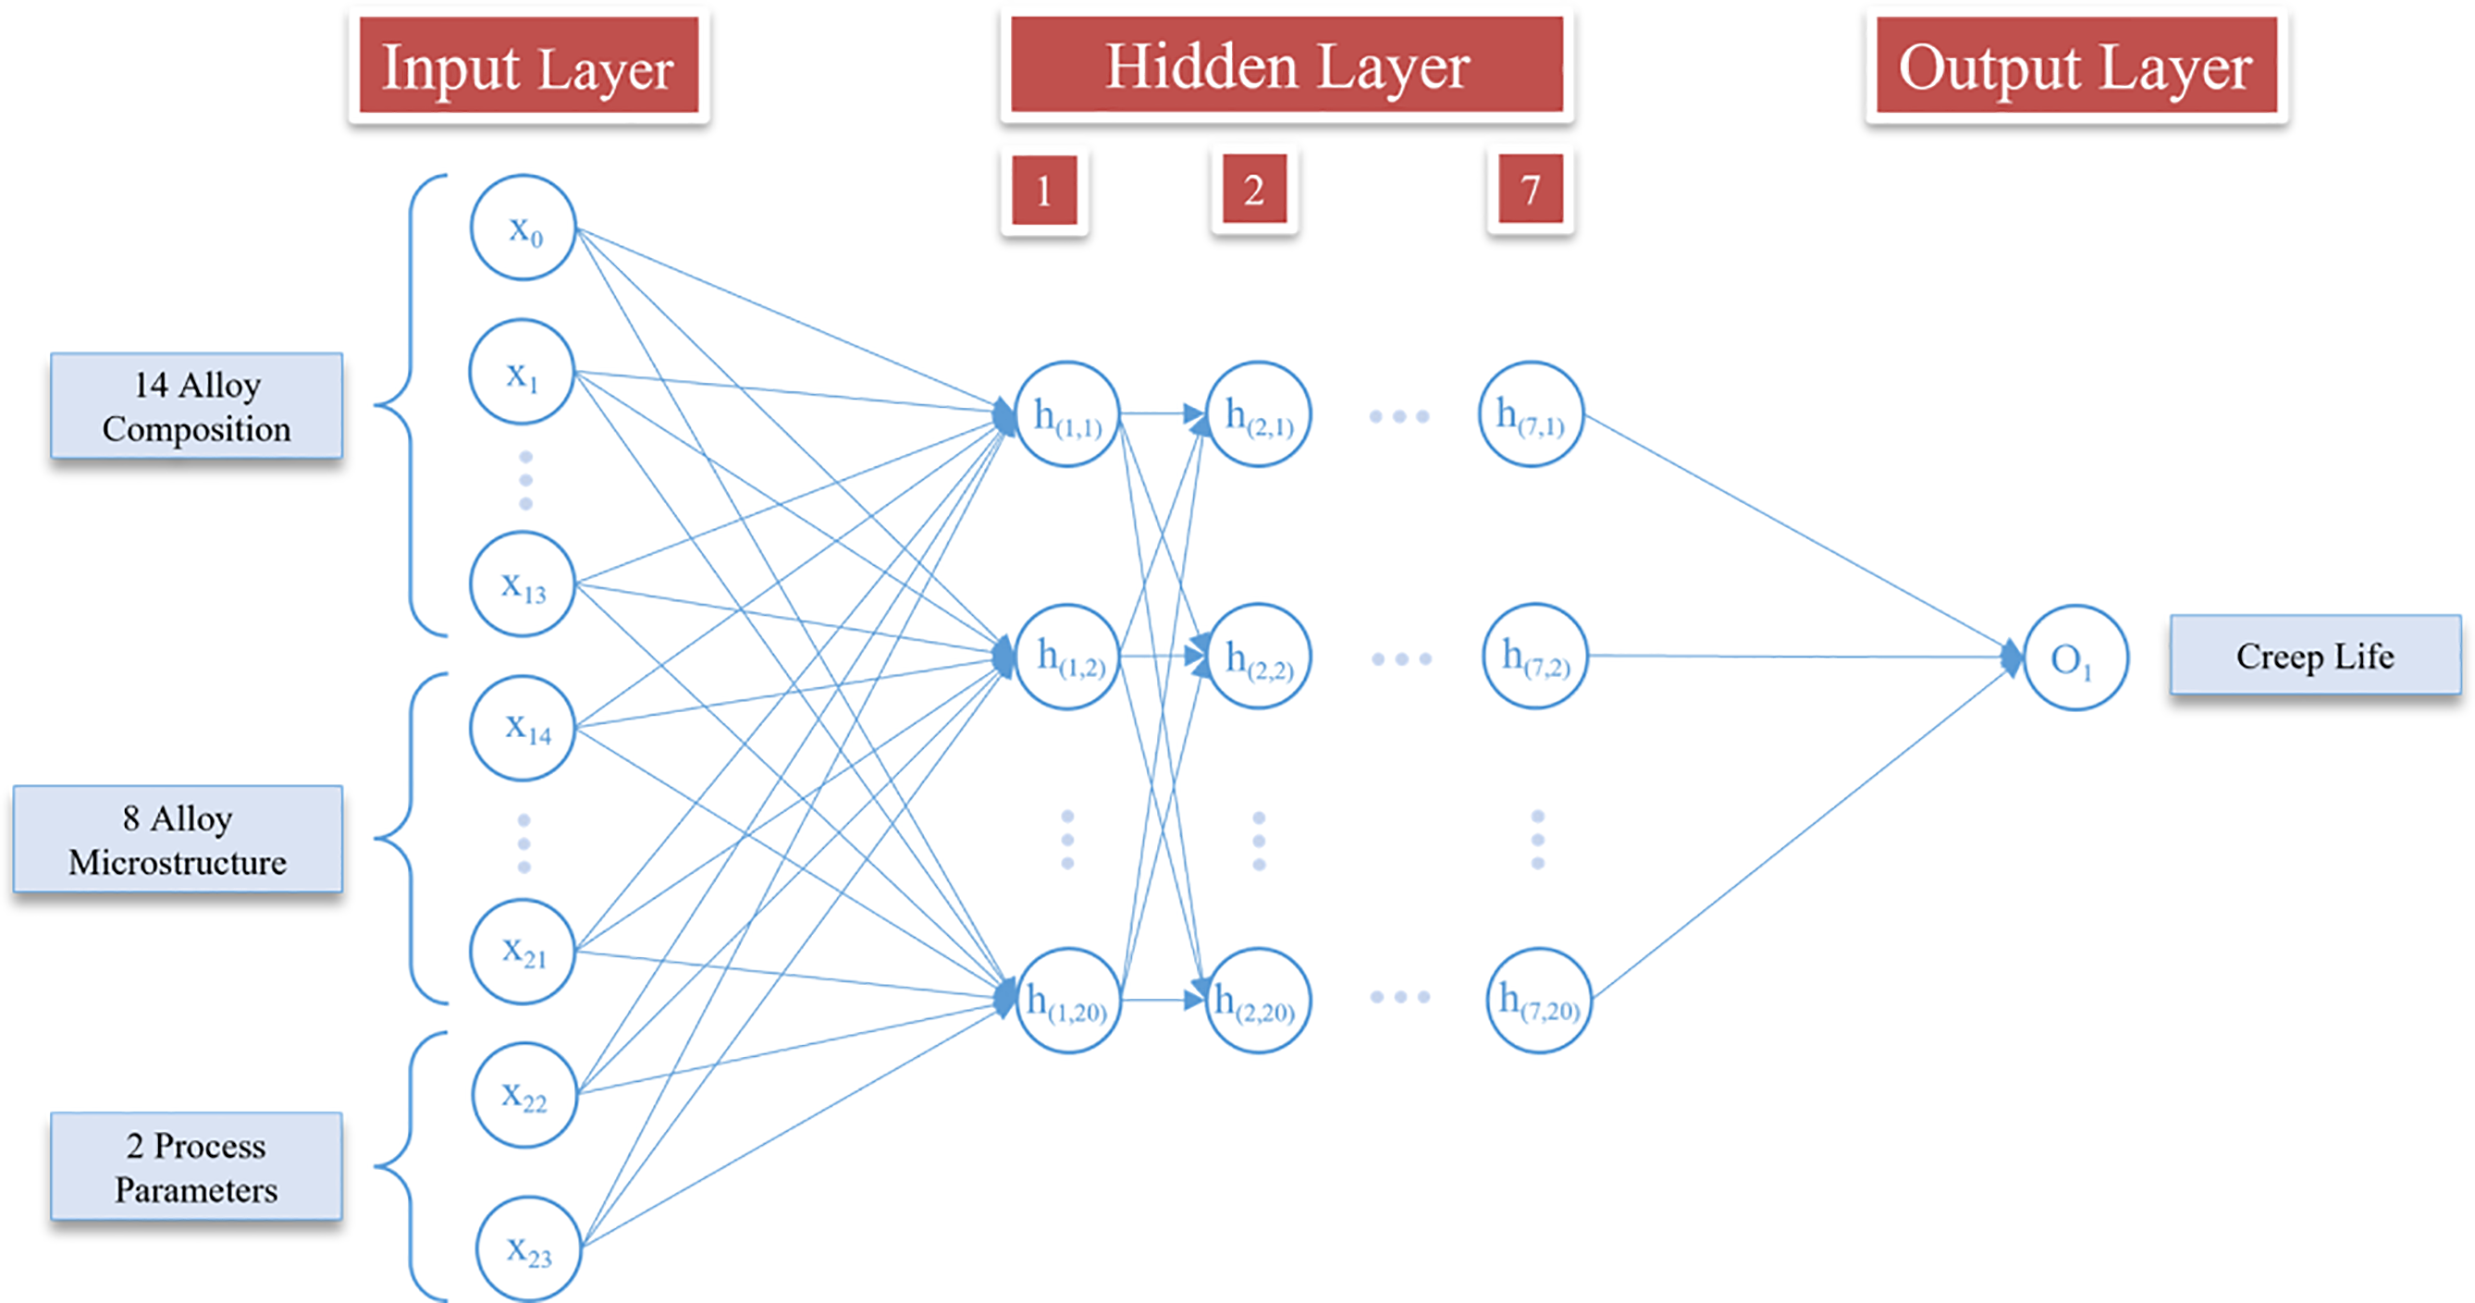
Figure 3: BPNN creep life prediction model
In this study, the BPNN model comprises a total of 24 input parameters, with the output parameter being creep life. This indicates that the BPNN model has 24 neurons in the input layer and 1 neuron in the output layer. There are no strict design rules regarding the number of hidden layers in a neural network. The process typically starts with a single hidden layer and gradually increases the number of layers until the optimal configuration is identified. The design of the number of neuron nodes within the hidden layers is primarily based on empirical experience and is guided by the following empirical Eq. (1):
where N is the number of input units, M is the number of output units, and a is a constant between 0 and 10.
The performance evaluation of the BP neural network model utilizes three indicators: the coefficient of determination (R-squared, R2), the Root Mean Square Error (RMSE), and the Mean Absolute Error (MAE), as defined by the following Eqs. (2)–(4):
where n is the number of samples in the test set, yi is the true value,
3.1 Feature Importance Ranking
Fig. 4 illustrates the SHAP value distribution of the key input features in the training dataset. Each data point represents a creep life data sample, where positive SHAP values increase the predicted value relative to the mean, while negative SHAP values decrease it.
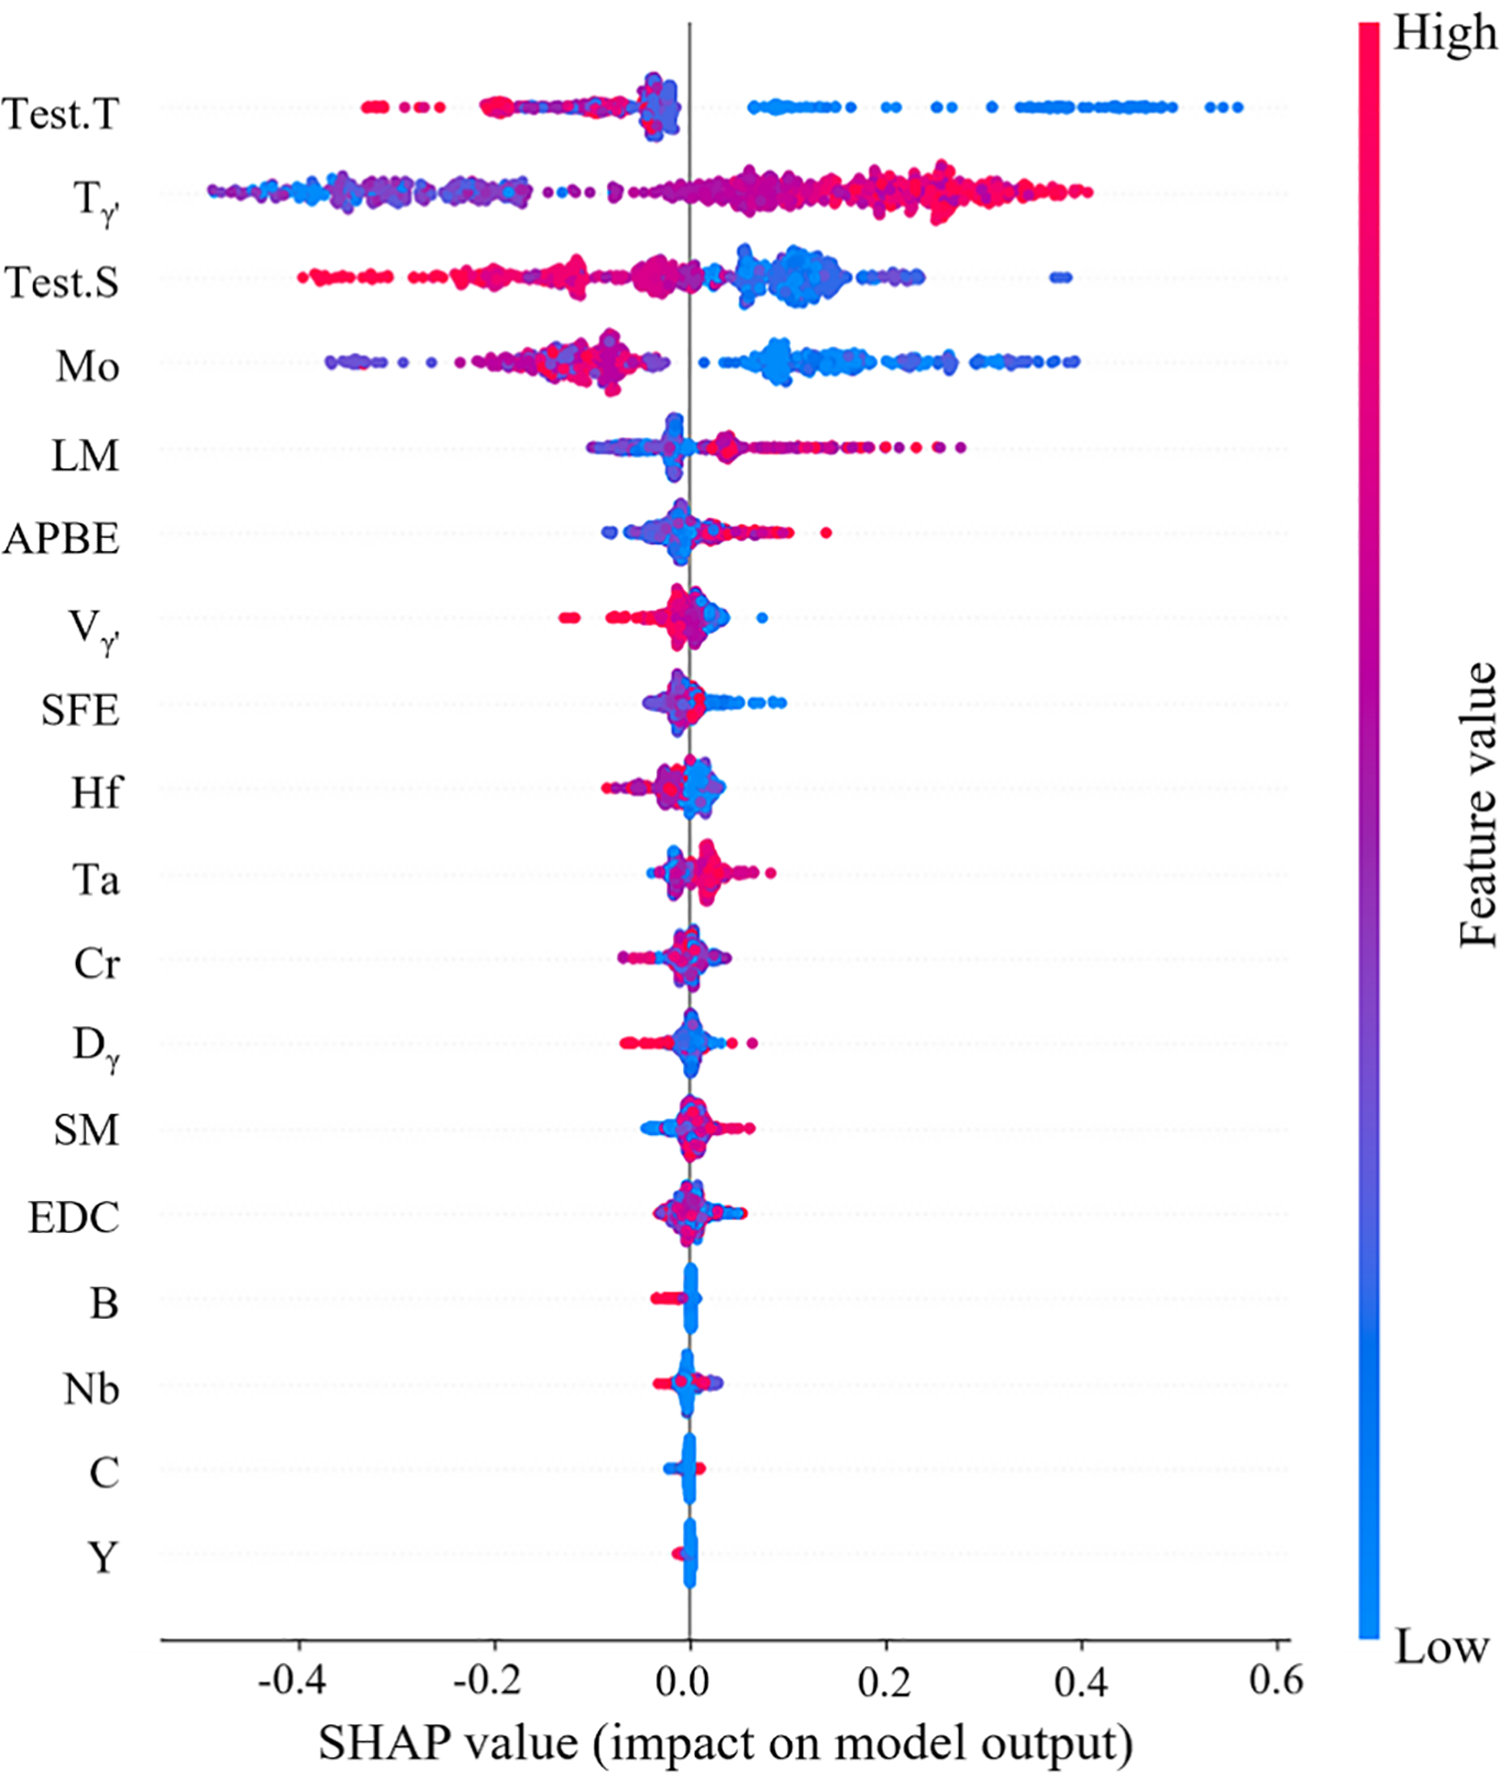
Figure 4: Distribution of SHAP values for different features
As illustrated in Fig. 4, the test temperature, solubility of the γ′ phase in the alloy, test stress, Mo composition, and lattice mismatch are the characteristics most closely associated with creep life performance. Among the factors examined, the test conditions—specifically, test temperature (Test.T) and test stress (Test.S) are negatively correlated with the SHAP value. Higher Test.T and Test.S facilitate the energy and driving force required for dislocation motion in the alloy, leading to a shorter creep life. Consequently, this results in a reduced creep life of the alloy. Furthermore, elevated temperatures facilitate the diffusion of elements within the alloy. This diffusion leads to rapid structural evolution (such as rafting), a swift decline in the alloy’s properties, and a significant reduction in its creep life.
The γ′ phase solubility serves as an indicator of the stability of the γ′ strengthening phase within the alloy. A higher dissolution temperature indicates greater stability of the strengthening phase, making it less susceptible to instability and deformation during creep. This stability effectively preserves the strengthening effect, thereby enhancing the creep properties of the alloy and prolonging its lifespan.
As illustrated in Fig. 4, test temperature (Test.T), γ′ phase solubility (Tγ′), test stress (Test.S), Mo composition, and lattice mismatch (LM) are the characteristics most closely associated with creep life performance.
Test.T/Test.S: Elevated temperature accelerates dislocation climb and elemental diffusion, promoting γ′ coarsening [31], while high stress directly enhances dislocation glide driving force [32]. Tγ′: Higher dissolution temperature stabilizes the γ′ phase, inhibiting dislocation cutting and maintaining strengthening efficacy [33]. LM: A positive correlation exists between lattice mismatch and SHAP values. Moderate mismatch (δ = 0.5%–1.0%) strengthens creep resistance via coherent strain fields that obstruct dislocation motion [34], but excessive δ (>1.2%) destabilizes the γ/γ′ interface and accelerates γ′ rafting [35], reducing creep life. Mo: As a crucial solid-solution strengthener, Mo dissolves into the γ matrix, causing lattice distortion and elastic stress fields that impede dislocation movement [31], thereby enhancing creep resistance.
A positive correlation exists between lattice mismatch (LM) and SHAP values. As lattice mismatch increases, so does its contribution to creep life. However, excessive lattice mismatch can destabilize the two-phase coherent interface and promote the coarsening of the γ′ phase. This instability adversely affects the structural integrity of the alloy, ultimately leading to a reduction in creep performance [31].
The alloying element Mo is a crucial solid solution component in high-temperature alloys. It typically dissolves into the γ matrix phase, leading to considerable lattice distortion, the formation of an elastic stress field, and the obstruction of dislocation motion during the deformation of the alloy. Consequently, this enhances the high-temperature strength and creep properties of the alloy [36].
3.2 Creep Life Prediction Using BPNN Model
Tables 3 and 4, and Fig. 5 present the MAE and R2 results of the BPNN model with varying numbers of hidden-layer neuron nodes. Firstly, based on empirical Eq. (1) in Section 2.3, the recommended range for the number of hidden-layer neuron nodes is between 5 and 15. Secondly, according to the first two of the three guiding principles, the suggested range extends from 1 to 24, which aligns with the third principle. In summary, the number of hidden-layer neuron nodes is selected from 5 to 28. The MAE and R2 were calculated after each model was trained three times.
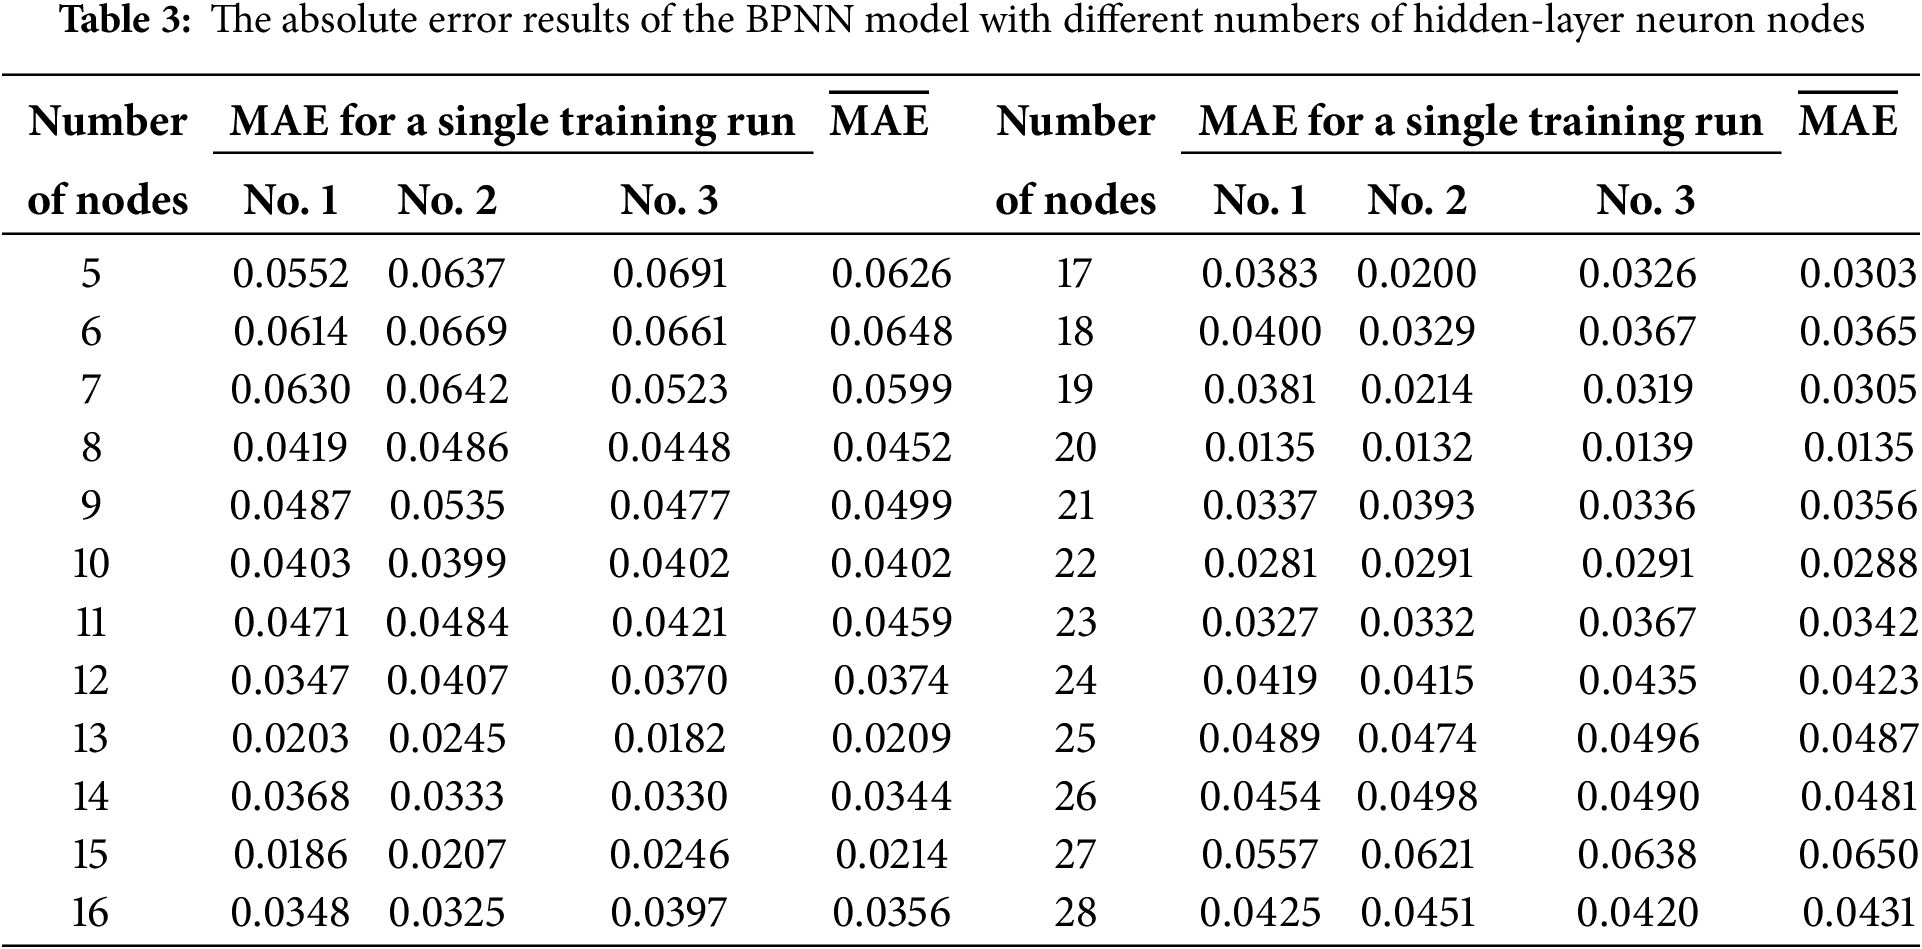
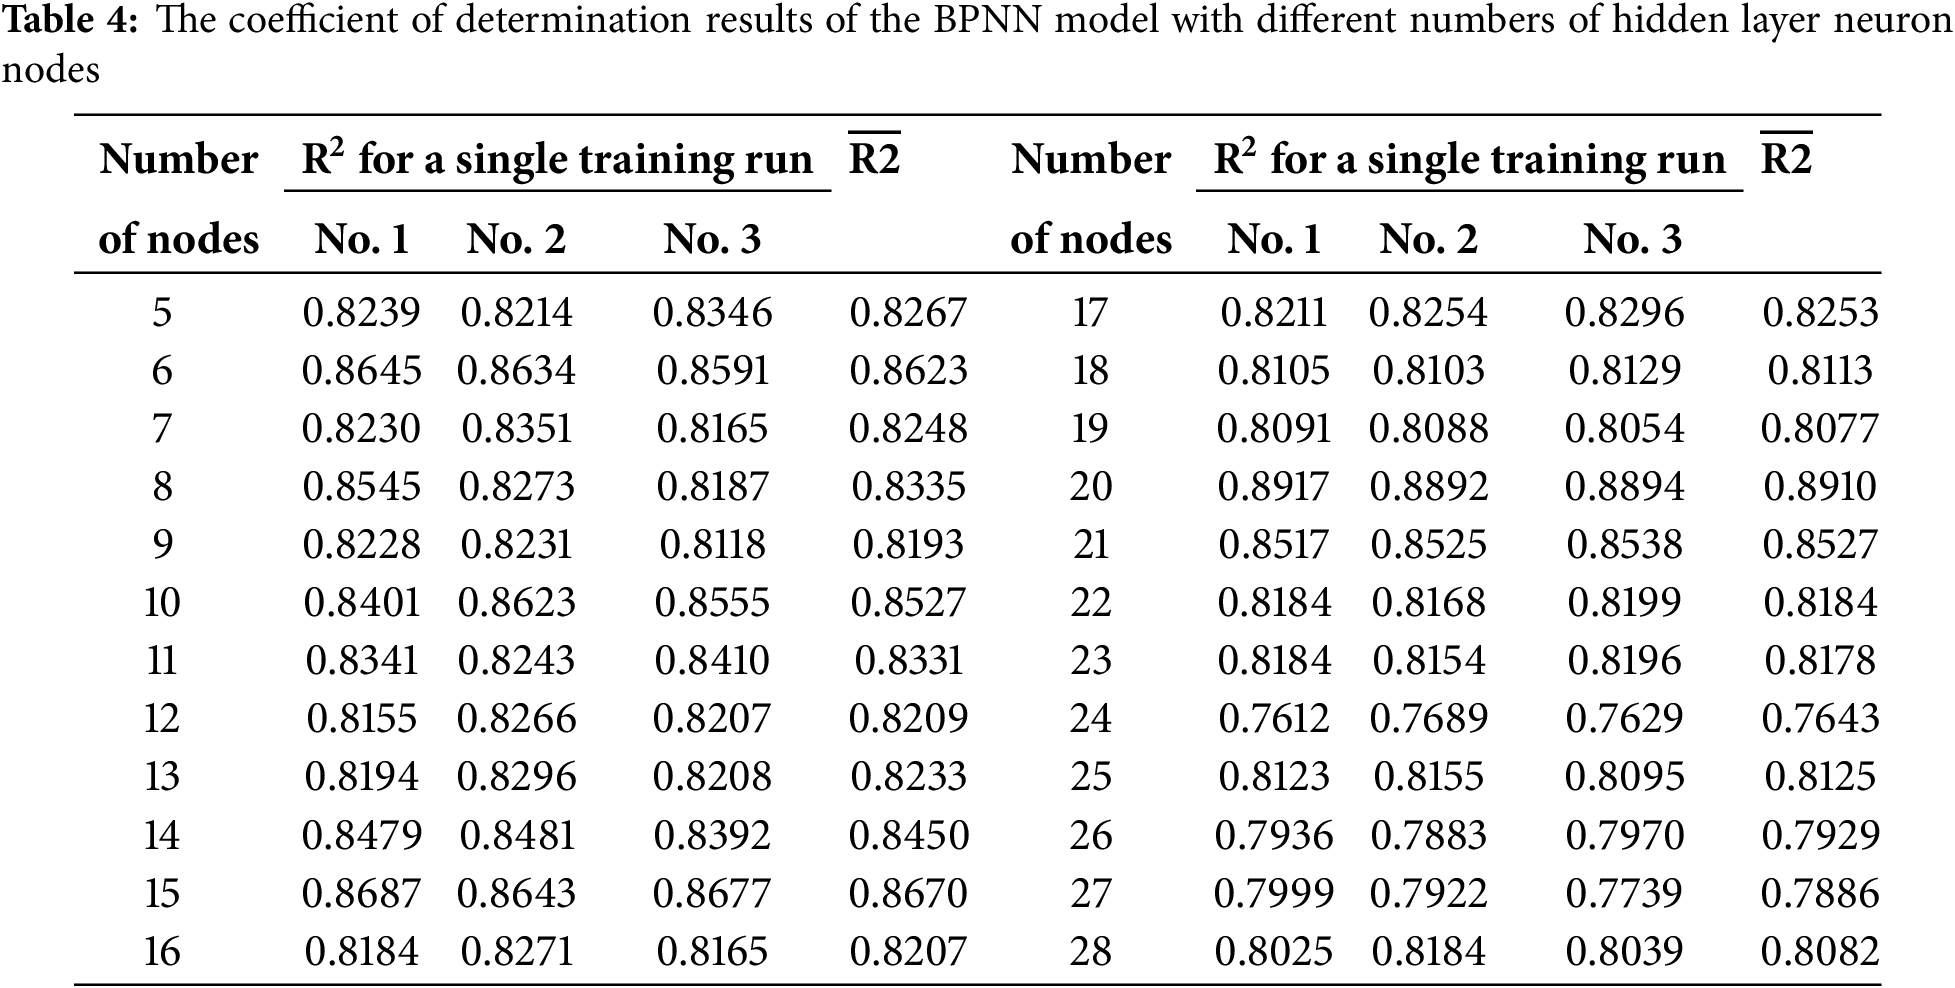
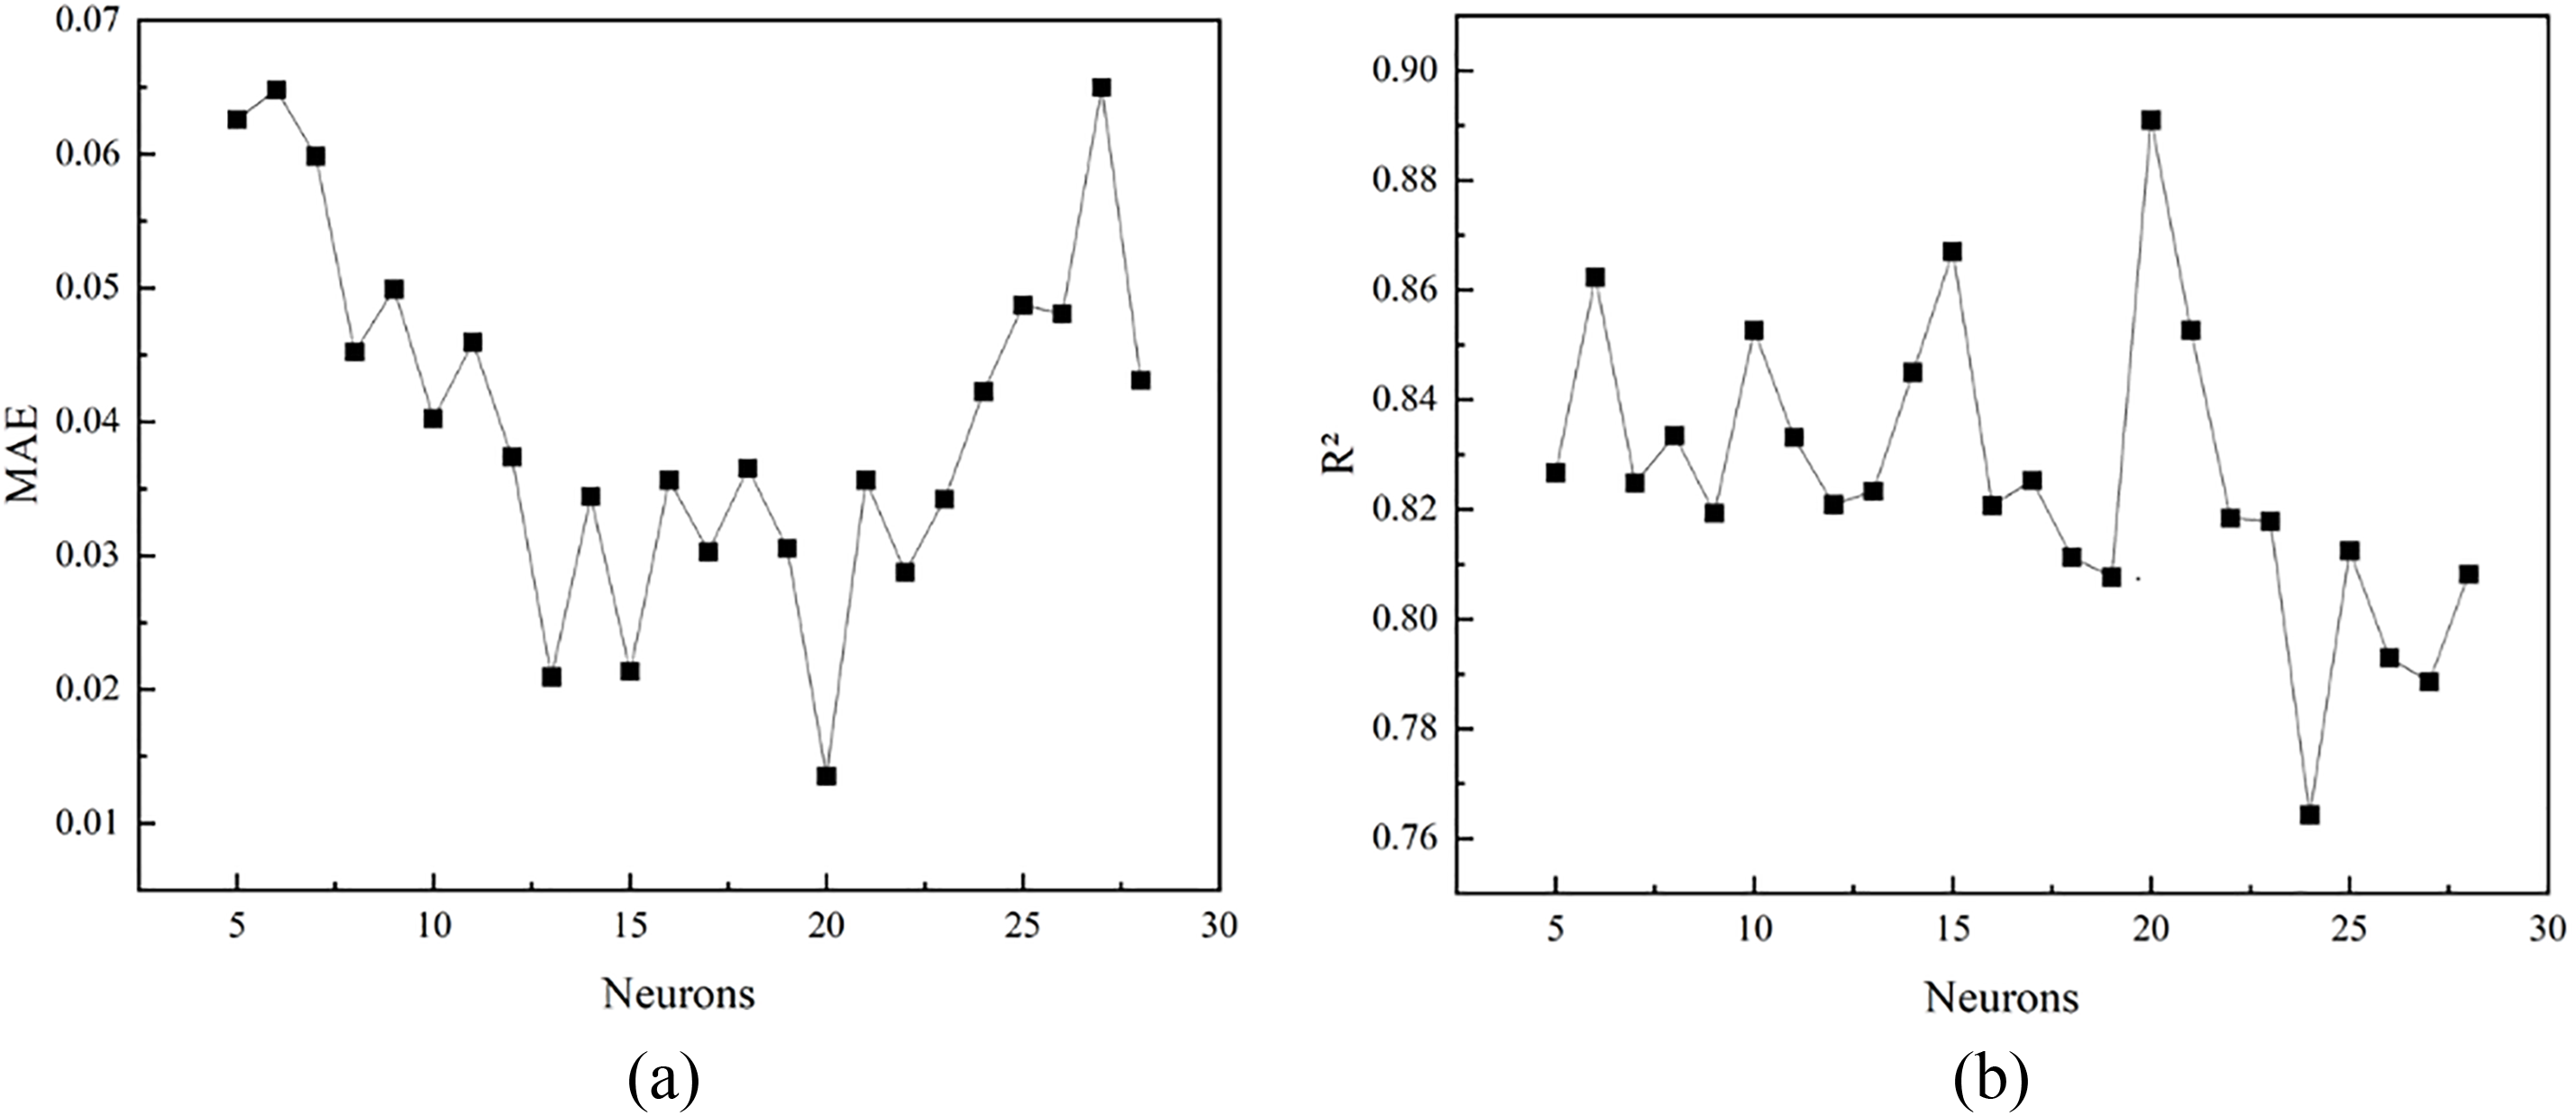
Figure 5: BPNN model with different numbers of hidden layer neuron nodes: (a) MAE, (b) R2
Studies have shown a relationship between the neuron numbers in the hidden layers and the accuracy of the BPNN. Reducing the number of neurons typically lowers accuracy and can cause training issues, while increasing the number of neurons generally improves the network’s performance. However, this also results in a significant increase in time complexity [37–40]. It can be observed from Tables 3 and 4, and Fig. 5 that as the node numbers increase, the average absolute error of the BPNN exhibits fluctuations, initially decreasing and then increasing. The model achieves its lowest average absolute error and optimal prediction performance when the number of nodes is set to 20. In contrast, when the number of neuron nodes falls within the ranges of 5 to 10 and 25 to 30, the average absolute error is elevated due to either an insufficient or excessive number of nodes, resulting in underfitting or overfitting of the model. As the number of nodes continues to increase, the coefficient of determination for the BPNN fluctuates around 0.8, suggesting that the influence of the number of nodes on model performance is inconsistent. After reaching 20 nodes, the coefficient of determination decreases significantly, hitting its lowest point at 24 nodes, before experiencing a slight rebound. This fluctuation indicates that as the number of nodes increases, the model’s tendency toward underfitting or overfitting varies.
Studies have shown that reducing the hidden layer numbers in a neural network directly affects its accuracy. For complex problems, having fewer hidden layers may result in inadequate training of the network. Conversely, when the hidden layer numbers exceed the optimal threshold, the time complexity increases significantly, often outweighing any gains in accuracy [41].
As illustrated in Tables 5 and 6, and Fig. 6, an increase in the hidden layer numbers in the BPNN correlates with a decrease in the MAE. This trend suggests that augmenting the hidden layer numbers can effectively reduce model error and enhance predictive performance. The mean absolute error reaches its minimum value of 0.0135 when the number of hidden layers is set to 7. However, when the hidden layer numbers are increased to 8, the mean absolute error experiences a slight increase, indicating that further augmentation may lead to slight overfitting or instability in training. Moreover, as the hidden layer numbers increase, the R2 for the BPNN exhibits fluctuations across different configurations, highlighting the significant impact of hidden layer count on model performance, albeit in a non-monotonic manner. The coefficient of determination reaches 0.8910 with 7 hidden layers, indicating this setup provides the best fit and strong predictive power. In contrast, when the hidden layers are set to 1, the coefficient of determination remains relatively high; however, it is reduced by 0.43% compared to the configuration with 7 layers, and the mean absolute error is higher.
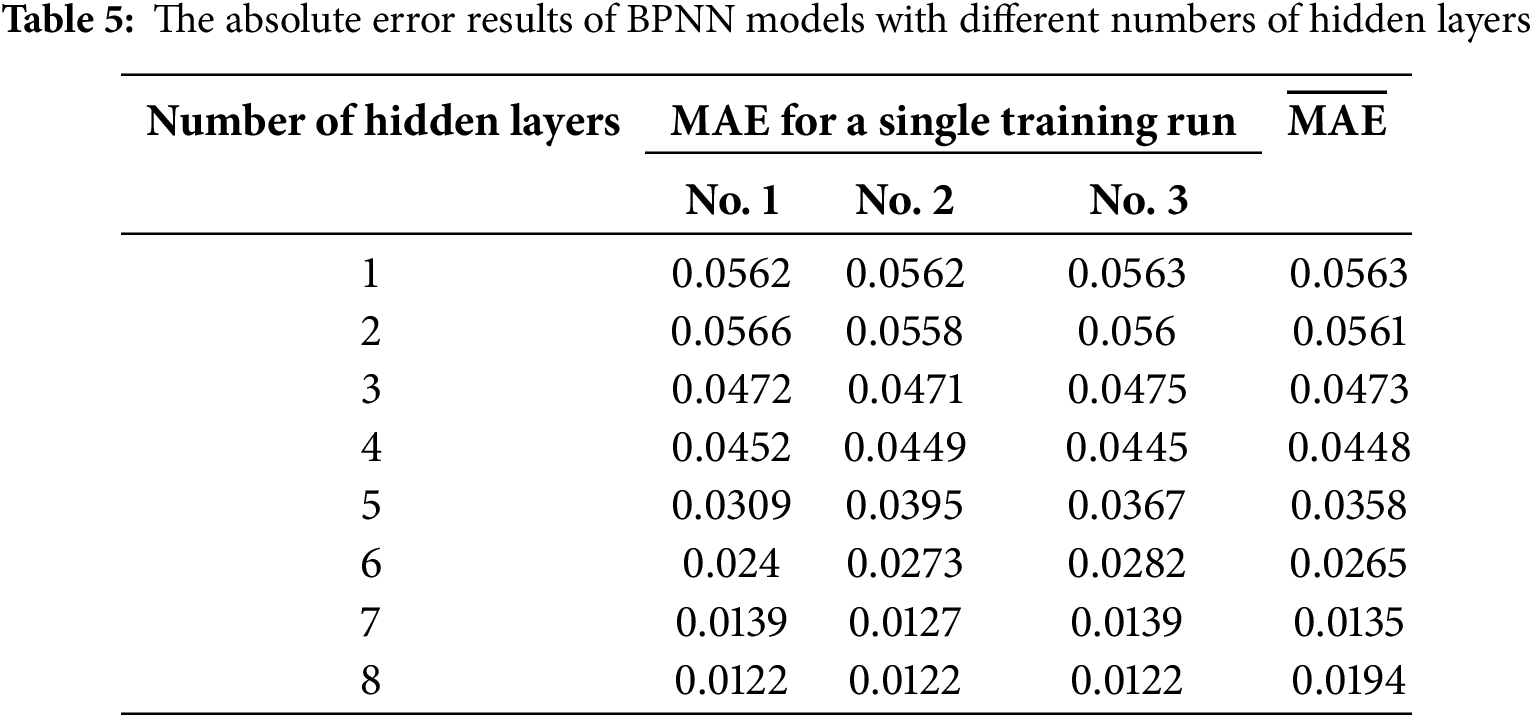
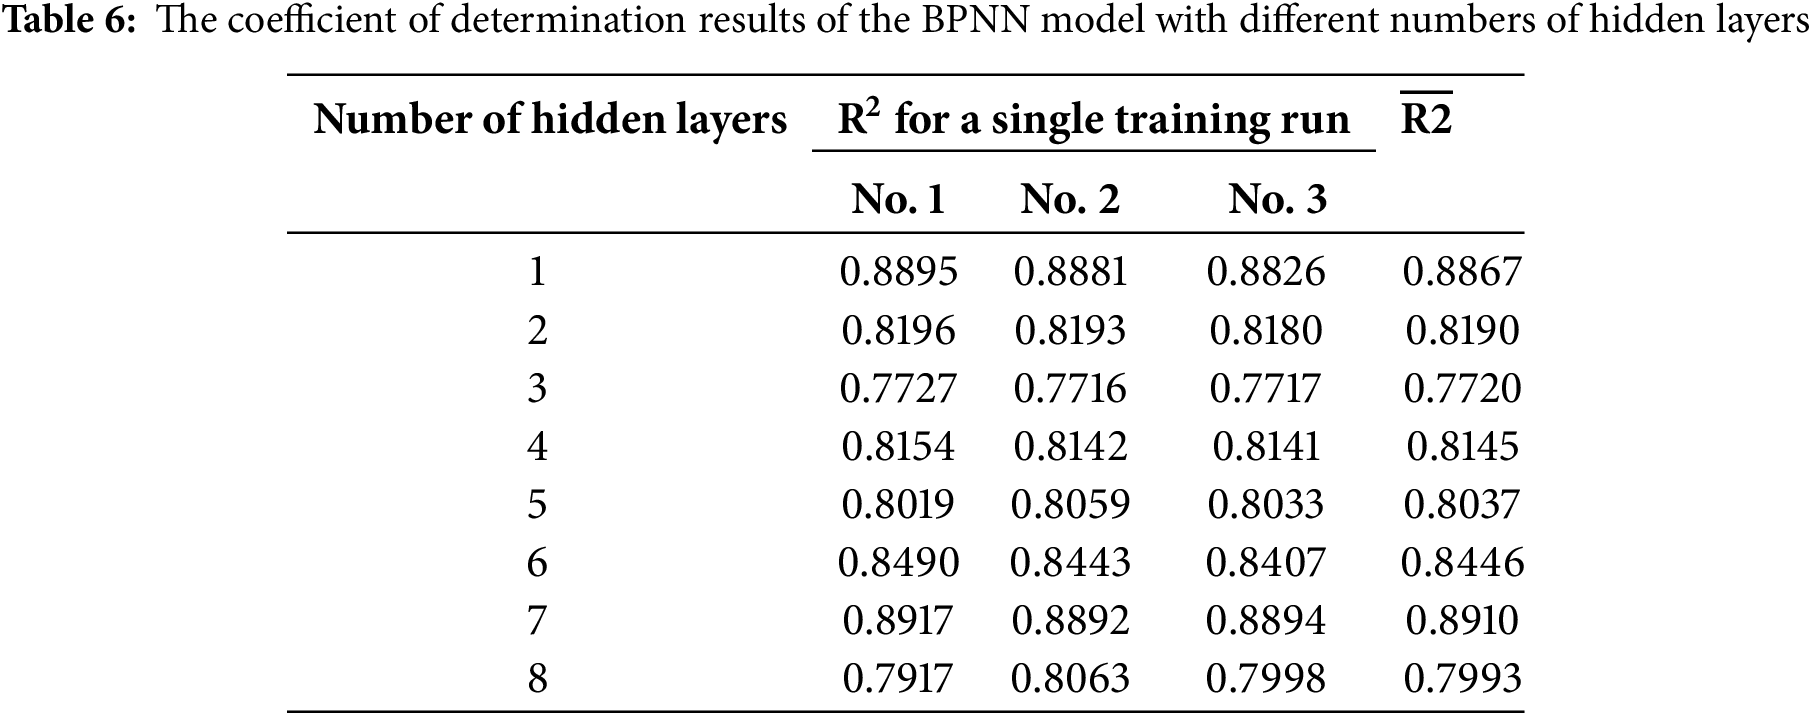
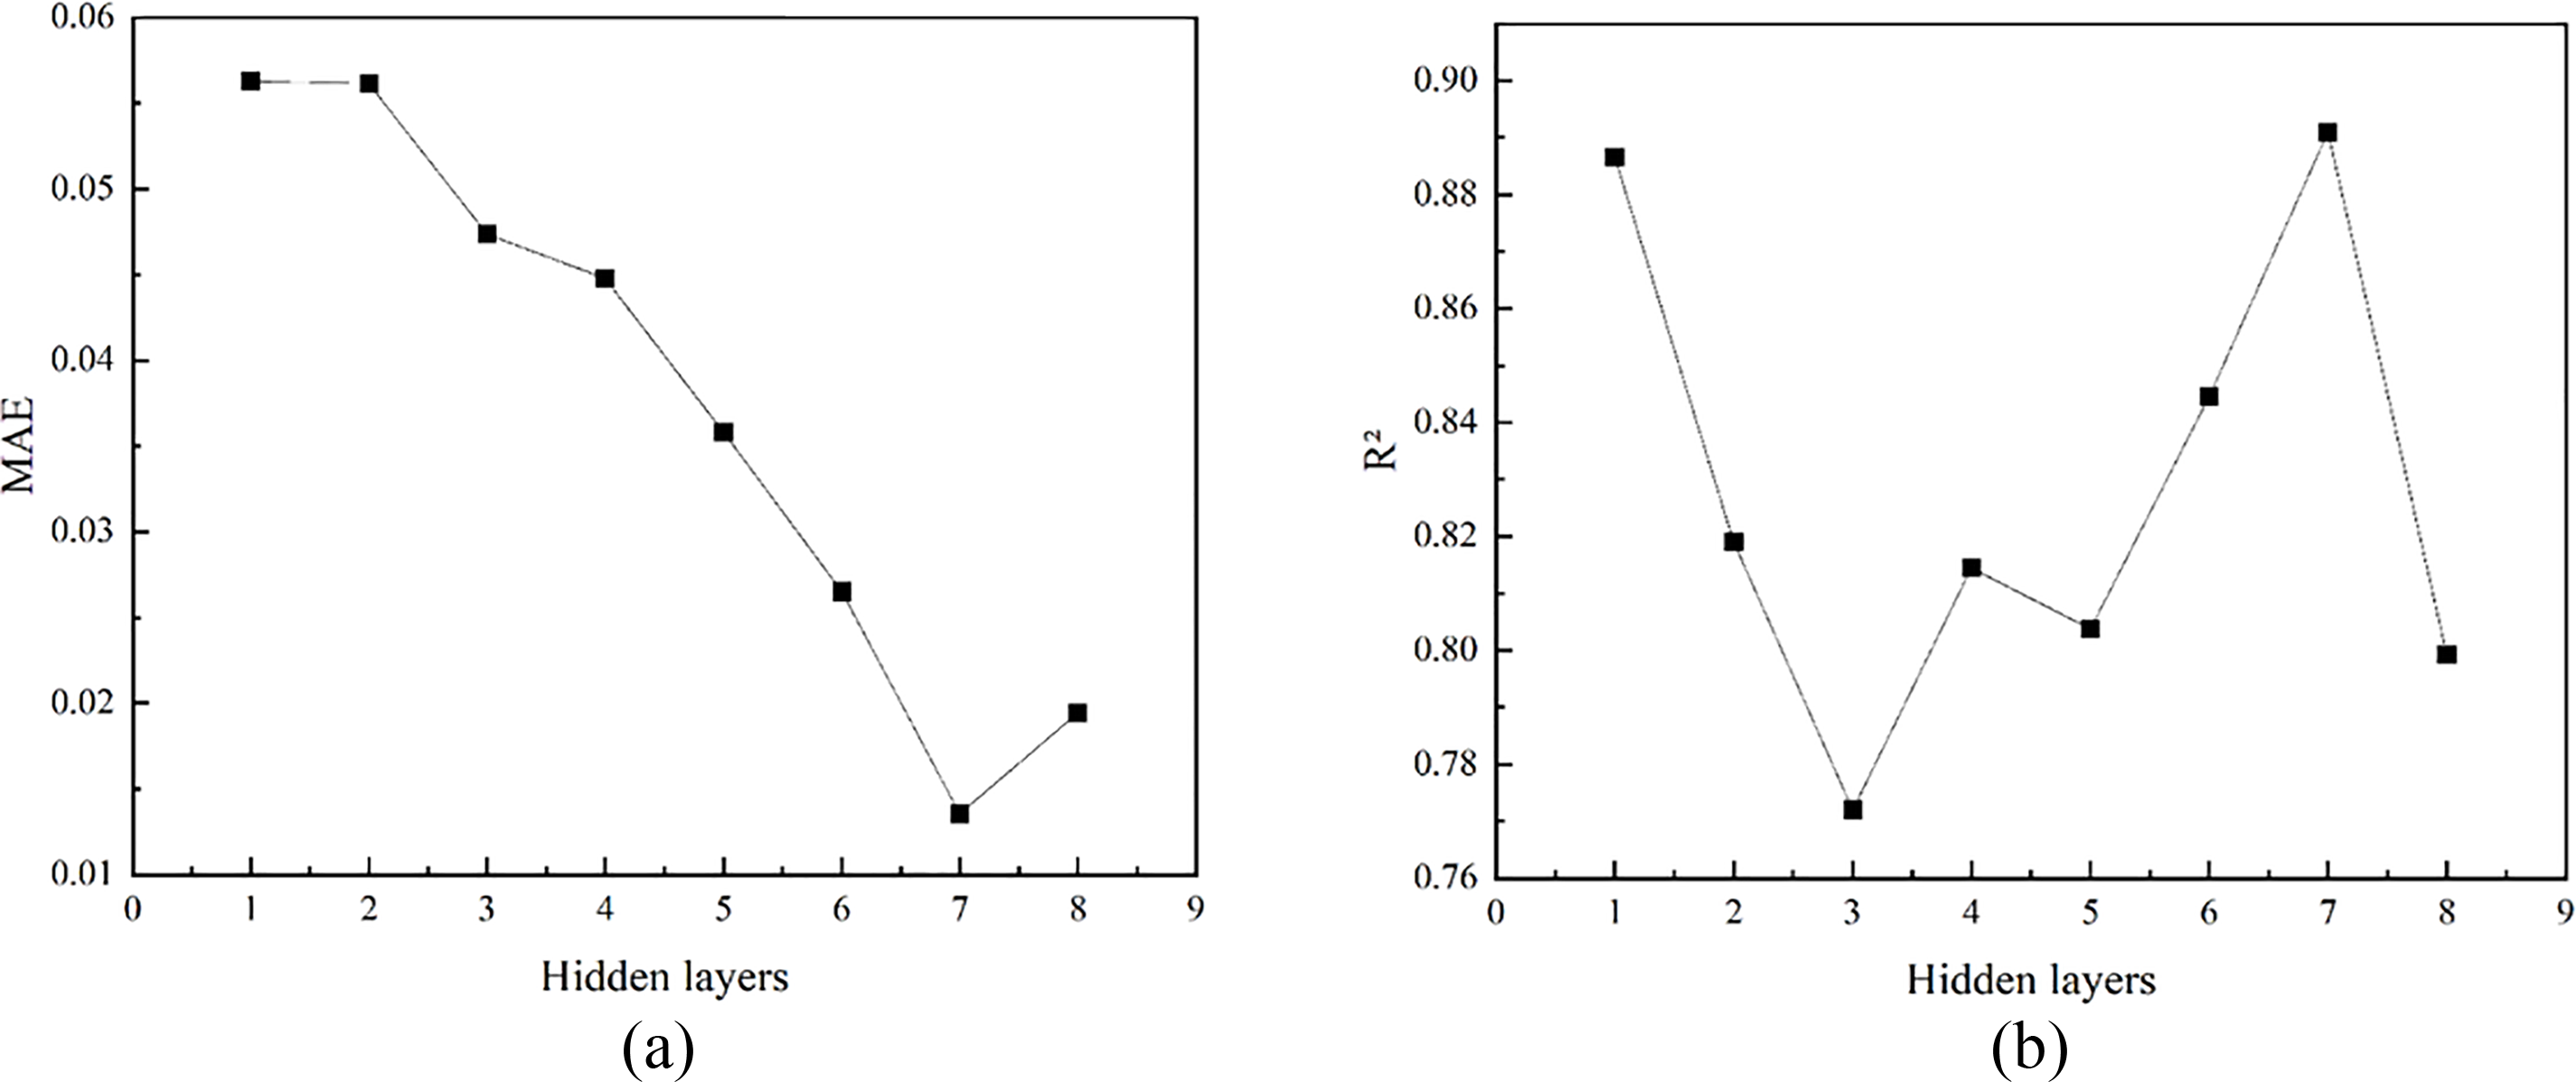
Figure 6: BPNN models with different numbers of hidden layers: (a) MAE, (b) R2
In summary, with 7 hidden layers, each containing 20 neurons, the model achieves the highest determination coefficient and the smallest absolute error. This configuration indicates optimal model performance, with an R2 of 0.8910, a MAE of 0.0135, and a RMSE of 0.0249.
Based on the outcomes of the hidden layer structure design, the “24-7(20)-1” BPNN model has been selected as the core model for forecasting the creep life. This model’s predictive performance has been confirmed through validation with a test set. Table 7 displays the prediction results for 55 test samples, while Table 8 presents an error analysis that compares the actual creep life with the predicted values from the model. The largest observed error is 9.41%, the smallest is 0.03%, and the average error is 4.47%. Fig. 7 shows a comparison between the predicted and expected creep life values, illustrating that the model’s predictions closely match the actual data.
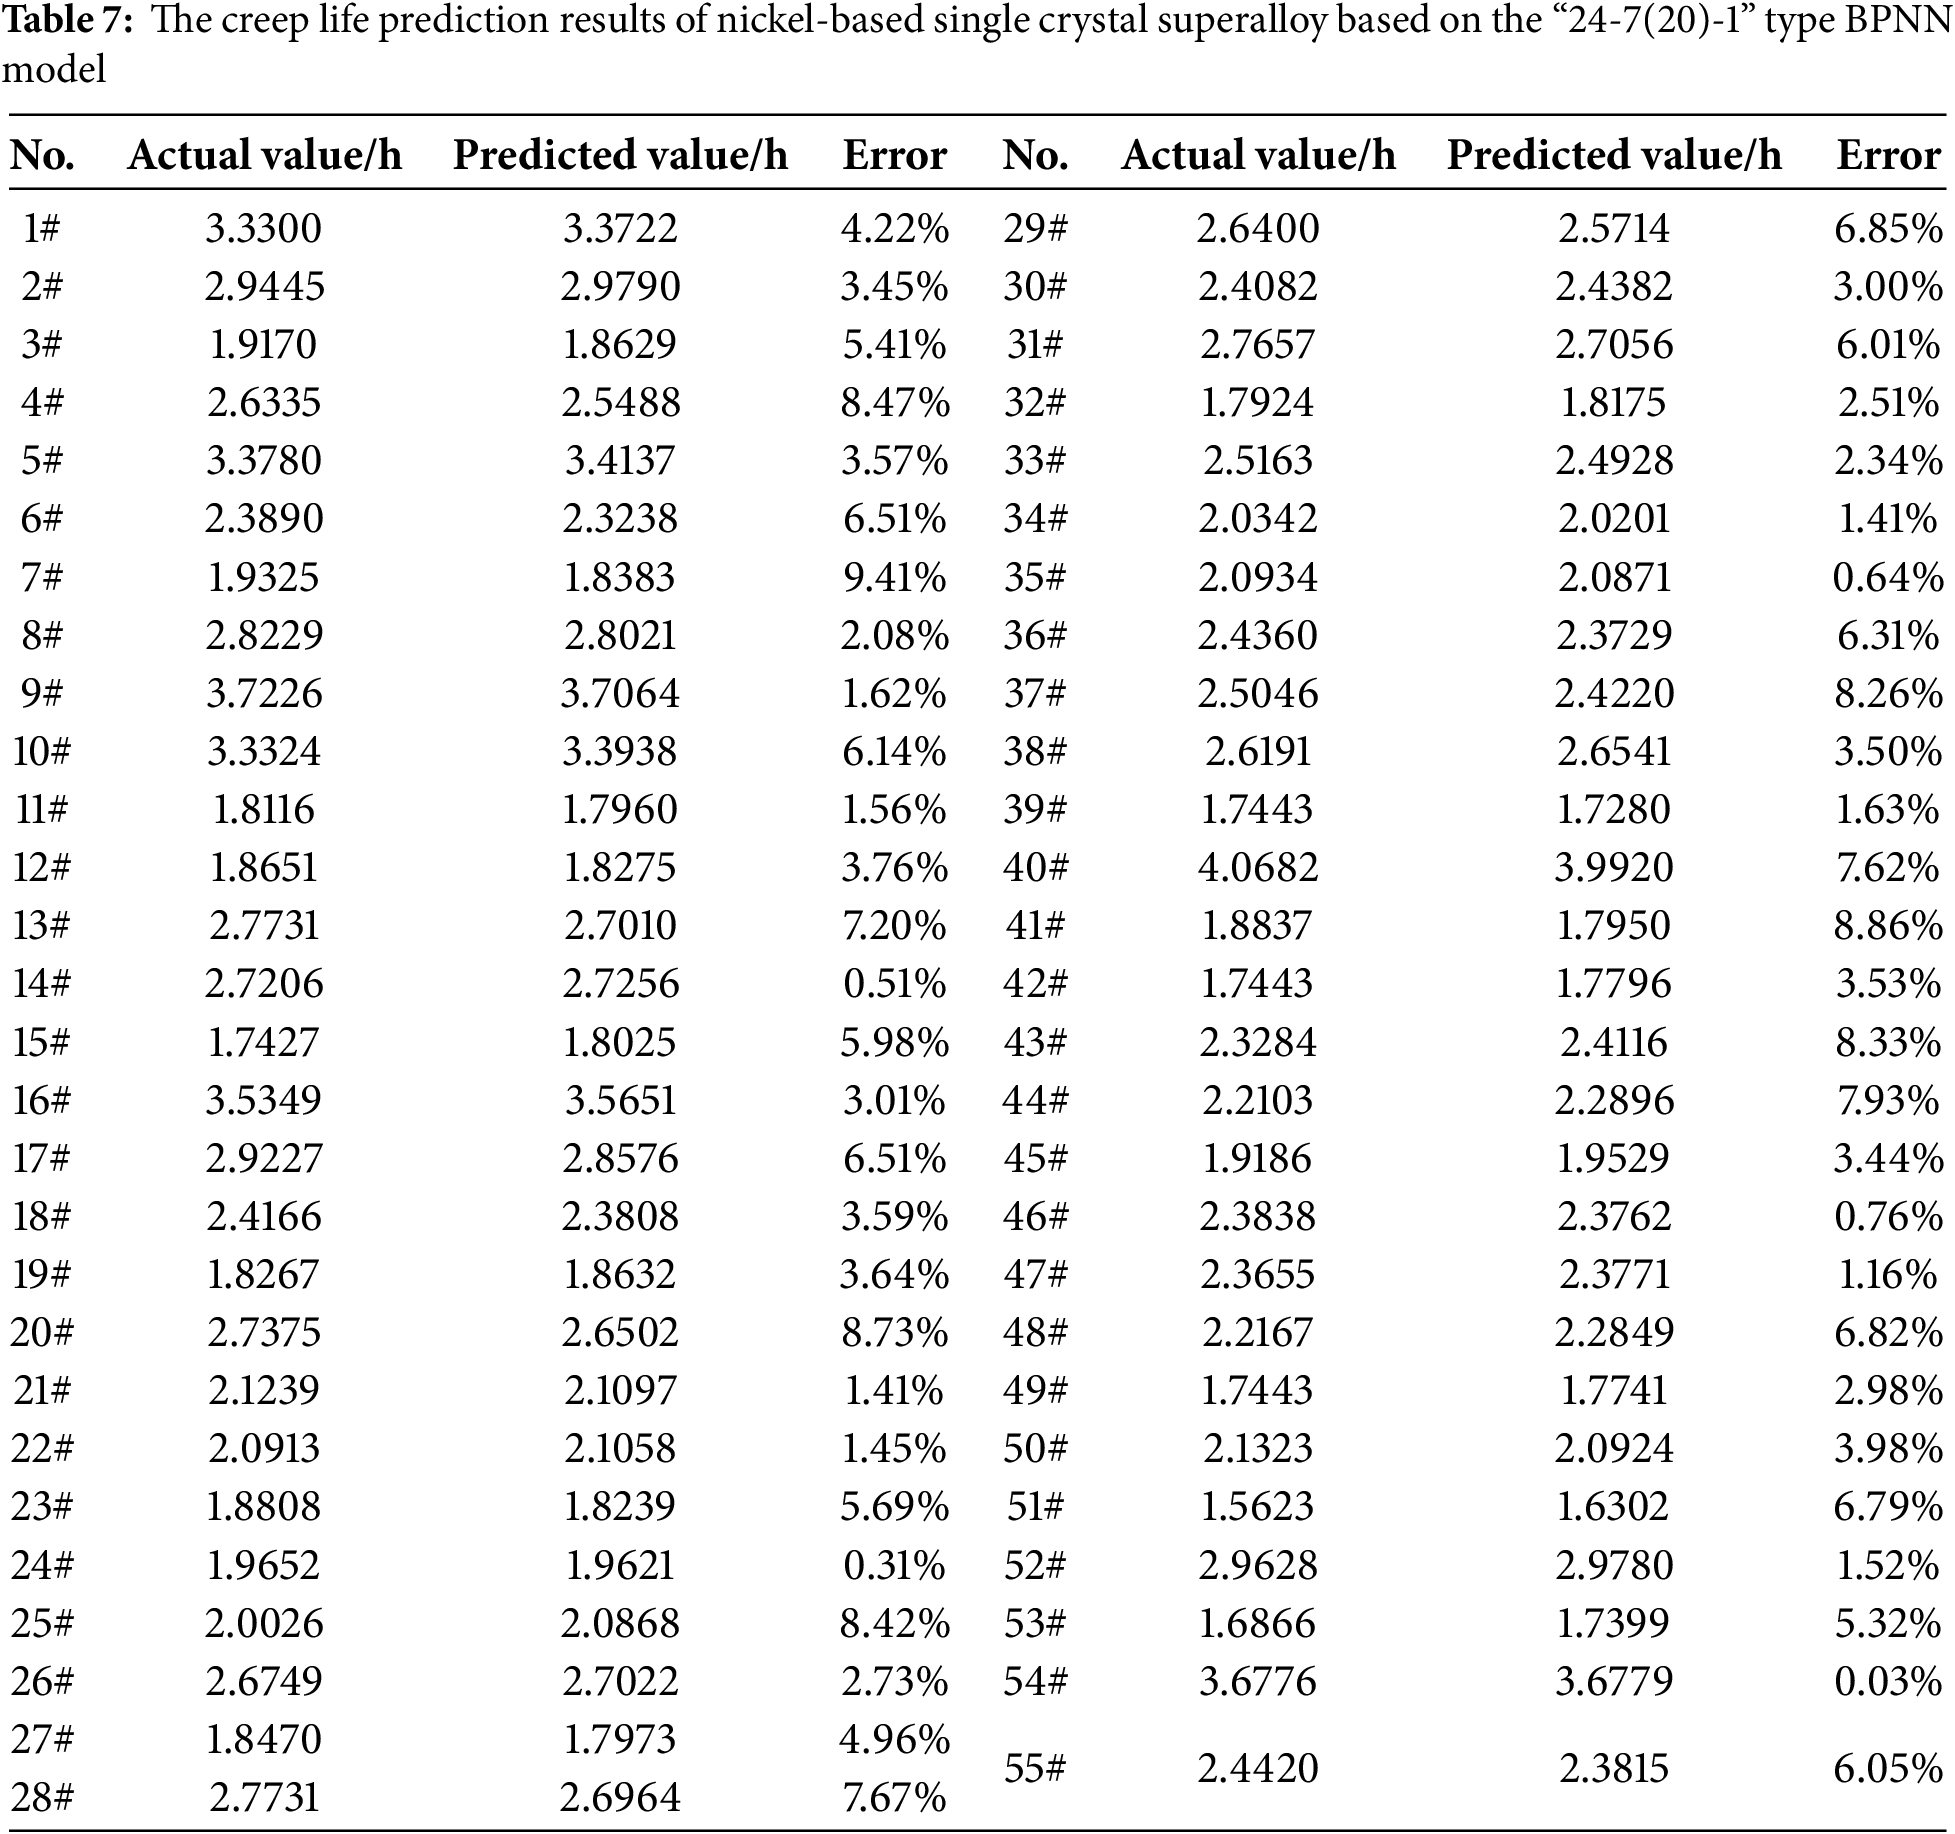
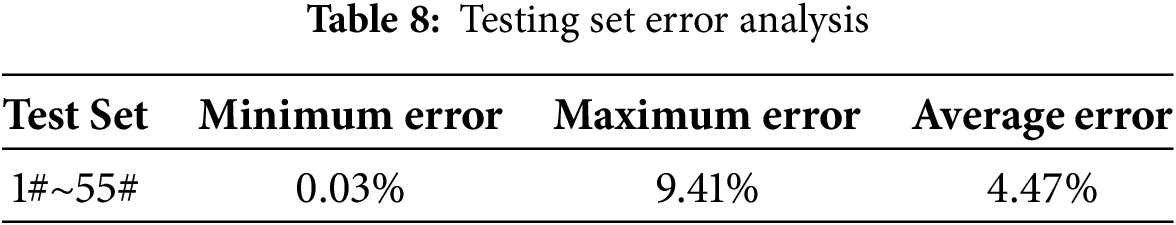
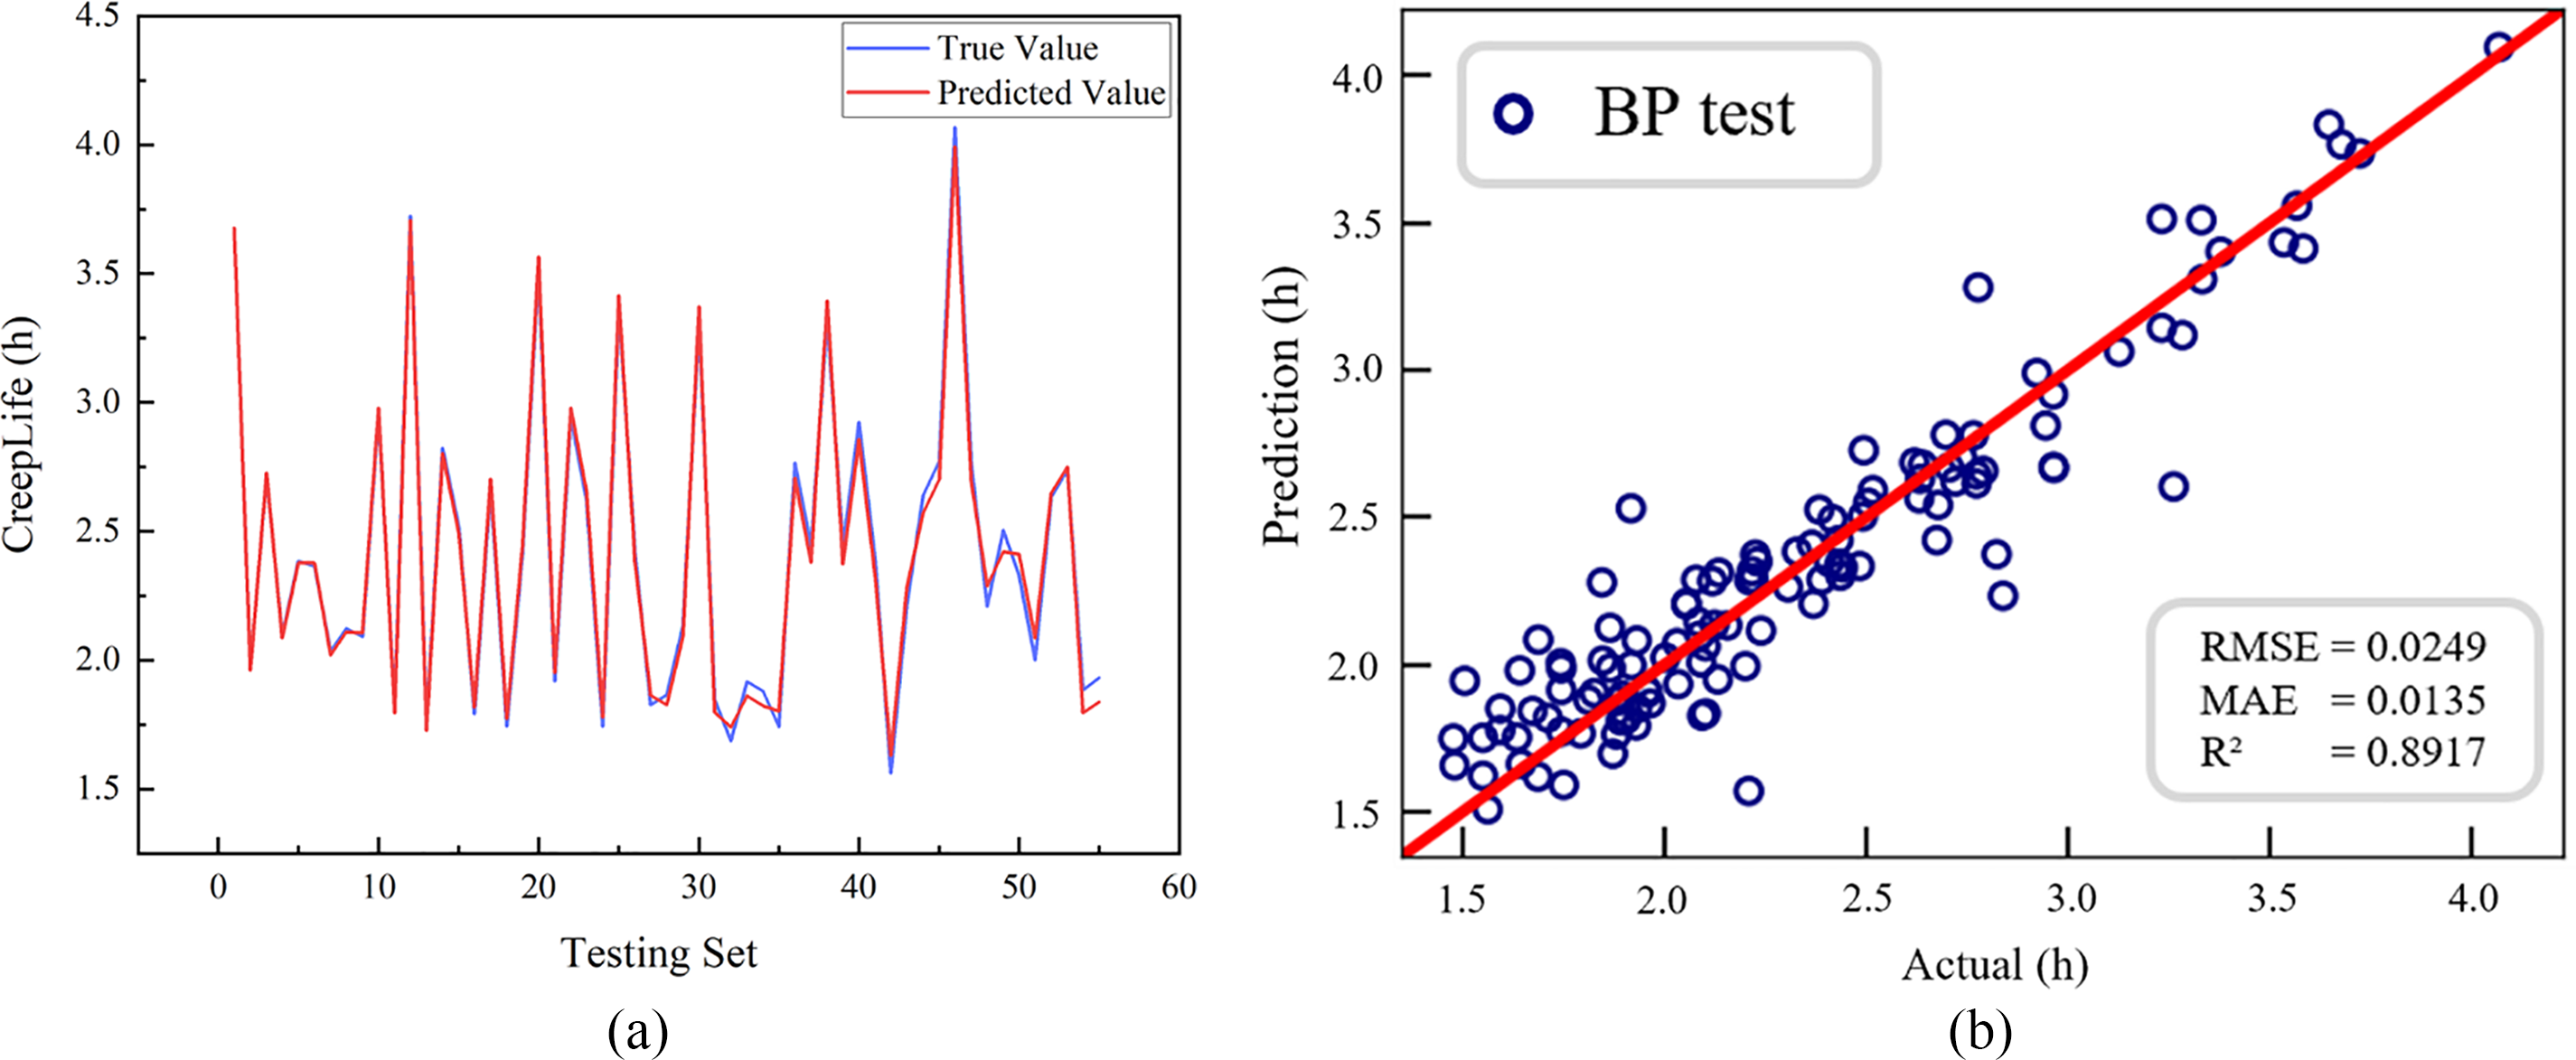
Figure 7: “24-7(20)-1” type BPNN model. (a) Comparison between predicted and true value; (b) Evaluation parameters
Significant prediction errors (e.g., samples 7#, 20#, 43#) were traced to material-specific anomalies: Sample 7# (Error: 9.41%): Contains 0.018 wt.% B (top 2% of dataset). Excess B induces grain boundary embrittlement [42], accelerating creep fracture beyond model prediction. Sample 20# (Error: 8.73%): γ′ volume fraction (68.5%) nears a critical threshold (~70%). Near this value, the dominant deformation mechanism shifts from dislocation bypassing (Orowan) to cutting [43], introducing nonlinearity unlearned by the model. Sample 43# (Error: 8.33%): Exceptionally low stacking fault energy (SFE = 45 mJ/m2 vs. avg. 80 ± 15 mJ/m2). Low SFE inhibits cross-slip [44], altering creep behavior. These cases highlight model limitations at material criticality thresholds, guiding future data augmentation for such scenarios.
3.3 Comparison of Different Models
Using 550 sets of creep life data from nickel-based single crystal high-temperature alloys, five distinct algorithms were utilized to construct predictive models for creep life estimation. The prediction accuracy of each model is illustrated in Fig. 8. As shown in Fig. 8, the R2 value of the CatBoost algorithm reached 0.8750, the highest among the five traditional algorithms, while its RMSE was the lowest. This indicates that the CatBoost algorithm exhibits the best fitting performance and the highest prediction accuracy. This superior performance can be attributed to CatBoost’s effective handling of categorical features through techniques such as ranking learning and goal-oriented coding. Additionally, it prevents overfitting, enhances model performance, and demonstrates robustness in addressing issues like class imbalance and data noise, resulting in more stable model performance.
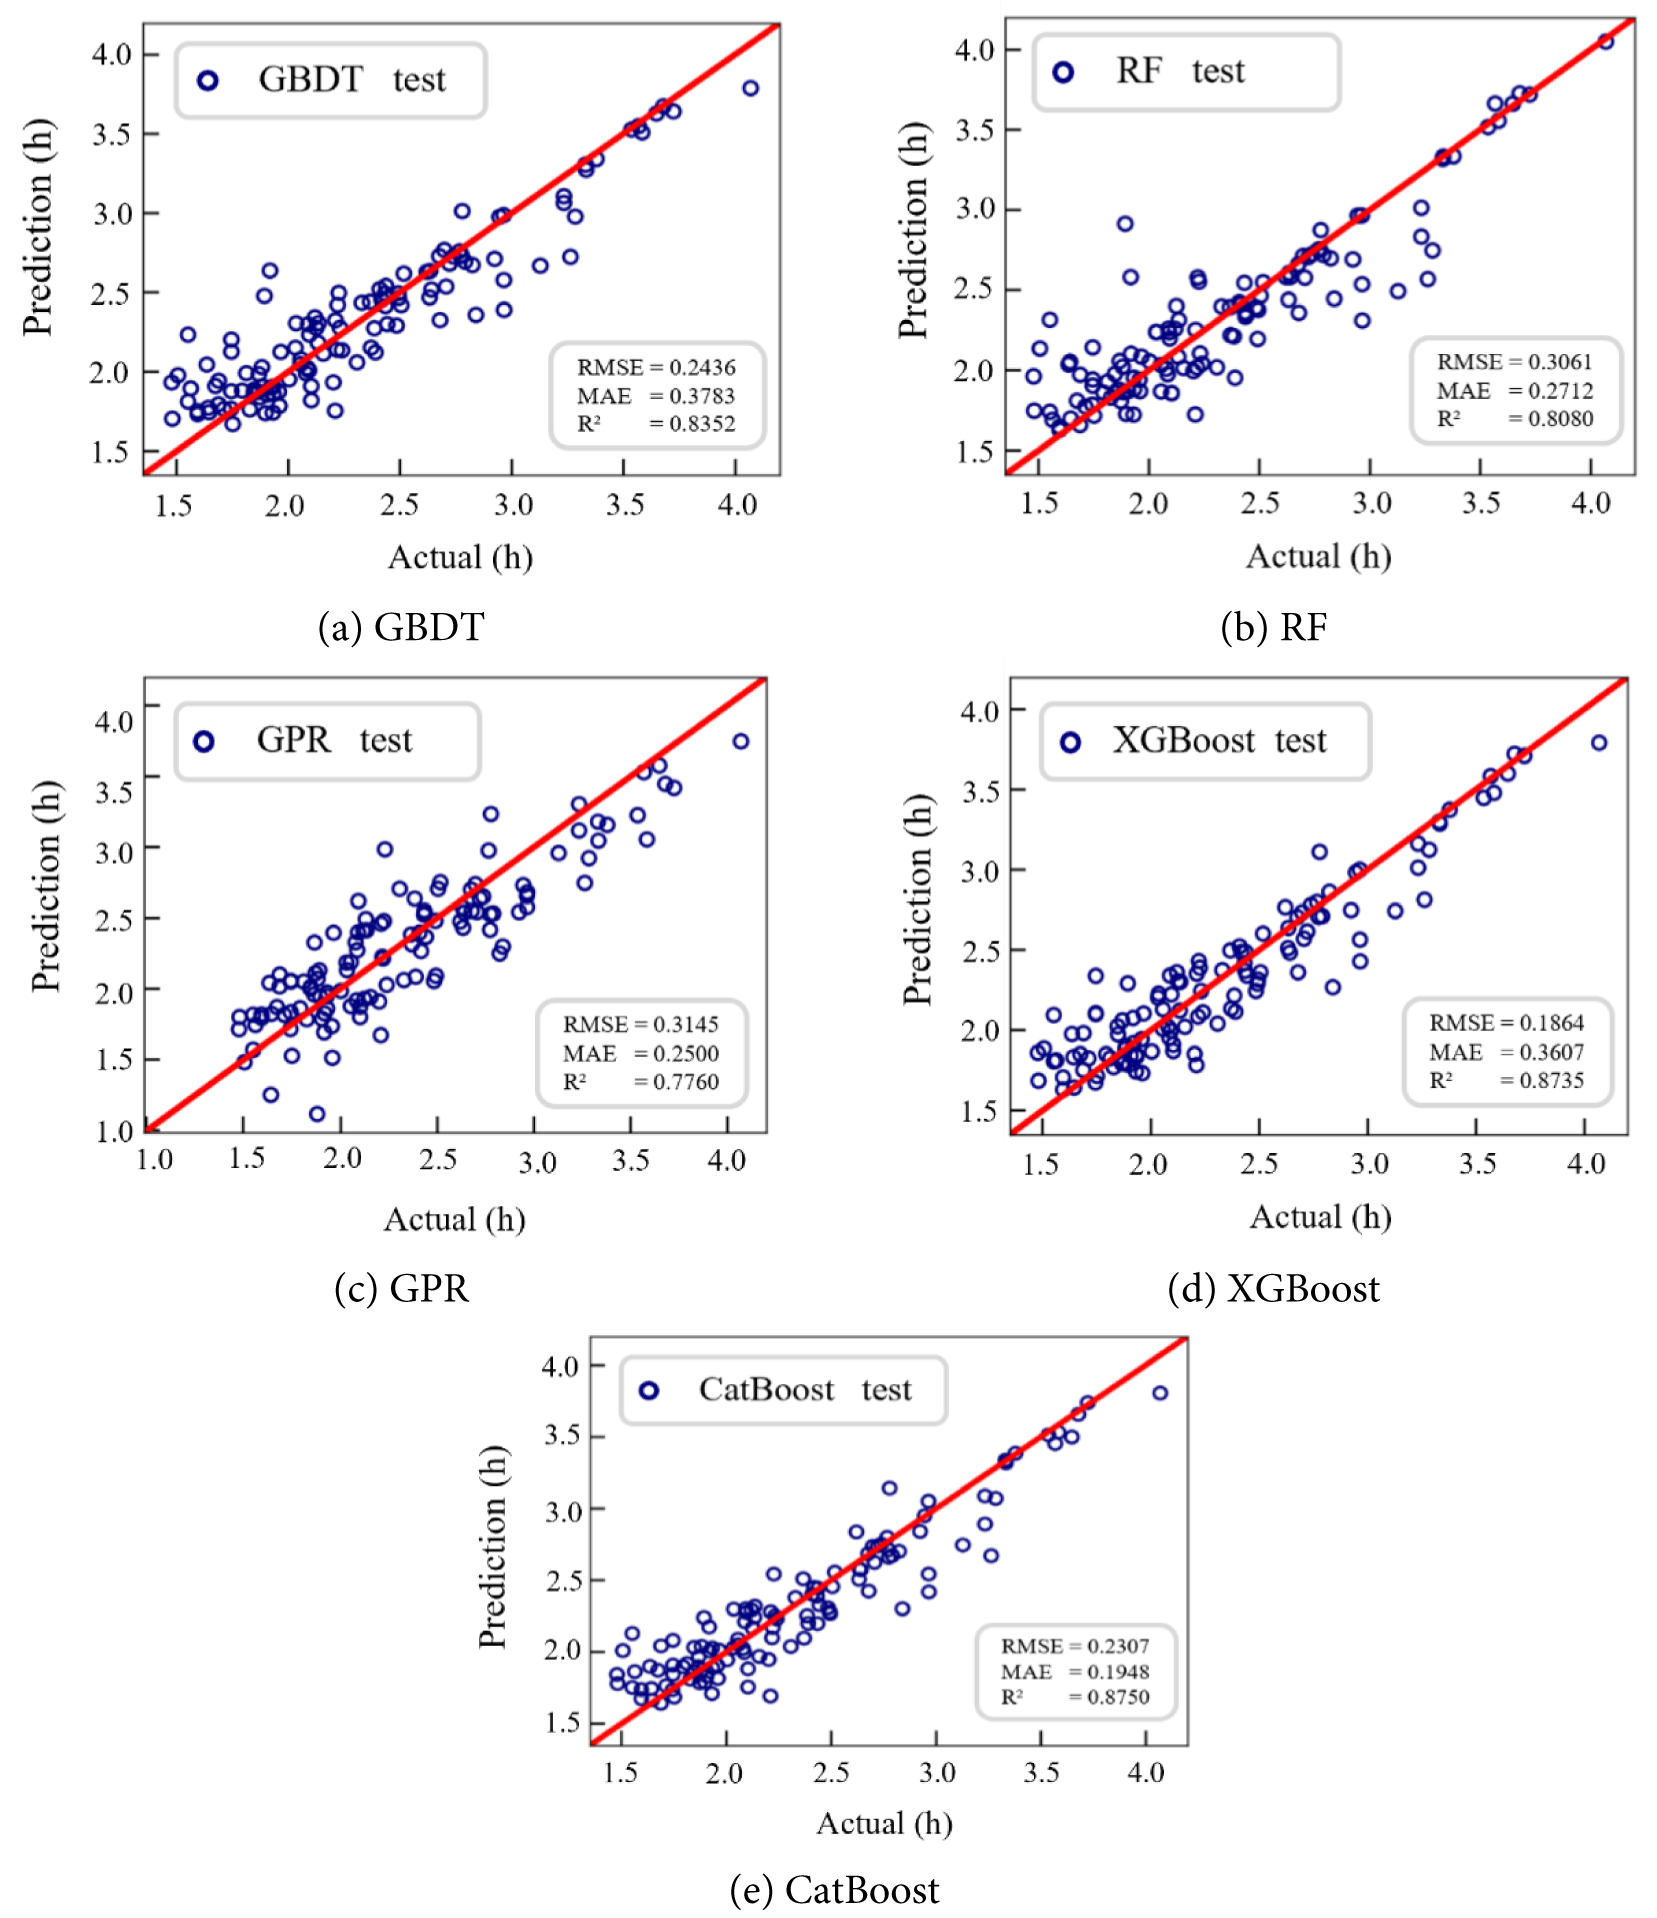
Figure 8: Prediction accuracy of various machine learning models on the test set
Through experimentation, the five traditional machine learning models, along with the BPNN model, attained their respective optimal evaluation indices under the ideal parameters listed in Table 2. Fig. 9 presents a comparison of the optimal evaluation indicators for all models. The BPNN prediction model demonstrates the highest R2, reaching 0.8910, which is 1.79% greater than that of the suboptimal CatBoost prediction model. Additionally, the MAE is reduced by 93.07%, and the RMSE is decreased by 88.13%.
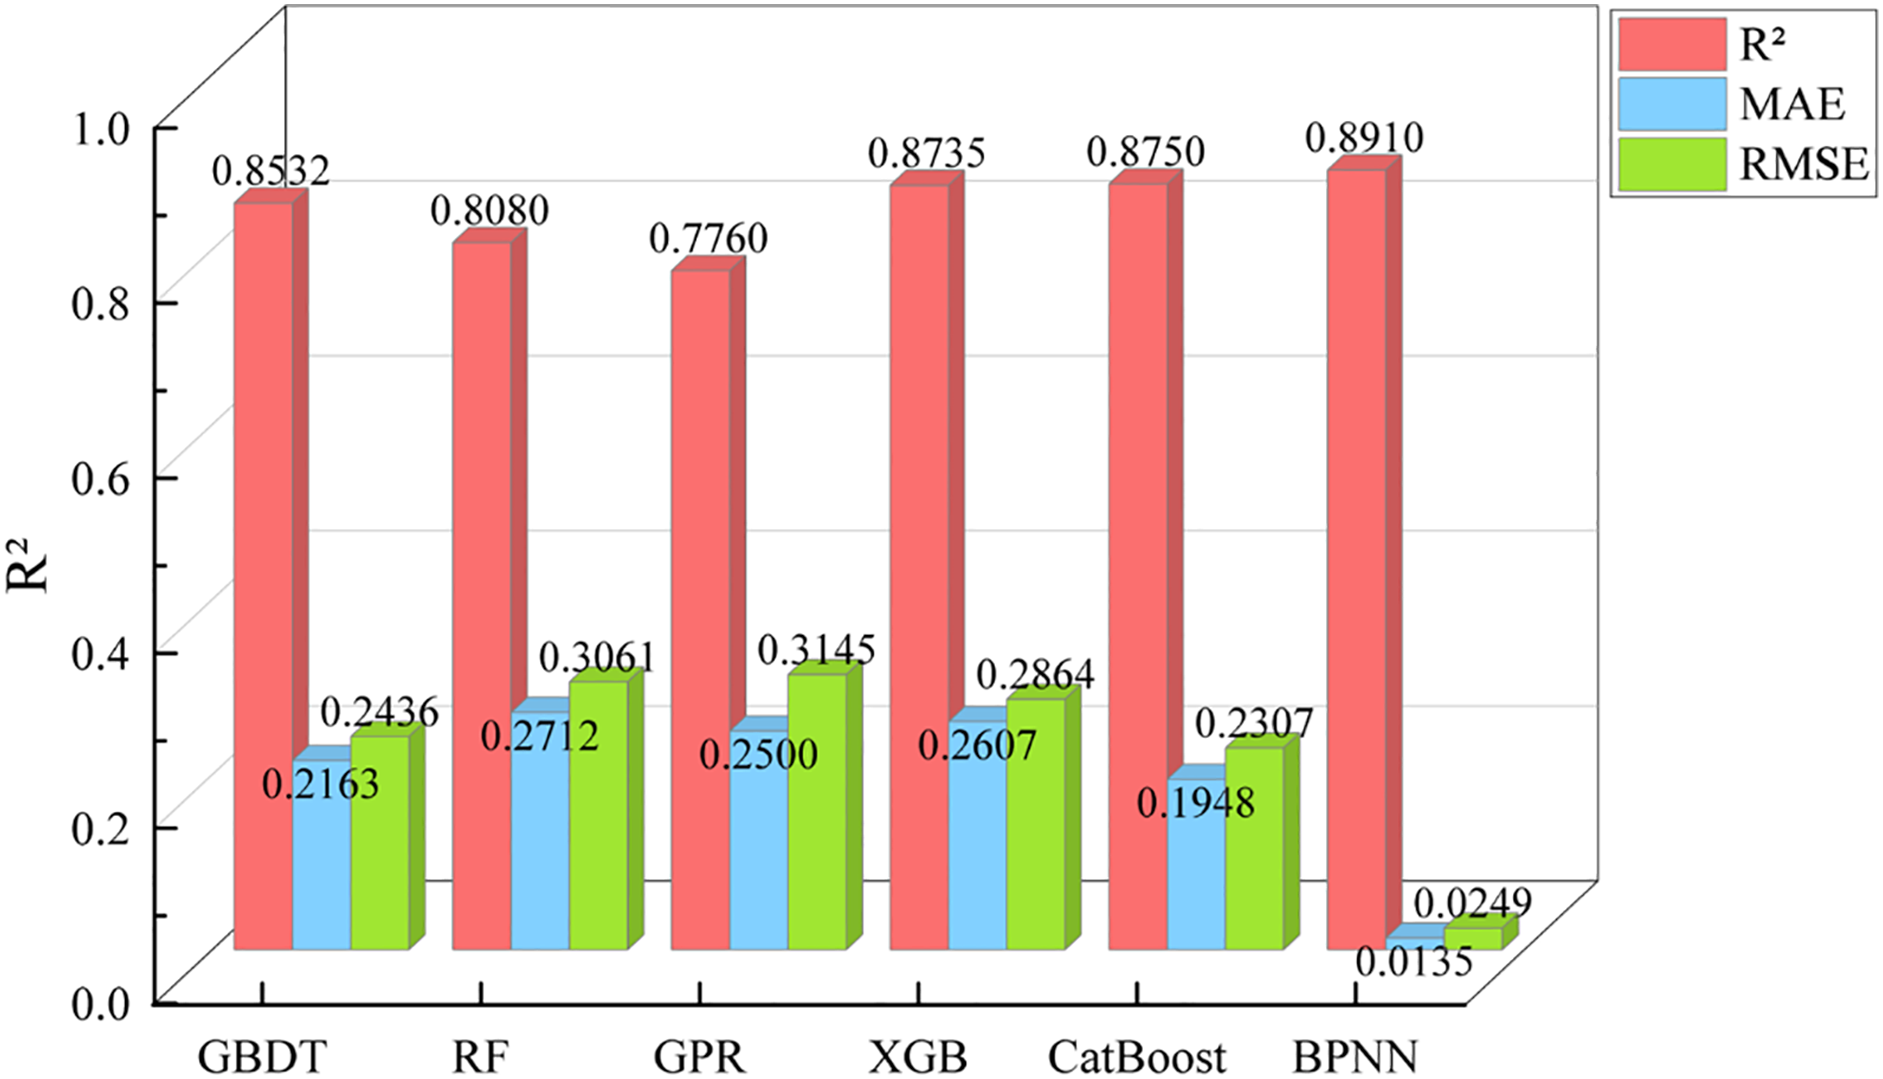
Figure 9: Prediction accuracy of various machine learning models on the test set
The advantages of the BPNN over other models are as follows: First, the BPNN possesses robust nonlinear mapping capabilities, enabling it to accurately model nonlinear input-output relationships by adjusting weights. This characteristic makes it particularly suitable for datasets lacking clear mathematical equations, as demonstrated in this study. Second, the BPNN exhibits exceptional generalization ability, allowing the trained model to accurately map newly input data. Third, the BPNN exhibits strong fault tolerance, allowing for a certain level of data error without significantly affecting the model’s overall performance. In summary, this study explored the hidden layer structure of the BPNN, leading to an improvement in the accuracy of the creep life prediction model for nickel-based single-crystal high-temperature alloys and a reduction in the associated error.
This paper proposes a creep life prediction model based on the BPNN. By analyzing the hidden layer numbers and the neuron numbers within each layer, the proposed model demonstrates improved prediction accuracy and significantly reduced error when compared to five traditional models. This advancement offers a straightforward and practical approach for the future prediction of creep life.
(1) According to the neural network architecture with varying numbers of hidden layers and neurons, a creep life prediction model was developed. The BPNN model with the highest accuracy was ultimately identified as “24-7(20)-1”.
(2) As the number of hidden layers in the BPNN increases, the model’s accuracy tends to improve; however, this improvement is not linear throughout the learning process. Occasionally, a temporary stagnation occurs, known as the neurons’ numbers increase, the accuracy of the BPNN model generally exhibits a downward trend. Therefore, to achieve optimal accuracy in the BPNN model, both the hidden layer numbers and the neuron numbers within those layers are crucial factors in the construction of the neural network.
(3) The accuracies of the five traditional machine learning regression models of GBDT, RF, GPR, XGBoost, and CatBoost are 0.8532, 0.8080, 0.7760, 0.8735, and 0.8750, respectively. Due to its robust nonlinear mapping capabilities, the BPNN model can effectively fit nonlinear input-output relationships by adjusting weights. This makes it particularly suitable for datasets lacking clear equations in this study. Consequently BPNN model demonstrates superior accuracy and stability compared to the five traditional machine learning regression models. The “24-7(20)-1” BPNN model achieved the highest R2 of 0.8910, which is 1.82% greater than that of the second-best model, CatBoost regression. This model also recorded an MAE of 93.07% and an RMSE of 88.12%.
Acknowledgement: Not applicable.
Funding Statement: This research was funded by the National Natural Science Foundation of China (No. 12375305), Basic Research Projects of Higher Education Institutions in Liaoning Province (JYTZD20230004), and Future Industry Frontier Technology Project in Liaoning Province in 2025(2025JH2/101330141).
Author Contributions: The authors confirm contribution to the paper as follows: Conceptualization: Xiaoming Du, Xuguang Dong and Jide Liu; Methodology: Lijie Wang and Yao Lu; Formal analysis: Lijie Wang, Yao Lu and Xuguang Dong; Writing—reviewing and editing: Xiaoming Du, Lijie Wang and Yao Lu; Project administration: Du Xiaoming, Xuguang Dong and Jide Liu. All authors reviewed the results and approved the final version of the manuscript.
Availability of Data and Materials: The authors confirm that the data supporting the findings of this study are available within the article.
Ethics Approval: Not applicable.
Conflicts of Interest: The authors declare no conflicts of interest to report regarding the present study.
References
1. Shang Z, Niu H, Wei X, Song D, Zou J, Liu G, et al. Microstructure and tensile behavior of nickel-based single crystal superalloys with different Re contents. J Mater Res Technol. 2022;18(2):2458–69. doi:10.1016/j.jmrt.2022.03.149. [Google Scholar] [CrossRef]
2. Tian S, Su Y, Qian B, Yu X, Liang F, Li A. Creep behavior of a single crystal nickel-based superalloy containing 4.2% Re. Mater Des. 2012;37:236–42. doi:10.1016/j.matdes.2012.01.008. [Google Scholar] [CrossRef]
3. Wu X, Makineni SK, Liebscher CH, Dehm G, Rezaei Mianroodi J, Shanthraj P, et al. Unveiling the Re effect in Ni-based single crystal superalloys. Nat Commun. 2020;11(1):389. doi:10.1038/s41467-019-14062-9. [Google Scholar] [PubMed] [CrossRef]
4. Zhang W, Wang X, Chen H, Zhang T, Gong J. Evaluation of the effect of various prior creep-fatigue interaction damages on subsequent tensile and creep properties of 9%Cr steel. Int J Fatigue. 2019;125:440–53. doi:10.1016/j.ijfatigue.2019.04.018. [Google Scholar] [CrossRef]
5. Dang YY, Zhao XB, Yuan Y, Ying HF, Lu JT, Yang Z, et al. Predicting long-term creep-rupture property of inconel 740 and 740H. Mater High Temp. 2016;33(1):1–5. doi:10.1179/1878641315Y.0000000010. [Google Scholar] [CrossRef]
6. Bolton J. Reliable analysis and extrapolation of creep rupture data. Int J Press Vessel Pip. 2019;157(2):1–19. doi:10.1016/j.ijpvp.2017.08.001. [Google Scholar] [CrossRef]
7. Elton DC, Boukouvalas Z, Butrico MS, Fuge MD, Chung PW. Applying machine learning techniques to predict the properties of energetic materials. Sci Rep. 2018;8(1):9059. doi:10.1038/s41598-018-27344-x. [Google Scholar] [PubMed] [CrossRef]
8. Liu Y, Zhao T, Yang G, Ju W, Shi S. The onset temperature (Tg) of AsxSe1−x glasses transition prediction: a comparison of topological and regression analysis methods. Comput Mater Sci. 2017;140:315–21. doi:10.1016/j.commatsci.2017.09.008. [Google Scholar] [CrossRef]
9. Liu Y, Wu J, Yang G, Zhao T, Shi S. Predicting the onset temperature (Tg) of GexSe1−x glass transition: a feature selection based two-stage support vector regression method. Sci Bull. 2019;64(16):1195–203. doi:10.1016/j.scib.2019.06.026. [Google Scholar] [PubMed] [CrossRef]
10. Granda JM, Donina L, Dragone V, Long DL, Cronin L. Controlling an organic synthesis robot with machine learning to search for new reactivity. Nature. 2018;559(7714):377–81. doi:10.1038/s41586-018-0307-8. [Google Scholar] [PubMed] [CrossRef]
11. Snyder JC, Rupp M, Hansen K, Müller KR, Burke K. Finding density functionals with machine learning. Phys Rev Lett. 2012;108(25):253002. doi:10.1103/physrevlett.108.253002. [Google Scholar] [PubMed] [CrossRef]
12. Liu Y, Zhao T, Ju W, Shi S. Materials discovery and design using machine learning. J Mater. 2017;3(3):159–77. doi:10.1016/j.jmat.2017.08.002. [Google Scholar] [CrossRef]
13. Zou M, Li W, Li L, Zhao JC, Feng Q. Machine learning assisted design approach for developing γ′-strengthened co-Ni-base superalloys. In: Superalloys 2020: Proceedings of the 14th International Symposium on Superalloys. Cham, Switzerland: Springer International Publishing; 2020. p. 937–47. doi:10.1007/978-3-030-51834-9_92. [Google Scholar] [CrossRef]
14. Li X, Shan G, Zhang J, Shek CH. Accelerated design for magnetic high entropy alloys using data-driven multi-objective optimization. J Mater Chem C. 2022;10(45):17291–302. doi:10.1039/d2tc03922b. [Google Scholar] [CrossRef]
15. Li X, Shan GC, Zhao HB, Shi C. Domain knowledge aided machine learning method for properties prediction of soft magnetic metallic glasses. Trans Nonferrous Met Soc China. 2023;33(1):209–19. doi:10.1016/s1003-6326(22)66101-6. [Google Scholar] [CrossRef]
16. Wang Y, Lu M, Wang Z, Liu J, Xu L, Qin Z, et al. The learning of the precipitates morphological parameters from the composition of nickel-based superalloys. Mater Des. 2021;206(1):109747. doi:10.1016/j.matdes.2021.109747. [Google Scholar] [CrossRef]
17. Jiang X, Yin HQ, Zhang C, Zhang RJ, Zhang KQ, Deng ZH, et al. An materials informatics approach to Ni-based single crystal superalloys lattice misfit prediction. Comput Mater Sci. 2018;143(12):295–300. doi:10.1016/j.commatsci.2017.09.061. [Google Scholar] [CrossRef]
18. Zhou CL, Yuan RH, Liao WJ, Yuan TH, Fan JK, Tang B, et al. Creep rupture life predictions for Ni-based single crystal superalloys with automated machine learning. Rare Met. 2024;43(6):2884–90. doi:10.1007/s12598-023-02559-8. [Google Scholar] [CrossRef]
19. Venkatesh V, Rack HJ. A neural network approach to elevated temperature creep-fatigue life prediction. Int J Fatigue. 1999;21(3):225–34. doi:10.1016/S0142-1123(98)00071-1. [Google Scholar] [CrossRef]
20. Yoo YS, Jo CY, Jones CN. Compositional prediction of creep rupture life of single crystal Ni base superalloy by Bayesian neural network. Mater Sci Eng A. 2002;336(1–2):22–9. doi:10.1016/S0921-5093(01)01965-7. [Google Scholar] [CrossRef]
21. Islam N, Huang W, Zhuang HL. Machine learning for phase selection in multi-principal element alloys. Comput Mater Sci. 2018;150:230–5. doi:10.1016/j.commatsci.2018.04.003. [Google Scholar] [CrossRef]
22. Hou S, Sun M, Bai M, Lin D, Li Y, Liu W. A hybrid prediction frame for HEAs based on empirical knowledge and machine learning. Acta Mater. 2022;228:117742. doi:10.1016/j.actamat.2022.117742. [Google Scholar] [CrossRef]
23. Zhou Z, Zhou Y, He Q, Ding Z, Li F, Yang Y. Machine learning guided appraisal and exploration of phase design for high entropy alloys. npj Comput Mater. 2019;5(1):128. doi:10.1038/s41524-019-0265-1. [Google Scholar] [CrossRef]
24. Du XM, Lu Y, Liu JD. Research on prediction model of creep life of nickel-based single crystal superalloys based on machine learning. J Shenyang Ligong Univ. 2025;44(1):44–50. (In Chinese). [Google Scholar]
25. Varol Ozkavak H, Sofu MM, Duman B, Bacak S. Estimating surface roughness for different EDM processing parameters on Inconel 718 using GEP and ANN. CIRP J Manuf Sci Technol. 2021;33:306–14. doi:10.1016/j.cirpj.2021.04.007. [Google Scholar] [CrossRef]
26. Zhang Z, Jung C. GBDT-MO: gradient-boosted decision trees for multiple outputs. IEEE Trans Neural Netw Learn Syst. 2021;32(7):3156–67. doi:10.1109/TNNLS.2020.3009776. [Google Scholar] [PubMed] [CrossRef]
27. Probst P, Wright MN, Boulesteix AL. Hyperparameters and tuning strategies for random forest. WIREs Data Min Knowl Discov. 2019;9(3):e1301. doi:10.1002/widm.1301. [Google Scholar] [CrossRef]
28. Deringer VL, Bartók AP, Bernstein N, Wilkins DM, Ceriotti M, Csányi G. Gaussian process regression for materials and molecules. Chem Rev. 2021;121(16):10073–141. doi:10.1021/acs.chemrev.1c00022. [Google Scholar] [PubMed] [CrossRef]
29. Li ZS, Liu ZG. Feature selection algorithm based on XGBoost. J Commun. 2019;40(10):101–8. [Google Scholar]
30. Prokhorenkova L, Gusev G, Vorobev A, Dorogush AV, Gulin A. CatBoost: unbiased boosting with categorical features. Adv Neural Inf Process Syst. 2018;31:6638–48. [Google Scholar]
31. Lv S. Research on hot deformation behavior and microstructure-properties control of GH4151 alloy [dissertation]. Beijing, China: University of Science and Technology Beijing; 2021. [Google Scholar]
32. Yuan C, Guo J, Wang S, Yang H. High temperature creep and fracture behavior of a directionally solidified Ni-base superalloy. J Mater Sci Technol. 1998;14(3):219–25. doi:10.1016/s1359-6462(98)00255-3. [Google Scholar] [CrossRef]
33. Murakumo T, Kobayashi T, Koizumi Y, Harada H. Creep behaviour of Ni-base single-crystal superalloys with various γ′ volume fraction. Acta Mater. 2004;52(12):3737–44. doi:10.1016/j.actamat.2004.04.028. [Google Scholar] [CrossRef]
34. Reed RC. Physical metallurgy of nickel and its alloys. In: The superalloys: fundamentals and applications. Cambridge, UK: Cambridge University Press; 2006. p. 17–76. [Google Scholar]
35. Ni C. First-principles study on the effect of alloying elements on the rafting behavior of γ′ phase in nickel-based single crystal superalloys [dissertation]. Yantai, China: Yantai University; 2023. doi:10.27437/d.cnki.gytdu.2023.000104. [Google Scholar] [CrossRef]
36. Caron P, Khan T. Evolution of Ni-based superalloys for single crystal gas turbine blade applications. Aerosp Sci Technol. 1999;3(8):513–23. doi:10.1016/S1270-9638(99)00108-X. [Google Scholar] [CrossRef]
37. Karsoliya S. Approximating number of hidden layer neurons in multiple hidden layer BPNN architecture. Int J Eng Trends Technol. 2012;3(6):714–7. [Google Scholar]
38. Uzair M, Jamil N. Effects of hidden layers on the efficiency of neural networks. In: 2020 IEEE 23rd International Multitopic Conference (INMIC); 2020 Nov 5–7; Bahawalpur, Pakistan. doi:10.1109/INMIC50486.2020.9318195. [Google Scholar] [CrossRef]
39. Sekeroglu B, Dimililer K. Review and analysis of hidden neuron number effect of shallow backpropagation neural networks. Neural Netw World. 2020;30(2):97–112. doi:10.14311/nnw.2020.30.008. [Google Scholar] [CrossRef]
40. Asthana S, Pandit A, Bhardwaj A. Analysis of multiple hidden layer vs. accuracy in performance using back propagation neural network. Indian J Sci Technol. 2017;10(4):1–4. doi:10.17485/ijst/2017/v10i4/110899. [Google Scholar] [CrossRef]
41. Deng T. Effect of the number of hidden layer neurons on the accuracy of the back propagation neural network. Highlights Sci Eng Technol. 2023;74:462–8. doi:10.54097/nbra6h45. [Google Scholar] [CrossRef]
42. Wang J, Enomoto M, Shang C. First-principles study on the P-induced embrittlement and de-embrittling effect of B and C in ferritic steels. Acta Mater. 2021;219(4):117260. doi:10.1016/j.actamat.2021.117260. [Google Scholar] [CrossRef]
43. Yin SP, Meng ZY, He JY, Li ZZ, Zhang F, Cheng XW. Effect of stacking fault energy on dynamic mechanical properties and deformation mechanisms of CrMnFeCoNi high-entropy alloy system. Acta Metall Sin. 2024;8:1–13. (In Chinese). doi:10.11900/0412.1961.2024.00133. [Google Scholar] [CrossRef]
44. Yang WC, Qu PF, Liu C, Cao KL, Qin JR, Su HJ, et al. Temperature dependence of compressive behavior and deformation microstructure in a low stacking-fault energy Ni-based single crystal superalloy. Trans Nonferrous Met Soc China. 2023;33(1):157–67. doi:10.1016/S1003-6326(22)66094-6. [Google Scholar] [CrossRef]
Cite This Article
 Copyright © 2025 The Author(s). Published by Tech Science Press.
This work is licensed under a Creative Commons Attribution 4.0 International License , which permits unrestricted use, distribution, and reproduction in any medium, provided the original work is properly cited.
 Downloads
 Citation Tools