
 Submit a Paper
 Propose a Special lssue
 Open Access
ARTICLE

Autonomous Cyber-Physical System for Anomaly Detection and Attack Prevention Using Transformer-Based Attention Generative Adversarial Residual Network
1 Self-Development Skills Department, Common First Year Deanship, King Saud University, Riyadh, 11362, Saudi Arabia
2 College of Computing and Informatics, Saudi Electronic University, Riyadh, 93499, Saudi Arabia
* Corresponding Author: Abrar M. Alajlan. Email:
Computers, Materials & Continua 2025, 85(3), 5237-5262. https://doi.org/10.32604/cmc.2025.066736
Received 16 April 2025; Accepted 14 August 2025; Issue published 23 October 2025
 View Full Text
 Download PDF
Abstract
Cyber-Physical Systems integrated with information technologies introduce vulnerabilities that extend beyond traditional cyber threats. Attackers can non-invasively manipulate sensors and spoof controllers, which in turn increases the autonomy of the system. Even though the focus on protecting against sensor attacks increases, there is still uncertainty about the optimal timing for attack detection. Existing systems often struggle to manage the trade-off between latency and false alarm rate, leading to inefficiencies in real-time anomaly detection. This paper presents a framework designed to monitor, predict, and control dynamic systems with a particular emphasis on detecting and adapting to changes, including anomalies such as “drift” and “attack”. The proposed algorithm integrates a Transformer-based Attention Generative Adversarial Residual model, which combines the strengths of generative adversarial networks, residual networks, and attention algorithms. The system operates in two phases: offline and online. During the offline phase, the proposed model is trained to learn complex patterns, enabling robust anomaly detection. The online phase applies a trained model, where the drift adapter adjusts the model to handle data changes, and the attack detector identifies deviations by comparing predicted and actual values. Based on the output of the attack detector, the controller makes decisions then the actuator executes suitable actions. Finally, the experimental findings show that the proposed model balances detection accuracy of 99.25%, precision of 98.84%, sensitivity of 99.10%, specificity of 98.81%, and an F1-score of 98.96%, thus provides an effective solution for dynamic and safety-critical environments.Keywords
The development of autonomous systems in vehicles has revolutionized transportation, making it more intelligent, safer, and efficient. Cyber-physical systems (CPS) play a challenging role by integrating computers, physical components, and communication networks [1]. Anomaly detection in Connected and Autonomous Vehicles (CAVs) is crucial for ensuring system integrity, reliability, and safety in complex cyber-physical environments. This integration assists the vehicles in performing advanced tasks such as automatic parking, adaptive vehicle control, and avoiding collisions. On the other hand, when these vehicles are interlinked, securing these systems from cyberattacks becomes a critical challenge [2]. The unpredictable real-world driving is handled by applying a secure and adaptive autonomous CPS in vehicles. As security and efficiency improve, these technologies also create some major risks, as hackers can target computer systems and networks to disrupt or take control of the vehicle [3].
Ensuring safety without affecting performance is the major complexity in developing secure CPS. Even a small delay or malfunction slows down the performance of a vehicle, and it also leads to severe accidents [4]. Therefore, when critical work is being done, the system must quickly identify and counter security risks. Different lightweight security approaches, including special encryption approaches and systems, are applied to detect intrusions quickly. Another critical aspect is that these secure systems must adapt and grow as technology changes [5]. New sensors and connectivity options are integrated with these advancements, and several security measures need to be maintained with these advancements. These systems assist in all types of vehicles, from cars to trucks, where the security solutions are flexible and effective for different types of vehicles and applications [6].
The critical problem is to develop a secure and adaptive autonomous CPS in vehicles that requires effective teamwork from specialists in diverse fields, including cybersecurity and car engineering. The application of deep learning plays an important role in developing a secure and adaptive autonomous CPS in vehicles [7]. Effective data processing is performed using deep neural networks, where data are collected from cameras, radar, and other sensors. As a result, objects such as road signs and pedestrians are effectively captured with higher accuracy. This enables the vehicles to achieve real-time decision-making and safe navigation in difficult conditions. In addition, deep learning models are utilized to predict the major hazards by analyzing patterns in traffic behavior [8].
Cybersecurity within the autonomous CPS is enhanced by deep learning, by detecting and resisting cyber risks. These systems have the capability of continuously learning from new attack patterns and provide effective protection against cyberattacks [9]. Additionally, deep learning is also utilized to optimize encryption techniques and access control systems. The communication between the external networks and the vehicle’s components is also ensured by the deep learning approaches. Autonomous CPS in vehicles attains higher reliability and adaptability in real-world applications by combining deep learning approaches into security and operational aspects [10].
CPS in autonomous vehicles and industrial control systems combines computational intelligence with physical processes. These systems completely depend on sensor data to drive major decisions, which are vulnerable to large different anomalies and cyber-attacks, resulting in catastrophic failures [11]. Several traditional anomaly detection approaches face a few major struggles, such as adaptability, and also face difficulties in coping with non-stationary environments, particularly when the data is distributed over time, and this is known as concept drift. In addition, some major attacks like data injection and signal spoofing often mimic normal behavior, rendering static models ineffective. Therefore, this paper aims to design an effective and adaptive anomaly detection model to address these limitations. The proposed Transformer-based Attention Generative Adversarial Residual Network (Trans-AGAResNet) is developed in this paper. The transformers, generative adversarial networks (GANs), residual learning, and attention mechanisms are integrated not only to enhance the detection accuracy but also to adapt to evolving system behavior. Overall, the developed model meets the emerging need for intelligent, real-time threat monitoring systems in dynamic and mission-critical CPS domains.
Real-Time Adaptive Attack Detection Module: A real-time adaptive attack detection system is developed by the proposed method, in which the delay and false alarm rate are evaluated in the current CPS state. Hence, the efficacy of attack detection is improved.
Integration of Transformer-Based Attention Generative Adversarial Residual (Trans-AGAResNet) Model: A novel Trans-AGAResNet model is developed by combining the Generative Adversarial Networks (GANs), Transformer module, Residual Networks (ResNets), and Attention Mechanisms. The robust anomaly detection is achieved by this integration.
Two-Phase System Operation for Enhanced Adaptability: The proposed framework operates in two different phases: the Offline phase for training purposes based on sensor data and the Online Phase for real-time deployment and operation. Therefore, the adaptability and effectiveness of a model are enhanced by this dual phase.
Dynamic Drift Adaptor for Handling Data Shifts: The use of Drift Adaptor is a major novelty of this paper. The drift adaptor adjusts the parameters of a model on the basis of shifts in the data distribution over time, thereby ensuring that the model remains accurate, though there is a change in system behaviour.
Robust Attack Detection with Minimal False Alarms: The predicted and observed sensor values are compared by the attack detection mechanism to detect the discrepancies that represent potential attacks. A balance between detection accuracy and system usability is achieved by fine-tuning the detection sensitivity.
The significant contributions of the work are described below.
Design of a Multi-Layer Drift Detection Mechanism: A novel multi-stage drift detection model comprising a drift adaptor and a drift analyzer is proposed. The drift adapter predicts the potential onset of abnormal sensor behavior based on the sensor change rate characteristics, while the drift analyzer ensures detection within a calculated safety deadline. The proposed system utilizes both maximum and minimum sensor value change rates to establish reliable bounds for anomaly detection.
Integration of Trans-AGAResNet Model: In this paper, a Transformer-based Attention Generative Adversarial Residual (Trans-AGAResNet) Model is developed by integrating the Generative Adversarial Networks (GANs), Residual Networks (ResNets), transformer module, and Attention Mechanisms. This integration effectively improves the enhanced anomaly detection process.
Dual Detection Operation for Dynamic Adaptation: A two-phase operation model that comprises two major phases, the offline phase for training the proposed Trans-AGAResNet model by applying the historical sensor data, and the online phase is crucial to attain efficient real-time anomaly detection, and the reliability of a system is ensured.
Integration of the Drift Adaptor: A novel Drift Adaptor is employed that adjusts the parameter of a model, ensuring that predictions are accurate even though there is a change in system behavior.
Real-Time Attack Detection with Minimal False Alarms: The predicted and actual sensor values are compared to achieve an effective balance of detection accuracy and false alarm rates, ensuring that attack detection is both reliable and non-intrusive.
The remaining sections are structured as follows: The existing studies related to this work are reviewed in Section 2, Section 3 provides the system design, Section 4 derives the problem formulation and objective function, Section 5 describes the proposed methodology, the experimental analysis carried out, and the results are shown in Section 6. Finally, Section 7 concludes the paper with future scope.
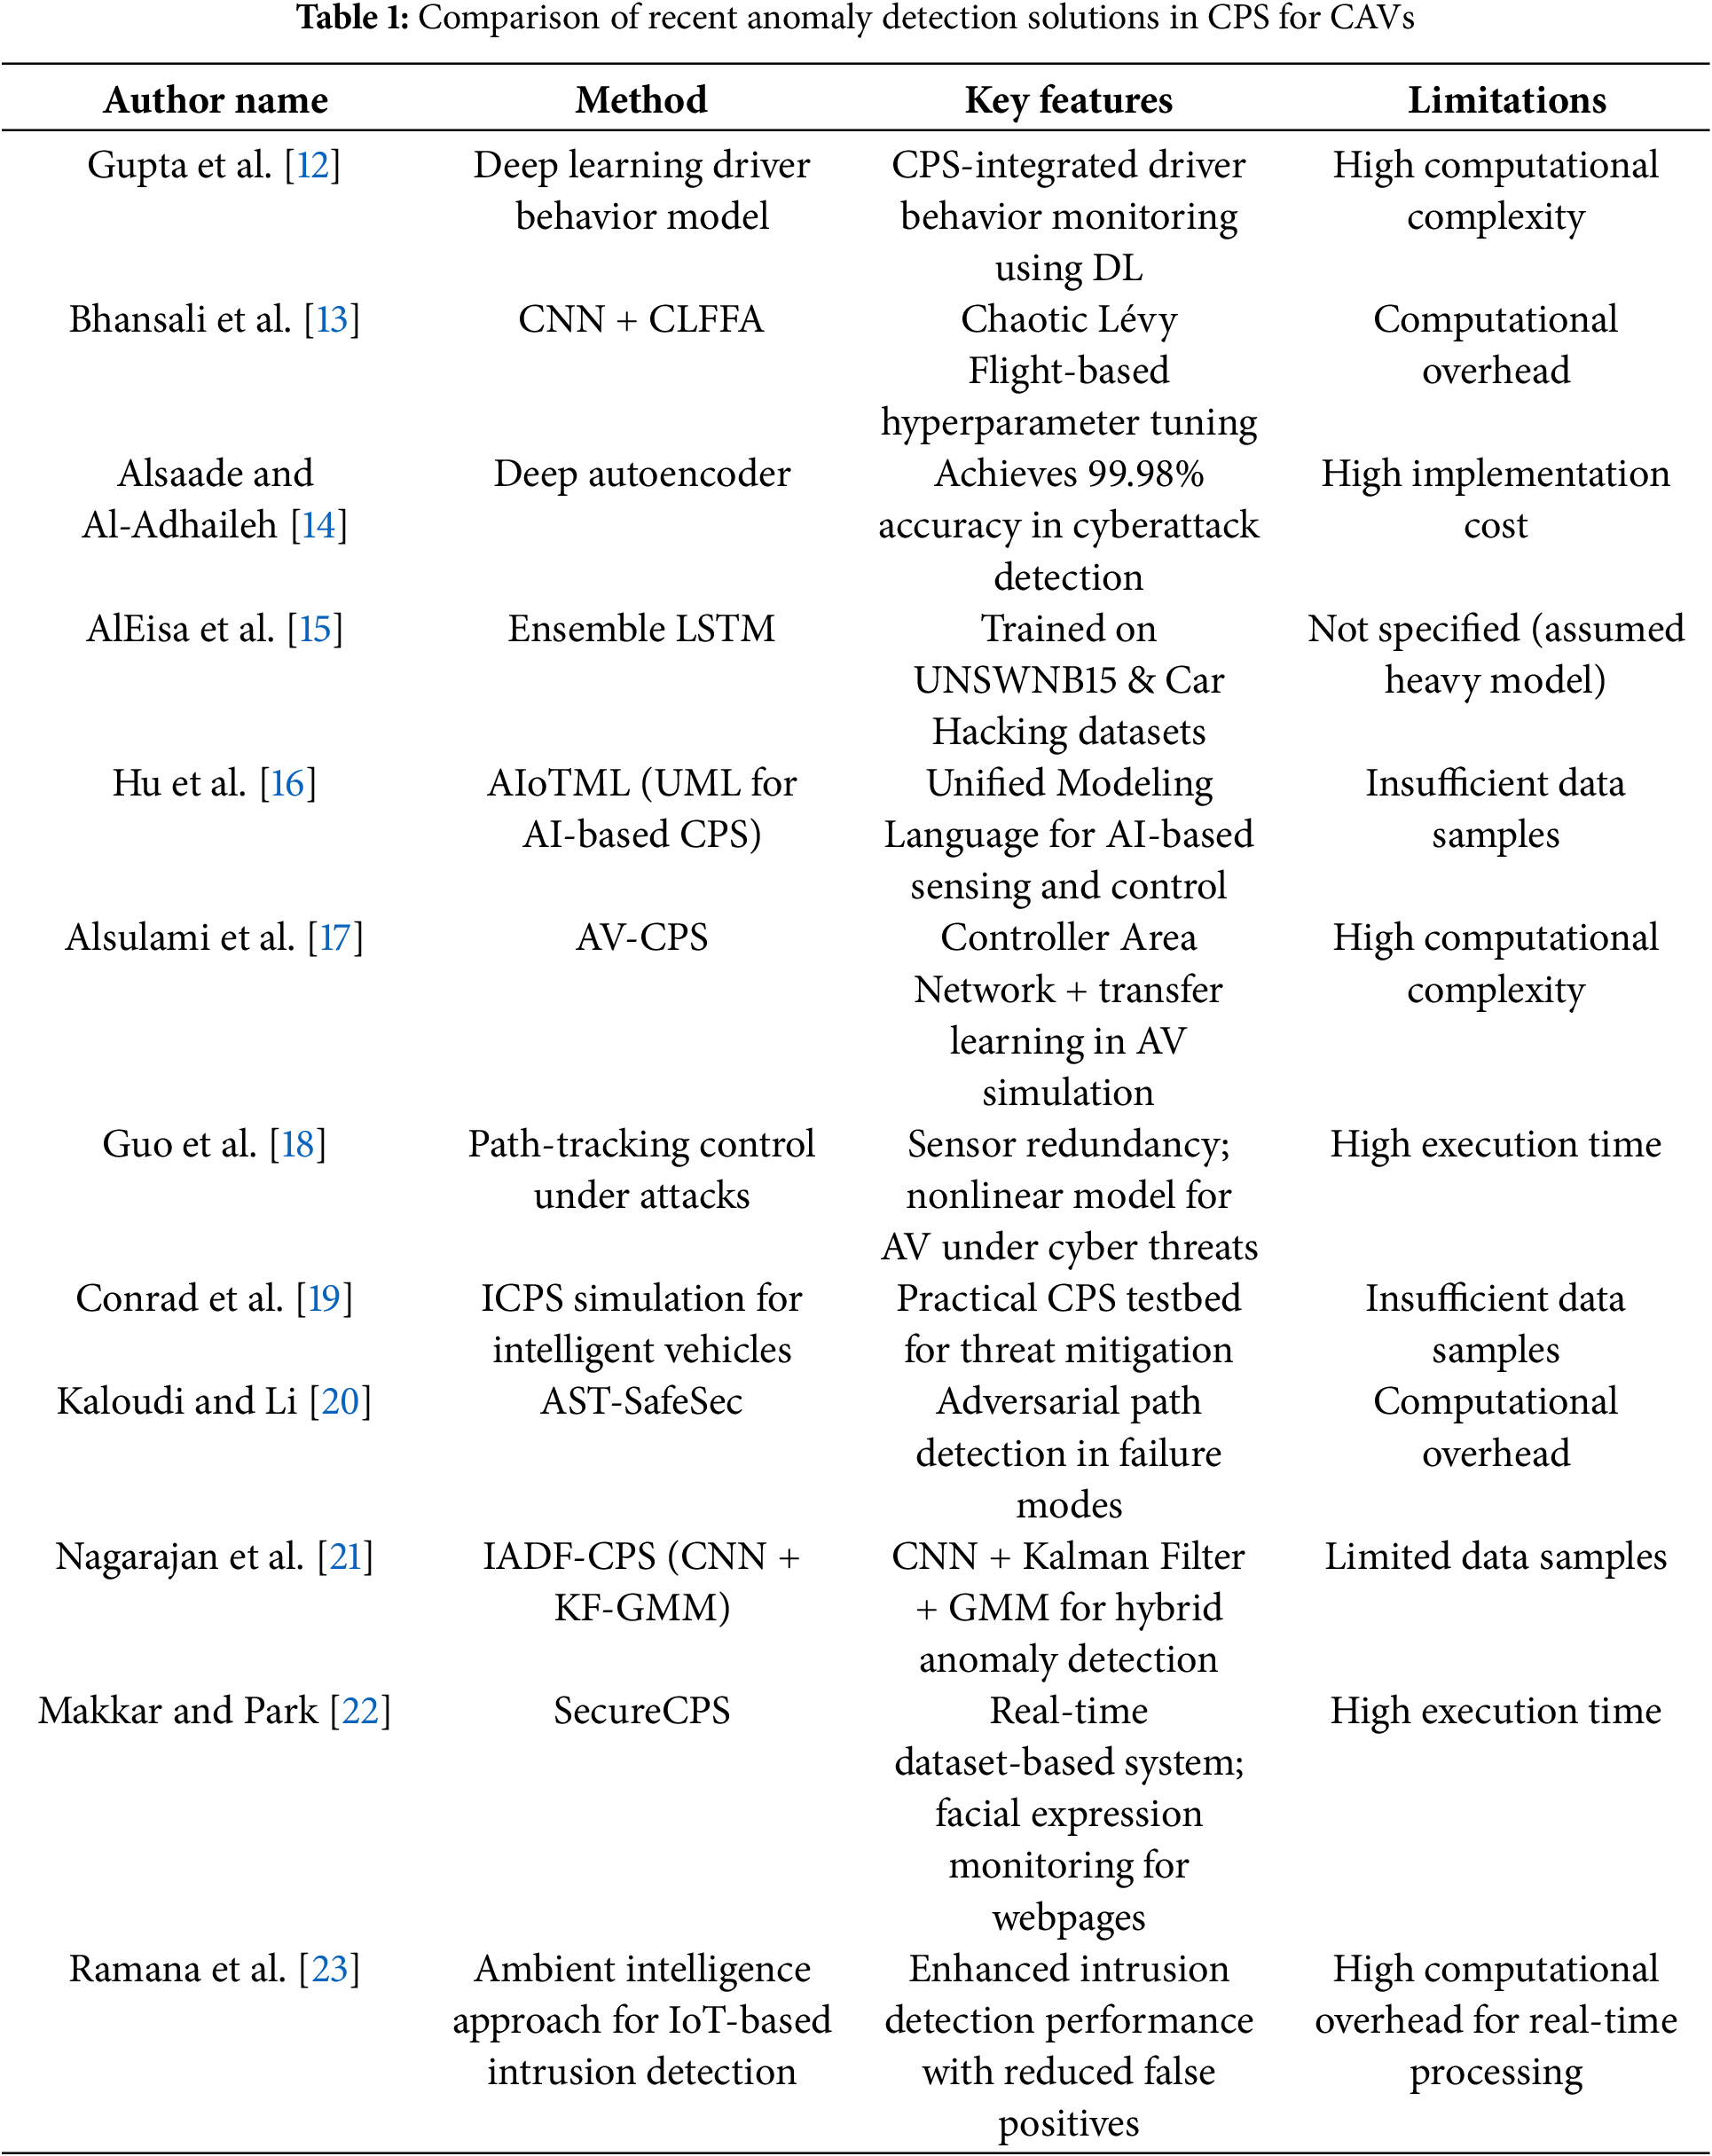
Gupta et al. [12] presented a deep learning model to detect driver behaviors in Cyber-Physical System-Based Intelligent Transport Systems. In this paper, a CPS-based solution was developed for the effective detection of driver behaviors in real-time.
Bhansali et al. [13] developed a CNN with a Chaotic Lévy Flight-based Firefly Algorithm (CLFFA) was presented. The suitable hyperparameters were selected by using the CLFFA. In addition, the CLFFA minimizes the unnecessary parameters. Alsaade and Al-Adhaileh [14] used deep autoencoder algorithms to achieve cyberattack detection for self-driving vehicle networks. Autoencoder consisted of several stacked layers namely two encoder layers that progressively reduced input dimensionality and two decoder layers that reconstructed the original input.
AlEisa et al. [15] implemented an ensemble Long-Short Term Memory (LSTM) technique based on a Deep Learning structure was implemented to detect the intrusions in the core networks of AV. In this experiment, the UNSWNB15 and car hacking datasets were used for effective validation purposes. Hu et al. [16] presented the Unified Modeling Language for AIoT-Based Cyber-Physical Systems. In this paper, AIoTML was developed to construct the AI-based components across various levels of modeling, in order to achieve effective control and sensing.
Alsulami et al. [17] developed a security strategy for Autonomous Vehicle Cyber-Physical Systems (AV-CPS) using transfer learning. The Controller Area Network (CAN) was implemented to develop the AV-CPS, and then it was integrated into the AV simulation model. Guo et al. [18] implemented cyber-physical system-based path-tracking control of autonomous vehicles under cyber-attacks. Based on the vehicle dynamics model, the AV’s nonlinear state under cyberattacks was established. Then, the sensor redundancy was applied to enhance the effectiveness of AVs against cyber threats. Conrad et al. [19] presented a comprehensive Cyber-Physical Systems (CPS) that was implemented to test and explore the intelligent vehicular models. The development of the ICPS was achieved by providing practical resources. The difficulties based on the ICPSs were effectively mitigated by the developed CPS. Kaloudi and Li [20] presented AST-SafeSec to detect the adversarial paths at various normal or failure states of the CPS. For each potential path, they computed a risk metric based on factors such as the number of compromised components, the magnitude of state deviation, and the time required to traverse the path. Nagarajan et al. [21] developed the Intelligent Anomaly Detection system for Cyber Physical Systems (IADF-CPS). The developed IADF-CPS model was utilized to detect the anomalous behavior in CPSs.
Makkar and Park [22] presented a SecureCPS that was developed and trained with real-time datasets, where the web page relevance was predicted effectively using facial expressions. The Focal Point Detector method was used to mark the eyes.
For the intrusion detection in IoT, Ramana et al. [23] developed an ambient intelligence method where the IoT-based data was used to improve the decision-making performance through contextual awareness. The detection accuracy was improved by integrating intelligent sensing and real-time analytics. Finally, the developed model achieved better performance in terms of strengthening the IoT security systems.
The overall summary of the literature works is depicted in Table 1.
2.1 Research Gaps and Limitations
Existing methods for CPS threat detection exhibit strong performance in controlled environments but face several critical limitations that hinder their real-world applicability. Many approaches are trained on limited or imbalanced datasets, reducing their generalizability to diverse and evolving cyber threats. Additionally, most models lack adaptability to dynamic attack patterns and offer limited robustness against adversarial intrusions. Implementation costs remain high, especially for architectures requiring significant computational infrastructure, and many methods are not optimized for energy-efficient or lightweight operation in embedded devices. The absence of model interpretability further complicates their integration into safety-critical CPS domains, while domain-specific designs hinder cross-domain applicability. Furthermore, insufficient use of multimodal data sources limits the contextual understanding necessary for comprehensive and resilient threat detection.
The CPS operates under the supervision of a controller, which executes the system’s functionality at every discrete time step. Firstly, the sensor measurements are fed to the controller at the initial phase of the control period. Then the inputs that are fed to the actuators are computed by the controller using the control algorithm.
(i) Integrity of Sensor Measurements
In the physical context of CPS, spoofing attacks (i.e., noise is introduced into the signals sensed by the sensors) are launched by an adversary to alter sensor measurements. In some cases, the replay attacks are undertaken by the attacker to compromise data integrity. If the re-attack is successful, the previously captured data will be sent to the CPS by an attacker.
(ii) Availability of Sensor Measurements
Real-time attack detection is effectively handled by the online phase, and this phase consists of three main components. Predicted values differ from sensor measurements when there are attacks. This difference is known as residual, and it is tracked using the attack detector to detect the intrusions. Before the detection deadline, a usable detection result is ensured by the Drift Adaptor. When there is a change in the physical environment, the detection deadline also changes. This component modifies the detection delay, where the deadline is met using the drift parameter. At each control period, the drift value and nominal sensor values are generated by the Drift Adaptor and Behavior Predictor, respectively [24]. Then the anomalies are effectively detected by the Attack Detector using the drift value and nominal sensor values.
CPS, particularly those used in automotive environments such as CAN Bus systems, are increasingly complex and interconnected, exposing them to a growing number of cyber threats and operational anomalies. These systems, coupled with physical components like sensors and actuators with computational processes, are vulnerable to various disruptions, including hardware faults, software glitches, and malicious attacks. However, current anomaly detection methods face significant limitations. Most models are trained offline and lack the adaptability required for detecting novel or evolving attack patterns in real time. Additionally, they often suffer from poor generalization, struggling to identify zero-day attacks due to overfitting on specific datasets. The scalability of existing approaches is another concern, as they are not well-equipped to handle the vast and diverse data generated by modern CPS. Furthermore, many deep learning-based models are susceptible to adversarial attacks and often fail to consider contextual and temporal dependencies across different sensor modalities, which can lead to high false positive rates and missed detections.
Let
From the above equation, the change in detection mechanism is represented by
In a fully observable framework, the correlated sensors are represented by s and
Objective Function
The absolute loss (L1-loss) is applied for effective model training. The objective function is expressed as.
From the above equation, the set of time stamps is represented by
Fig. 1 illustrates a framework that includes monitoring, prediction, and control, with a particular focus on detecting changes or anomalies and adapting accordingly (“drift” and “attack”).
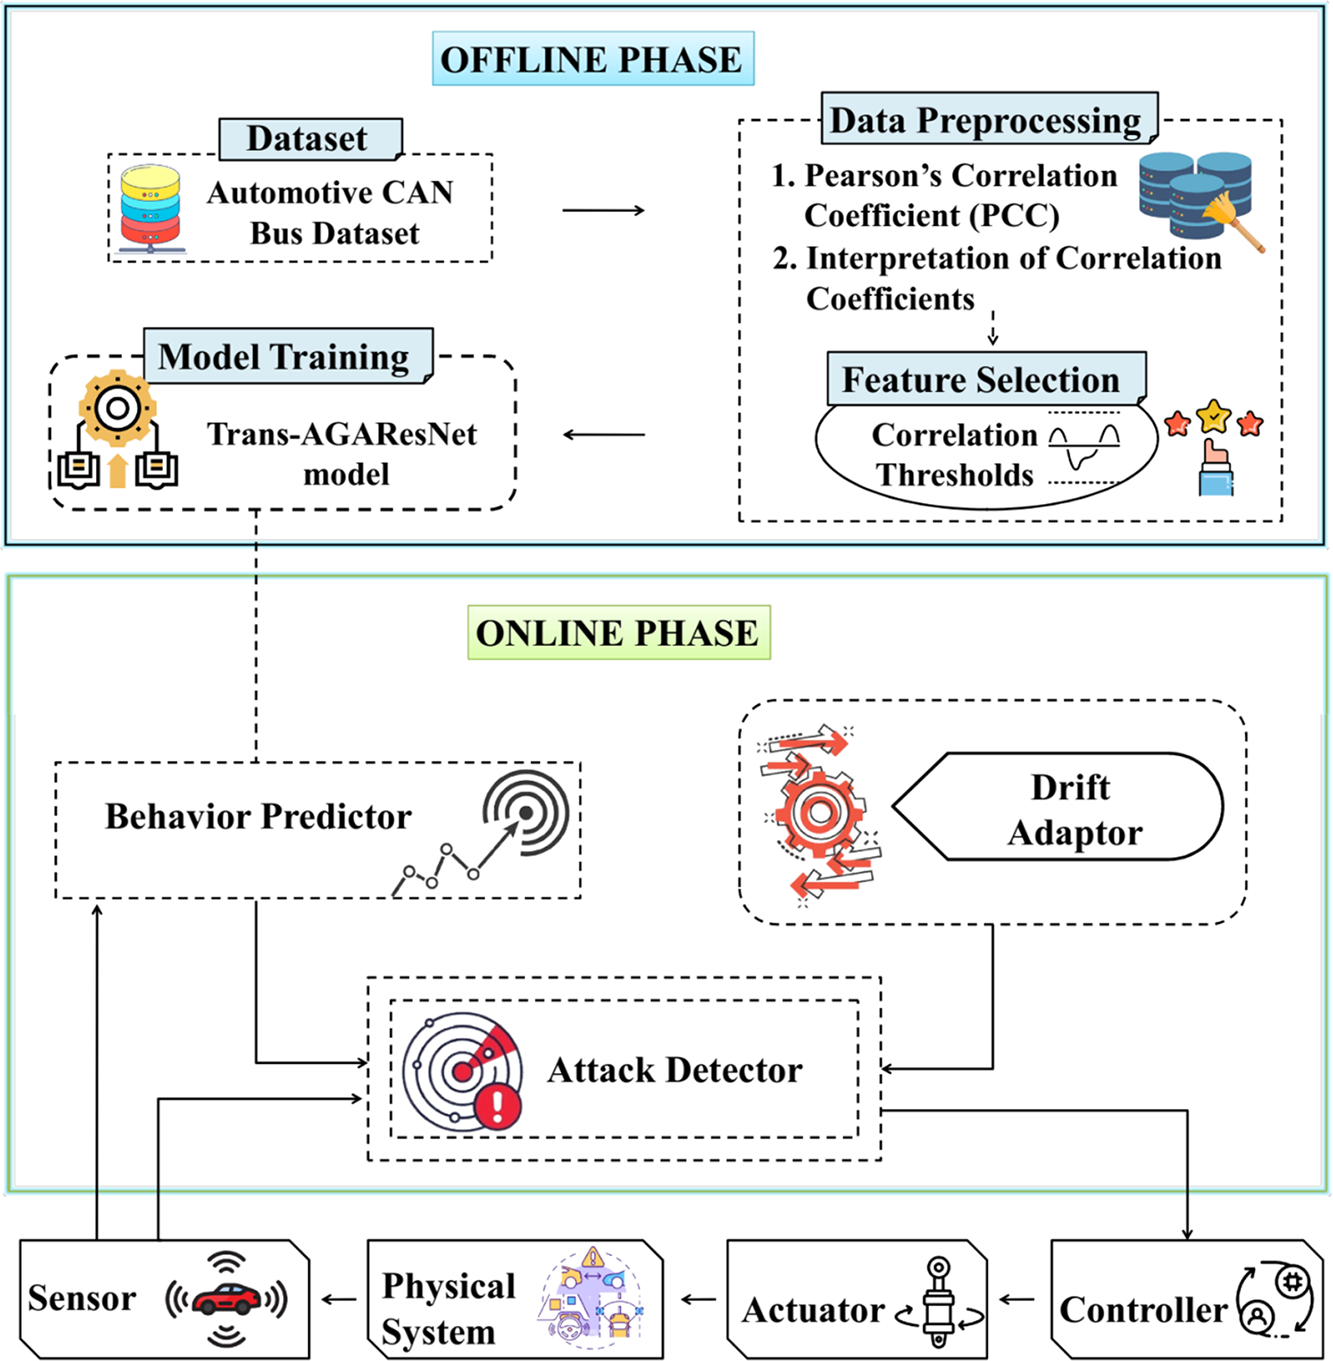
Figure 1: Proposed autonomous cyber-physical system
Data collection: Data Collection involves gathering extensive and representative time-series data from the automotive CPS sensors, particularly the CAN Bus. This dataset includes various sensor signals such as wheel speed, engine parameters, and other critical vehicle operational metrics. The collected data encompasses both normal operating conditions and instances of known attacks or anomalies to ensure a comprehensive training and evaluation environment. To enhance model robustness, data is gathered over extended periods, capturing a wide range of environmental conditions, driving scenarios, and system states.
Offline phase: In the offline phase, preparation and training are mainly concentrated. Here, the Transformer-based Attention Generative Adversarial Residual network (Trans-AGAResNet) model is trained by processing historical data. The developed model combines a transformer module, Generative Adversarial Residual Networks (GANs), Residual Networks (ResNets), and an attention mechanism to effectively capture complex patterns and relationships in time series data. Thus, the model predicts the residuals and system behavior, assisting in anomaly detection.
Online phase: In the online phase, real-time operation is achieved by the trained Trans-AGAResNet model. Predictions based on current inputs are generated by the behavior predictor. Changes in the data over time are effectively handled by the drift adapter by adjusting the model or its parameters. This ensures that the predictions are accurate.
Intrusion detector: The intrusion detector detects anomalies by comparing predicted values with actual sensor values, and also detects deviations that lead to signal attacks. Key factors, including adjusting system parameters and generating alarms, are carried out based on the output of the intrusion detector.
Automotive CAN (Controller Area Network) bus available on (https://www.kaggle.com/datasets/bikashkundu/can-hcrl-otids) (accessed on 13 August 2025) from the AEGIS Big Data Project is employed for validating the proposed model. In this dataset, various useful insights, including the sensor data from the vehicles, are included. It is used to predict, detect, and monitor anomalies in automotive systems. This data was collected during real-time drivingand these sensor data are sampled at a 20 Hz frequency. Eight sensor signals as input features: front-left wheel speed, front-right wheel speed, rear-left wheel speed, rear-right wheel speed, oil temperature, engine speed, boost pressure, and throttle position. These eight features demonstrated strong linear relationships with other channels and were used throughout both offline training and real-time inference. This extensive data collection enables a strong path for training predictive models and testing anomaly detection algorithms.
Mostly, the sensor shows physical correlation or natural redundancy in automotive CPS. It is necessary to train the model only by using the correlated sensor data to optimize the efficacy of the deep learning model. The statistical approach is utilized by the pre-processing component for detecting these correlations and selecting appropriate sensor data.
Pearson’s Correlation Coefficient (PCC)
The PCC is applied for calculating the correlation among multiple sensor data effectively. Also, the PCC is one of the statistical methods in which the linear relationship between two variables is determined and it is formulated by using the following equation.
From the above equation, the two data variables with respect to standard deviation are
From the above equation, the individual data points of
Interpretation of Correlation Coefficients
When two variables move in the same direction, a positive correlation occurs. This is reflected by PCC values closer to +1.0. When there is a rise in one variable, the other decreases. This exhibits a negative correlation (reflected by PCC values closer to −1). When the changes in one variable do not predict changes in the other. This exhibits no correlation is indicated by PCC values close to 0.
Correlation Thresholds for Feature Selection
The threshold is set to select the appropriate features on the basis of PCC values, where the correlated sensor features included in model training are ensured. Here, the features with strong positive correlation and strong negative correlations with values of greater than 0.5 and values of less than −0.5, respectively, are selected. And, the features that have the PCC values nearer to 0 are eliminated.
5.3 A Novel Attention Generative Adversarial Residual (AGARes) Model Based Adversarial Attack Configuration
In this section, the advantages of Generative Adversarial Residuals (GANs), Residual Networks (ResNets), and Attention Mechanisms are combined to form the Attention Generative Adversarial Residual (AGARes) model. The significant aim of this model is to reduce the difficulties in predicting and detecting anomalies in automotive CPS. Based on historical data, GANS generates realistic predictions, the discrepancies between both actual and predicted values are addressed by ResNets, and the attention mechanism has the ability to drive the model based on focusing on important features. Therefore, these three components are integrated to form the AGARes model, which can effectively handle complex and unreliable sensor data and detect anomalies with a high accuracy rate. This integration improves the ability of a model in terms of making predictions and detecting deviations and ensures its performance in dealing with many real-world problems, including missing data and data drift. Overall, integrating these approaches improves the performance of a model by enabling it to be effectively implemented for applications requiring real-time monitoring and adaptation in complex systems.
5.3.1 Generative Adversarial Network (GAN)
From a computer perspective, a GAN is capable of generating data whose distribution resembles the training data samples. However, it produces inappropriate training samples and suffers from data-driven problems. Two neural networks, namely the discriminator and the generator, comprise the GAN, which are represented by
The training goal of a
From the above equation,
When the fake samples are in
The ResNet model is a deep convolutional neural network architecture that introduces skip connections to overcome the vanishing gradient problem and enable effective training of very deep networks [26]. The components used in the ResNet model are as follows.
Convolutional layer: The convolutional layer is a major block and is used to perform an effective feature extraction process. The standard filters used for feature detectors include all convolutional layers. Then, features are extracted by convolving the input images with these filters. All features achieve the ability to recognize low-level features, including colors, edges, corners, and bubbles, during the training process.
For an input image
From the above equation, the convolutional operation is denoted by *.
Batch normalization: The feature map of the dataset satisfies the distribution rule with a mean value of 0 and a variance 1. The variance range of
From the above equation, the degree of variation in the numerical distribution is signified by
Residual network: The residual network learns higher-level representations from the upscaled image, which is connected after the pooling process by cross-connection. A deep learning approach called a deep residual network leads to higher accuracy and convergence. The residual is effectively learned from the shortcut connection module, where the degradation problems in deep networks are mitigated. Direct data propagation across the network leads to better extraction of high-level representational features. The equation below derives the residual learning unit.
From the above equation, both input and output vectors of the
Let, the loss function be
where the gradient of the loss function to
The Transformer architecture, as mentioned in Fig. 2, comprises position-embedded encoder and decoder blocks. The encoding utilizes sine and cosine functions to represent even and odd positions, respectively, as formulated in the following equation [27].
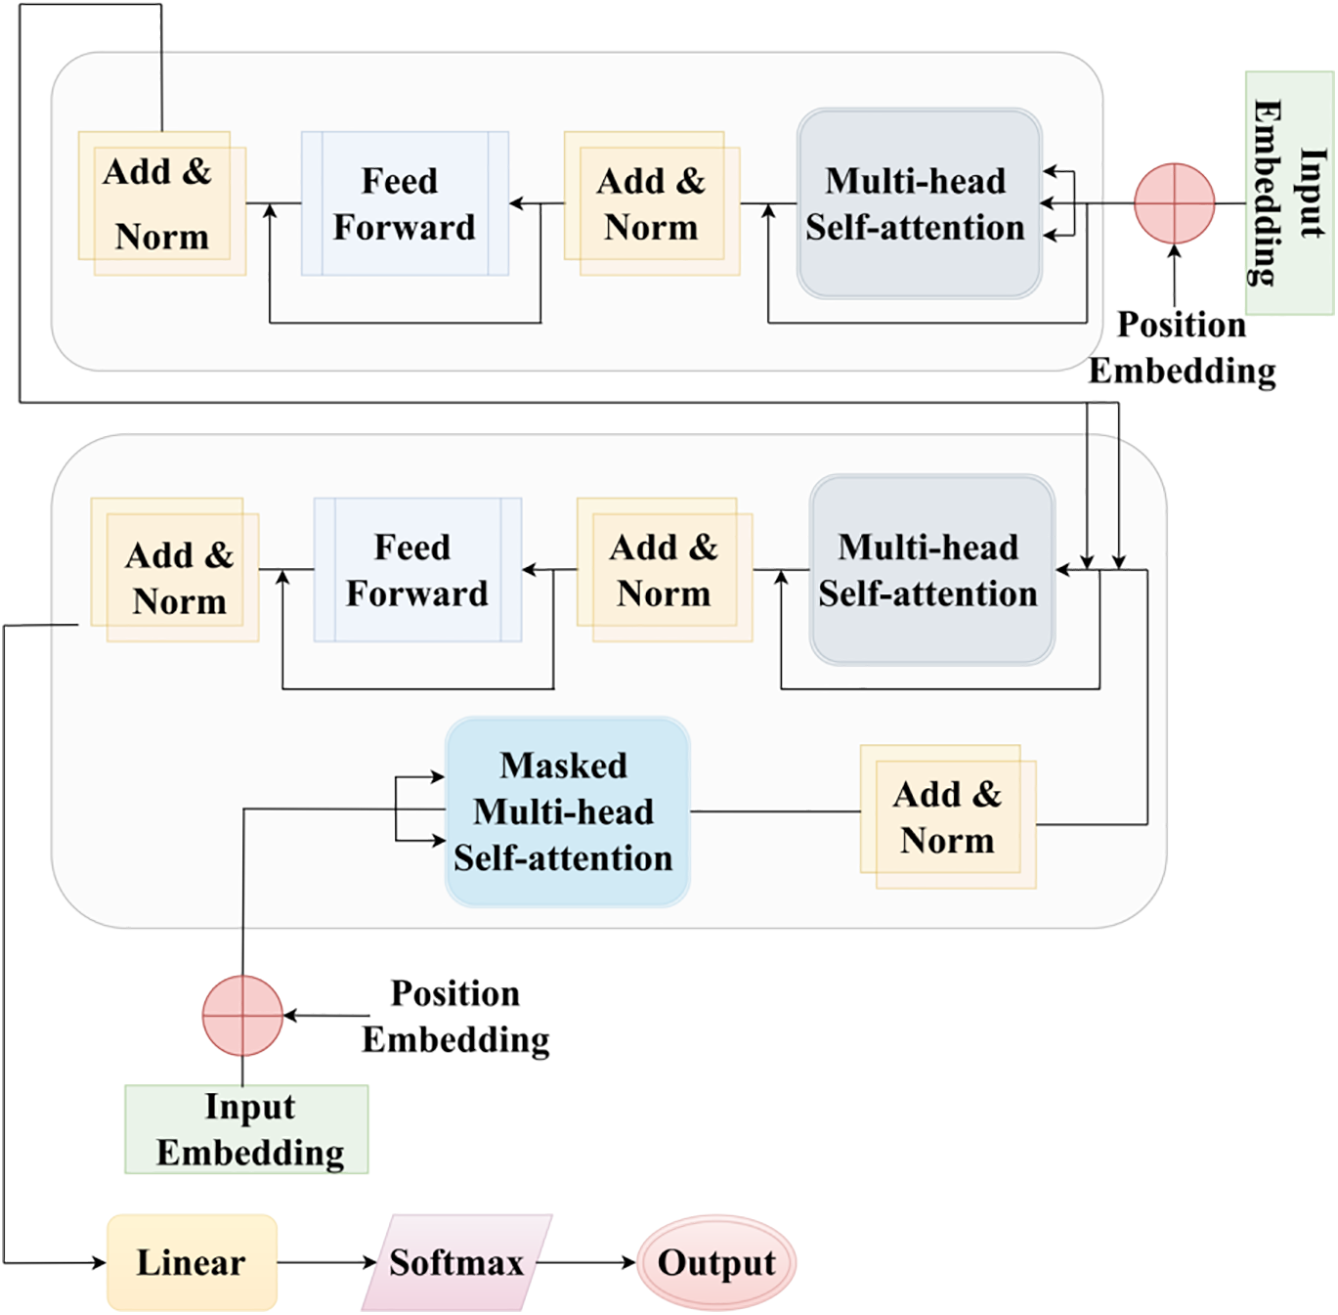
Figure 2: Transformer module
From the above equation, the positional encodings, position, embedding dimension size and dimension index are represented by
This structure enables effective sequence modeling and information integration from both input and output sequences.
The input attention layer
A softmax is employed to convert the logits into a probability distribution over the target vocabulary, enabling the model to generate the most likely next token. This process is mathematically represented as,
From the above equation,
Attention mechanism enables the model to focus on the most significant portions of the input sequence. To enhance image classification performance, attention mechanisms such as self-attention and scaled dot-product attention is introduced [28]. These techniques dynamically assign weights to different regions of the input image, emphasizing critical features while suppressing irrelevant information.
Self-Attention Mechanism
This mechanism captures relationships among diverse elements of a sequence of their distance from each other.
where
Cross-Attention Mechanism
The cross-attention provides the relationships among roads and surrounding features.
From Eq. (22),
5.4 A Novel Trans-AGAResNet Model
Three major components, including the GANs, ResNets, Transformer module, and the Attention Mechanism, are integrated to develop the Transformer-based Attention Generative Adversarial Residual Network (Trans-AGAResNet) model, which is shown in Fig. 3. To further enhance the temporal dynamics and capture long-range dependencies among time-series sensor readings, Transformer encoders are embedded within the attention mechanism pipeline. This hybridization enriches the model’s interpretability and robustness in real-time anomaly detection scenarios.
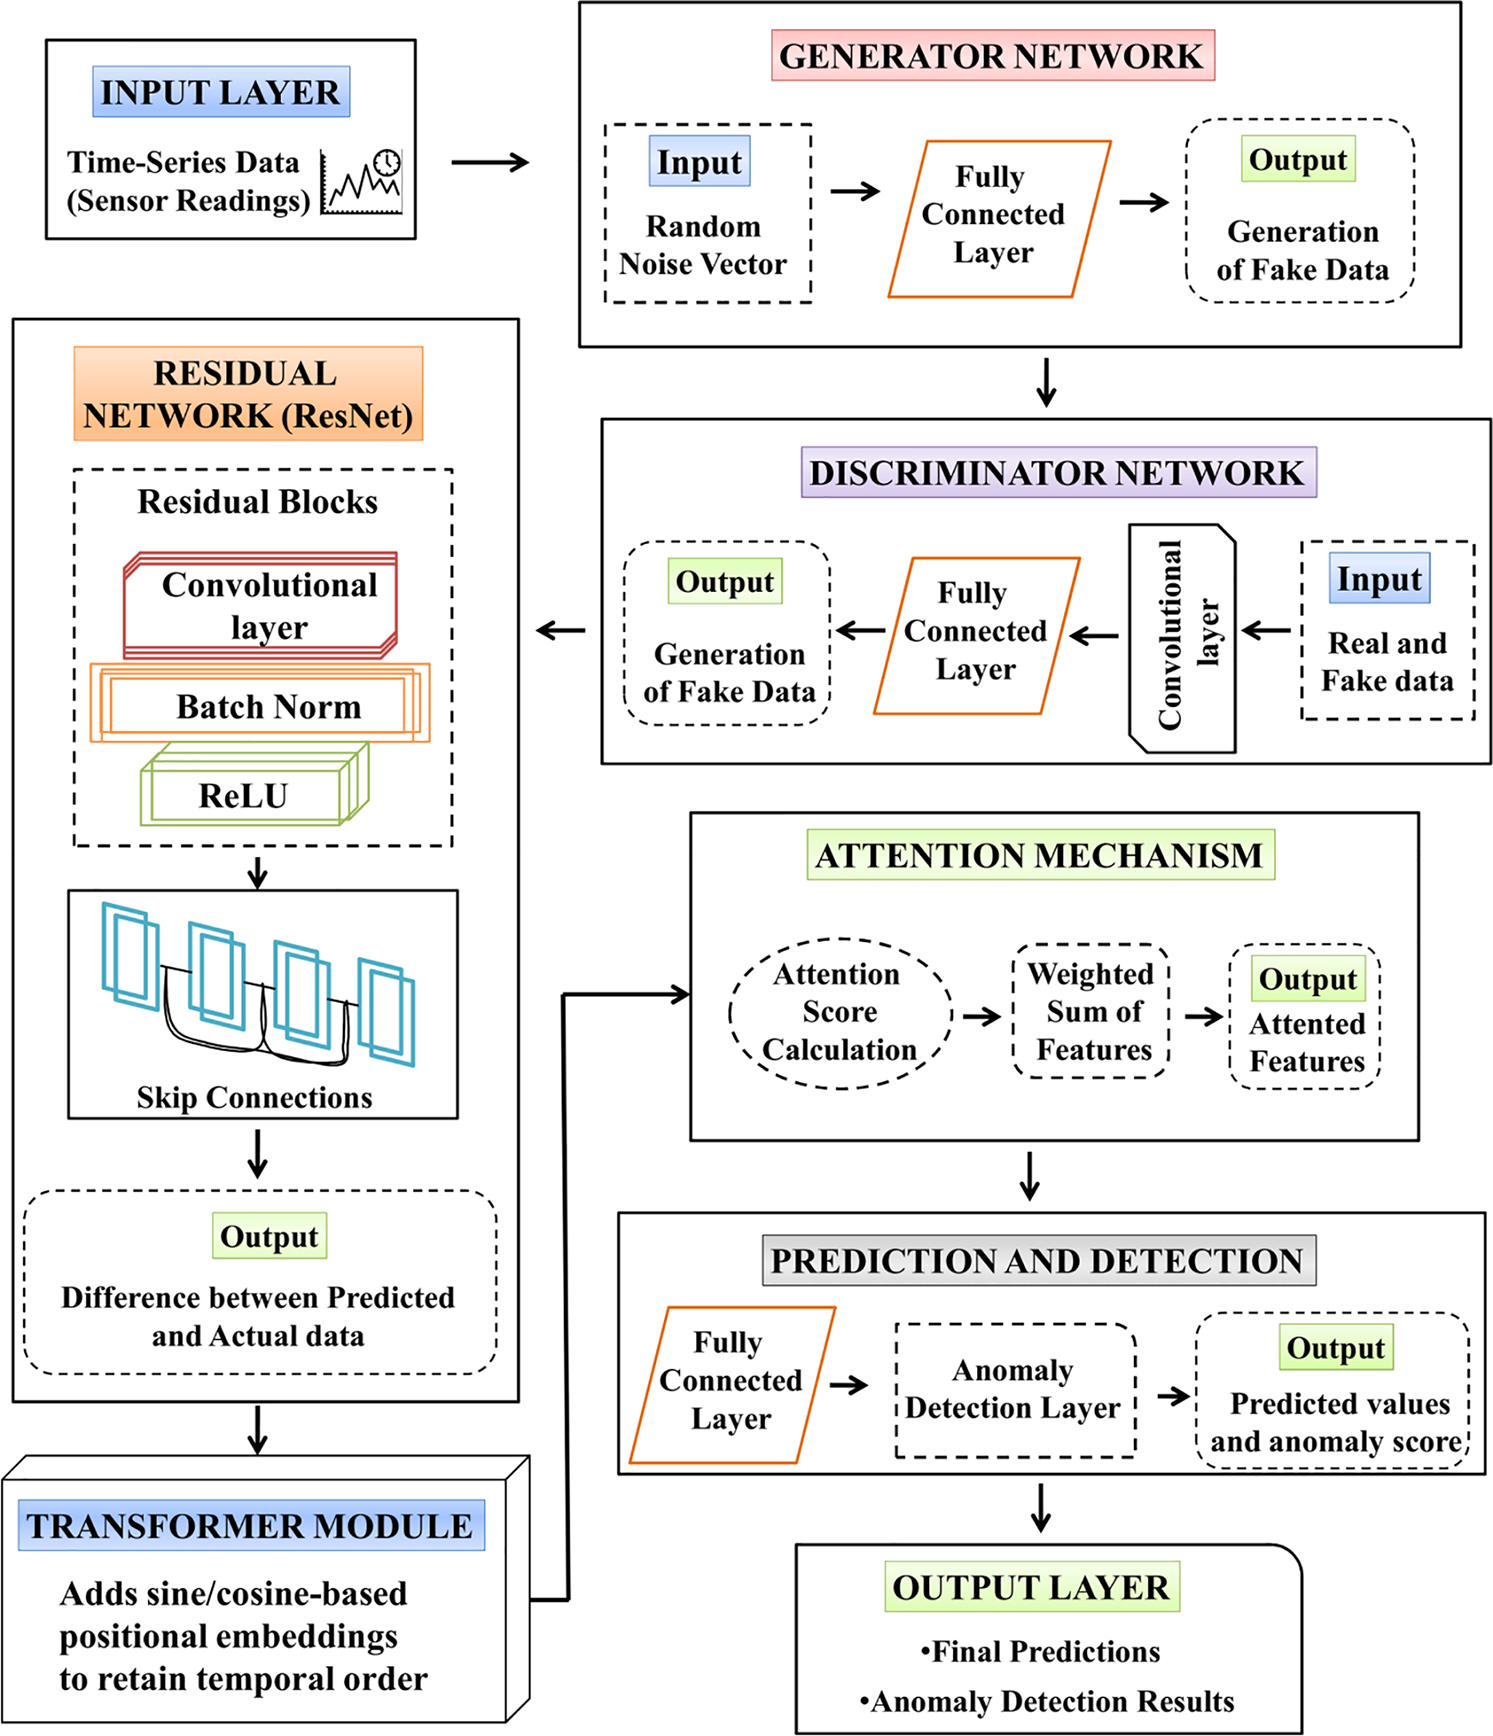
Figure 3: Proposed Trans-AGAResNet model
• GANS generates realistic predictions, where the complex dependencies between sensor readings and system behaviour are effectively learned.
• The discrepancies between both actual and predicted values are addressed by ResNets that assist the model in learning fine-grained deviations and detecting anomalies.
• The attention mechanism enhanced with Transformer encoders weighs the relevance of sensor features and temporal dependencies across multiple time steps. The Transformer structure, comprising self-attention layers and feed-forward blocks, enables the model to assign dynamic attention scores to both short-term and long-term events, capturing intricate patterns across multi-dimensional sensor inputs.
Overall, integrating these approaches improves the performance of a model by enabling it to be effectively implemented for applications requiring real-time monitoring and anomaly detection.
Assume
The significance of diverse sensor features, and time steps is weighted by the attention mechanism
From Eq. (20), the attention weights related to the sensor
From the above equation, the total loss, loss from the GAN, loss based on Residuals, and loss from the attention mechanism are represented by
The drift adaptor plays a vital role in ensuring that the anomalies, specifically attacks, are detected well before the critical system deadline. In dynamic CPS, the response time is considered as crucial, and in the case of autonomous vehicles, it is necessary to align the detection deadline with safety margins and physical constraints of the environment. These constraints include diverse parameters such as velocity, distance to obstacles, as well as sensor delay.
Estimating Detection Deadline
A deadline estimator is employed to detect the anomaly more reliably. This estimator computes the earlier point at which the system may enter an unsafe state based on the maximum observed rate of change in the sensor reading during non-anomalous operations.
Offline Phase
In the offline phase, the model builds a change profile for each sensor by analysing the historical data. This phase particularly evaluates the variation of sensor readings between two consecutive protocols, which enables the system to understand the normal behaviour. Let
From the above equation, the sensor readings with future time is
The equation below is used to compute the minimum change rate
Reachable Value Estimation
Using these bounds, we estimate the reachable values of the sensor over time during the online phase. Given the current sensor value
This allows us to determine when a sensor value may cross into an unsafe region (i.e., anomaly zone).
Unsafe Condition and Earliest Alarm Time
Let
From the above equation, the unsafe set of sensors j is signified by
This deadline acts as a constraint for real-time detection modules to ensure timely responses before a system enters an unsafe state.
The optimal drift variable
Drift-Parameter-Detection Delay Relationship
The relationship among the drift parameter
From the above equation,
This ensures that the real-time environmental changes are ensured by the system with better performance.
Attack Detection
Two major strategies, including the stateful strategy and the stateless strategy, are used in the proposed attack detection system.
Stateless strategy: At each control period, each individual residual
Although this method is simple, it has a few major disadvantages, including the increased false positives because it detects any deviation as an attack, without considering the historical behavior of the system.
Stateful strategy: In this strategy, the historical context of the residuals is considered. This method assesses the statistic
In this method, the false positive is significantly reduced when compared to the stateless approach by considering the overall trend of residuals.
5.7 Exponential Weighted Moving Average (EWMA) for Attack Detection
The weighted moving average is applied to the residuals by the EWMA approach, where larger weights are placed on the latest observation when integrating the prior data [27]. This enables adaptive attack detection in which the importance of prior data gets reduced, making it adaptive to detect anomalies.
The residual function
At each control period, the EWMA statistic
From the above equation, the EWMA value from the prior time period is represented by
Alarm Condition in EWMA
An anomaly is indicated when the EWMA value
The overall experimental analysis in the attack detection process is explained in this section and validates the effectiveness of the proposed model by obtaining various measures.
The experiment is implemented using an NVIDIA GeForce RTX 3090 GPU. Also, the Sklearn open-source Python library for the classical ML random forest model is used. For DNN models, PyTorch-lightning is used. Torchattacks are obtained to run adversarial attacks.
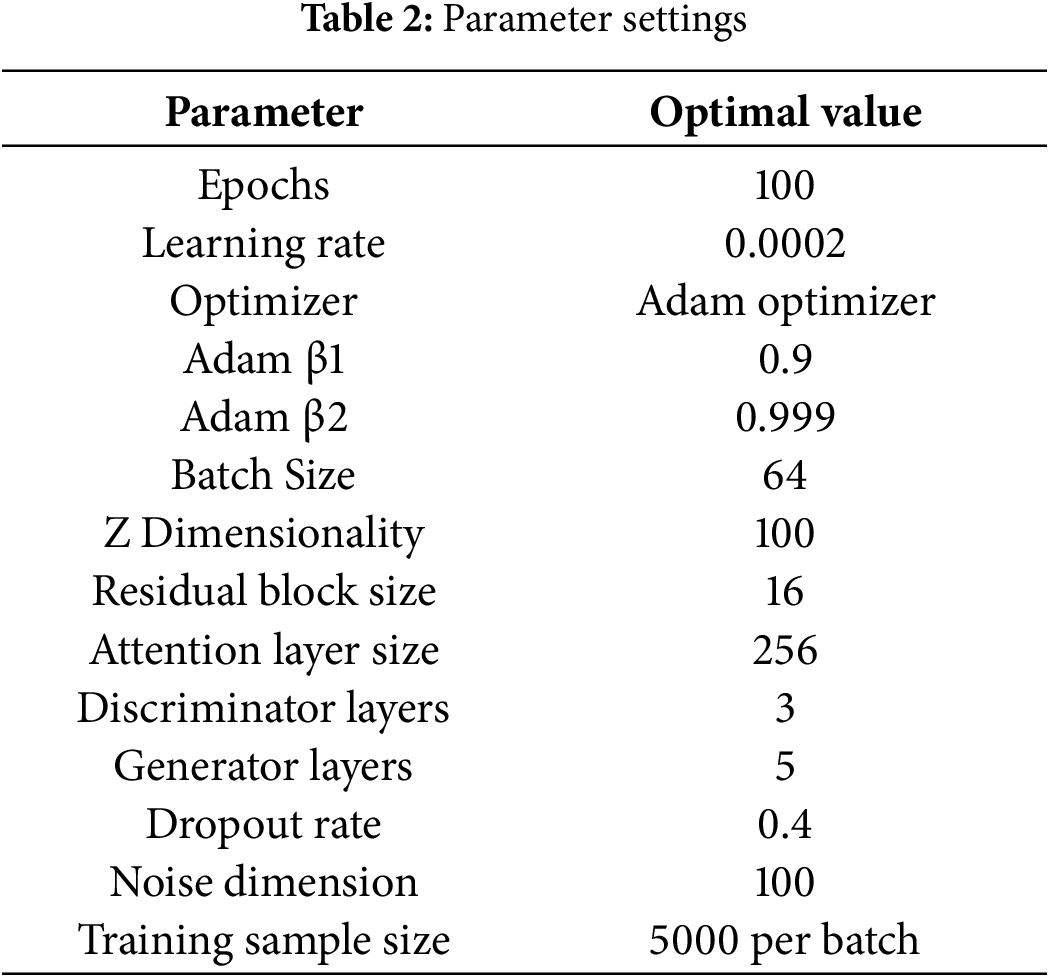
Table 2 presents the hyperparameter configuration of the proposed Trans-AGAResNet model.
The following are the definitions and mathematical expressions of several key metrics in evaluating system performance, including accuracy, precision, specificity, sensitivity, and F-1 score.
Accuracy: It determines the accurate prediction out of all the total predictions.
Precision: In secure and adaptive autonomous cyber-physical systems, precision represents the number of detected threats or adversarial attacks that are legitimate, reflecting the ability of a model to avoid false alarms and focus on true security threats.
Sensitivity: In secure and adaptive autonomous cyber-physical systems, sensitivity measures how accurately the model detects all actual adversarial attacks that highlighting the capability in avoiding overlooking real risks (false negatives).
Specificity: In secure and adaptive autonomous cyber-physical systems, the detection ability accurately identifies benign or safe events, reflecting how well it avoids misclassifying legitimate data or actions as malicious or hostile.
From the above equations, the True Positives, True Negatives, False Positives, and False Negatives are represented by
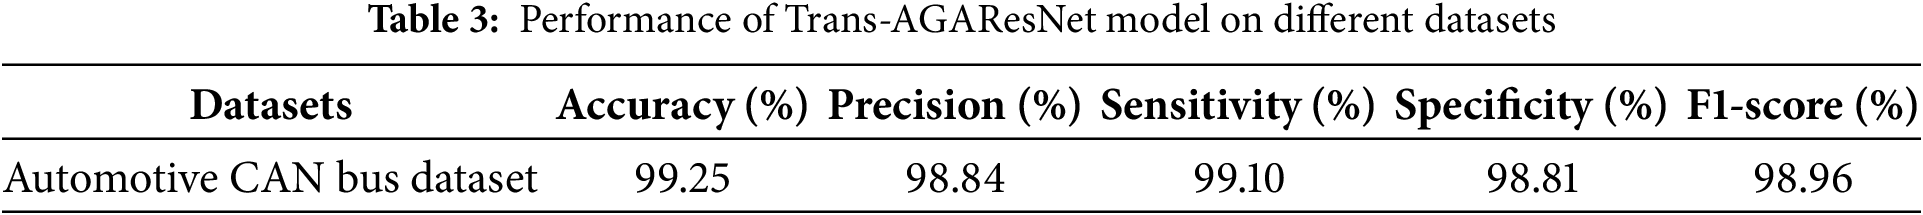
Table 3 presents the performance achieved by the proposed Trans-AGAResNet model using the key evaluation metrics.
Accuracy and Loss Analysis
Fig. 4a,b illustrates accuracy and loss analysis based on the Automotive CAN Bus Dataset. Fig. 4a depicts both training and testing accuracy of a proposed model on the Automotive CAN Bus Dataset. The graph plotted between the number of epochs and the accuracy rate, demonstrating that the proposed model achieves the highest training and testing accuracy on the Automotive CAN Bus Dataset. Fig. 4b illustrates the corresponding training and testing loss curves. From this graph, it is shown that the proposed model attains minimal training and testing loss, indicating effective learning and strong generalization performance on the dataset.
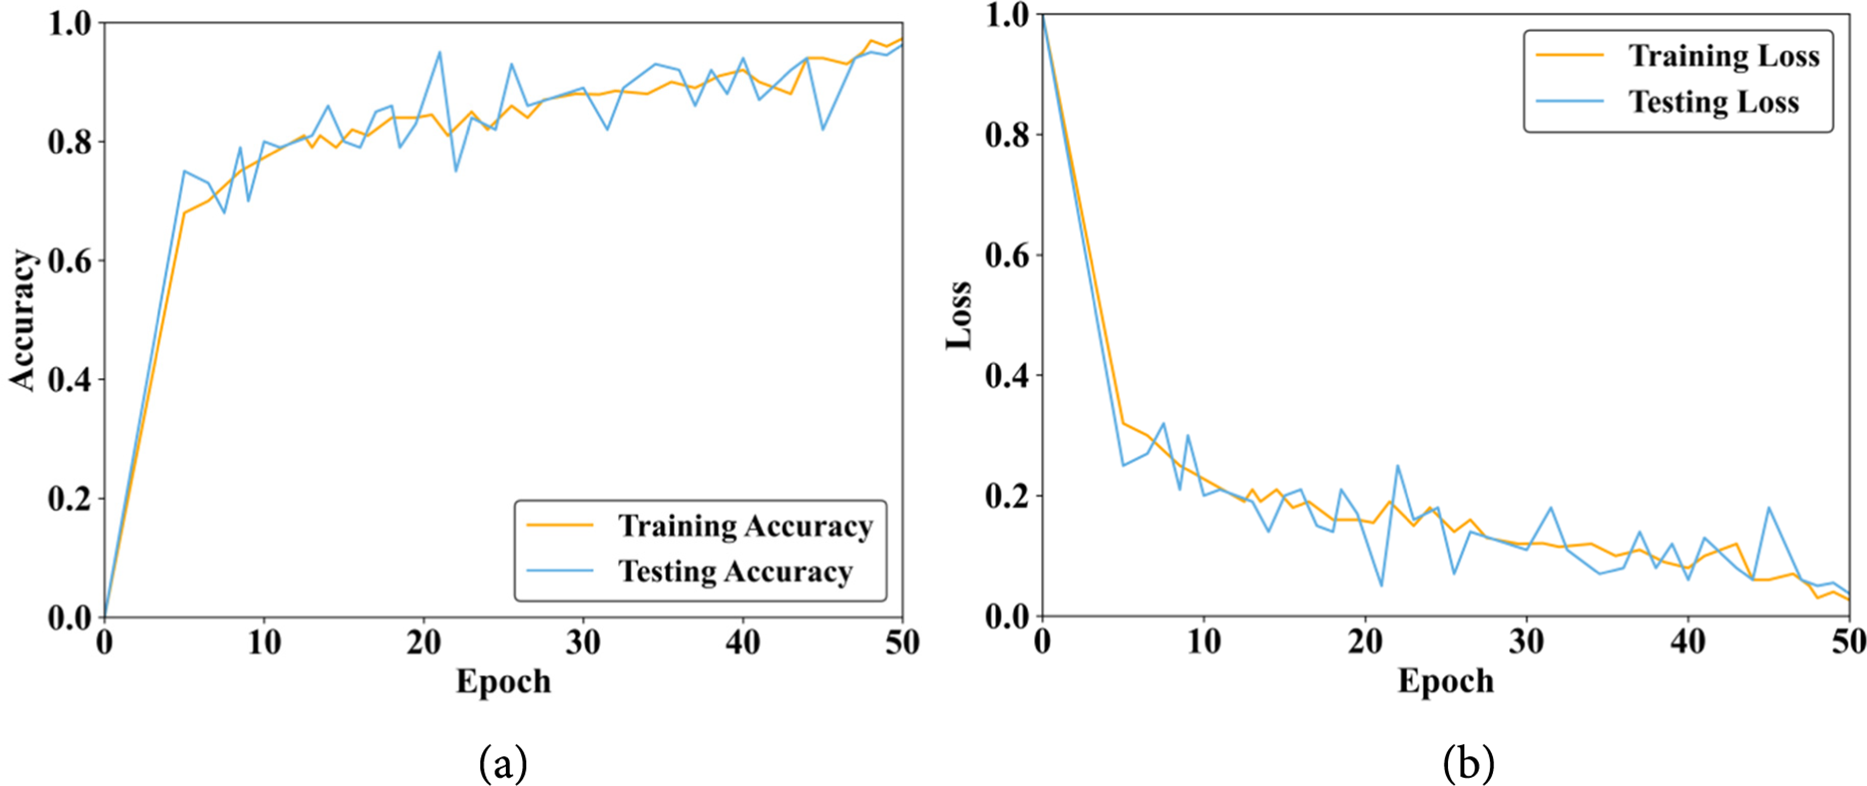
Figure 4: Model convergence analysis (a) Training and testing accuracy (b) Training and testing loss
Fig. 5a illustrates the relationship among the drift parameter as well as detection delay across various attack scenarios. This graphical representation highlights how changes in the drift parameter influence the speed of attack detection. Fig. 5b shows the variation in false positive rates concerning different drift parameter values, where the X-axis represents the drift parameter and the Y-axis denotes the corresponding false positive rate.
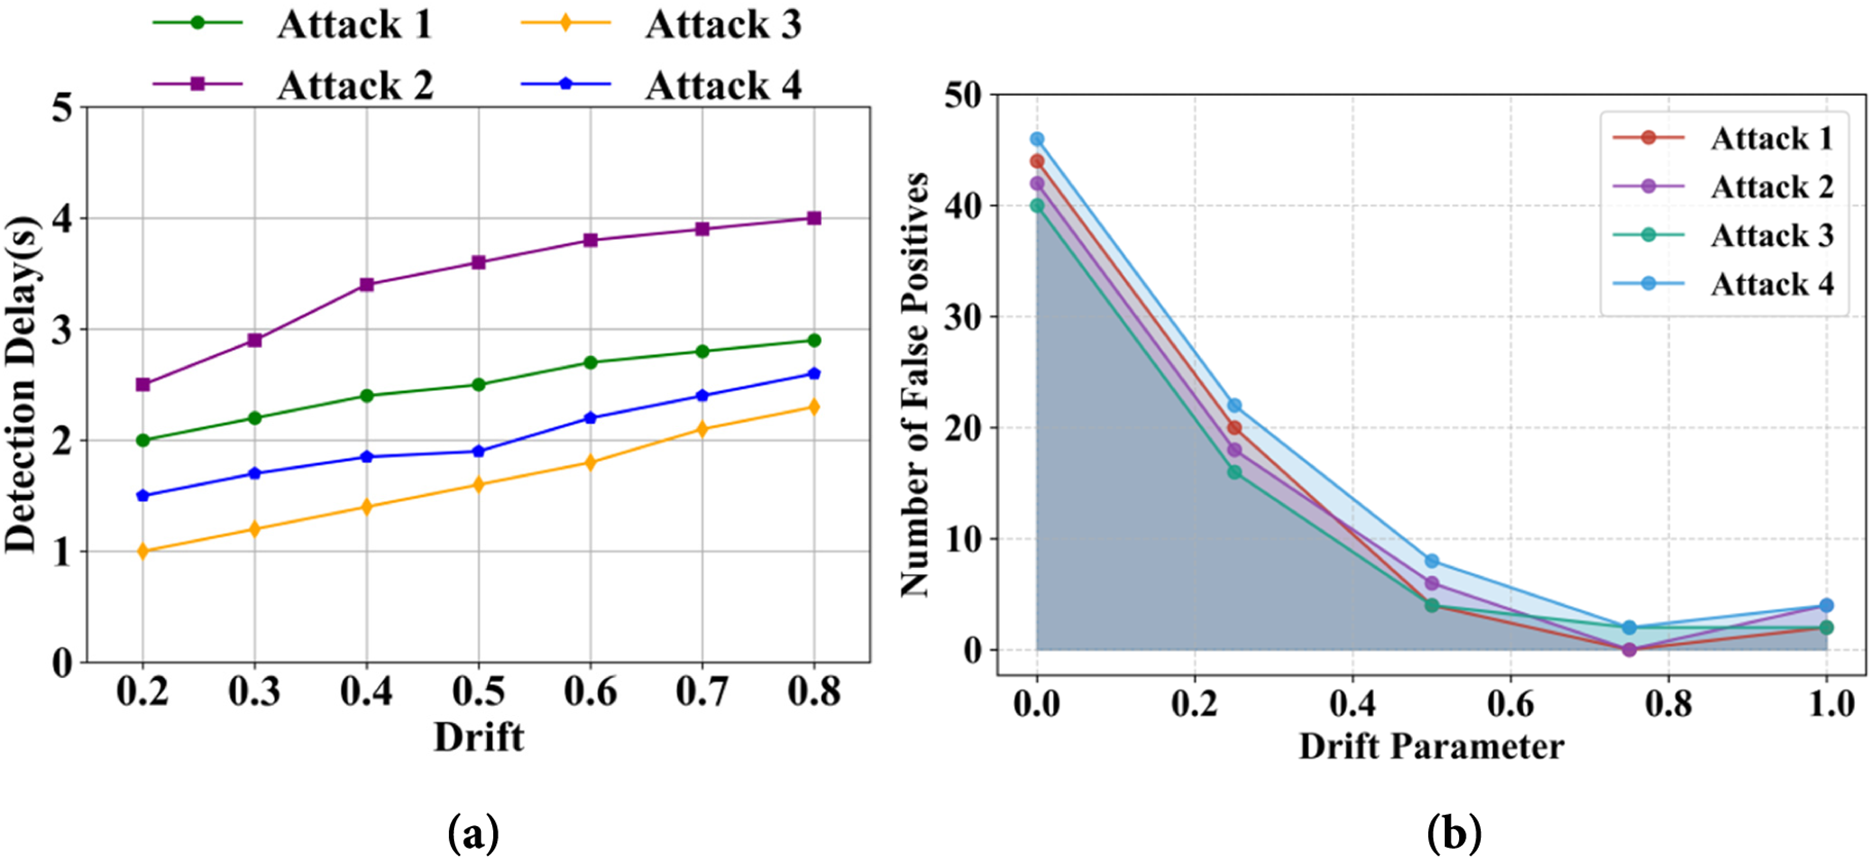
Figure 5: Analysis of drift parameter for (a) detection delay (b) number of false positives for different attack scenarios
Fig. 6 illustrates that the graph is plotted between the time (s) and Wheelspeed on the X-axis and Y-axis, respectively. The purple line, green dotted line, and blue dotted line represent the observed values, predicted values, and error values, respectively. From this graphical representation, it is seen that the predicted and observed values are closer to each other under a normal scenario.
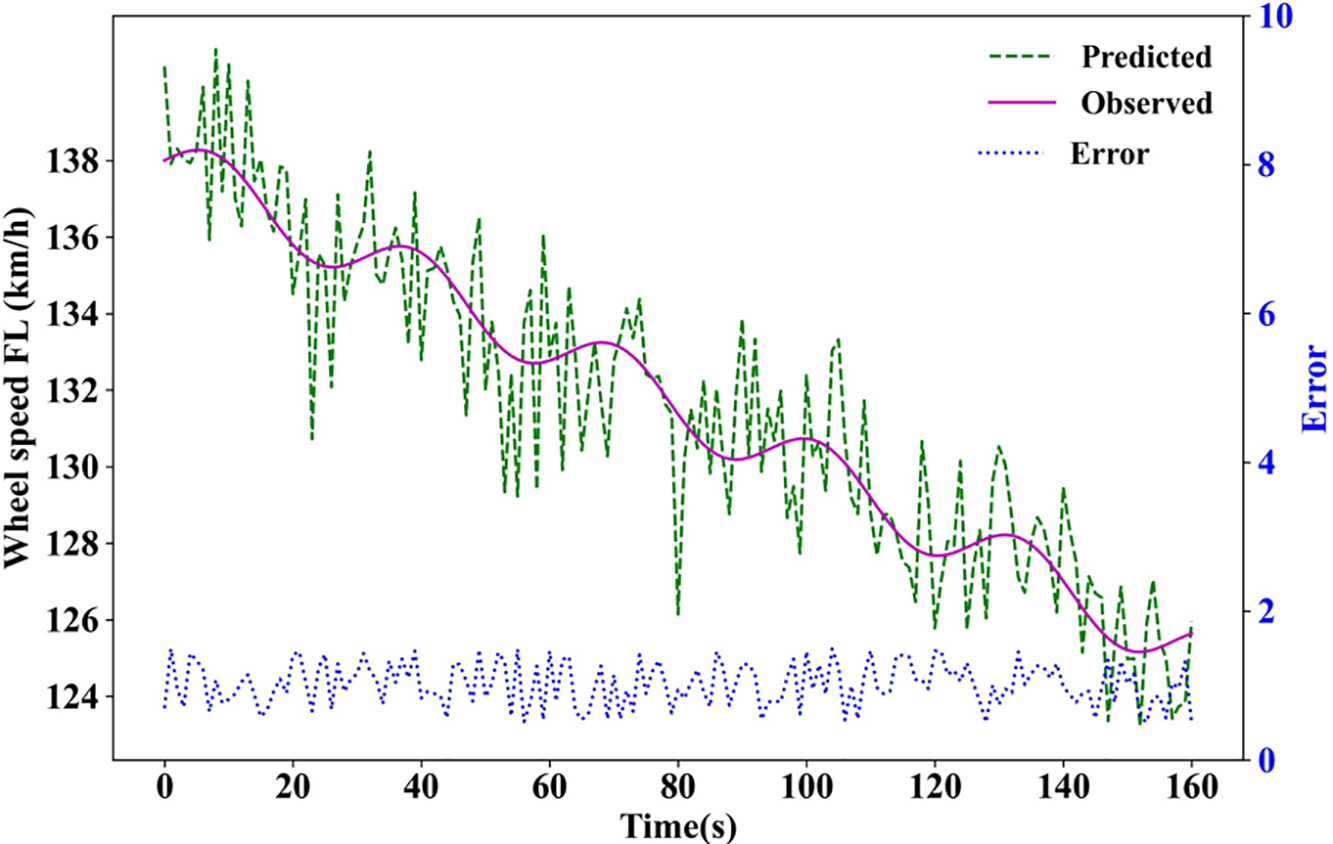
Figure 6: Front-Left wheel speed sensor measurement
Fig. 7 illustrates the predicted and observed values for three parameters, namely oil temperature, engine speed, and the boost pressure sensor. In this graph, the time (s) and all three parameters are plotted. The predicted values and observed values are denoted by a solid orange line and dotted blue line, respectively. From this graphical representation, the accuracy of a model is evaluated by comparing how closely the predicted and observed values are aligned. Strong predictive capability is represented when both the lines overlap or run closely together. Overall, this graphical representation predicts the performance of a model based on engine-related parameters.
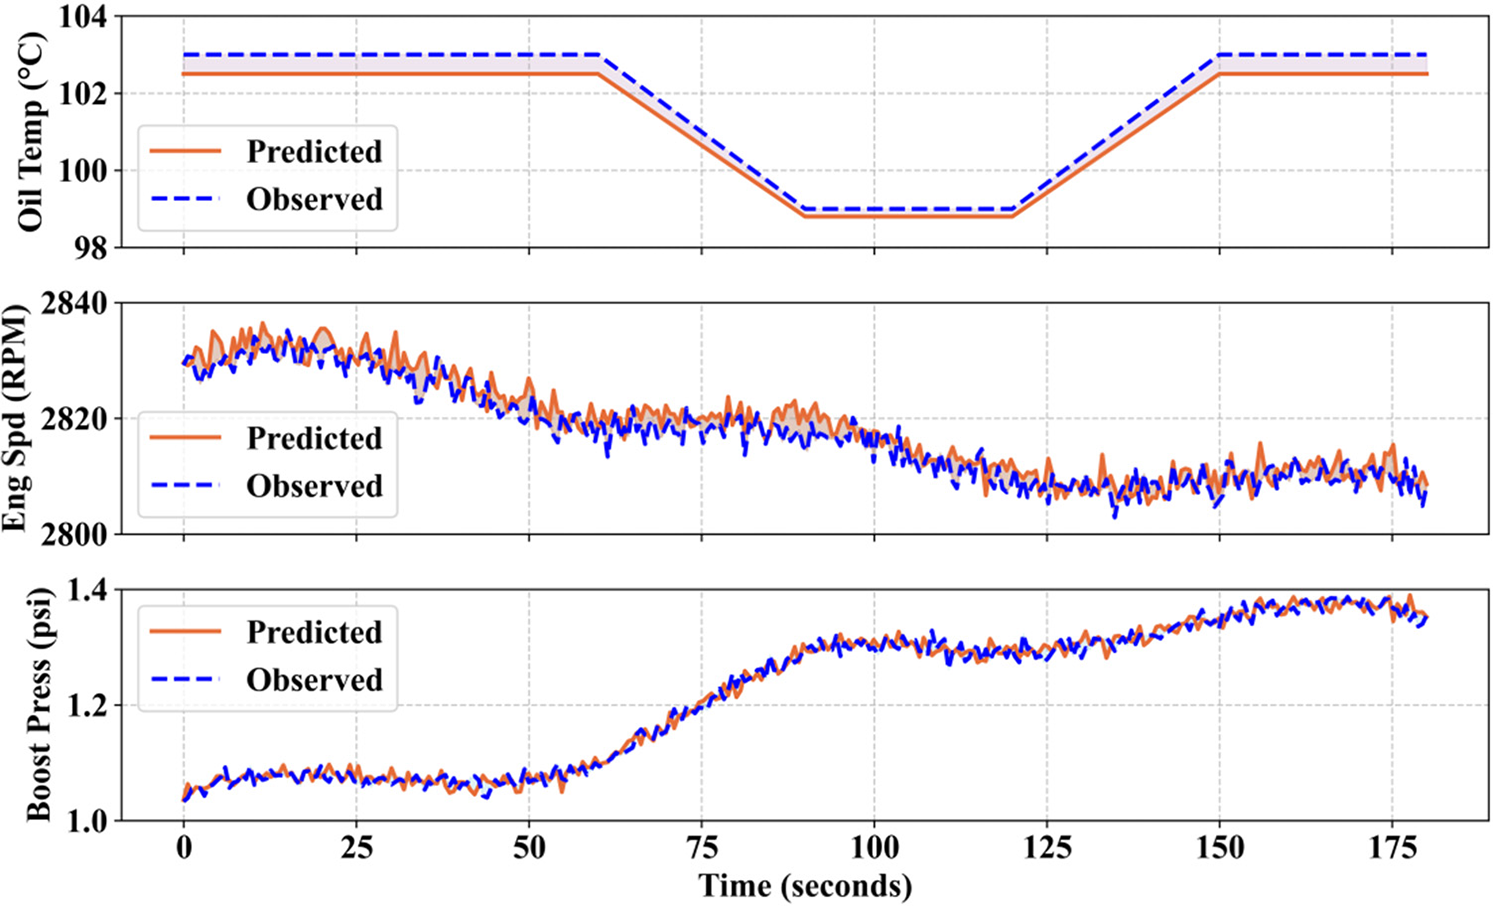
Figure 7: Predicted and observed values for different sensors
Fig. 8 illustrates a closer view of detecting an attack with respect to wheel speed data. The blue line is the actual observed speed, and the orange line is the model’s predicted speed if no attack occurred. Around 51 s, marked by the green triangle, the attack begins, causing the observed speed to deviate from the predicted trend until the red circle is about 55 s, where the system raises an alarm, indicating the attack has been successfully detected.
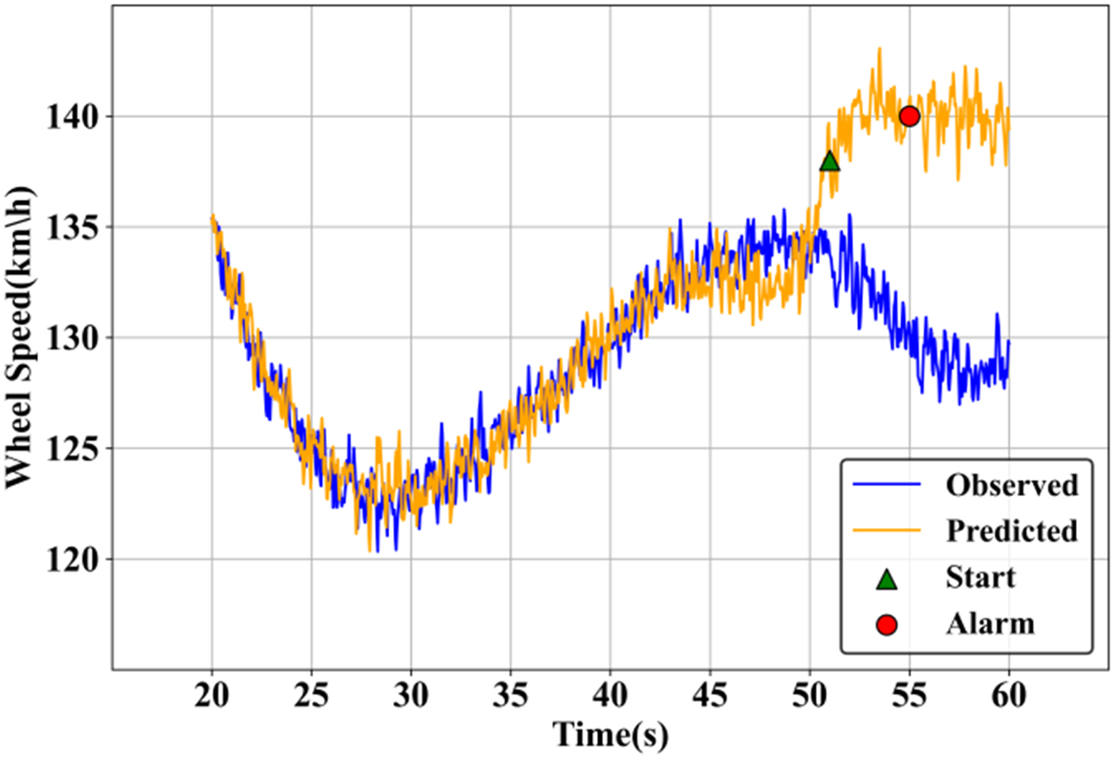
Figure 8: Analysis based on closer view of a detected case of attack 1
Fig. 9 shows the relationship between the drift parameter and detection delay for Attack 3 using an adaptive detection method. The green line with markers represents the measured detection delays (in seconds) across varying drift parameter values from 0 to 1. As the drift parameter increases, the detection delay also increases steadily, indicating that higher drift.
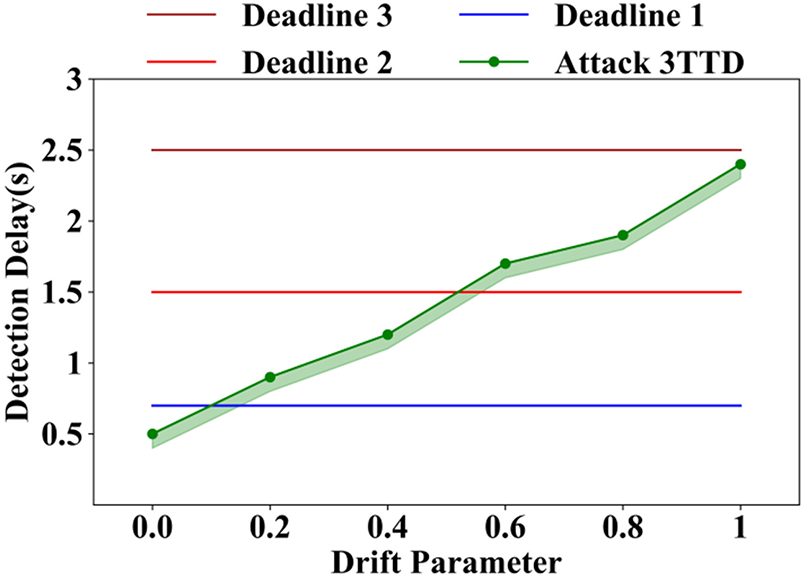
Figure 9: Analysis based on adaptive detection for attack 3
Fig. 10 illustrates the detection of various attacks in a deep automated attack detector. The purple lines, red dashed line, and green dots are represented by reconstruction error, threshold, and anomalies, respectively. High reconstruction error denotes the potential attacks. This graphical representation effectively visualizes how this deep learning-based approach uses reconstruction error to detect anomalous data points that indicate attacks.
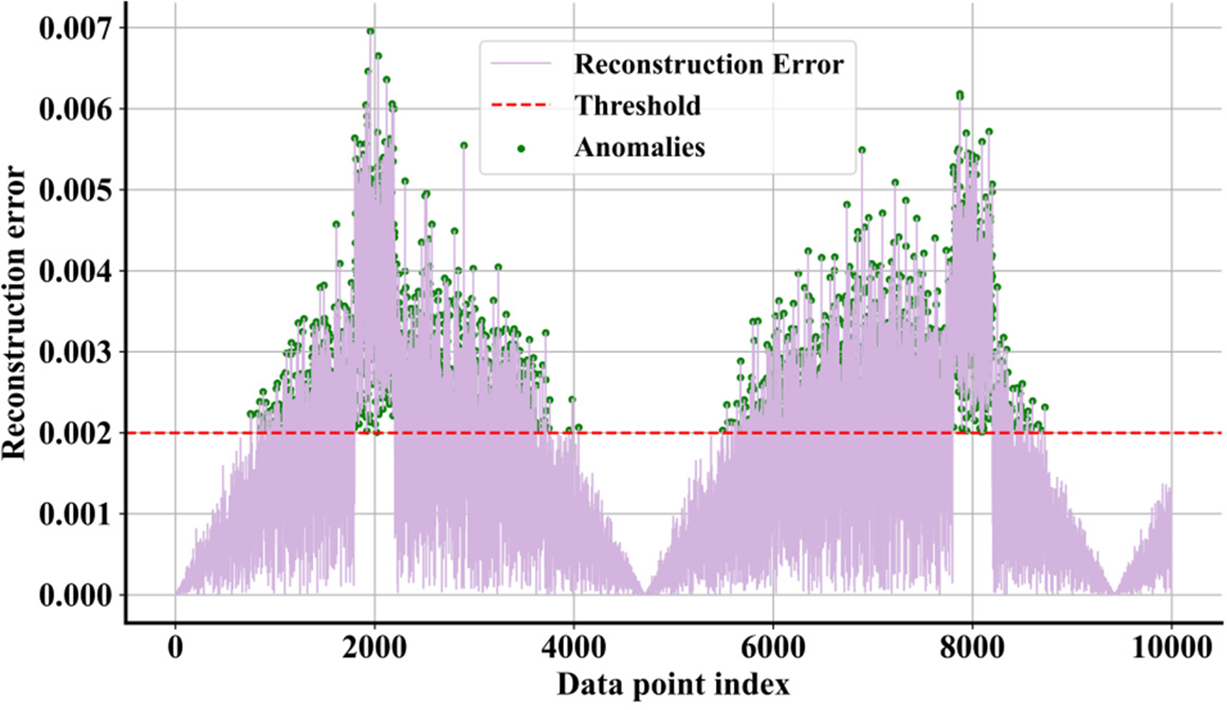
Figure 10: Attack detection in a deep automated attack detector
Fig. 11 shows a graphical representation of the AUC-ROC curve of the proposed Trans-AGAResNet approach when compared to all other existing approaches, such as Trans-AGAResNet, CNN + CLFFA [13], Deep Autoencoder [14], Ensemble LSTM [15], AIoTML [16], and AV-CPS [17]. This graph demonstrates that the proposed Trans-AGAResNet approach shows a higher AUC-ROC value than all other existing approaches.
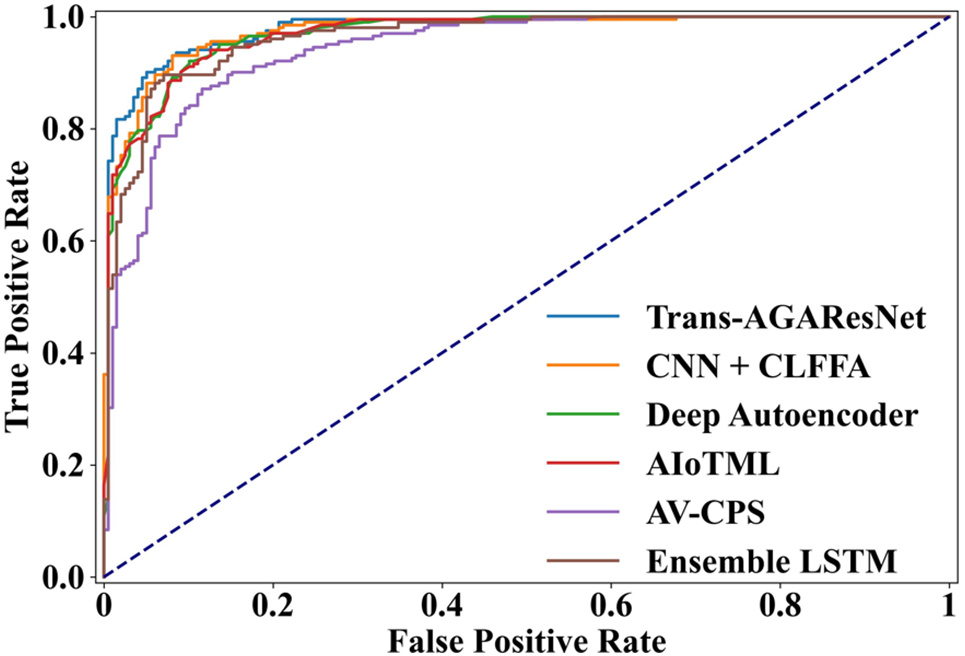
Figure 11: AUC-ROC curve analysis
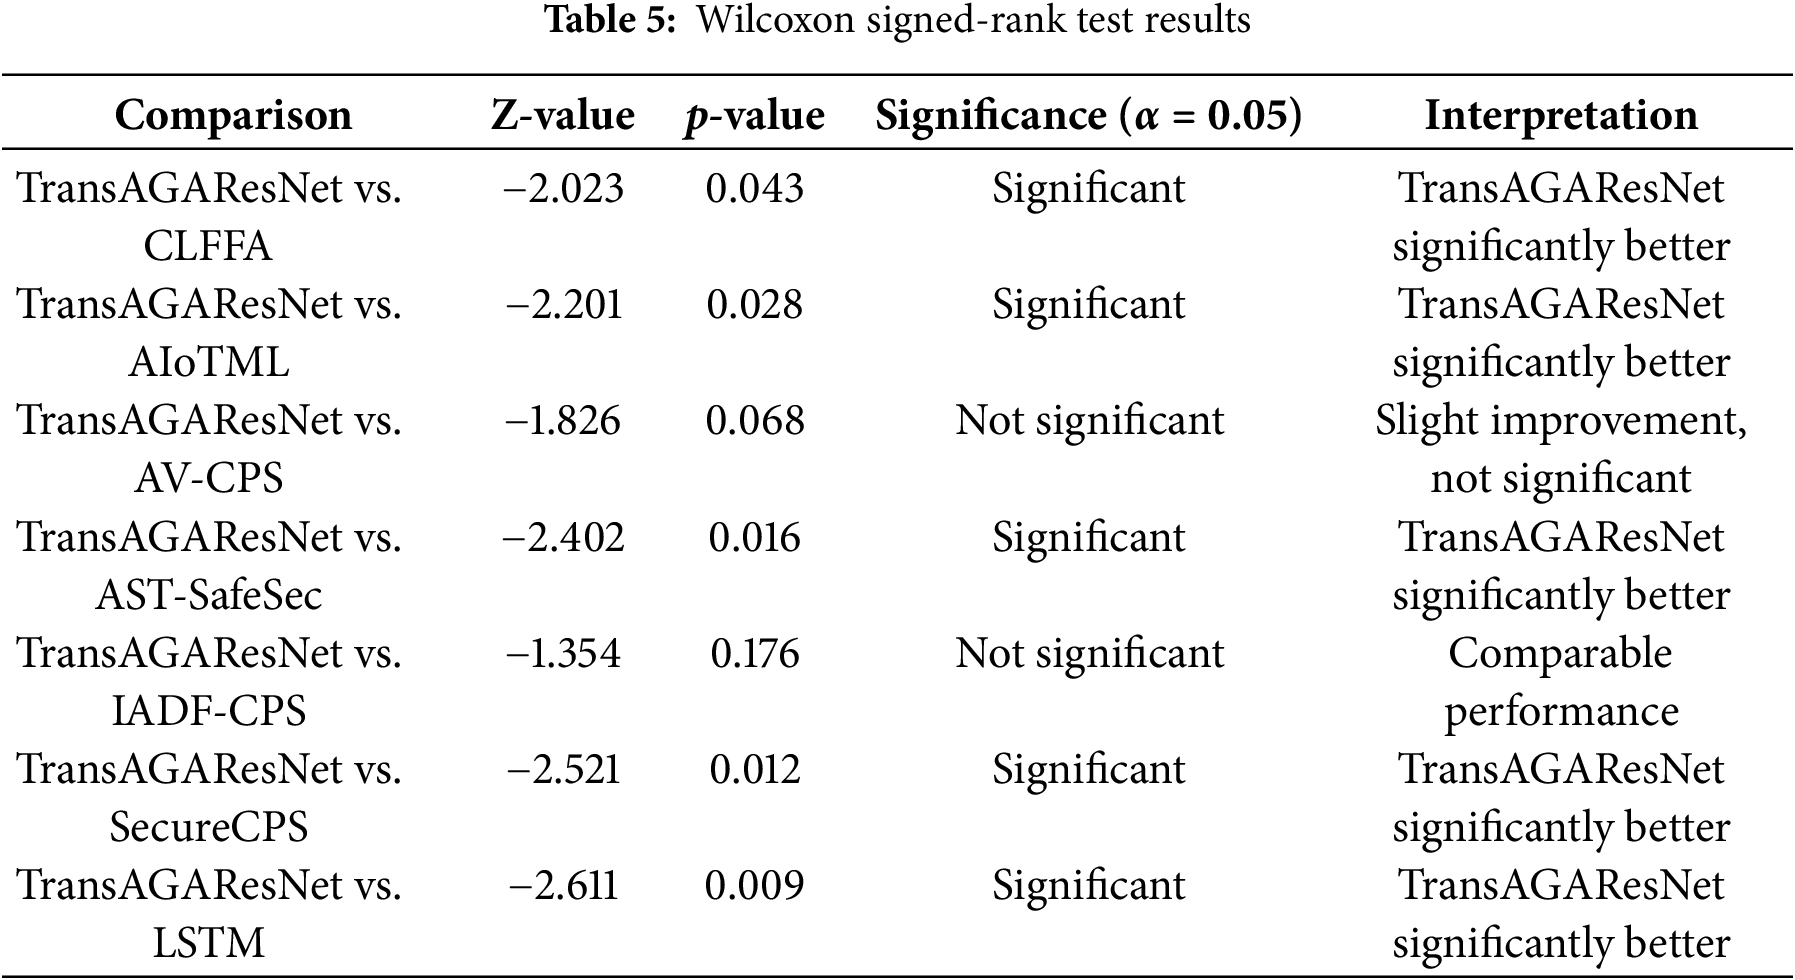
Fig. 12 presents a comparative performance analysis of the proposed Trans-AGAResNet approach against several existing methods, including CLFFA, AIoTML, AV-CPS, AST-SafeSec, IADF-CPS, SecureCPS, and LSTM. The graphical results demonstrate that the Trans-AGAResNet approach outperforms these baseline methods, achieving an accuracy of 99.25%, precision of 98.84%, sensitivity of 99.10%, specificity of 98.81%, and an F1-score of 98.96%.
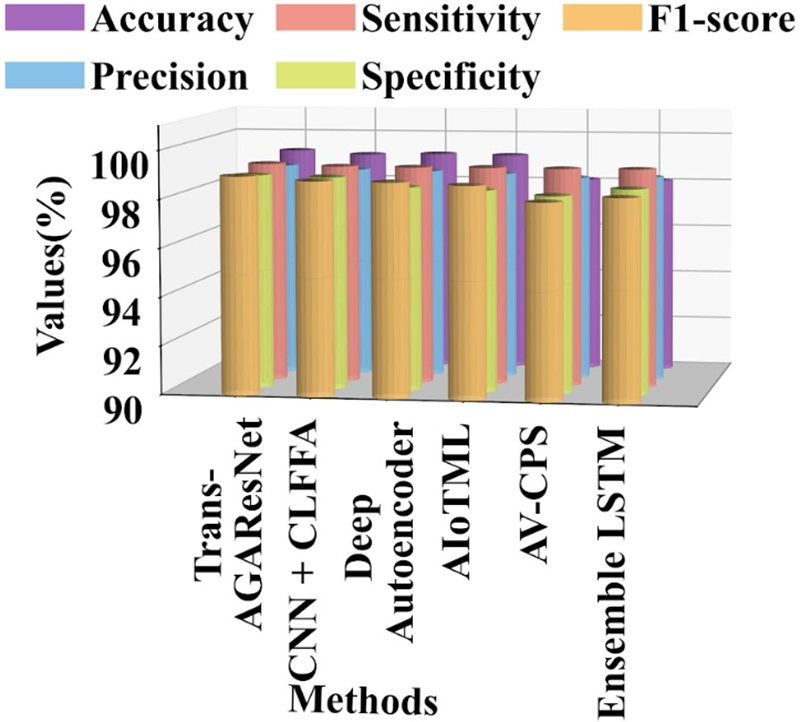
Figure 12: Comparative analysis of the proposed Trans-AGAResNet approach with other existing approaches
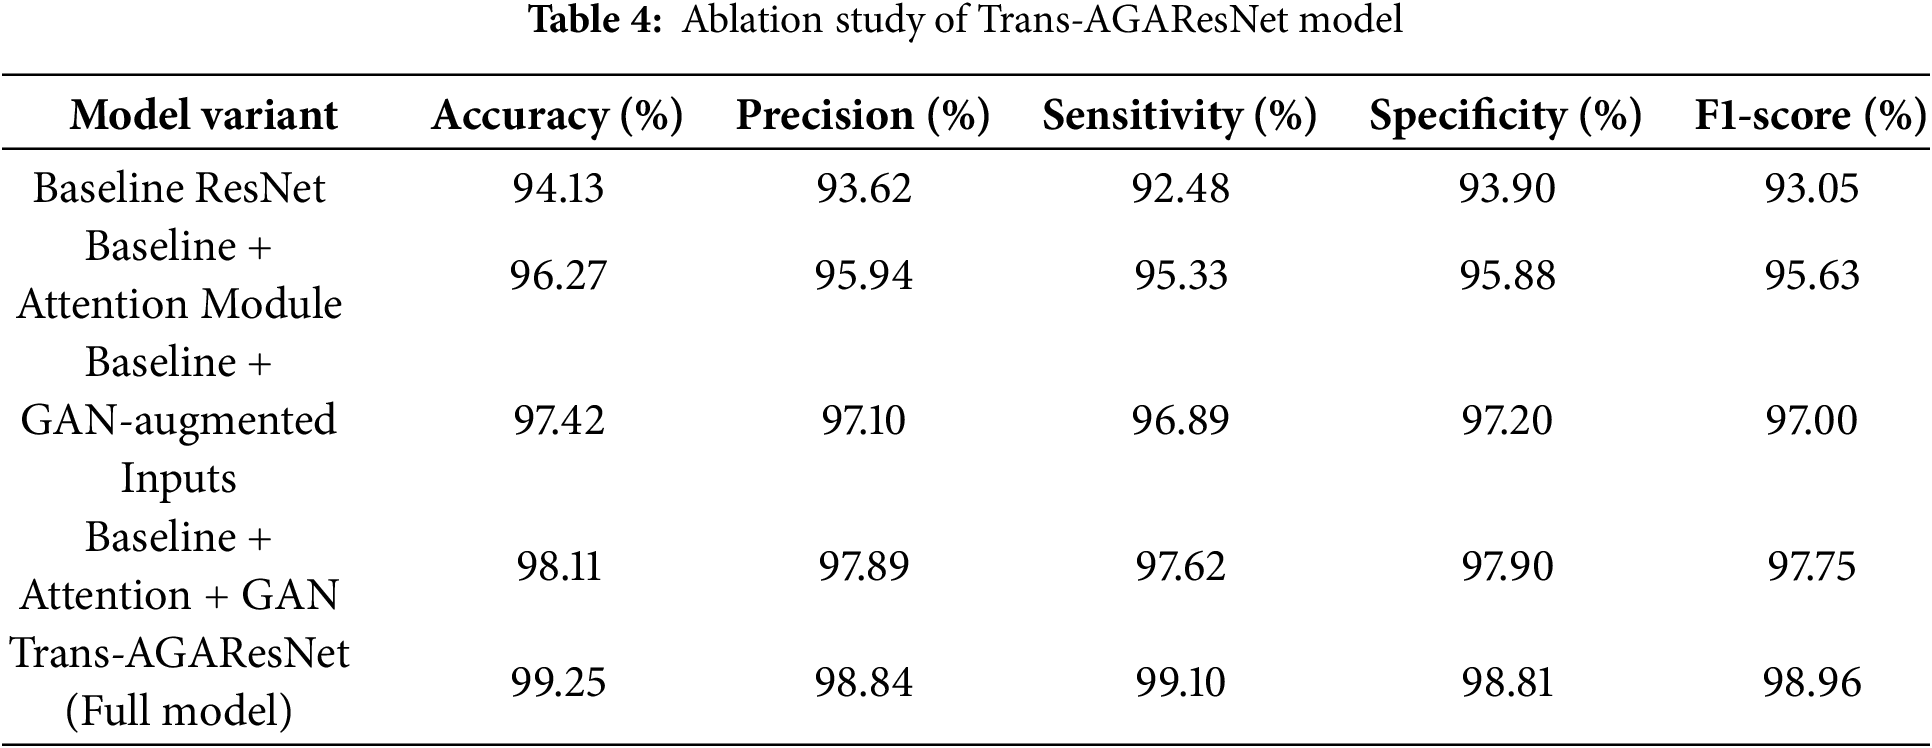
The ablation study provided in Table 4 demonstrates the incremental contributions of each component integrated into the Trans-AGAResNet model. This ablation study confirms that each enhancement contributes significantly to the overall accuracy and robustness of the model, with the full AGARes model outperforming all variants. To objectively evaluate the performance improvements contributed by each component in the proposed Trans-AGAResNet model, a baseline ResNet architecture was established. This baseline serves as a foundational convolutional neural network model without attention, GAN augmentation, or transformer modules.
The Wilcoxon Signed-Rank Test table, as mentioned in Table 5, compares the proposed Trans-AGAResNet model with each of the existing models across multiple performance metrics. The Wilcoxon test is a non-parametric pairwise test used to assess whether the performance differences between paired samples are statistically significant.
6.6 Security Specific Evaluation and Robustness Analysis
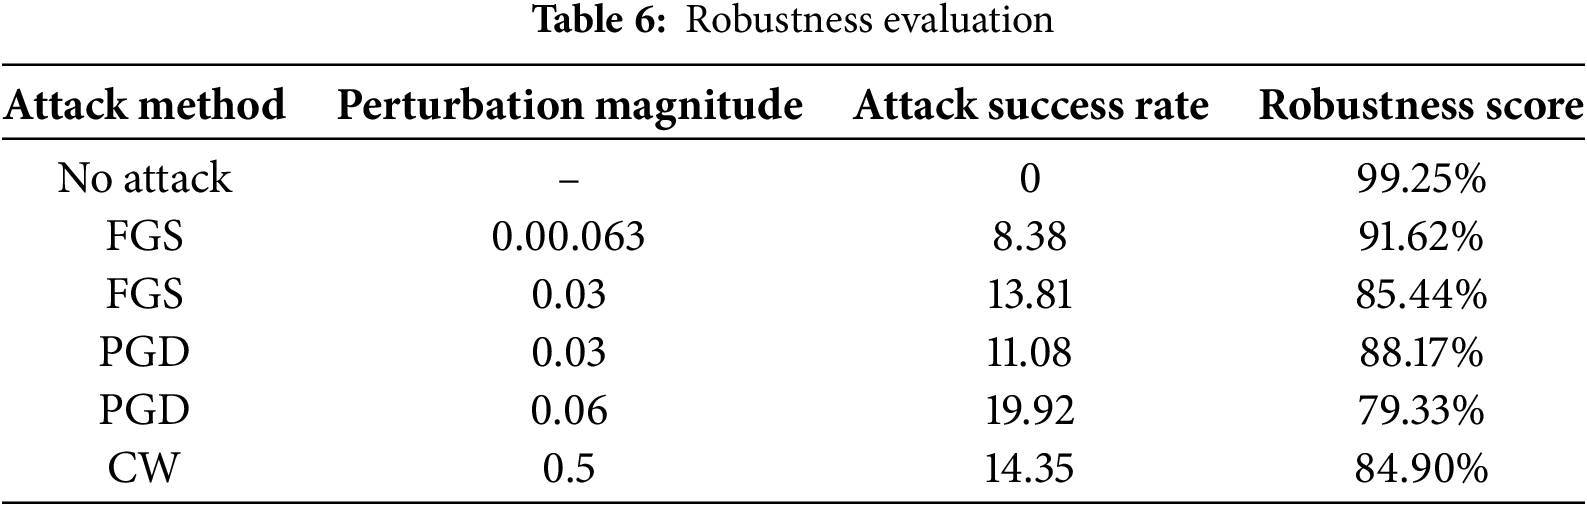
Table 6 provides the evaluation performance of the Trans-AGAResNet model under standard evaluation, and it is necessary to assess the resilience model under adversarial conditions. This analysis provides a robustness evaluation using three popular attack techniques, such as the fast gradient sign (FGS) technique, projected gradient descent (PGD), as well as Carlini-Wagner (CW) attacks. The significant objective is to determine how the perturbation affects the accuracy of the model and to assess the defense mechanisms.
Scalability and Multimodal Adaptability
The proposed Trans-AGAResNet model demonstrates strong performance in automotive CAN Bus datasets. Due to the modular structure, comprising attention layers, residual blocks, and GAN augmented inputs, the model is inherently extensible. As the number of inputs increases from heterogeneous sources such as radar and vision systems, the attention mechanism encodes multimodal dependencies. In addition to this, the utilization of a parallelizable transformer component ensures computational efficiency across distributed edge nodes. In addition to this, the Trans-AGResNet can scale to support high-dimensional, multimodal CPS data while maintaining low inference latency, making it suitable for real-time and safety-critical environments like industrial automation, smart grids, and intelligent transportation systems.
The proposed Transformer-based Attention Generative Adversarial Residual network (Trans-AGAResNet) model shows a robust solution for anomaly detection in the CPS, especially in dynamic and safety-critical environments, including automotive systems. The proposed model is integrated with the generative adversarial networks, residual networks, and attention mechanisms to effectively learn and explore the complex patterns during offline training and adapts to real-time changes in the online phase. The experimental findings demonstrate the outstanding performance of a proposed model with an accuracy of 99.25%, precision of 98.84%, sensitivity of 99.10%, specificity of 98.81%, and an F1-score of 98.96%. Therefore, the obtained results show that the proposed model effectively balances detection delay and false alarm rates while ensuring effective anomaly detection. In the future, focus on incorporating explainable AI (XAI) techniques such as SHapley Additive Explanations (SHAP) and Local Interpretable Model-Agnostic Explanations (LIME). These methods can help attribute anomaly detection to specific features (wheel speed, oil temperature) and visualize their impact on model outputs. The model’s adaptability for larger-scale CPS applications can also be enhanced by optimizing the computational efficiency in real-time resource-constrained environments.
Acknowledgement: This research was supported by the Deanship of Scientific Research, King Saud University, Saudi Arabia.
Funding Statement: The authors received no specific funding for this study.
Author Contributions: : The authors confirm contribution to the paper as follows: Abrar M. Alajlan: Conceived of the presented idea, verified the analytical methods, supervised the findings of this work, discussed the results and contributed to the final manuscript. Marwah M. Almasri: Developed the theory and performed the computations, discussed the results and contributed to the final manuscript, wrote the manuscript with support from Abrar M. Alajlan. All authors reviewed the results and approved the final version of the manuscript.
Availability of Data and Materials: All data generated or analyzed during this study are included in this published. article.
Ethics Approval: Not applicable.
Conflicts of Interest: The authors declare no conflicts of interest to report regarding the present study.
References
1. Piperigkos N, Gkillas A, Arvanitis G, Nousias S, Lalos A, Fournaris A, et al. Distributed intelligence in industrial and automotive cyber–physical systems: a review. Front Rob AI. 2024;11:1430740. doi:10.3389/frobt.2024.1430740. [Google Scholar] [PubMed] [CrossRef]
2. Dutta AK, Negi R, Shukla SK. Robust multivariate anomaly-based intrusion detection system for cyber-physical systems. In: International Symposium on Cyber Security Cryptography and Machine Learning. Cham: Springer International Publishing; 2021 Jul. p. 86–93. [Google Scholar]
3. Alohali MA, Al-Wesabi FN, Hilal AM, Goel S, Gupta D, Khanna A. Artificial intelligence enabled intrusion detection systems for cognitive cyber-physical systems in industry 4.0 environment. Cogn Neurodyn. 2022;16(5):1045–57. doi:10.1007/s11571-022-09780-8. [Google Scholar] [PubMed] [CrossRef]
4. Noor Z, Hina S, Hayat F, Shah GA. An intelligent context-aware threat detection and response model for smart cyber-physical systems. Internet Things. 2023;23(2):100843. doi:10.1016/j.iot.2023.100843. [Google Scholar] [CrossRef]
5. Saheed YK, Abdulganiyu OH, Majikumna KU, Mustapha M, Workneh AD. ResNet50-1D-CNN: a new lightweight resNet50-One-dimensional convolution neural network transfer learning-based approach for improved intrusion detection in cyber-physical systems. Int J Crit Infrastruct Prot. 2024;45(2):100674. doi:10.1016/j.ijcip.2024.100674. [Google Scholar] [CrossRef]
6. Giannaros A, Karras A, Theodorakopoulos L, Karras C, Kranias P, Schizas N, et al. Autonomous vehicles: sophisticated attacks, safety issues, challenges, open topics, blockchain, and future directions. J Cybersecur Priv. 2023;3(3):493–543. doi:10.3390/jcp3030025. [Google Scholar] [CrossRef]
7. Chehida S, Rutten E, Giraud G, Mocanu S. A model-based approach for self-adaptive security in CPS: application to smart grids. J Syst Archit. 2024;150(1):103118. doi:10.1016/j.sysarc.2024.103118. [Google Scholar] [CrossRef]
8. Quadar N, Chehri A, Debaque B, Ahmed I, Jeon G. Intrusion detection systems in automotive ethernet networks: challenges, opportunities and future research trends. IEEE Internet Things Mag. 2024;7(2):62–8. doi:10.1109/iotm.001.2300109. [Google Scholar] [CrossRef]
9. Adil M, Farouk A, Abulkasim H, Ali A, Song H, Jin Z. NG-ICPS: next generation industrial-CPS, security threats in the era of artificial intelligence, open challenges with future research directions. IEEE Internet Things J. 2024;12(2):1343–67. doi:10.1109/jiot.2024.3486659. [Google Scholar] [CrossRef]
10. Chae J, Lee S, Jang J, Hong S, Park KJ. A survey and perspective on Industrial Cyber-Physical Systems (ICPSfrom ICPS to AI-augmented ICPS. IEEE Trans Ind Cyb-Phy Syst. 2023;1(1):257–72. doi:10.1109/ticps.2023.3323600. [Google Scholar] [CrossRef]
11. Hu S, Zou F, Xiao Y, Ke H, Wang J. Integrating embedded cyber-physical systems in smart energy for AI-enhanced real-time crowd monitoring and threat detection. IEEE Trans Consum Electron. 2025. doi:10.1109/TCE.2025.3576383. [Google Scholar] [CrossRef]
12. Gupta BB, Gaurav A, Chui KT, Arya V. Deep learning model for driver behavior detection in cyber-physical system-based intelligent transport systems. IEEE Access. 2024;12:62268–78. doi:10.1109/access.2024.3393909. [Google Scholar] [CrossRef]
13. Bhansali A, Patra RK, Divakarachari PB, Falkowski-Gilski P, Shivakanth G, Patil SN. CNN-CLFA: support mobile edge computing in transportation cyber physical system. IEEE Access. 2024;12:21026–37. doi:10.1109/access.2024.3361837. [Google Scholar] [CrossRef]
14. Alsaade FW, Al-Adhaileh MH. Cyber attack detection for self-driving vehicle networks using deep autoencoder algorithms. Sensors. 2023;23(8):4086. doi:10.3390/s23084086. [Google Scholar] [PubMed] [CrossRef]
15. AlEisa HN, Alrowais F, Allafi R, Almalki NS, Faqih R, Marzouk R, et al. Transforming transportation: safe and secure vehicular communication and anomaly detection with intelligent cyber–physical system and deep learning. IEEE Trans Consum Electron. 2023;70(1):1736–46. doi:10.1109/tce.2023.3325827. [Google Scholar] [CrossRef]
16. Hu M, Cao E, Huang H, Zhang M, Chen X, Chen M. AIoTML: a unified modeling language for AIoT-based cyber–physical systems. IEEE Trans Comput Aided Des Integr Circuits Syst. 2023;42(11):3545–58. doi:10.1109/tcad.2023.3264786. [Google Scholar] [CrossRef]
17. Alsulami AA, Al-Haija QA, Alturki B, Alqahtani A, Alsini R. Security strategy for autonomous vehicle cyber-physical systems using transfer learning. J Cloud Comput. 2023;12(1):181. doi:10.21203/rs.3.rs-2301648/v1. [Google Scholar] [CrossRef]
18. Guo J, Li L, Wang J, Li K. Cyber-physical system-based path tracking control of autonomous vehicles under cyber-attacks. IEEE Trans Ind Inform. 2022;19(5):6624–35. doi:10.1109/tii.2022.3206354. [Google Scholar] [CrossRef]
19. Conrad C, Al-Rubaye S, Tsourdos A. Intelligent embedded systems platform for vehicular cyber-physical systems. Electronics. 2023;12(13):2908. doi:10.3390/electronics12132908. [Google Scholar] [CrossRef]
20. Kaloudi N, Li J. AST-SafeSec: adaptive stress testing for safety and security co-analysis of cyber-physical systems. IEEE Trans Inf Forensics Secur. 2023;18:5567–79. doi:10.1109/tifs.2023.3309160. [Google Scholar] [CrossRef]
21. Nagarajan SM, Deverajan GG, Bashir AK, Mahapatra RP, Al-Numay MS. IADF-CPS: intelligent anomaly detection framework towards cyber physical systems. Comput Commun. 2022;188(2):81–9. doi:10.1016/j.comcom.2022.02.022. [Google Scholar] [CrossRef]
22. Makkar A, Park JH. SecureCPS: cognitive inspired framework for detection of cyber attacks in cyber–physical systems. Inf Process Manag. 2022;59(3):102914. doi:10.1016/j.ipm.2022.102914. [Google Scholar] [CrossRef]
23. Ramana TV, Thirunavukkarasan M, Mohammed AS, Devarajan GG, Nagarajan SM. Ambient intelligence approach: Internet of Things based decision performance analysis for intrusion detection. Comput Commun. 2022;195(1):315–22. doi:10.1016/j.comcom.2022.09.007. [Google Scholar] [CrossRef]
24. Akowuah F, Kong F. Real-time adaptive sensor attack detection in autonomous cyber-physical systems. In: 2021 IEEE 27th Real-Time and Embedded Technology and Applications Symposium (RTAS); 2021 May 18–21; Nashville, TN, USA: IEEE. p. 237–50. [Google Scholar]
25. Li B, Cheng F, Cai H, Zhang X, Cai W. A semi-supervised approach to fault detection and diagnosis for building HVAC systems based on the modified generative adversarial network. Energy Build. 2021;246(3):111044. doi:10.1016/j.enbuild.2021.111044. [Google Scholar] [CrossRef]
26. Yan Z, Liu H, Li T, Li J, Wang Y. Two dimensional correlation spectroscopy combined with ResNet: efficient method to identify bolete species compared to traditional machine learning. LWT. 2022;162(1):113490. doi:10.1016/j.lwt.2022.113490. [Google Scholar] [CrossRef]
27. Ullah F, Ullah S, Srivastava G, Lin JCW. IDS-INT: intrusion detection system using transformer-based transfer learning for imbalanced network traffic. Digit Commun Netw. 2024;10(1):190–204. doi:10.1016/j.dcan.2023.03.008. [Google Scholar] [CrossRef]
28. Ngo HC, Sek YW. Adopting attention and cross-layer features for fine-grained representation. IEEE Access. 2022;10(1):82376–83. doi:10.1109/access.2022.3195907. [Google Scholar] [CrossRef]
Cite This Article
 Copyright © 2025 The Author(s). Published by Tech Science Press.
This work is licensed under a Creative Commons Attribution 4.0 International License , which permits unrestricted use, distribution, and reproduction in any medium, provided the original work is properly cited.
 Downloads
 Citation Tools