
 Submit a Paper
 Propose a Special lssue
 Open Access
ARTICLE

The Flow Behavior Investigation of 5754 Aluminum Alloy Based on ACO-BP-ANN
1 College of Intelligent Manufacturing, Anhui Science and Technology University, Chuzhou, 233100, China
2 College of Information and Data Science, King Mongkut’s University of Technology North Bangkok (KMUTNB), Bangkok, 10250, Thailand
3 Graduate School, Stamford International University, Bangkok, 10250, Thailand
* Corresponding Author: Tengjiao Hong. Email:
(This article belongs to the Special Issue: Applications of Neural Networks in Materials)
Computers, Materials & Continua 2025, 85(3), 4551-4570. https://doi.org/10.32604/cmc.2025.069565
Received 26 June 2025; Accepted 09 September 2025; Issue published 23 October 2025
 View Full Text
 Download PDF
Abstract
The complex phenomena that occur during the plastic deformation process of aluminum alloys, such as strain rate hardening, dynamic recovery, recrystallization, and damage evolution, can significantly affect the properties of these alloys and limit their applications. Therefore, studying the high-temperature flow stress characteristics of these materials and developing accurate constitutive models has significant scientific research value. In this study, quasi-static tensile tests were conducted on 5754 aluminum alloy using an electronic testing machine combined with a high-temperature environmental chamber to explore its plastic flow behavior under main deformation parameters (such as deformation temperatures, strain rates, and strain). On the basis of true strain-stress data, a BP neural network constitutive model of the alloy was built, aiming to reveal the influence laws of main deformation parameters on flow stress. To further improve the model performance, the ant colony optimization algorithm is introduced to optimize the BP neural network constitutive model, and the relationship between the prediction stability of the model and the parameter settings is explored. Furthermore, the predictability of the two models was evaluated by the statistical indicators, including the correlation coefficient (R2), RMSE, MAE, and confidence intervals. The research results indicate that the prediction accuracy, stability, and generalization ability of the optimized BP neural network constitutive model have been significantly enhanced.Keywords
With the implementation of the “dual carbon” policy, environmental pressures are intensifying, leading to urgent demands for fuel efficiency and low emissions in industries such as automotive, maritime, and aerospace. This has accelerated the widespread adoption of lightweight materials like aluminum alloys in industrial production [1,2]. However, complex phenomena occurring during their plastic deformation—such as strain rate hardening, dynamic recovery, recrystallization, and damage evolution significantly impact the properties of these alloys [3]. Consequently, investigating high-temperature flow stress characteristics and developing accurate constitutive models for these materials holds substantial scientific research value. It also provides critical guidance for optimizing plastic forming process parameters and enhancing mechanical properties. Huang et al. [4] proposed a physical constitutive model that characterizes dislocation density evolution resulting from strain hardening and dynamic recovery behavior by employing the relationship between flow stress and dislocation density as an internal state variable. Hong et al. [5] conducted isothermal compression tests to investigate the dynamic recrystallization behavior of Al-Zn-Mg-Cu-Er-Zr alloy. Their findings indicated that reducing the strain rate and increasing the deformation temperature can promote continuous dynamic recrystallization (CDRX). Kawałek et al. [6] employed the least squares method to ascertain parameter values for the constitutive model pertaining to 5754 aluminum alloy. Huang and Liu [7] integrated the constitutive model into the general finite element analysis software ABAQUS through a user-defined UHARD subroutine to predict the hot working processes involving aluminum alloy.
In recent years, Artificial Neural Network (ANN) models have been utilized to address input-output mapping challenges as well as process parameter optimization issues. The BP-ANN model, recognized for its high prediction accuracy and straightforward operation, is extensively utilized in the development of material constitutive models aimed at forecasting the flow stress of materials subjected to complex deformation mechanisms. Lv et al. [8] established a constitutive model for Al-Cu-Mn-Mg alloy utilizing the BP neural network alongside the Arrhenius constitutive equation. Their research demonstrated that the BP-ANN model exhibited superior accuracy in predicting flow stress. Zhang et al. [9] established the Arrhenius model, modified the Johnson-Cook model, and enhanced a BP neural network model using the Sparrow Search Algorithm (SSA-BP) to predict high-temperature flow stress in two-phase titanium alloys. The findings indicated that the SSA-BP model achieved higher prediction accuracy and was capable of forecasting microstructure evolution during hot compression deformation processes of titanium alloys. Liu et al. [10] formulated a constitutive model addressing the hot forming characteristics of 6061-T6 aluminum alloy based on BP-ANN and applied this constitutive framework to numerical simulations of nonisothermal hydraulic forming processes involving this alloy. Jing et al. [11] and Huang et al. [12] developed high-temperature models for 925 alloy and 5754 aluminum alloy respectively by employing genetic algorithm-enhanced BP neural networks. The outcomes from these studies indicate that genetic algorithms could further raise both accuracy and stability within neural network models. Abdelhakim et al. [13] used Gaussian Process Regression (GPR), Neural Network (NN), and Boosting Tree (BST) machine learning techniques to predict the stress-strain response of Al6061-T6 in the temperature range of 25°C to 300°C. The research results indicate that machine learning methods have great potential in predicting material strain stress, and neural network models have the best predictive performance. Based on the experimental data of tension torsion and compression torsion, Tasdemir et al. [14] established a strain control surrogate model based on feedforward neural network, including a classification network for distinguishing elastic aging and elastic-plastic increment, and a regression network for calculating the functional relationship between stress aging and total strain increment, to study the strain and stress space of aluminum alloy materials under elastic and elastic states. Bhat et al. [15] partitioned the alloy dataset based on similarity and trained regressors for individual partitions. The research results showed that the data-driven partitioning scheme outperformed traditional domain knowledge-based partitioning, improving the accuracy and interpretability of machine learning models.
5754 is classified as a thermally non-strengthening aluminum alloy characterized by its high strength, excellent weldability, and corrosion resistance properties. It finds widespread application in automotive interior and exterior covers as well as aircraft skins [16,17]. To investigate the plastic properties and rheological characteristics of 5754 aluminum alloy sheets, a commercial 5754 aluminum plate with a thickness of 1.5 mm was selected as the research subject to examine its flow stress behavior under the main deformation parameters. On the basis of experimental data, a thermal tensile constitutive model for the 5754 alloy was established using both BP neural networks and ACO-improved BP neural networks. The accuracy and stability of the BP-ANN model were further evaluated.
2 Experimental Materials and Methods
In this study, 5754 aluminum alloy was chosen as the material of interest, characterized by its chemical composition (mass fraction in %: Si, 0.15; Mg, 2.85; Cu, 0.07; Mn, 0.21; Fe, 0.18; Cr, 0.09; Zn, 0.05; Ti, 0.05; Al balance). A tensile specimen was machined from a sheet of this alloy using wire cutting techniques. The length of the central test section of the specimen measured 34 mm, with specific dimensions illustrated in Fig. 1.

Figure 1: Geometric dimensions of tensile specimen (unit: mm)
Hot tensile tests on specimens made from the 5754 aluminum alloy were conducted utilizing a UTM5105 tensile testing machine equipped with an environmental chamber at deformation temperatures ranging from 150°C to 300°C and strain rates varying between 0.0001 and 0.01 s−1. The strain and strain rate are inferred from the crosshead displacement of the testing machine. The entire stretching process took place within an environmental chamber where samples were heated from room temperature (20°C) to their designated temperatures before being held isothermally for ten minutes prior to conducting the tensile tests.
3 Experimental Results and Analysis
According to the conversion relationship between true stress σt-true strain εt and engineering stress σ-engineering strain ε,

Figure 2: True stress-strain curves for 5754 alloy under key deformation conditions: (a): 150°C; (b): 200°C; (c): 250°C; (d): 300°C
Upon entering plastic deformation, materials initially undergo a hardening stage characterized by a rapid increase in dislocation density. This leads to dislocation entanglement and heightened resistance to dislocation movement. As plastic deformation continues, however, dislocation structures begin to reconstruct and annihilate; consequently, the rate of flow stress increase decelerates [18]. When increments and annihilations of dislocations achieve dynamic equilibrium, the growth rate of flow stress diminishes; thus, achieving a balance between the material’s strain hardening and dynamic softening processes allows for stabilization within material deformation [19]. When the deformation temperature reaches 200°C, the true stress-strain curve attains its peak, after which the flow stress begins to gradually decrease as true strain increases. Under conditions of high deformation temperature and low strain rate, a pronounced dynamic softening phenomenon is observed. Specifically, at a deformation temperature of 300°C and strain rates of 0.0001, 0.0005, and 0.001 s−1, the flow stress of the alloy exhibits significant softening behavior. As actual strain continues to rise, flow stress starts to decline. Notably, lower strain rates correspond to greater rates of decrease in flow stress. This occurs because at low strain rates, crystals within the material require considerable time for complete growth and undergo dynamic recrystallization more extensively than work hardening can compensate for resulting in an enhanced softening effect [20]. Consequently, the true stress-strain curve demonstrates a downward trend. Select the true stress-strain curve under the conditions of deformation temperature of 300°C and strain rate of 0.0005 s−1, and draw the work hardening rate curve in Origin software, as shown in the following Fig. 3.

Figure 3: Work hardening rate curve
A lower work-hardening rate curve may indicate that the material is easy to shape. Complex processing techniques may lead to more complex curve shapes. The purity of the material also affects the work hardening rate curve. The descending part of the hardening rate curve indicates that the material may have softened. This indirectly indicates that the 5754 alloy undergoes dynamic recrystallization and dynamic recovery softening at a temperature of 300°C. As the deformation temperature increases and the strain rate further decreases, these phenomena become increasingly pronounced.
The temperature-dependent curves depicting tensile yield stress, ultimate tensile stress, and uniform elongation for the 5754 alloy were derived from hot tensile testing, as illustrated in Fig. 4.

Figure 4: (a) Tensile yield stress, (b) Ultimate tensile stress and (c) Uniform elongation of 5754 alloy under principal deformation parameters
From the curves presented in Fig. 4a,b, it is evident that, under identical strain rate conditions, the strength of 5754 alloys progressively decreases with an increase in deformation temperature. This observation suggests that the reduction in tensile yield stress and tensile stress of the alloy during the tensile process is influenced by factors such as the degree of deformation, stress state, and characteristics of the deformation microstructure. Under consistent deformation temperature conditions, however, the strength of 5754 alloys exhibits an increasing trend with rising strain rate. The uniform elongation curve depicted in Fig. 4c indicates that at equivalent strain rate conditions, the uniform elongation of 5754 alloys generally increases as deformation temperature rises. Conversely, at a constant deformation temperature, there is a noticeable decline in uniform elongation with increasing strain rate. Furthermore, the uniform elongation values reported in Fig. 4c approach, and in some cases exceed, 100%, which appears inconsistent with the ultimate strain values shown in Fig. 2, where the maximum is approximately 85%. This discrepancy may be due to the superplasticity deformation of the material under specific conditions (high temperature, slow strain rate).
4 Constitutive Relationship Model for 5754 Aluminum Alloy
The experimental results regarding the deformation behavior of 5754 aluminum alloy sheets during tensile testing reveal that the flow stress σ is significantly influenced by the main deformation parameters during uniaxial tension. Consequently, establishing a theoretical analysis model capable of comprehensively reflecting how these primary deformation parameters affect rheological stress σ will facilitate a deeper understanding of flow stress characteristics for 5754 alloy during hot tensile deformation.
A constitutive relationship model for 5754 alloys under various hot deformation conditions has been developed using BP-ANN, and a three-layer BP-ANN constitutive model has been constructed as illustrated in Fig. 5.

Figure 5: Topological structure of BP-ANN model
In this constructed BP neural network model, the input layer comprises three nodes, while the output layer contains one node. The number of hidden layer nodes serves as a critical factor influencing neural network performance; typically, an increase in hidden layer neuron nodes enhances both prediction accuracy and effectiveness within the BP neural network framework.
However, too many neuron nodes can lead to overfitting problems and significantly increase the training time of the neural network. Therefore, in this study, mean square error (MSE) was taken as the objective, and different numbers of hidden layer nodes (4, 6, 8, 10, 12, 14) were selected through the empirical Formula (1) for network training. The models were compared, their predictive performance was evaluated, and the optimal number of hidden layer nodes was obtained.
In this context, M represents the number of nodes in the hidden layer, N denotes the number of nodes in the input layer, L indicates the number of nodes in the output layer, and a signifies a constant with a value range from 1 to 10.
For training and validating the BP neural network, 720 sets of data were randomly selected from a total of 800 samples obtained through hot tensile testing of 5754 aluminum alloy. The remaining sample set was utilized for model testing. Throughout this research process, the training objective for the BP neural network model was established at 10−5, with a learning rate set to 0.1, encompassing 1000 iterations and allowing for up to six validation failures.
The performance metrics for neural networks are primarily represented by the mean square error (MSE) between predicted values and experimental results. The MSE curves for BP-ANN models featuring varying numbers of neurons have been calculated and are presented in Fig. 6.

Figure 6: MSE for BP neural network model with different neuron counts: (a): 4; (b): 6; (c): 8; (d): 10; (e): 12; (f): 14
As illustrated in Fig. 6, with four hidden layer nodes after completing 31 iterations, both mean square error curves-representing neural network training errors and validation errors-converge at approximately 0.01932; however, it should be noted that mean square error for test curves remains marginally higher than this value. In contrast, with six hidden layer nodes after conducting a total of 99 iterations, these same mean square error curves converge at a lower value of approximately 0.013479. The mean square error of the test curve is slightly higher than 0.013479. The mean square error of the test curve is slightly higher than 0.013479. When the number of hidden layer nodes in the BP neural network is set to 8, the mean square error (MSE) of the training, testing, and validation curves converges to 0.023252 after 13 iterations. With 10 hidden nodes, the MSE of the training and validation curves reaches 0.011661 after 82 iterations, while the testing error remains higher than this value. When the number of hidden nodes increases to 12, the MSE of the testing and validation curves converges to 0.023252 after 116 iterations. Finally, with 14 hidden nodes, the MSE of all three curves-training, validation, and testing-converges to 0.0053024 after 118 iterations. Comparing Fig. 6a,b and d, we can find that under the same network training parameter settings, when the number of hidden layer neurons is small, the model is more likely to fall into local optima due to the limited training process, resulting in larger prediction errors and poorer convergence. Comparing Fig. 6c,e and f, we can find that under the same network training parameter settings, when the number of hidden layer neurons is large, overfitting of training data caused by long-term training processes will also occur. There are many factors that affect the stability and predictive performance of neural networks, such as data quality, model structure, parameter settings, external environmental changes, etc. In this study, the focus is on the influence of the number of hidden layer neurons on the stability and predictive performance of neural network models. When the number of hidden layer neurons is 14, the BP neural network model has the best stability and prediction performance. Therefore, the number of hidden layer neuron nodes is set to 14.
To further validate how varying numbers of hidden layer nodes influence predictive performance in BP neural network models, we compare stress fitting across training sets, validation sets, test sets, and total samples for models with differing quantities of hidden layer nodes comparison is depicted in Fig. 7.


Figure 7: BP neural network model fitting curve: (a): 4; (b): 6; (c): 8; (d): 10; (e): 12; (f): 14
From Fig. 7, it is evident that when the number of hidden layer nodes is set to 4, the fitting correlation coefficient between the output stress of the 5754 aluminum alloy sample and the predictions made by the BP neural network is 0.92072. This indicates a significant deviation between the predicted stress values for the test samples and their corresponding experimental results, which aligns with findings presented in Fig. 6a. When increasing the number of hidden layer nodes to 6, both training and validation samples exhibit fitting correlation coefficients exceeding 0.95, suggesting reduced fluctuation in prediction error. Conversely, at 8 hidden layer nodes, the fitting correlation coefficient drops slightly to 0.91995 for actual output stress predictions from aluminum alloy samples, indicating notable discrepancies between predicted stress values and experimental outcomes. The correlation coefficients R depicted in Fig. 7d–f are all greater than 0.957; this suggests that the BP-ANN model has undergone sufficient training and demonstrates commendable predictive performance for input samples once well-trained. When utilizing a configuration of 14 hidden layer nodes, the BP neural network achieves more accurate predictions regarding flow stress within alloys.
To further verify the predictive performance of the trained BP neural network on 5754 aluminum alloy samples, the output stress values of the test samples were compared with the experimental values, as shown in Fig. 8.

Figure 8: The prediction results and experimental outcomes for various deformation conditions are as follows: (a): 150°C; (b): 200°C; (c): 250°C; (d): 300°C
As shown in Fig. 8, here exists a notable deviation between predicted flow stress values for an untrained test dataset and experimental values across different configurations of hidden layer neurons within BP neural networks. Specifically, when employing 10, 12, or 14 hidden layer neurons, we observe significantly higher prediction accuracy for these test datasets compared to other neuron configurations. When the number of neurons is small, there is a trend of deviation or even serious error in the predicted flow stress of 5754 aluminum alloy, further proving the conclusion in Fig. 6. Due to the random initial weights and thresholds of BP neural networks, their prediction accuracy on untrained datasets is lower than that on training data. It is evident from this that the output stability and generalization ability of the BP neural network are relatively weak. Consequently, there is a pressing need to optimize the initial weights and thresholds of the BP neural network to improve its predictive accuracy.
4.2 BP-ANN Model Optimized by ACO Algorithm
ACO (Ant Colony Optimization Algorithm) is a swarm intelligence optimization algorithm that simulates the foraging behavior of ants. This algorithm has good robustness, parallel distributed computing capability, a positive feedback mechanism, and is easy to combine with other algorithms. It is commonly used to optimize complex problems such as vehicle scheduling, traveling salesman problems, neural network optimization, robot path planning, and fault diagnosis. In the ACO algorithm, assuming there are m ants and n cities, the distance dij between city i and city j (i, j = 1, 2, …, n), and at time t, the concentration of pheromones on the path between the two cities is τij(t), then the selection probability is:
In Eq. (2), ηis(t) is the heuristic function, and ηis(t) = 1/dis, which represents the expected degree of Ant k’s transition from city i to city j; ak represents the collection of cities that Ant k has not visited; α represents the pheromone factor; β is the heuristic function factor.
The release of pheromones by ants and the volatilization of pheromones along the path occur simultaneously. The parameter ρ (0 < ρ < 1) represents the degree of pheromone volatilization, and since pheromones change with every movement of ants, the specific update formula is as follows:
In Eq. (3),
It is more appropriate to use the global mean square error function of the network as the fitness function, and the specific formula is as follows:
In Eq. (4), N is the number of samples in the training set; oi is the actual output value of the i-th training sample; and di is the expected output value of the i-th training sample.
By leveraging the global optimization capabilities of the ant colony algorithm, the randomly generated weights and thresholds in the BP neural network are optimized to identify superior weights and thresholds. This approach mitigates the local minimum problem encountered during BP neural network training, thereby enhancing both prediction accuracy and generalization performance of the neural network model. The process of optimizing the BP neural network (ACO-BP) using the ant colony algorithm is illustrated in Fig. 9.

Figure 9: Flow chart of the ACO algorithm optimizing BP neural network
The parameters of the ant colony algorithm in this study include the number of ants, the number of ant movements, the pheromone utilization coefficient, and the transition probability constant, which are set to 10, 20, 0.9, and 0.21, respectively. The range of weight and threshold values was [−8, 8]. Use the optimized BP neural network model with the ant colony algorithm for prediction, and conduct error analysis and comparison with the prediction results of the BP neural network. The mean square error curve and sample fitting curve of the ACO-BP-ANN model are shown in Figs. 10 and 11, respectively.


Figure 10: MSE of ACO-BP with different neuron numbers: (a): 4; (b): 6; (c): 8; (d): 10; (e): 12; (f): 14
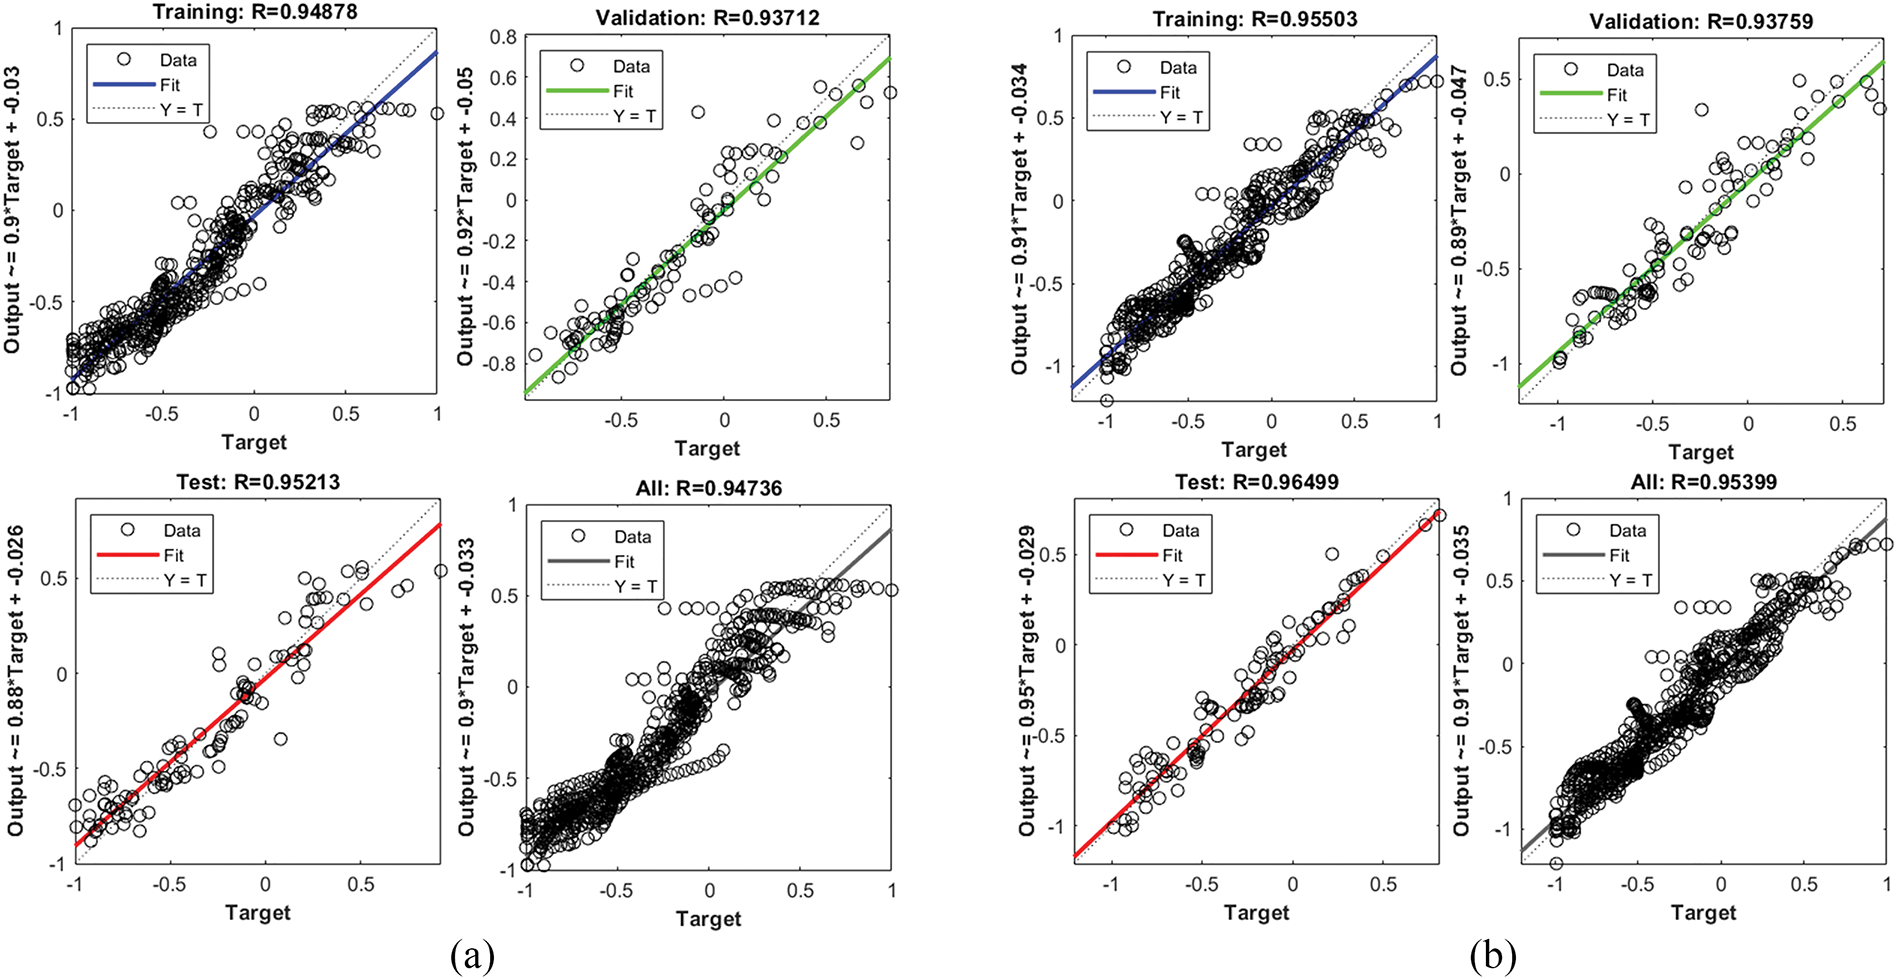
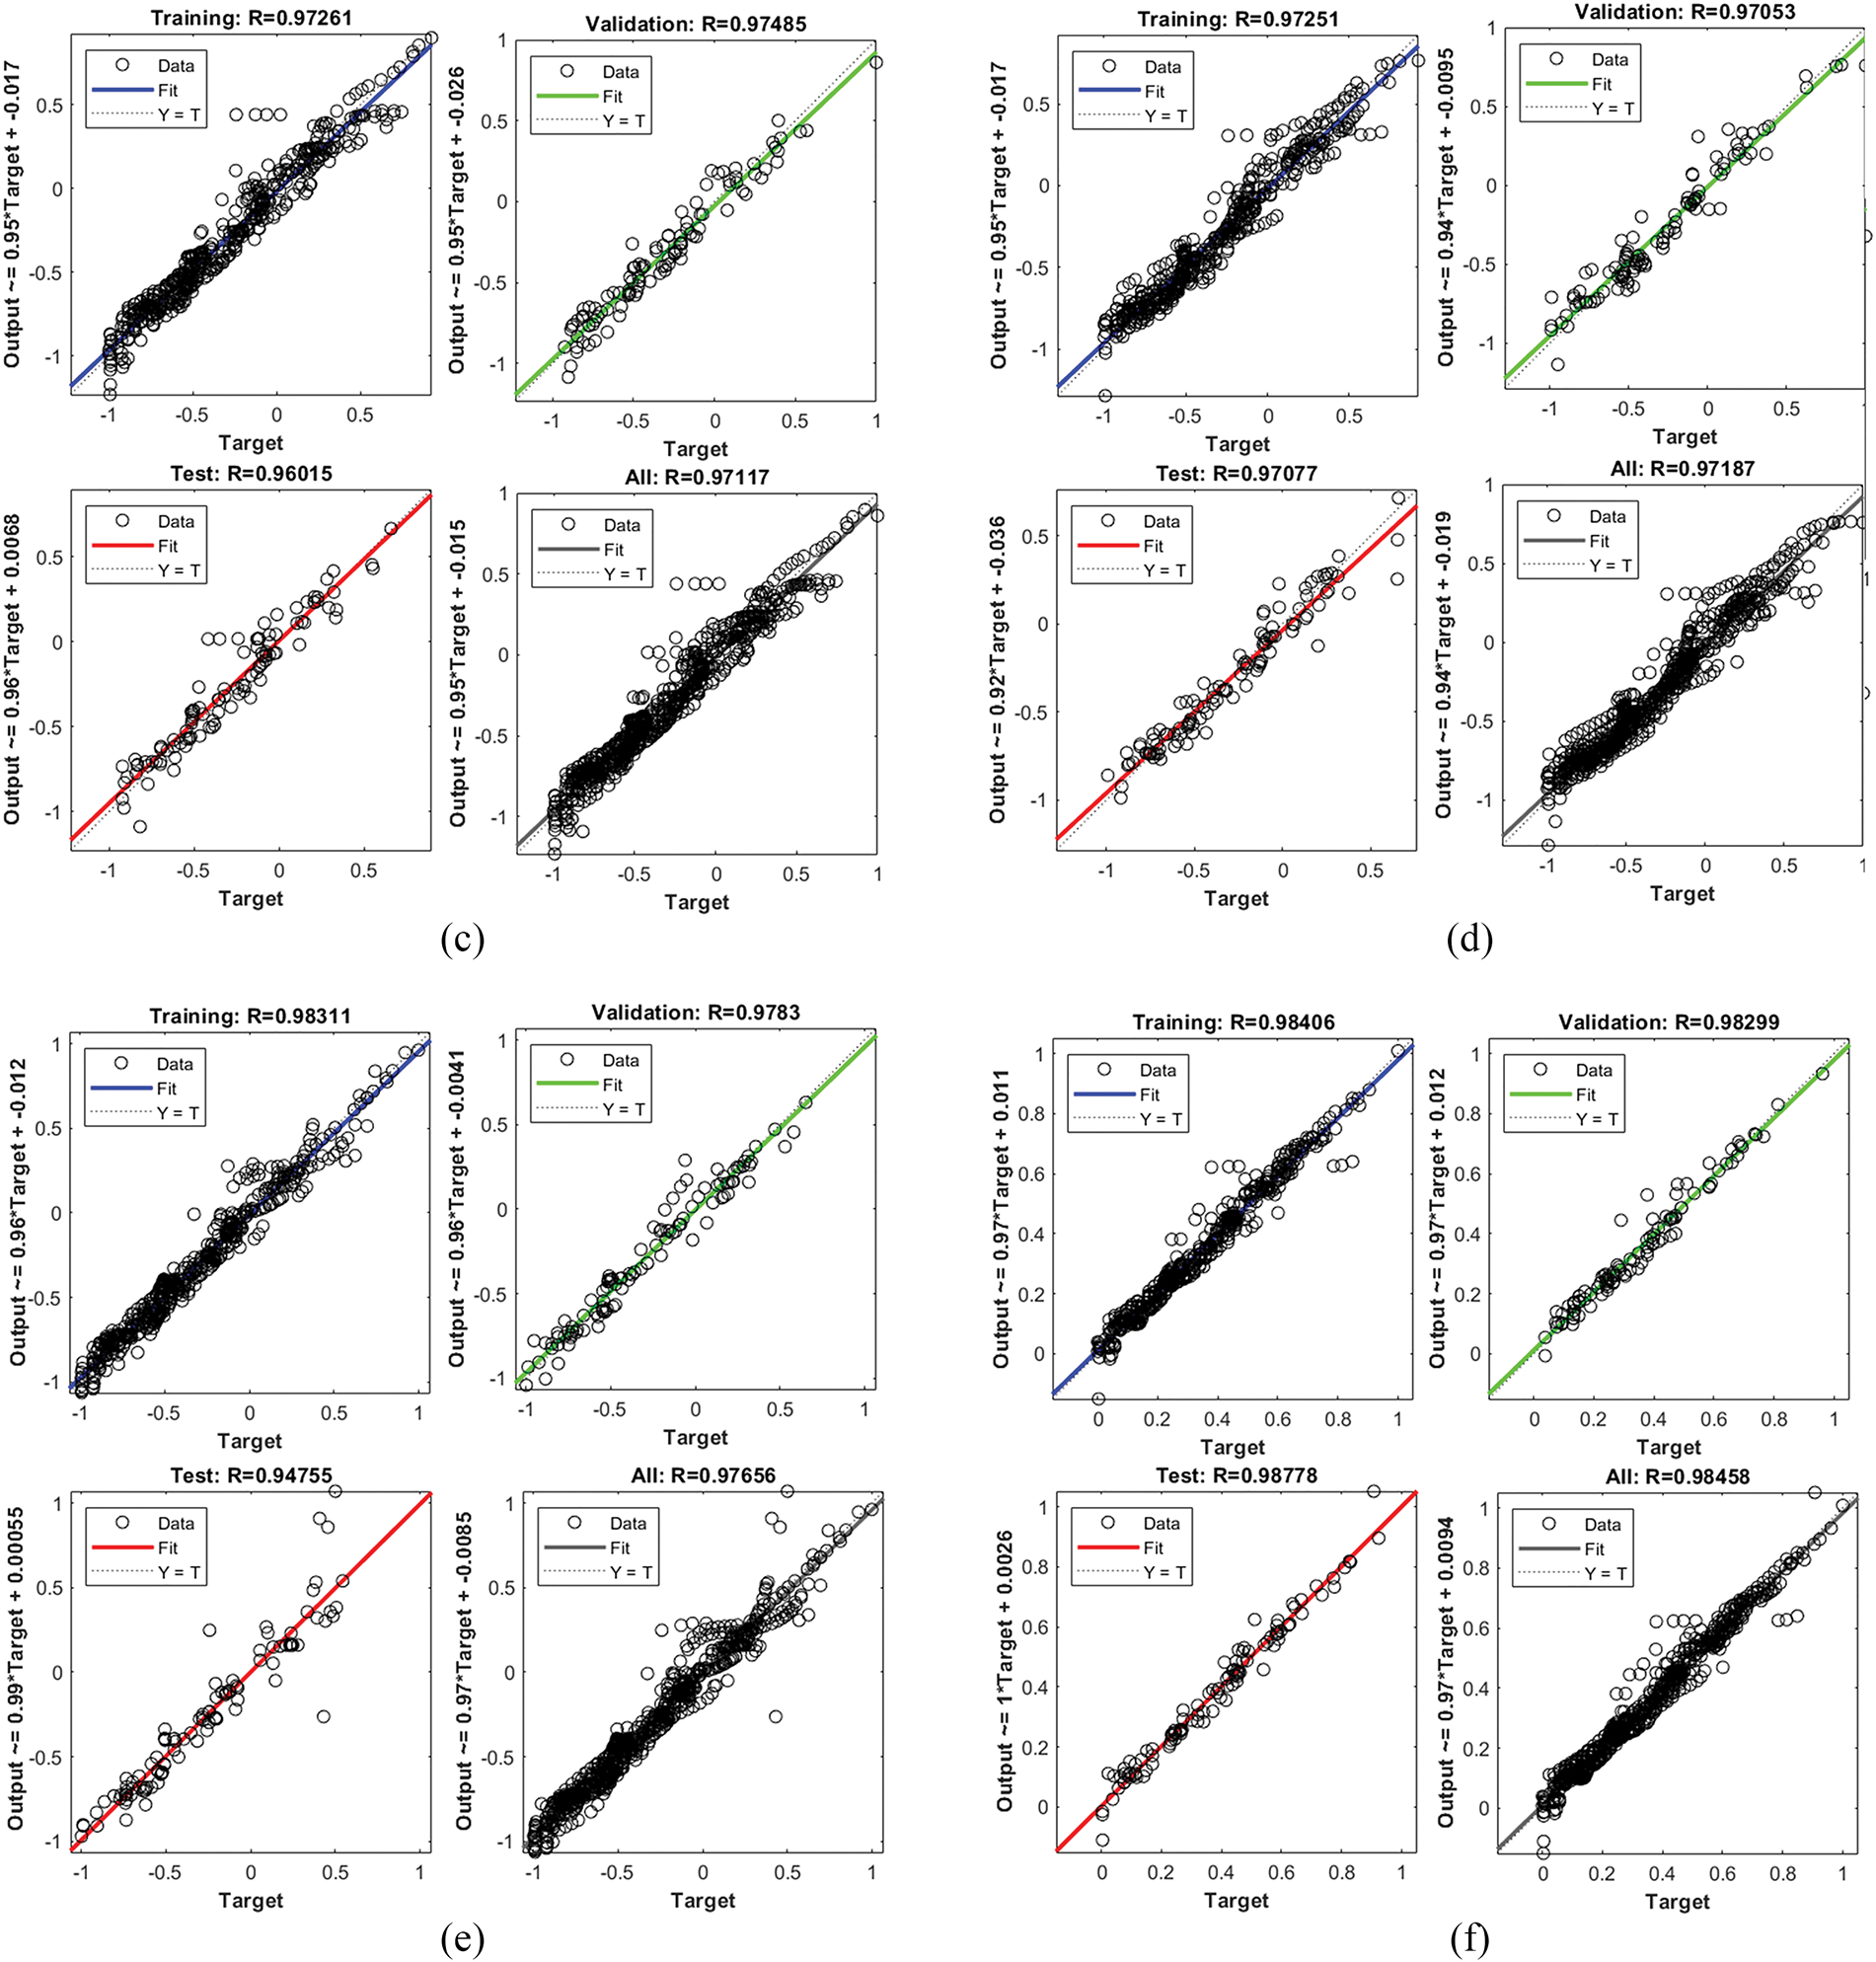
Figure 11: The fitting curves of ACO-BP neural network model: (a): 4; (b): 6; (c): 8; (d): 10; (e): 12; (f): 14
To further verify the predictive performance of the trained ACO-BP neural network on 5754 aluminum alloy samples, the output stress values of the test samples were compared with the experimental values, as shown in Fig. 12.
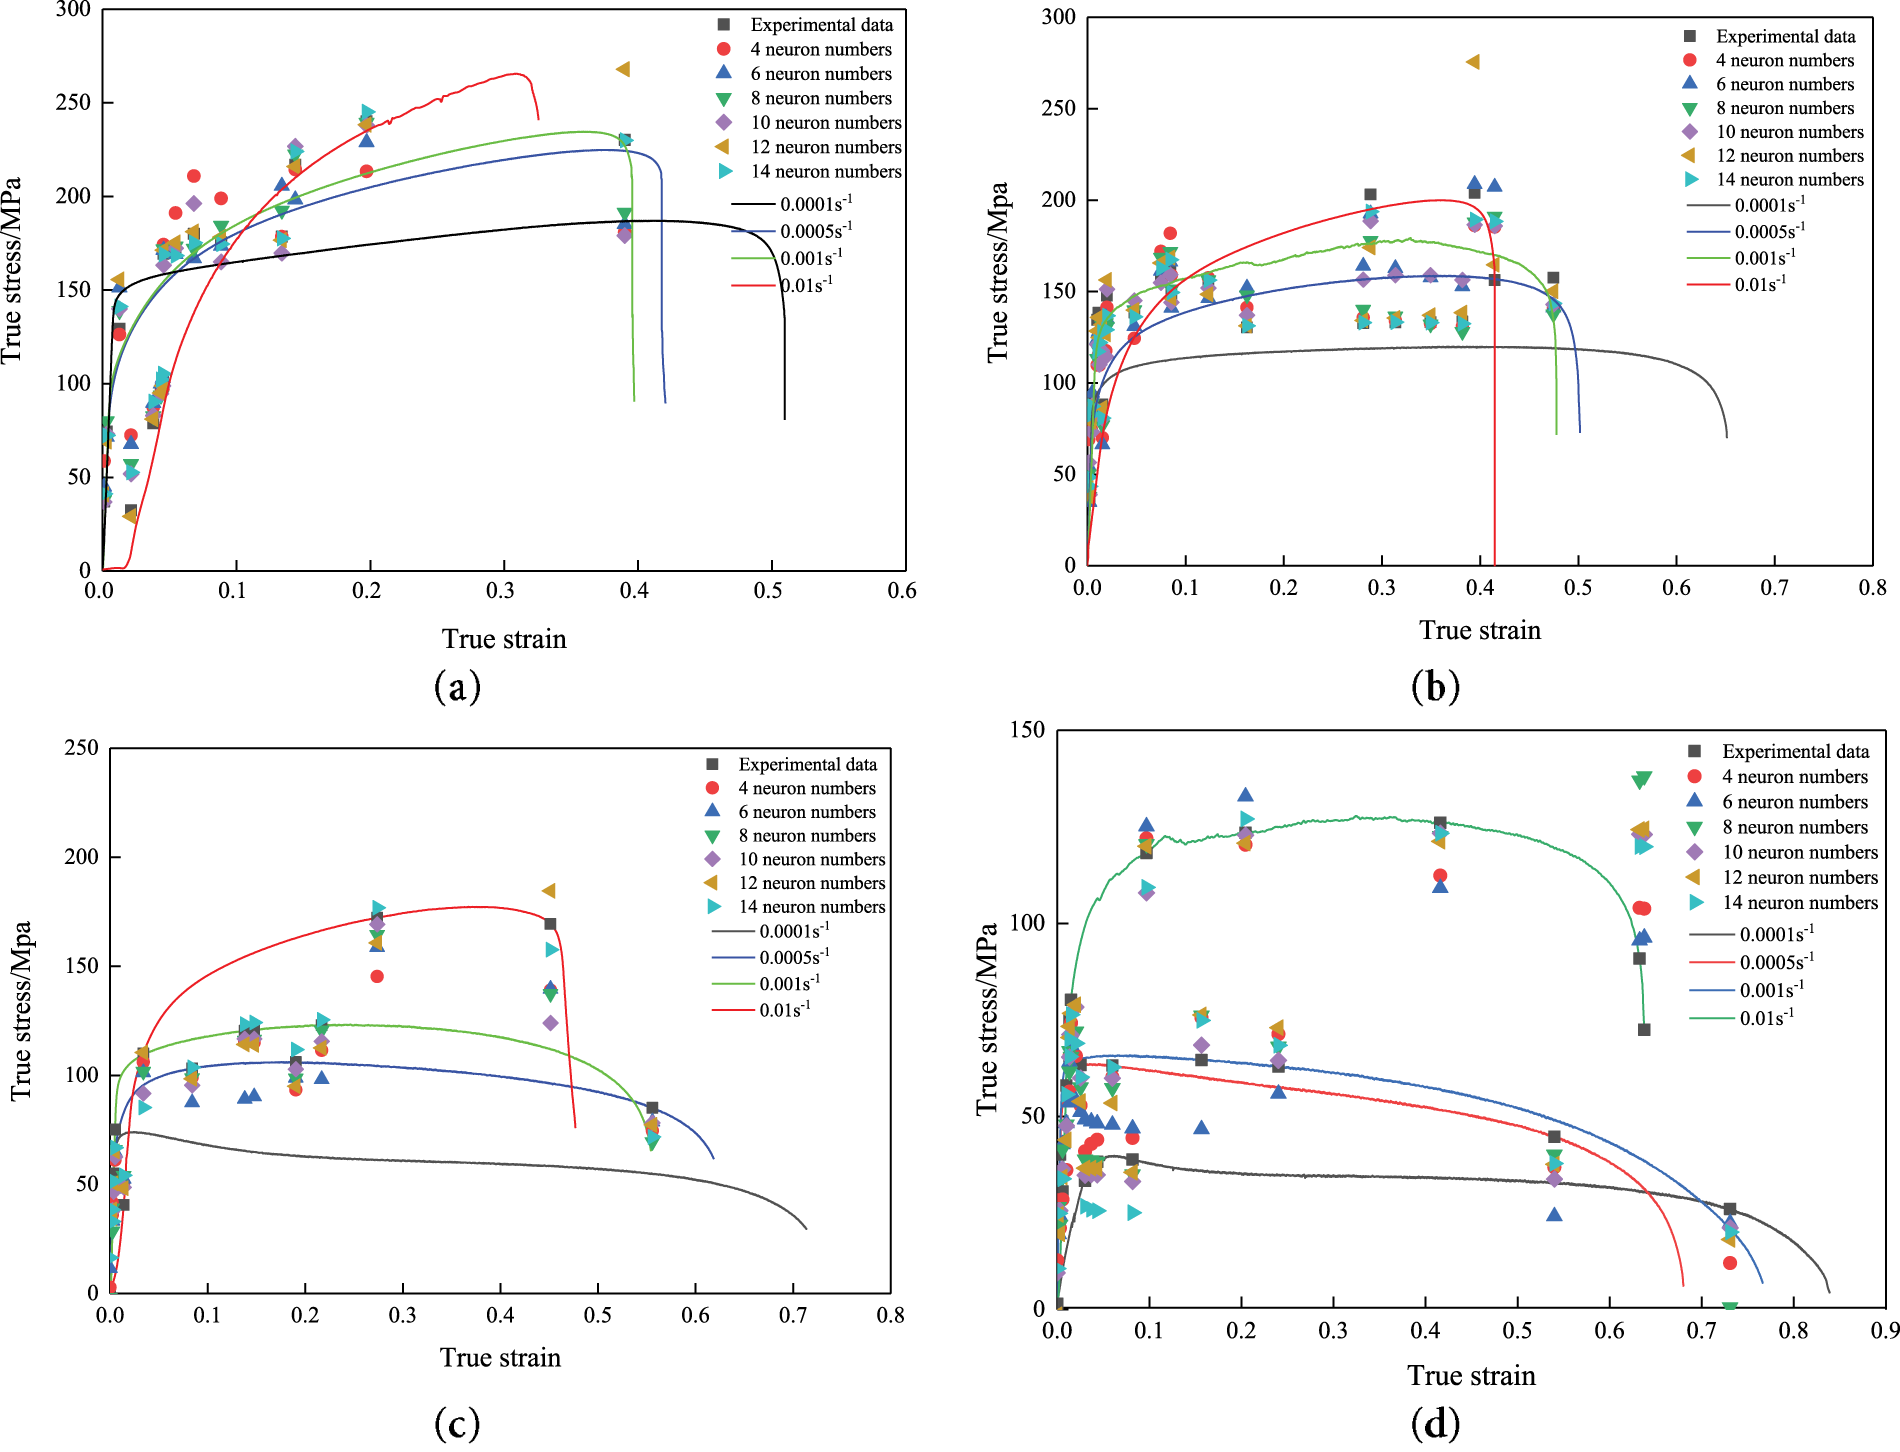
Figure 12: Prediction results and experimental results of ACO-BP neural network model under different deformation conditions: (a): 150°C; (b): 200°C; (c): 250°C; (d): 300°C
By comparing the experimental values (curves) depicted in Fig. 12 with the predicted values (scatter points) generated by the ACO-BP model, it becomes apparent that when utilizing hidden layer neurons numbering either 10, 12, or 14, the prediction accuracy of the ACO-BP model regarding true stress in 5754 aluminum alloy significantly surpasses that achieved with other neuron configurations. The prediction performance of the ACO-BP model is optimal when the hidden layer neurons are 14. By comparing Figs. 8 and 12, it can be seen that the prediction accuracy of the ACO-BP model is higher than that of the BP model.
The mean square error curve and sample fitting curve for the ACO-BP neural network model presented in Figs. 10 and 11 demonstrate that this model has undergone thorough training; consequently, a well-trained neural network exhibits strong predictive performance for input samples and outperforms the BP neural network. By optimizing and adjusting the initial weights and thresholds of the BP neural network model through ant colony algorithm, the stability and generalization performance of the model can be significantly improved, avoiding overfitting caused by too many iterations. To further verify the predictive performance of the BP and ACO-BP neural networks on the flow stress of 5754 aluminum alloy, the output stress values of all hidden layer neural network model test samples were compared with the true stress, as illustrated in Fig. 13.
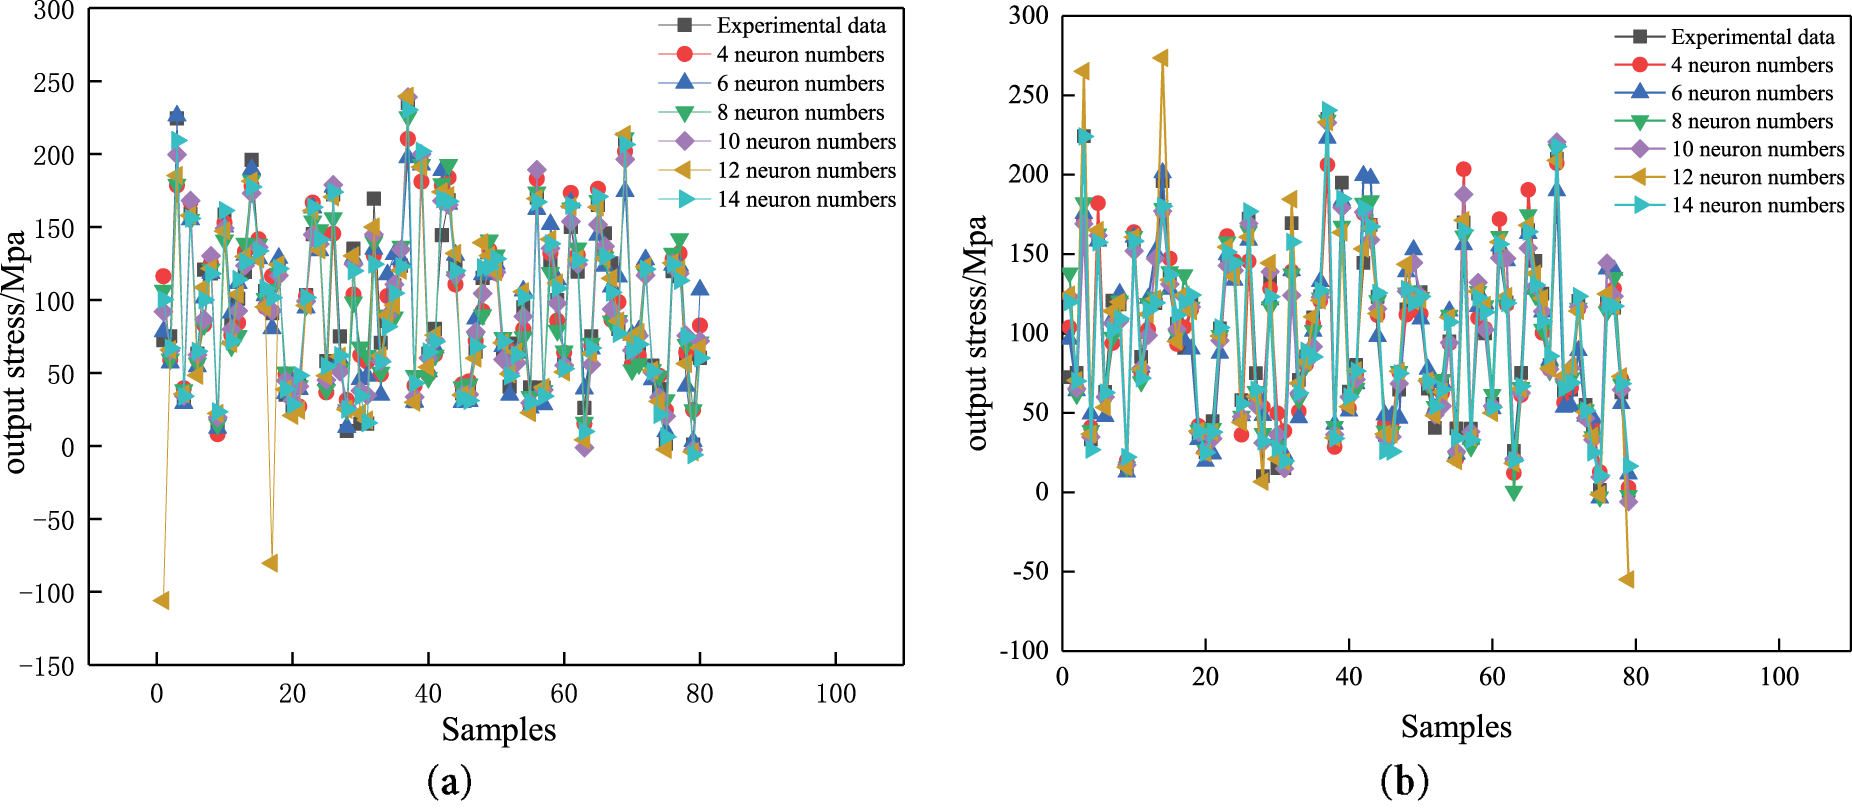
Figure 13: Test results of neural network models: (a): BP; (b): ACO-BP
It can be seen from Fig. 13 that the BP and ACO-BP neural networks were used to predict the flow stress of 5754 alloys. The output data of the two neural network models are basically consistent with the experimental data, indicating that both BP and ACO-BP neural networks can accurately predict the rheological behavior of the alloy during high-temperature tensile testing. However, there are still errors when using neural network models to predict the test sample set. The size of the prediction error of the neural network model indicates the level of prediction accuracy of the model used. Therefore, the prediction errors of BP and ACO-BP neural networks were obtained by error analysis, as illustrated in Fig. 14.

Figure 14: The prediction error of neural network models: (a): BP and (b): ACO-BP
From Fig. 14, it is evident that the prediction errors of the BP neural network model for the flow stress of 5754 aluminum alloy range from −50 to 175, with a significant proportion of samples exhibiting substantial errors. In contrast, the prediction error of the ACO-BP neural network model for this alloy’s flow stress falls within a narrower range of −60 to 80, indicating that there are relatively few samples with large errors. To further investigate the fluctuation of prediction errors of two neural network models for the flow stress of 5754 aluminum alloy, error frequency histograms and their fitting curves were plotted based on the prediction errors of BP and ACO-BP neural network models, as illustrated in Fig. 15.

Figure 15: Error frequency distribution of neural network models: (a): BP; (b): ACO-BP
It can be seen from Fig. 15 that the prediction error of the BP neural network for 5754 aluminum alloy test samples under different hidden layer neurons is concentrated between −20 and 20, with some errors being poor. However, the error of the ACO-BP neural network model under different hidden layer neurons is concentrated between −10 and 10, and some absolute value errors are between 40 and 60. This phenomenon indicates that the prediction error of the ACO-BP network is smaller and more controllable than that of the unoptimized BP network.
To compare the deviation between the predicted flow stress of 5754 aluminum alloy using BP and ACO-BP neural network models and the actual experimental stress as a whole, the correlation coefficient R2 (Formula (5)), RMSE (Formula (6)), and MAE (Formula (7)), and Confidence Interval (CI) (Formula (8)) were used to measure the accuracy of the relative experimental results of the two prediction models under different numbers of hidden layer neurons, as illustrated in Fig. 16.

Figure 16: Correlation between the experimental data and the predicted data of the neural network models: (a): BP (b): ACO-BP
Among them, E is the experimental value; P is the predicted value of the constitutive model;
Among them, Ei is the experimental value; Pi is the predicted value of the constitutive model; n is the Number of test samples.
Among them
According to Fig. 16, the correlation coefficients R2, RMSE, and MAE of the BP neural network model and the ant colony algorithm optimized BP neural network model are 0.8816, 18.92, 12.2 and 0.92, 15.4, 10.92, respectively. And the confidence intervals for the two neural network models are [−99, 89, 90, 100], respectively. From this, we find that the ACO-BP-ANN model has a good correlation between stress prediction and experimental results. Compared with reference 13, this study also found that the training accuracy of BP neural network fluctuates randomly according to the number of training times, and the optimized BP neural network has more efficient and accurate prediction ability. The ACO-BP-ANN model demonstrates superior accuracy and reliability in calculating the flow stress of 5754 aluminum alloy under various deformation conditions.
The high-temperature rheological properties of 5754 aluminum alloy were investigated through hot tensile tests conducted at strain rates ranging from 0.0001 to 0.001 s−1 and deformation temperatures between 150°C and 300°C. The following conclusions can be drawn:
(1) Both deformation temperature and strain rate significantly influence the flow stress of 5754 aluminum alloy. At a constant deformation temperature, an increase in strain rate results in higher flow stress, while uniform elongation decreases with increasing strain rate. Notably, when the deformation temperature reaches 300°C and the strain rate is below 0.01 s−1, significant dynamic recovery softening and dynamic recrystallization occur during hot tensile deformation of the alloy.
(2) Utilizing the true stress-strain curve for the 5754 aluminum alloy, this study established constitutive relationship models based on both BP neural networks and ACO algorithm-optimized BP neural networks under varying deformation conditions. By comparing predicted values from these neural network models with experimental results, it was demonstrated that both BP and ACO-BP neural network models effectively capture the high-temperature flow behavior of the 5754 aluminum alloy. However, the BP neural network model optimized by the ant colony algorithm had better prediction accuracy, reliability, and generalization ability than the BP neural network model, with correlation coefficients (R2), RMSE, and MAE of 0.8816, 18.92, 12.2, and 0.92, 15.4, 10.92, respectively. In addition, the prediction error of a very small number of sample data in the ACO-BP neural network model is relatively large, which can be solved by increasing the training sample size and further optimizing the ACO algorithm.
Acknowledgement: Not applicable.
Funding Statement: This research was funded by the Talent Introduction Project of Anhui Science and Technology University (RCYJ202105); Design and Key Technology Research of Multi Parameter Intelligent Control Instrument Junction Box (tzy202218); Natural Science Research Project of Higher Education Institutions in Anhui Province (2024AH050296); Research and Development of Fermentation Feed Drying Automatic Line (881314); Anhui Provincial Key Laboratory of Functional Agriculture and Functional Food, Anhui Science and Technology University (iFAST-2024-6); Key Technologies and Applications of Impinging Stream Based Plant Protection Hedge Spray System (2024AH050318).
Author Contributions: Writing—original draft preparation, conceptualization, Tengjiao Hong; formal analysis and data curation, Dong Huang; software, writing—review & editing, and funding acquisition, Fengjuan Ding; visualization and project administration, Lu Suo; visualization and methodology project administration, Fulong Dong. All authors reviewed the results and approved the final version of the manuscript.
Availability of Data and Materials: All data, models, and code generated or used during the study appear in the submitted article.
Ethics Approval: Not applicable.
Conflicts of Interest: The authors declare no conflicts of interest to report regarding the present study.
References
1. Wen W, Su Y, Tang YE, Zhang X, Hu Y, Ben Y, et al. Evaluating carbon emissions reduction compliance based on ‘dual control’ policies of energy consumption and carbon emissions in China. J Environ Manage. 2024;367:121990. doi:10.1016/j.jenvman.2024.121990. [Google Scholar] [PubMed] [CrossRef]
2. Li W. Application and lightweight research of new aluminum alloy materials in automotive components. Acad J Mater Chem. 2025;6(1):91–9. [Google Scholar]
3. Kareem SA, Anaele JU, Aikulola EO, Olanrewaju OF, Omiyale BO, Falana SO, et al. Hot deformation behavior of aluminum alloys: a comprehensive review on deformation mechanism, processing maps analysis and constitutive model description. Mater Today Commun. 2025;44:112004. doi:10.1016/j.mtcomm.2025.112004. [Google Scholar] [CrossRef]
4. Huang C, Deng J, Wang S, Liu L. A physical-based constitutive model to describe the strain-hardening and dynamic recovery behaviors of 5754 aluminum alloy. Mater Sci Eng A. 2017;699:106–13. doi:10.1016/j.msea.2017.04.086. [Google Scholar] [CrossRef]
5. Hong L, Wu X, Xiong X, Gao K, Wen S, Wei W, et al. Study of dynamic recrystallization behavior of Al-Zn-Mg-Cu-Er-Zr alloy during isothermal compression. J Mater Res Technol. 2025;34:1399–409. doi:10.1016/j.jmrt.2024.12.119. [Google Scholar] [CrossRef]
6. Kawalek A, Bajor T, Sawicki S, Krakowiak M, Jurczak H. The effect of deformation conditions on the rheological properties of the Al 5754 alloy. Metalurgija. 2020;59(1):43–6. [Google Scholar]
7. Huang C, Liu L. Application of the constitutive model in finite element simulation: predicting the flow behavior for 5754 aluminum alloy during hot working. Metals. 2017;7(9):331. doi:10.3390/met7090331. [Google Scholar] [CrossRef]
8. Lv Y, Zhang H, Hao Q, Yu W, Zhang T, Wang Y. Improved constitutive model and processing map of Al-Cu-Mn-Mg alloy based on backpropagation artificial neural network. Mater Today Commun. 2025;42:111275. doi:10.1016/j.mtcomm.2024.111275. [Google Scholar] [CrossRef]
9. Zhang S, Zhang H, Liu X, Wang S, Wang C, Zhou G, et al. Thermal deformation behavior investigation of Ti-10V-5Al-2.5fe-0.1B titanium alloy based on phenomenological constitutive models and a machine learning method. J Mater Res Technol. 2024;29:589–608. doi:10.1016/j.jmrt.2024.01.120. [Google Scholar] [CrossRef]
10. Liu XJ, Ma XF, Li C, Qin J, Chen P. Construction of aluminum alloy constitutive model based on BP neural network and the study of non-isothermal hydroforming. Int J Adv Manuf Technol. 2022;120(11–12):8259–74. doi:10.1007/s00170-022-09079-2. [Google Scholar] [CrossRef]
11. Jing LX, Feng MX, Chao L, Jin Q, Peng C. Dynamic behavior and modified artificial neural network model for predicting flow stress during hot deformation of alloy 925. Mater Today Commun. 2020;25:101329. doi:10.1016/j.mtcomm.2020.101329. [Google Scholar] [CrossRef]
12. Huang C, Jia X, Zhang Z. A modified back propagation artificial neural network model based on genetic algorithm to predict the flow behavior of 5754 aluminum alloy. Materials. 2018;11(5):855. doi:10.3390/ma11050855. [Google Scholar] [PubMed] [CrossRef]
13. Abdelhakim D, Fouzi H, Constantin AD, Ying S. Machine learning prediction of aluminum alloy stress-strain curves at variable temperatures with failure analysis. J Fail Anal Prev. 2023;24(1):229–44. doi:10.1007/s11668-023-01833-2. [Google Scholar] [CrossRef]
14. Tasdemir B, Pellegrino A, Su X, Tagarielli VL. Learning the non-proportional multiaxial elastic-plastic response of an aluminium alloy with neural networks. Mater Des. 2025;253:113956. doi:10.1016/j.matdes.2025.113956. [Google Scholar] [CrossRef]
15. Bhat N, Barnard AS, Birbilis N. Improving the prediction of mechanical properties of aluminium alloy using data-driven class-based regression. Comput Mater Sci. 2023;228:112270. doi:10.1016/j.commatsci.2023.112270. [Google Scholar] [CrossRef]
16. Hu L, Banovic S, Foecke T, Iadicola M, Rollett A. Constitutive relations for plastic deformation in AA5754 sheet; 2010 [cited 2025 Sep 8]. Available from: https://www.nist.gov/system/files/documents/lightweighting/HBFIR2009.pdf. [Google Scholar]
17. Wu B, Li H, Zhou S, Zhang D, Wang Y, Cai Y. Influence of pre-strain and deformation temperature on 7A75 aluminum alloy for automotive structural parts. Mater Today Commun. 2025;45:112285. doi:10.1016/j.mtcomm.2025.112285. [Google Scholar] [CrossRef]
18. Gai Y, Zhang R, Zhou Z, Lv S, Cui C, Xie X, et al. Effect of C content on microstructure and hot deformation behavior of a Ni-based superalloy. J Alloys Compd. 2023;965:171453. doi:10.1016/j.jallcom.2023.171453. [Google Scholar] [CrossRef]
19. Li X, Fan X, Yang Q, Yang M, Zhang F, Zhang Z. Rheological behavior and microstructure of 2195 aluminum lithium alloy under plane strain compression. Chin J Nonferrous Met. 2018;28(10):1980–90. (In Chinese). [Google Scholar]
20. Dai Q, Deng Y, Tang J, Wang Y. Deformation characteristics and strain compensated constitutive equation for AA5083 aluminum alloy under hot compression. Trans Nonferrous Met Soc China. 2019;29(11):2252–61. doi:10.1016/s1003-6326(19)65131-9. [Google Scholar] [CrossRef]
Cite This Article
 Copyright © 2025 The Author(s). Published by Tech Science Press.
This work is licensed under a Creative Commons Attribution 4.0 International License , which permits unrestricted use, distribution, and reproduction in any medium, provided the original work is properly cited.
 Downloads
 Citation Tools